

Translate this page into:
Mass transfer simulation on remazol brilliant blue R dye adsorption by optimized teak wood Based activated carbon
⁎Corresponding author. chazmier@usm.my (Mohd Azmier Ahmad)
-
Received: ,
Accepted: ,
This article was originally published by Elsevier and was migrated to Scientific Scholar after the change of Publisher.
Abstract
The reactive dye of remazol brilliant blue R (RBBR) can be toxic to aquatic ecosystems and humans. Hence, the objectives of this study were to optimize teak wood-based activated carbon (TWAC) via response surface methodology (RSM) to adsorb RBBR and to simulate the mass transfer process using Polymath software. The optimum conditions in preparing TWAC were discovered to be 470 Watt of radiation power, 6.40 min of radiation time, and 1.48 g/g of impregnation ratio (IR), resulting in RBBR uptakes of 83.97 mg/g and TWAC’s yield of 30.60%. Isotherm study revealed that the adsorption of RBBR onto TWAC was best described by the Langmuir model with maximum monolayer adsorption capacity, Qm of 337.55 mg/g. The kinetic data were best described by the Polymath Mass Transfer (PMT) model where the rate constant, kPTM was found to increase from 4.84 to 5.22 h−1 when RBBR initial concentration increased from 25 to 300 mg/L. The PMT model predicted the adsorption surface area, am to be 940.79 m2/g, which is highly accurate with the actual mesopores surface area of 983.25 m2/g. The RBBR molecules formed an attraction force with TWAC’s surface functional groups through hydrogen bond (cyclohexane), dipole–dipole force (polysulfides and terminal/medial alkyne), and ion–dipole force (phenol and hydroxy group). Thermodynamic parameters of ΔH°, ΔS°, ΔG°, and Ea were computed to be −3.55 kJ/mol (exothermic), 0.07 kJ/mol.K, −24.37 kJ/mol (spontaneous) and 21.23 kJ/mol (physisorption), respectively.
Keywords
Equilibrium
Isotherm
Kinetic
Thermodynamic
Response surface methodology
Polymath

1 Introduction
Shortage of drinking water resources and their pollution have become currently two major environmental issues and have raised significant concerns (Alipour et al., 2021, Roshan et al., 2021). One of the most popular contaminants in water bodies is synthetic dyes. The demand for colours has led to the increasing production of synthetic dyes to be applied mainly in the textile industry, and other industries such as papers, magazines, toys, foods, cosmetics, and so on. The textile industry alone utilizes 10,000 tons of synthetic dyes per year (Chandanshive et al., 2020), mostly the dyes that belong in the groups of azo, acid, basic, direct, mordant, and reactive (Al-Tohamy et al., 2022). During the dyeing process, a portion of the dyes binds loosely to the fabric, causing them to be discharged together with the wastewater as the effluent into the aquatic environments. These dyes can exist in the water bodies like rivers, lakes, and ponds for a significant period since they are unable to degrade naturally due to their stable chemical compositions. An example of such dye is remazol brilliant blue R (RBBR), an anthraquinone-based reactive dye that dissolves in water to produce negative ions. These negative ions are attracted to the partial positive region of water molecules, making them more challenging to be separated. This dye is highly consumed in the textile industry since it requires low energy consumption, chemically stable, and simple application technology (Jawad et al., 2022). The existence of RBBR in the environment can interrupt the sunlight penetration into the bottom of the water bodies, thus de-promoting the growth of aquatic plants, reducing the dissolved oxygen, and decreasing the population of aquatic animals. Besides that, its aromatic structure has been linked with direct toxicity effects including carcinogenicity and mutagenicity (Berradi et al., 2019, Elwakeel et al., 2021).
To date, many methods are available to treat dyes wastewater which can be categorized into physical (adsorption and membrane processes), chemical (oxidation, ozonation, electrocoagulation, solvent extraction and photocatalyst (Yousefi et al., 2021, Mahdi et al., 2022)), and biological processes utilizing algae, fungi, and bacteria species (Raninga et al., 2022). Among them, the usage of activated carbon (AC) as an adsorbent in an adsorption process was proven to be effective in removing a variety of contaminants ranging from synthetic dyes (Ramutshatsha-Makhwedzha et al., 2022, Ahmad et al., 2021, Ahmad et al., 2017), heavy metals (Yusop et al., 2022b), pesticides (Aziz et al., 2021), antibiotics (Vinayagam et al., 2022) and many others. Regrettably, the best precursors to produce AC which are bituminous coal, lignite, and petroleum coke are non-renewable and pricy (Yusop et al., 2023). Moreover, the coal mining process itself is extremely air, water and land-polluting. As the consequence, researchers nowadays are more fascinated to produce AC from biomass waste such as green coffee (Bozaci and Acarali, 2023), pepper stem (Dolas, 2023), coconut shell (Yusop et al., 2022a), hazelnut shell, rice husk and corn stalk (Yurtay and Kiliç, 2023), and much more. Besides cost reduction, the conversion of these biomass wastes into AC can solve their disposal problem since the majority of these wastes have no other usages and are often discarded into the landfill or incinerated.
The typical steps involved in the production of AC are carbonization and activation. The carbonization step is a process converting the precursor into char through pyrolysis process under inert gas at temperature between 300 and 500 °C. Then, the activation step converts the char into AC through physical activation (Alazmi, 2022), chemical activation (Kumar et al., 2022) or physicochemical activation (Yusop et al., 2021). A higher activation temperature (700–900 °C) is usually applied for physical and physicochemical activations whilst chemical activation adopts lower activation temperature (400–600 °C). The source of heat during the activation step can be obtained from conventional furnace or from microwave. By employing microwave heating technique, the activation time can be reduced significantly, up to 20 times faster, without compromising the quality of the AC produced. During microwave heating process, the sample absorb the microwave energy and causing the polar compounds in the sample to vibrate at tremendously fast speed, hence, generating vast amount of heat to activate the sample.
In this study, teak wood was chosen as the precursor to be converted into teak wood-based AC (TWAC), via physicochemical activation (potassium hydroxide, KOH chemical treatment, and carbon dioxide, CO2 gasification) and heated with microwave heating technique. A mathematical tool known as response surface methodology (RSM) was utilized to find the optimum preparation conditions of TWAC. Teak wood which belongs to the teak tree or scientifically known as Tectona grandis was chosen since this tree is one of the most durable timber due to its natural strength (Sneha and Ghosh, 2022). Precursors with good mechanical strength can withstand extreme conditions during the activation process, thus producing AC with a better yield. The RSM is known to offer many advantages including (i) the minimum number of experiments, (ii) providing the effect of single factor and their interactions, (iii) verification of data through analysis of variance (ANOVA), (iv) understanding the effects of variables through 3-dimensional plots and (v) generation of mathematical expressions that relate the responses and variables. Besides dyes, RSM is also utilized by other researchers to study the optimization conditions for the removal of different types of contaminants such as carbon dioxide, CO2 (Rasoulzadeh et al., 2021a), bisphenol A (Zafar et al., 2022), cyanide (Rasoulzadeh et al., 2021b) and others. In a study conducted by Firdaus et al. (2022), TWAC was produced at different optimum conditions to adsorb methylene blue (MB) dye. Since MB dye comes from a different class of dye (cationic basic dye), therefore it is worth it to explore the potential of TWAC in adsorbing RBBR (anionic reactive dye). The resulting TWAC can be used to adsorb RBBR and other anionic dyes from wastewater coming from the textile industry. Besides that, this study offers a novelty in terms of the development of the Polymath mass transfer (PMT) model to fit the kinetic data of the RBBR-TWAC adsorption system. Unlike the classic kinetic models of pseudo-first order (PFO) and pseudo-second order (PSO), the PMT model is very beneficial to researchers since it can predict the surface area that involves in the adsorption process.
2 Materials and methods
2.1 Chemicals
The adsorbate of RBBR dye (C22H16N2Na2O11S3) in a powder form was purchased from Sigma-Aldrich (M) Sdn. Bhd., Malaysia. The activating agent of KOH powder was acquired from Riedel-el Haen, Germany. The activating gas of CO2 and inert gas of N2 were bought from MOX Gases Berhad, Malaysia.
2.2 Preparation of TWAC
Teak wood chips were chosen as the precursor in this study. This precursor was obtained from a furniture manufacturing factory situated in Sungai Petani, Kedah, Malaysia. The original size of this precursor was between 5 and 10 mm. Firstly, the precursor was washed with tap water. Secondly, the wet precursor was kept in an oven for 72 h for the drying process to take place. Thirdly, the dried precursor was loaded inside a vertical furnace to be carbonized at the temperature of 550 °C for 1 h, with N2 gas purging through the sample. The product from the carbonization process is called char. Then, the char was subjected to chemical activation by impregnating it with KOH at various impregnation ratios (IR) between 0 and 2.51 g/g. The formula for IR is as follows:
2.3 Process variables and experimental design
This study focussed on producing optimized TWAC in terms of RBBR removal and yield. Therefore, the data obtained experimentally was investigated by using a software called Design Expert Software (Model: STAT-EASE Inc. Minneapolis, USA, version 12). The standard RSM design of Central Composite Design (CCD) was utilized. The selected variables were radiation power, radiation time, and IR. The ranges studied for these variables were 144 W(−α), 264 W(−1), 440 W(0), 616 W(+1), and 700 W (+α) for radiation power, 2.64 min (−α), 4.00 min (−1), 6.00 min (0), 8.00 min (+1) and 9.36 min (+α) for radiation time and 0.00 g/g (−α), 0.50 g/g (−1), 1.25 g/g (0), 2.00 g/g (+1) and 2.51 g/g (+α) for IR. Two responses were chosen namely RBBR uptakes (mg/g) and TWAC’s yield (%).
2.4 Batch adsorption studies
The batch adsorption studies comprised of equilibrium study and an isotherm study. In the equilibrium study, six different initial concentration of RBBR solution (25–300 mg/L) was prepared. 200 mL of each one of these solutions was kept inside Erlenmeyer flasks. Then, these flasks were assembled inside a water bath shaker. After that, an accurately weighted 0.2 g of optimized TWAC was inserted into every flask. The temperature controller was set to 30 °C and the shaking controller was set to 80 rpm. At pre-determined time intervals, a small sample of these solutions was withdrawn with a syringe to detect their concentration, until an equilibrium state was achieved. To determine the concentration of RBBR solution, a UV–Vis spectrophotometry (Model: Agilent Cary 60, USA) was used and the maximum wavelength, λmax was set to be 592 nm. The RBBR uptakes and RBBR percentage removal by TWAC were determined by using the following equations, respectively:
Langmuir (Langmuir, 1918):
Freundlich (Freundlich, 1906):
Temkin (Tempkin and Pyzhev, 1940):
Koble-Corrigan (KC) (Koble and Corrigan, 1952):
2.5 Kinetic and mass transfer study
The kinetic data were obtained by determining the concentration of RBBR solution within the time frame between 0 and 180 min. Similar conditions as in batch adsorption studies were used such as six different initial concentrations of RBBR solutions (25–300 mg/L), TWAC’s dosage of 0.20 g per 200 mL of RBBR solution, solution temperature of 30 °C and water bath shaking speed of 80 rpm. Two classic kinetic models of PFO and PSO were employed, and their equations are as follows, respectively:
Pseudo-first order (PFO) (Lagergren, 1898):
Pseudo-second order (PSO) (Ho and McKay, 1998):
Eq. (14) was integrated with initial conditions of X(t = 0) = X0 and C(t = 0) = t0. The resulting equation is shown as follows:
By using the adsorption data obtained experimentally, the parameters of kPMT, am and km were solved by using Polymath® version 6.2 (CACHE Corporation, USA). To verify the slowest step in the adsorption process, the kinetic data were fitted on the Boyd plot (Islam et al., 2017) and its formula is given as follows:
2.6 Thermodynamic study
The interaction between adsorbate-adsorbent can be more intense or weaker upon increasing the solution temperature. Four thermodynamic parameters in terms of change of enthalpy, ΔH° (kJ/mol), change of entropy, ΔS° (kJ/mol.K), Gibbs free energy, ΔG° (kJ/mol), and Arrhenius activation energy, Ea (kJ/mol) were determined. The parameters of ΔH° and ΔS° can be computed from Van’t Hoff equation as follows:
where [adsorbate]° denotes the standard concentration which can be assumed as 1 mol/L at standard state, ϒ denotes the activity coefficient of adsorbate (dimensionless) whilst KL denotes the adsorption constant obtained from the Langmuir model (L/mg). The other two thermodynamic parameters of ΔG° and Ea can be calculated by using the following equations, respectively:
3 Results and discussions
3.1 Optimization studies
3.1.1 Regression models development
Table 1 provides the full matrix of experimental design for the preparation of optimized TWAC. For both responses studied, the software suggested quadratic type of empirical models, which are given as follows:
Run
TWAC’s preparation variables
Responses
Radiation power, X1 (watt)
Radiation time, X2 (min)
IR, X3
RBBR removal, Y1 (%)
TWAC’s yield, Y2 (%)
1
440 (0)
6 (0)
1.25 (0)
76.98
31.32
2
144 (−α)
6 (0)
1.25 (0)
67.60
30.58
3
440 (0)
6 (0)
2.51 (+α)
87.66
19.96
4
440 (0)
9.36 (+α)
1.25 (0)
93.32
20.45
5
440 (0)
6 (0)
1.25 (0)
78.68
31.86
6
440 (0)
6 (0)
1.25 (0)
80.57
32.27
7
616 (+1)
4 (−1)
2 (+1)
86.56
20.03
8
440 (0)
6 (0)
1.25 (0)
81.27
32.76
9
264 (−1)
8 (+1)
0.5 (−1)
70.11
26.07
10
440 (0)
6 (0)
1.25 (0)
82.77
33.19
11
616 (+1)
8 (+1)
0.5 (−1)
83.74
20.80
12
264 (−1)
4 (−1)
2 (+1)
76.65
29.17
13
616 (+1)
8 (+1)
2 (+1)
95.33
15.99
14
440 (0)
2.64 (−α)
1.25 (0)
80.67
29.55
15
264 (−1)
8 (+1)
2 (+1)
81.34
23.64
16
700 (+α)
6 (0)
1.25 (0)
85.41
22.11
17
264 (−1)
4 (−1)
0.5 (−1)
64.87
28.76
18
440 (0)
6 (0)
0 (−α)
68.10
25.22
19
616 (+1)
4 (−1)
0.5 (−1)
77.44
21.51
20
440 (0)
6 (0)
1.25 (0)
83.22
33.65
RBBR removal (%), Y1
TWAC’s yield (%), Y2
Fig. 1 shows the regression plot of actual versus predicted data for both models developed. The significance of these models (Eqs. (22) and (23)) was proven by evaluating the values of R2, adj-R2, and standard deviation (SD) together with adequate precision (AP). The R2 and adj-R2 values were 0.9694 and 0.9419 for Eq. (22) and 0.9735 and 0.9496 for Eq. (23), respectively. Relatively high R2 values signify that the difference between actual and predicted data is small and unbiased. Unlike R2, the values of adj-R2 were calculated by neglecting the insignificant terms of the models. The deviation between actual and predicted data was confirmed to be small due to low SD of 0.91 and 0.84 for Eqs. (22) and (23), respectively. Both models developed were more than adequate to navigate the design space since their AP values were above 4.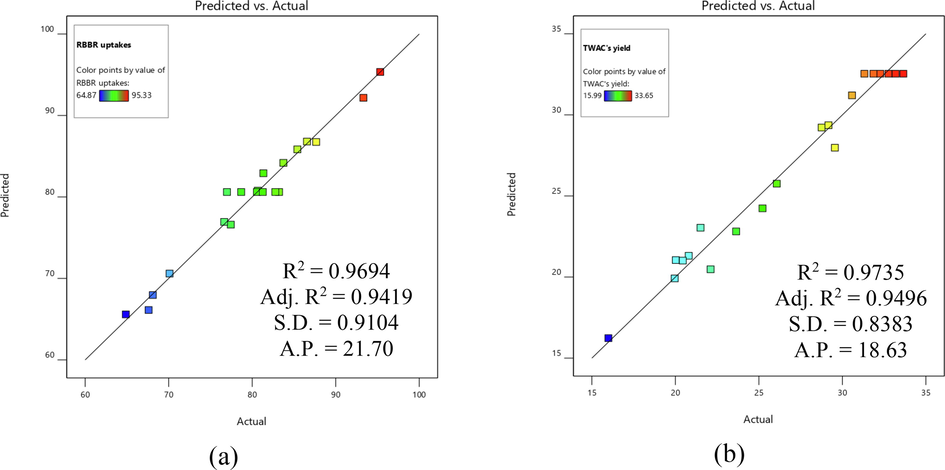
Regression plot of predicted versus actual for (a) RRBR uptakes and (b) TWAC’s yield.
3.1.2 Analysis of variance (ANOVA)
Analysis of variance (ANOVA) is beneficial in further verifying the models developed. Table 2 shows the results of ANOVA for RBBR uptakes and TWAC’s yield responses. Both of Y1 and Y2 models were significant due to Prob > F of <0.0001. Based on Prob > F values, the significant terms for Y1 and Y2 responses were X1, X2, X3, X12, X22 and X32. By evaluating the F value, the response of RBBR uptakes was significantly affected by the variables in the sequence of radiation power (124.73) > IR (114.55) > radiation time (41.68). On the other hand, the response of TWAC’s yield was significantly affected by the variables in the sequence of radiation power (90.73) > radiation time (38.21) > IR (13.54).
Response 1, Y1: RBBR uptakes by TWAC
Response 2, Y2: TWAC’s yield
Source
Sum of Squares
DF
Mean Square
F Value
Prob > F
Sum of Squares
DF
Mean Square
F Value
Prob > F
Model
1192.47
9
132.50
35.22
<0.0001
561.65
9
62.41
40.75
<0.0001
X1
469.25
1
469.25
124.73
<0.0001
138.93
1
138.93
90.73
<0.0001
X2
156.80
1
156.80
41.68
<0.0001
58.51
1
58.51
38.21
0.0001
X3
430.94
1
430.94
114.55
<0.0001
20.74
1
20.74
13.54
0.0042
X1X2
3.30
1
3.30
0.8778
0.3709
1.51
1
1.51
0.9828
0.3449
X1X3
0.6613
1
0.6613
0.1758
0.6839
2.28
1
2.28
1.49
0.2507
X2X3
0.4608
1
0.4608
0.1225
0.7336
4.76
1
4.76
3.11
0.1085
X12
38.58
1
38.58
10.26
0.0095
80.83
1
80.83
52.78
<0.0001
X22
61.94
1
61.94
16.46
0.0023
116.62
1
116.62
76.16
<0.0001
X32
19.64
1
19.64
5.22
0.0454
197.56
1
197.56
129.01
<0.0001
3.1.3 Three-dimensional (3D) response surface of TWAC
Different variables affect different responses in their unique way. These effects can be explained better by inspecting the three-dimensional (3D) response surface. Hence, Figs. 2 and 3 present the 3D surface plots for RBBR uptakes and TWAC’s yield responses, respectively. In Fig. 2(a), both radiation power and radiation time posed a positive effect on the RBBR uptakes. However, an increase in the radiation power (from 264 to 616 W) caused a more significant increment in RBBR uptakes as compared to the increment of radiation time (from 4 to 8 min). The highest point of RBBR uptakes occurred at the maximum level of radiation power of 616 W and radiation time of 8 min. Based on Fig. 2(b), both radiation power and IR posed a positive effect on RBBR uptakes with an almost similar intensity. The highest RBBR uptakes occurred at the highest radiation power of 616 W and the highest IR of 2.0 g/g. At higher radiation power, more microwave energy was absorbed by the sample which caused the sample to be heated at a higher temperature. As the result, the more volatile matter was evaporated from the samples, thus creating more pores. These pores provide more surface area for the adsorption process to occur. Increasing the radiation time prolonged this effect. At a higher IR value, K+ existed at a greater quantity, providing a more intense penetration process deep inside the skeleton of the sample, causing the formation of more pores.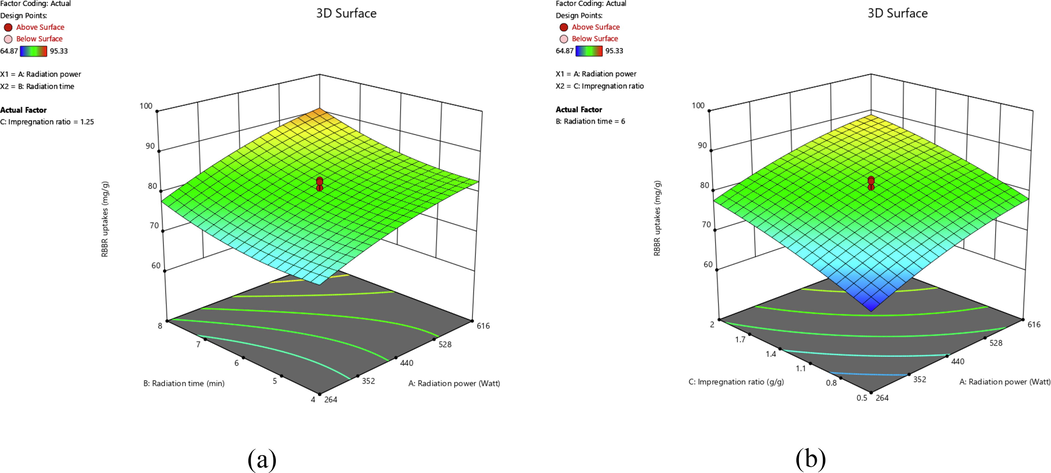
3D surface plots for RBBR uptakes response for (a) effect of radiation power and radiation time and (b) effect of radiation power and IR.
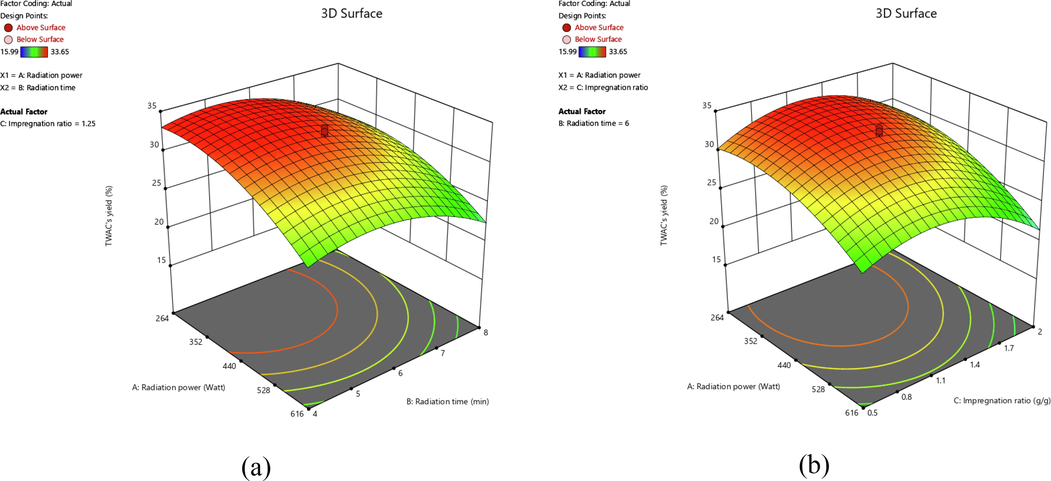
3D surface plots for TWAC’s yield response for (a) effect of radiation power and radiation time and (b) effect of radiation power and IR.
In Fig. 3(a), both radiation power and radiation time posed a negative effect on TWAC’s yield. It was found that an increment in radiation power (from 264 to 616 W) had caused the TWAC’s yield to reduce more significantly as compared to the increment in radiation time (from 4 to 8 min). Similarly, Fig. 3(b) showed that radiation power and IR posed a negative effect on TWAC’s yield in a manner that the changes in IR (from 0.5 to 2.0 g/g) caused a less significant impact as compared to the changes in radiation power (from 264 to 616 W). Increasing radiation power and radiation time caused the thermal cracking process of the sample to occur at a higher degree and longer, thus causing more components of the sample to be released from the sample. As a consequence, the yield of the sample dropped. By increasing the IR, the amount of K+ increased as well. The K+ penetrates more area of the sample’ skeleton, causing the sample to be more porous and lose its weight.
3.1.4 Optimization of TWAC’s preparation variables
To get the optimization conditions, the variables were set to be “in range” whilst the responses were set to be “maximum”. This caused the software to compute the optimum values of variables to be 470 W of radiation power, 6.40 min of radiation time, and 1.48 g/g of IR. The software predicted the responses of RBBR uptakes and TWAC’s yield to be 83.96 mg/g and 30.61%, respectively. These predicted values were found to be highly accurate with the actual values of 81.55 mg/g (error of 2.87%) and 30.00% (error of 1.99%) for RBBR uptakes and TWAC’s yield responses, respectively. A low error percentage validated that these models were significantly adequate to predict the responses. Since the experimental yield was found to be 30.00%, it can be concluded that 70.00% of the precursor’s original mass was successfully converted into gas products of CO, CO2, and H2 during carbonization and activation processes.
3.2 Characterization of TWAC
Table 3 presents the surface area and pore characteristics for precursor, char, and TWAC. After the carbonization and physicochemical activation processes had been executed, TWAC posed a BET surface area and mesopores surface area of 1522.74 m2/g and 983.25 m2/g, respectively. These values were higher as compared to the TWAC produced by Firdaus et al. (2022) to adsorb MB dye (TWAC-MB) which posed a BET surface area of 1345.25 m2/g and 878.63 m2/g respectively. The TWAC-MB posed lower values of surface area due to lower preparation conditions applied (366 W, 5.30 min, and 1.15 g/g for radiation power, radiation time, and IR, respectively). The higher surface area in TWAC translated into a higher total pore volume of 0.6581 cm3/g as compared to TWAC-MB with 0.6140 cm3/g. The average pore diameter of TWAC was found to be 2.97 nm, thus signifies mesopores type of pores. During the physicochemical activation process that comprised CO2 gasification, KOH treatment, and microwave heating, these chemical reactions took place as follows (Xu et al., 2019, Norouzi et al., 2018):
Sample
BET surface area (m2/g)
Mesopores surface area (m2/g)
Total pore volume (cm3/g)
Average pore diameter (nm)
Precursor
1.33
–
0.0001
2.53
Char
461.25
293.57
0.3880
2.64
TWAC
1522.74
983.25
0.6581
2.97
Based on the proximate analysis, teak wood was found to be posed fixed carbon of 31.22%, moisture of 11.25%, volatile matter of 55.52%, and ash of 2.01%. Relatively high fixed carbon percentage in teak wood as compared to other biomass wastes such as pomegranate peel of 15.34% (Ahmad et al., 2020) and wood chips of 20% (Pedicini et al., 2020) indicate that this precursor was rightly chosen to be converted into AC in the first place. The higher the fixed carbon percentage translates into the higher number of AC’s skeleton matrix formation, which directly contributes to the higher surface area. The treatment of KOH, CO2 gasification, and microwave heating were accomplished to remove the unnecessary components inside the sample. It was revealed that moisture and volatile matter components had dropped tremendously to 2.78% and 6.34% in TWAC, respectively. A high percentage removal of these components is desired because once they leave the samples, a pores network can be created. On contrary, the fixed carbon percentage rose dramatically to 88.90% whilst the balance of 1.98% was occupied by ash. A low percentage of ash is desired since ash does not pose any pores; thus, ash does not contribute to the adsorption process. The elemental analysis revealed that the elemental composition of TWAC was 84.22% of C, 2.55% of H, 0.03% of S, and 13.20% of N and O. The existence of S, N, and O indicate that various type of functional groups is presents on the TWAC’s surface.
The SEM images of precursor, char, and TWAC are given in Fig. 4(a)–(c), respectively. The surface of the precursor was observed to have no pores at all. On contrary, the surface of the char was observed to be homed by mesopores type of pores (yellow circles) and regions that have the potential for pores development (blue circles). These pores were formed due to heat treatment during the carbonization process. Last but not least, the surface of TWAC was observed to have more mesopores type of pores (yellow circles). Besides that, the undeveloped region of pores in char is now filled with micropores type of pores (blue circles) The combination of mesopores and micropores in TWAC was formed due to the effect of K+ ions that penetrate deep into the skeleton matrix of the sample, CO2 gasification that bombarded the existing pores network to widen their size and lastly, microwave energy that provides heat treatment to the sample.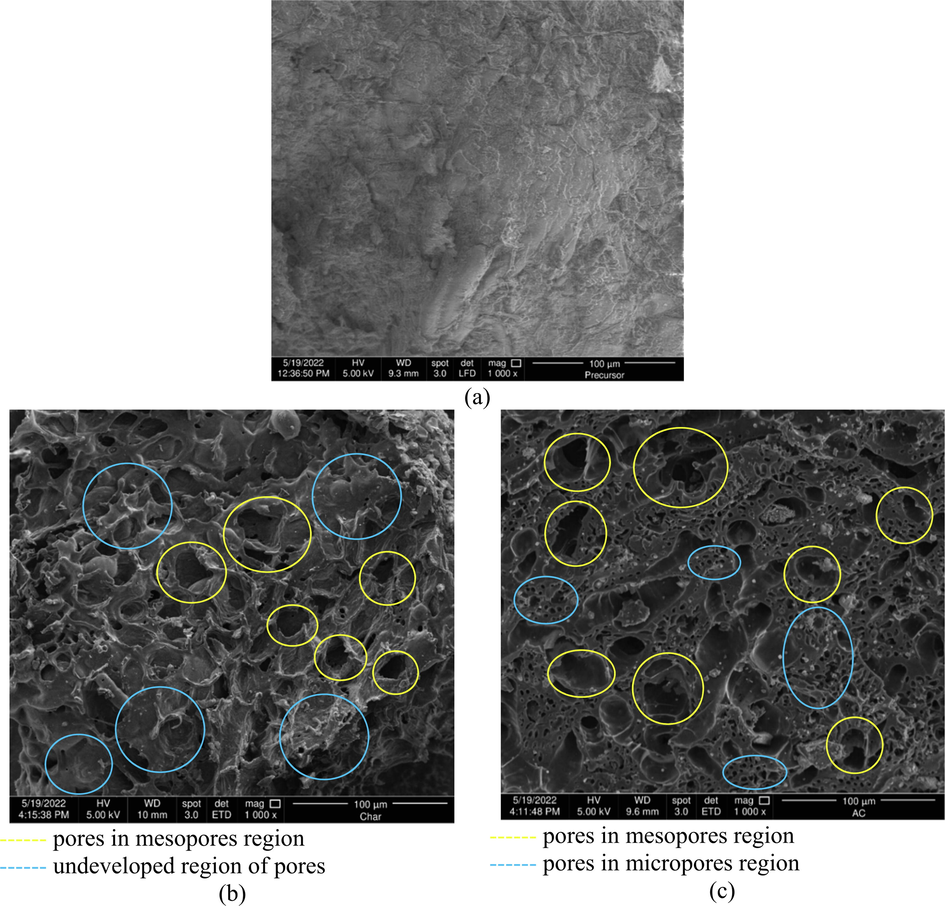
SEM images for (a) precursor, (b) char and (c) TWAC at magnification level of 1000×.
The surface functional groups of TWAC were verified in terms of FTIR spectrums, as shown in Fig. 5(a)–(c) for precursor (Firdaus et al., 2022), TWAC-MB (Firdaus et al., 2022) and TWAC-RBBR. As can be seen from these figures, TWAC-RBBR was observed to have similar peaks as TWAC-MB. However, the peaks of TWAC-RBBR are more intense since TWAC-RBBR was activated at a higher radiation power of 470 W whilst TWAC-MB was activated at lower radiation power of 366 W. That being said, the surface of TWAC-RBBR was filled with functional groups of polysulfides at 500 cm−1, cyclohexane ring vibration at 1000 cm−1, phenol, C—O stretch at 1215 cm−1, C≡C terminal alkyne at 2100 cm−1 and C≡C medial alkyne at 2193 cm−1 and nonbonded hydroxy group, OH at 3640 cm−1.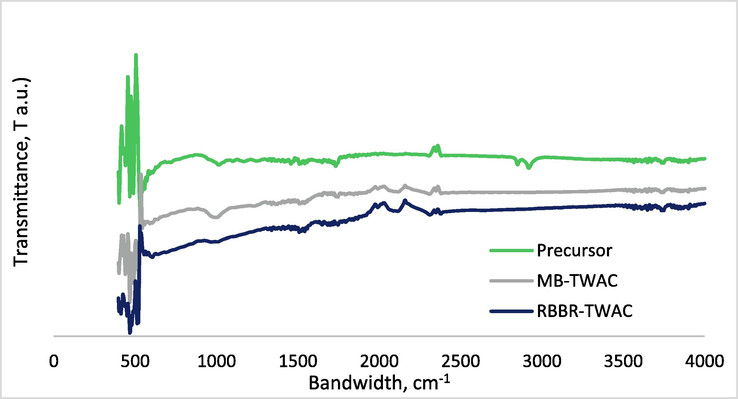
FTIR spectrum for (a) precursor (Firdaus et al., 2022), (b) MB-TWAC (Firdaus et al., 2022) and (c) RBBR-TWAC (this study).
Besides surface area, the functional groups that existed on the surface of the TWAC also contribute to the adsorption of RBBR dye through a different type of attraction mechanism. Hence, Fig. 6 presents the possible attraction mechanism between RBBR molecules and the TWAC’s functional groups. The H atom in cyclohexane has a partial positive charge and is attracted to the O and N atoms that have stronger electronegativity on RBBR molecules. This interaction is called a hydrogen bond. Another type of attraction mechanism that occurs is dipole–dipole attraction. This kind of attraction occurred between the partial positive S atom in polysulfide and the partial negative O atom in RBBR. Besides that, the partial negative C atom in the terminal and medial alkyne also formed a dipole–dipole attraction with the partial positive S atom in RBBR. Finally, the partial negative O atom in the phenol and hydroxy group formed an ion–dipole force with positively charged Na+ ions in RBBR.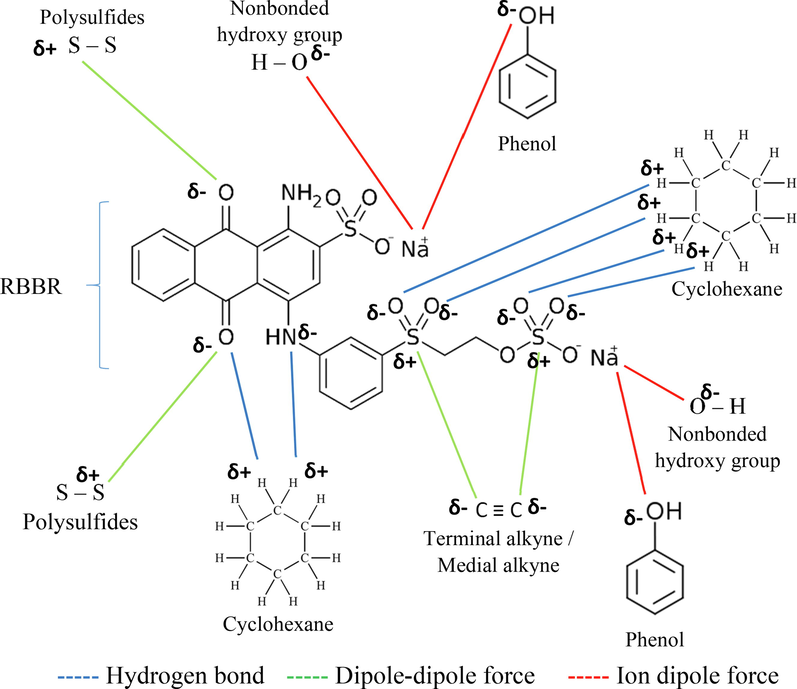
The possible attraction mechanism between RBBR dye and TWAC’s functional groups.
3.3 Adsorption equilibrium
3.3.1 Effect of contact time and initial RBBR dye concentration
Fig. 7(a) presents the adsorption uptakes plots versus contact for different RBBR initial concentrations whilst Fig. 7(b) presents the percentage removal plots versus contact time for different RBBR initial concentrations. From these figures, the RBBR uptakes increased from 23.14 to 222.66 mg/g whilst RBBR percentage removal dropped from 92.55 to 74.22%, when RBBR initial concentration was raised from 25 to 300 mg/L. The increasing value of RBBR uptakes was contributed by the increasing mass transfer driving force at higher RBBR initial concentration. On the opposite, the decreasing value of RBBR percentage removal was caused by the increasing number of RBBR molecules at higher RBBR initial concentration, thus causing the competition for the adsorption process to occur to be more intense. An equilibrium state was achieved at 3 h and 7 h for lower RBBR initial concentration (25–50 mg/L) and higher RBBR initial concentration (100–300 mg/L), respectively. At lower RBBR initial concentration, the ratio of active sites to a number of RBBR molecules is high, thus equilibrium state can be achieved faster and vice versa.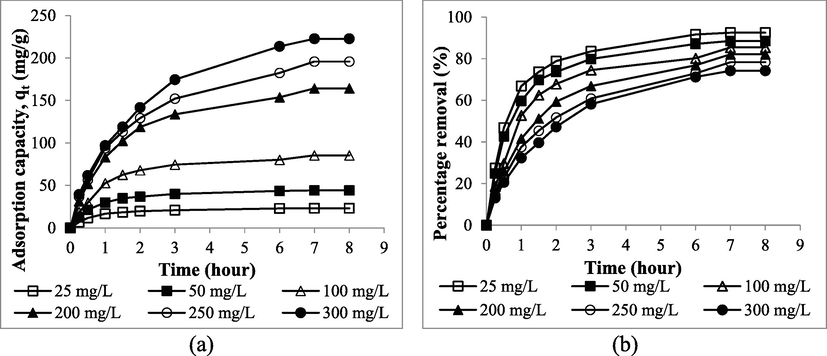
The plots of (a) adsorption uptakes and (b) percentage removal of RBBR by TWAC versus time for different initial concentration.
3.3.2 Effect of solution temperature and pH
Fig. 8(a) presents the RBBR uptakes plot versus different solution temperatures whilst Fig. 8(b) presents the RBBR uptakes plot versus different solution pH. Based on Fig. 7(a), RBBR uptakes decreased from 222.66 to 214.65 mg/g when the solution temperature was raised from 30 to 50 °C. Therefore, it signifies an exothermic nature which can be confirmed once again in the thermodynamic study provided in Section 3.6. When the solution temperature was raised, the solubility of RBBR dye increased, therefore making them more reluctant to be absorbed by TWAC. This was contributed by the fact that at higher solution temperatures, the RBBR molecules gained greater kinetic energy that drove them away from the solid phase to the bulk phase (Abbaszadeh et al., 2016). Moreover, at higher solution temperatures, the electrostatic interaction between RBBR dye molecules and TWAC’s functional groups became less intense, therefore, causing the desorption process to occur (Doumic et al., 2015).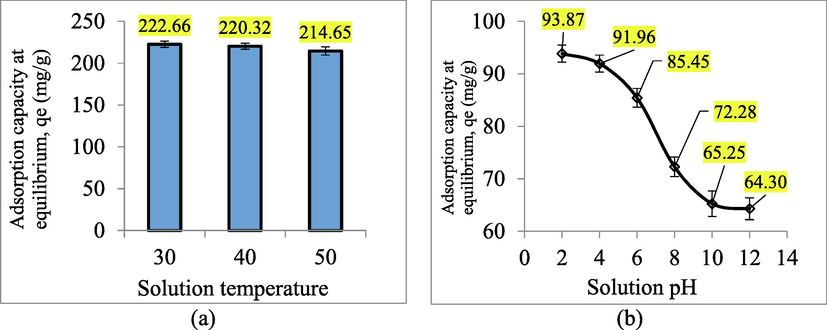
The plots of RBBR uptakes by TWAC under different (a) solution temperature and (b) solution pH.
Based on Fig. 7(b), it was found that the highest RBBR uptakes occurred at pH 2 of 93.87 mg/g. At this condition, the existence of H+ in the solution induced the surface of TWAC to be positively charged. Therefore, a strong attraction occurred between the positively induced TWAC’s surface and the partial negative O and N atoms in RBBR molecules. As the pH of the solution was raised to 4 and 6, RBBR uptakes decreased to 91.96 and 85.45 mg/g, respectively. The dropped in RBBR uptakes was caused by the reduction of H+ in the solution. At the alkaline condition of pH 8, the existence of OH– ions induced the TWAC’s surface to be negatively charged. Therefore, a repulsion force occurred between TWAC’s surface and the partial negative O and N atoms in RBBR molecules, resulting in low RBBR uptakes of 72.28 mg/g. At pH 10, the RBBR uptakes dropped even further to 65.25 mg/g due to the increment of OH– ions in the solution. At pH 12, RBBR uptakes decreased minimally to 64.30 mg/g because the induction effect by OH– had reached its maximum level. Therefore, further increasing the OH– ions in the solution gave no significant effect on the RBBR uptakes.
3.4 Adsorption isotherm
Fig. 9 presents the isotherm model plots whilst the parameters obtained from these models are summarized and given in Table 4. By judging the RMSE and error percentage values, the isotherm models fitted the adsorption data in the sequence of Koble-Corrigan > Langmuir > Freundlich > Temkin. However, the value of nKC was found to be 0.94. Since this value is below 1, it signifies that the Koble-Corrigan model was unable to specify the adsorption data (Koble and Corrigan, 1952, Mozaffari Majd et al., 2022). Therefore, the best isotherm model to fit the RBBR-TWAC adsorption system was Langmuir which signified a monolayer coverage of RBBR molecules on the surface of TWAC. The Langmuir maximum monolayer adsorption capacity, Qm was found to be 337.55 mg/g. This value can be considered relatively high in comparison with the adsorption of reactive blue 19 (71.60 mg/g) and reactive red 218 (63.30 mg/g) by lignocellulosic waste adsorbent (Değermenci et al., 2019), adsorption of reactive red 141 (98.80 mg/g) and reactive yellow 14 (89.70 mg/g) by magnetic chitosan nanoparticles (Jaafari et al., 2020), adsorption of RBBR (126.59 mg/g) by sewage sludge biochar (Raj et al., 2021), and RBBR removal by acacia sawdust based AC of 263.16 mg/g (Yusop et al., 2017). The adsorption of RBBR onto TWAC was confirmed to be favourable since the nF value was between 1 and 10.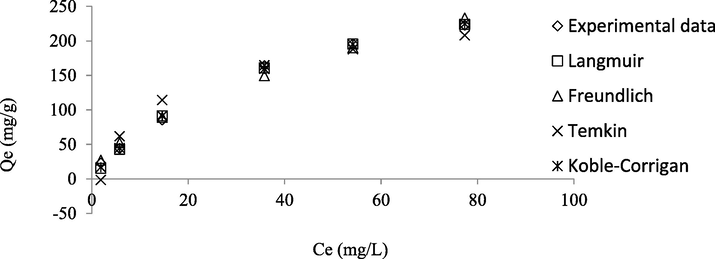
Isotherm plots for RBBR-TWAC adsorption system at 30 °C.
Langmuir
Freundlich
Temkin
Koble-Corrigan
Qm (mg/g)
337.55
nF
1.74
B (L/mg)
56.20
AKC
9.93
KL (L/mg)
0.025
KF (mg/g)(L/mg)1/n
19.12
A (L/mg)
0.52
BKC
0.03
nKC
0.94
RMSE
4.31
RMSE
8.70
RMSE
18.36
RMSE
4.14
Error (%)
7.77
Error (%)
9.54
Error (%)
31.79
Error (%)
6.55
3.5 Adsorption kinetic and mass transfer
Fig. 10(a)–(c) presents the kinetic plots of the PFO, PSO, and PMT models. The parameters in PFO and PSO were calculated through the common linear regression method whilst parameters in the PMT model were computed with the aid of Polymath version 6.2 (CACHE Corpn., USA). The kinetic parameters are presented in Table 5. Based on Table 5, it was found that PFO, PSO, and PMT models produced relatively high average R2 values of 0.9790, 0.9932, and 0.9938, respectively. However, PFO and PSO produced relatively high average error percentages of 17.89 and 14.70%, respectively, which signifies that these models failed to predict the RBBR uptakes at equilibrium, qe, cal. On contrary, the PMT model produced a relatively small average error percentage of 3.13%, thus confirming that this model was the best one to fit the kinetic data. The PMT model predicted the adsorption surface area to be 940.79 m2/g and this value is highly accurate in comparison with the actual mesopores surface area of 983.25 m2/g (error percentage of 4.32%). It was found that when the RBBR initial concentration was raised from 25 to 300 mg/L, the PMT rate constant, kPMT increased from 4.84 to 5.22 s−1 and the PMT mass transfer rate, rPMT increased from 137.56 to 1191.35 mg/L.s. At higher RBBR initial concentration, a greater mass transfer driving force is formed, hence, a higher rate constant and mass transfer rate is resulted, and vice versa.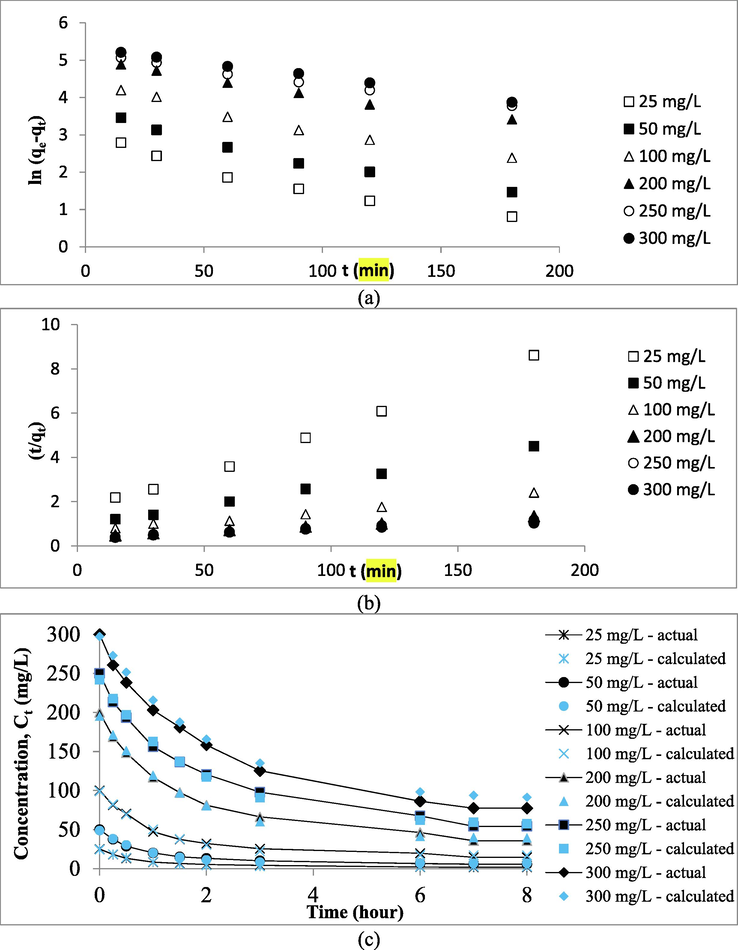
Kinetic plots of (a) PFO, (b) PSO and (c) PMT (actual and calculated) for RBBR-TWAC system.
PFO
Initial concentration (mg/L)
qe, exp (mg/g)
k1 (h−1)
qe, cal (mg/g)
Error (%)
R2
25
23.14
0.0118
15.66
32.33
0.9472
50
44.27
0.0119
32.27
27.09
0.9692
100
85.42
0.0111
71.35
16.47
0.9713
200
164.22
0.0090
144.39
12.08
0.9896
250
195.88
0.0078
171.91
12.23
0.9984
300
222.66
0.0080
206.71
7.16
0.9983
Average
17.89
0.9790
PSO
Initial concentration (mg/L)
qe, exp (mg/g)
k2 (g/mg.h)
qe, cal (mg/g)
Error (%)
R2
25
23.14
0.00112
25.32
9.42
0.9969
50
44.27
0.00050
49.26
11.29
0.9982
100
85.42
0.00014
104.17
21.95
0.9883
200
164.22
0.00006
196.08
19.40
0.9985
250
195.88
0.00006
217.39
10.98
0.9957
300
222.66
0.00004
256.41
15.16
0.9817
Average
14.70
0.9932
PMT
Initial concentration (mg/L)
qe, exp (mg/g)
Rate constant, kPMT (s−1)
Rate of mass transfer, rPMT (mg/L.s)
Adsorption surface area, aPMT (m2/g)
qe, cal (mg/g)
Error (%)
R2
25
23.14
4.8429
137.56
957.38
22.45
2.97
0.9904
50
44.27
4.9084
260.53
952.29
43.09
2.65
0.9920
100
85.42
5.0752
495.21
947.27
82.98
2.86
0.9946
200
164.22
5.1580
934.31
933.94
160.68
2.16
0.9954
250
195.88
5.1925
1104.86
928.34
192.30
1.83
0.9937
300
222.66
5.2200
1191.35
925.51
208.63
6.30
0.9967
Average
940.79
3.13
0.9938
3.6 Adsorption thermodynamic
The ΔH° value was computed to be −3.55 kJ/mol and the negative value of this parameter signifies exothermic nature of adsorption process. An exothermic nature refers to the adsorption process where the adsorption uptakes decreased with the increasing of solution temperature. This finding is consistent with the finding obtained in the Section 3.3.2. The ΔS° value was found to be 0.07 kJ/mol.K which signifies an increment of randomness at the interface between solid and liquid. The ΔG° value was revealed to be −24.37 kJ/mol and the negative sign of this parameter signifies that the adsorption process is spontaneous and feasible in nature. The Ea value was found to be 21.23 kJ/mol, and since this value is below than 42 kJ/mol, therefore the interaction between RBBR molecules and TWAC’s surface was governed by physisorption.
4 Conclusions
The TWAC was successfully produced at optimum conditions of 441 W, 5.76 min, and 1.35 g/g for radiation power, radiation time, and IR, respectively, as revealed by RSM. These optimum conditions resulted in RBBR uptakes of 83.96 mg/g (predicted) and 81.55 mg/g (actual) and TWAC’s yield of 30.61% (predicted) and 30% (actual). The BET surface area, mesopores surface area, total pore volume, and average pore diameter for TWAC were found to be 1522.74 m2/g, 983.25 m2/g, 0.6581 cm3/g, and 2.97 nm, respectively. Mechanism analysis found that the RBBR molecules formed an attraction force with functional groups on TWAC’s surface through hydrogen bond (cyclohexane), dipole–dipole interaction (polysulfides, medial alkyne, and terminal alkyne), and ion–dipole interaction (phenol and hydroxy group). The equilibrium study revealed that the highest RBBR uptakes occurred at a solution temperature of 30 °C (222.66 mg/g) and a pH solution of 2 (93.87 mg/g). Isotherm study found that the adsorption system was best described by the Langmuir model with Qm of 337.55 mg/g. A kinetic study divulged that the adsorption system obeyed the PMT model the best. The PMT model predicted the adsorption surface area to be 940.79 m2/g and this value is highly precise as compared to the value of TWAC’s mesopores surface area. The thermodynamic study revealed the adsorption system to be exothermic (ΔH° = −3.55 kJ/mol), spontaneous (ΔG° = −24.37 kJ/mol), and governed by physisorption (Ea = 21.23 kJ/mol).
Funding
This research was supported by a Short-Term Grant (Project No: 304/PJKIMIA/6315626) from Universiti Sains Malaysia and the Postdoctoral Fellowship Scheme from Universiti Sains Malaysia.
Declaration of Competing Interest
The authors declare that they have no known competing financial interests or personal relationships that could have appeared to influence the work reported in this paper.
References
- Treatment of lead-contaminated water using activated carbon adsorbent from locally available papaya peel biowaste. J. Clean. Prod.. 2016;118:210-222.
- [Google Scholar]
- Optimization of process variables by response surface methodology for malachite green dye removal using lime peel activated carbon. Appl Water Sci. 2017;7:717-727.
- [Google Scholar]
- Statistical optimization of Remazol Brilliant Blue R dye adsorption onto activated carbon prepared from pomegranate fruit peel. Chem. Data Collect.. 2020;28:100426
- [Google Scholar]
- Carbonization of sludge biomass of water treatment plant using continuous screw type conveyer pyrolyzer for methylene blue removal. IOP Conf. Ser.: Earth Environ. Sci. 2021
- [Google Scholar]
- Synergistic effect of hydrothermal and physical activation approaches to fabricate activated carbon for energy storage applications. Ceram. Int.. 2022;48:22131-22140.
- [Google Scholar]
- Design and synthesis of two novel carbon aerogels using citric and tartaric acids as catalysts for continuous water desalination. Desalin. Water Treatm.. 2021;215:69-79.
- [Google Scholar]
- A critical review on the treatment of dye-containing wastewater: Ecotoxicological and health concerns of textile dyes and possible remediation approaches for environmental safety. Ecotoxicol. Environ. Saf.. 2022;231:113160
- [Google Scholar]
- Single-Stage Microwave-Assisted Coconut-Shell-Based Activated Carbon for Removal of Dichlorodiphenyltrichloroethane (DDT) from Aqueous Solution: Optimization and Batch Studies. Int. J. Chem. Eng. 2021
- [Google Scholar]
- Textile finishing dyes and their impact on aquatic environs. Heliyon. 2019;5:e02711.
- [Google Scholar]
- Chemical production of activated carbon from green coffee with adsorption isotherm support by Taguchi model. J. Indian Chem. Soc.. 2023;100:100864.
- [Google Scholar]
- In situ textile wastewater treatment in high rate transpiration system furrows planted with aquatic macrophytes and floating phytobeds. Chemosphere. 2020;252:126513
- [Google Scholar]
- Adsorption of reactive dyes on lignocellulosic waste; characterization, equilibrium, kinetic and thermodynamic studies. J. Clean. Prod.. 2019;225:1220-1229.
- [Google Scholar]
- Activated carbon synthesis and methylene blue adsorption from pepper stem using microwave assisted impregnation method: Isotherm and kinetics. J. King Saud Univ. – Sci. 2023:102559.
- [Google Scholar]
- Efficient removal of Orange G using Prussian Blue nanoparticles supported over alumina. Catal. Today. 2015;240:67-72.
- [Google Scholar]
- 2-Mercaptobenzimidazole-functionalized chitosan for enhanced removal of methylene blue: Batch and column studies. J. Environ. Chem. Eng.. 2021;9:105609
- [Google Scholar]
- Conversion of teak wood waste into microwave-irradiated activated carbon for cationic methylene blue dye removal: Optimization and batch studies. Arab. J. Chem.. 2022;15:104081
- [Google Scholar]
- Nanoporous activated carbon prepared from karanj (Pongamia pinnata) fruit hulls for methylene blue adsorption. J. Taiwan Inst. Chem. Eng.. 2017;74:96-104.
- [Google Scholar]
- Effective adsorptive removal of reactive dyes by magnetic chitosan nanoparticles: Kinetic, isothermal studies and response surface methodology. Int. J. Biol. Macromol.. 2020;164:344-355.
- [Google Scholar]
- Cross-Linked Chitosan-Glyoxal/Kaolin Clay Composite: Parametric Optimization for Color Removal and COD Reduction of Remazol Brilliant Blue R Dye. J. Polym. Environ.. 2022;30:164-178.
- [Google Scholar]
- Activated carbon production from coconut leaflets through chemical activation: Process optimization using Taguchi approach. Bioresour. Technol. Rep.. 2022;19:101155
- [Google Scholar]
- About the Theory of So-called Adsorption of Soluble Substances. Sven. Vetenskapsakad. Handingarl. 1898;24:1-39.
- [Google Scholar]
- The adsorption of gases on plane surfaces of glass, mica and platinum. J. Am. Chem. Soc.. 1918;40:1361-1403.
- [Google Scholar]
- A critical review of the estimation of the thermodynamic parameters on adsorption equilibria. Wrong use of equilibrium constant in the Van't Hoof equation for calculation of thermodynamic parameters of adsorption. J. Mol. Liq.. 2019;273:425-434.
- [Google Scholar]
- Green synthesis of DyBa2Fe3O7.988/DyFeO3 nanocomposites using almond extract with dual eco-friendly applications: Photocatalytic and antibacterial activities. Int. J. Hydrogen Energy. 2022;47:14319-14330.
- [Google Scholar]
- Mesoporous and high-surface-area activated carbon from defatted olive cake by-products of olive mills for the adsorption kinetics and isotherm of methylene blue and acid blue 29. J. Environ. Chem. Eng.. 2020;8:104199
- [Google Scholar]
- Methylene Blue Removal Using Activated Carbon Adsorbent from Jengkol Peel: Kinetic and Mass Transfer Studies. Arab. J. Sci. Eng. 2022
- [Google Scholar]
- Adsorption isotherm models: A comprehensive and systematic review (2010–2020) Sci. Total Environ.. 2022;812:151334.
- [Google Scholar]
- Preparation, characterization and Cr(VI) adsorption evaluation of NaOH-activated carbon produced from Date Press Cake; an agro-industrial waste. Bioresour. Technol.. 2018;258:48-56.
- [Google Scholar]
- Posidonia Oceanica and Wood chips activated carbon as interesting materials for hydrogen storage. Int. J. Hydrogen Energy. 2020;45:14038-14047.
- [Google Scholar]
- Kinetic and thermodynamic investigations of sewage sludge biochar in removal of Remazol Brilliant Blue R dye from aqueous solution and evaluation of residual dyes cytotoxicity. Environ. Technol. Innov.. 2021;23:101556
- [Google Scholar]
- Activated carbon derived from waste orange and lemon peels for the adsorption of methyl orange and methylene blue dyes from wastewater. Heliyon 2022:e09930.
- [Google Scholar]
- Modification of activated carbon-based adsorbent for removal of industrial dyes and heavy metals: A review. Mater. Today: Proc. 2022
- [Google Scholar]
- Predicting the capability of diatomite magnano composite boosted with polymer extracted from brown seaweeds for the adsorption of cyanide from water solutions using the response surface methodology: modelling and optimisation. Int. J. Environ. Anal. Chem. 2021:1-14.
- [Google Scholar]
- Modelling and optimisation by response surface technique for adsorption of carbon dioxide by aminated biosilica/alginate composite: Experiments, characterisation and regeneration studies. Int. J. Environ. Anal. Chem. 2021:1-22.
- [Google Scholar]
- Enhanced desalination efficiency of flow-through capacitive deionization cell by mesh electrode with granular aerogel carbon in the removal of ions from synthetic and real samples. J. Water Reuse Desalin.. 2021;12:33-51.
- [Google Scholar]
- Microstructural analysis to understand the strength of teak wood using experimental methods. Mater. Today Commun.. 2022;32
- [Google Scholar]
- Kinetics of ammonia synthesis on promoted iron catalyst. Acta Physicochim. URSS. 1940;12:327.
- [Google Scholar]
- Algal biomass-derived nano-activated carbon for the rapid removal of tetracycline by adsorption: Experimentation and adaptive neuro-fuzzy inference system modeling. Bioresour. Technol. Rep.. 2022;20:101291
- [Google Scholar]
- Template-free preparation of nitrogen-doped activated carbon with porous architecture for high-performance supercapacitors. Microporous Mesoporous Mater.. 2019;276:280-291.
- [Google Scholar]
- Synthesis, characterization and application of Co/Co3O4 nanocomposites as an effective photocatalyst for discoloration of organic dye contaminants in wastewater and antibacterial properties. J. Mol. Liq.. 2021;337:116405
- [Google Scholar]
- Biomass-based activated carbon by flash heating as a novel preparation route and its application in high efficiency adsorption of metronidazole. Diamond Related Mater.. 2023;131:109603.
- [Google Scholar]
- Scavenging remazol brilliant blue R dye using microwave-assisted activated carbon from acacia sawdust: Equilibrium and kinetics studies. AIP Conf. Proc. 2017:1892.
- [Google Scholar]
- Scavenging malachite green dye from aqueous solution using durian peel based activated carbon. Malaysian J. Fundam. Appl. Sci.. 2021;17:95-103.
- [Google Scholar]
- Single-stage microwave assisted coconut shell based activated carbon for removal of Zn(II) ions from aqueous solution – Optimization and batch studies. Arab. J. Chem.. 2022;15:104011
- [Google Scholar]
- Single-Stage Optimized Microwave-Induced Activated Carbon from Coconut Shell for Cadmium Adsorption. Chem. Eng. Technol.. 2022;45:1943-1951.
- [Google Scholar]
- Optimization and Mass Transfer Simulation of Remazol Brilliant Blue R Dye Adsorption onto Meranti Wood Based Activated Carbon. Arab. J. Chem. 2023:104683.
- [Google Scholar]
- Adsorption kinetics analysis and optimization of Bisphenol A onto magnetic activated carbon with shrimp shell based precursor. Biomass Bioenergy. 2022;166:106604
- [Google Scholar]


