Translate this page into:
Novel ZnO@NPC core–shell polyhedral heterostructures derived from ZIF-8 with enhanced photocatalytic performance for aflatoxin B1 degradation
⁎Corresponding authors. ycfu@zju.edu.cn (Yingchun Fu), chengkejun@gmail.com (Kejun Cheng)
-
Received: ,
Accepted: ,
This article was originally published by Elsevier and was migrated to Scientific Scholar after the change of Publisher.
Abstract
Aflatoxin is one of the most toxic mycotoxins and causes server threaten to human health and food safety issues. It is crucial to develop efficient materials to remove and degrade aflatoxins. In this work, we adopted PVP modified ZIF-8 as precursor to prepare novel ZnO@NPC core–shell heterostructures (NPC is N-doped porous carbon) via “pyrolysis-in situ transformation-pyrolysis” strategy and used it as catalyst for degradation of aflatoxin B1 (AFB1). Various technologies were adopted to characterize to the structures and properties of the catalyst, such as XRD, SEM, BET, and TEM. The results show that the coating of N-doped porous carbon on ZnO can extend its light absorption wavelength to 800 nm, enhancing its photocatalytic activity for degradation of AFB1 (94.8%). The synergetic effect of high absorption capacity on N-doped porous carbon and excellent photocatalytic activity on ZnO was proven to contribute high degradation performance of ZnO@NPC. ZnO@NPC also shows excellent reparation and reusability. The photocatalytic activity of ZnO@NPC reduces only 1.71% after five repeated cycles. The developed ZnO@NPC may bring a promising solution for toxin degradation.
Keywords
ZnO@NPC
Core–shell heterostructures
AFB1
Photocatalytic activity
1 Introduction
The food safety issue is an eternal subject for human beings. Foodstuff, such as grain, oil, and animal products, can easily be contaminated by environmental pollution during planting, storage, or feeding (Weber et al., 2019). Besides that, some pathogenic microorganisms can also grow and generate some mycotoxins in these foodstuffs (Malenovska., 2020). As one of the mycotoxins, Aflatoxins are secondary metabolites of Aspergillus flavus and Aspergillus parasiticus (Song et al., 2021). They are highly toxic to human health. Especially aflatoxin B1 (AFB1) causes cancer and damages human beings' internal organs, being listed as a Class A carcinogen by WHO. Therefore, the removal and degradation of AFB1 have long been regarded as one of the top essential issues to ensure food and environmental safety.
Various technologies have been reported for aflatoxin degradation (Guo et al., 2021; Hojnik et al., 2021). Among them, photocatalytic degradation is one of the most promising technologies. This method is low cost, sustainable, and easy to operate (Chen et al., 2020). More importantly, it can degrade organic pollutants into H2O, CO2, or other non-toxic substances under UV or visible light irradiation (Deng et al., 2021). Therefore, it has been regarded as one of the most efficient and environmentally acceptable ways of removing and degrading contaminants from the environment. Up to now, there have been many reports about using semiconductors to degrade organic pollutants. For example, Sayama and his co-workers prepared highly active WO3 semiconductors from aged amorphous peroxo-tungstic acid. They used them as a photocatalyst to degrade various organic compounds into CO2 under a solar-simulating xenon lamp (Sayama et al., 2010). The highly active WO3 photocatalyst outperformed commercial or homemade N-doped TiO2 and WO3 catalysts in photocatalytic activity. Cui et al. synthesized mesoporous graphitic carbon nitrides by thermal treatment of NH3SCN and adopting silica nanoparticles as templates (Cui et al., 2012). They found that mesoporous graphitic carbon nitrides showed excellent photocatalytic activity to degrade chlorophenol and phenol in the aqueous phase. Wang and his co-workers prepared BiVO4/TiO2/RGO nanocomposite with enhanced photocatalytic activity (Wang et al., 2019). They explored the influence of GO content, pH and hydrothermal temperature on the photocatalyst’s photocatalytic activity and put forward the possible catalytic mechanism. Except that, there are also many other semiconductors, such as g-C3N4 (Yuan et al., 2019), TiO2 (Lv et al., 2020), Ag/AgCl (Xu et al., 2022), ZnO (Payra et al., 2019; Shraavan et al., 2017; Payra et al., 2020).
Among the semiconductors mentioned above, much attention is given to ZnO due to its efficiency, safety, and ease of preparation. Many researchers have reported various methods to prepare ZnO to degrade different contaminants. For example, Yang et al. adopted microwave heating technology to synthesize a dumbbell-shaped ZnO photocatalyst and used it to degrade methylene blue (MB) (Yang et al., 2010). They found that its degradation efficiency was 99.6%. Khan and his colleagues synthesized the Fe3+ doped ZnO photocatalyst with a sol–gel route that involved a peptization phase. They investigated its photocatalytic performance for degradation methylene blue under UV light and 4-CP (4-chlorophenol) under visible light (Khan et al., 2020). The results have shown that Fe0.8-ZnO exhibited the maximum photocatalytic activity, degrading MB and 4-CP up to 93% and 73%, respectively. Despite recent progress, the improvement of the degradation efficiency is still of high urgency. Aiming at the entire catalysis reaction, several breakthroughs might be helpful. The first route lies in the improvement of the photocatalytic activity of ZnO itself. For example, the photocatalytic performance of ZnO is still limited by its separation efficiency of photo-induced electrons and holes. Moreover, the accumulation of targets on the surface of ZnO to increase the effective concentration and, in turn, promote the catalysis reaction should be beneficial. Therefore, the engineering of the surface to enhance the photocatalysis activity of ZnO and the concentration ability may open a new way to promote degradation efficiency. Furthermore, few reports about using ZnO as a photocatalyst to degrade mycotoxins were reported, including AFB1.
In the present study, PVP modified ZIF-8 was adopted as a precursor to synthesize ZnO@NPC core–shell heterostructures via the “pyrolysis-in situ transformation-pyrolysis” strategy. The synthesized samples were used as photocatalysts for the detoxification of AFB1. The structures and features of all synthesized samples were further characterized by X-ray diffraction (XRD), scanning electron microscope (SEM), fourier Transform Infrared Spectrometer (FT-IR), transmission electron microscopy (TEM), UV–vis absorption spectrum (UV–vis) and so on. Transient photocurrent responses investigated the electronic interaction between ZnO and N-doped porous carbon. Electronspin resonance (ESR) spectra was adopted to explore the mechanism of photocatalytic degradation. It was found that ZIF-8 derived ZnO was coated with a layer of N-doped porous carbon. The combination of ZnO’s photocatalytic activity and N-doped porous carbon's high absorption capacity makes ZnO@NPC exhibit excellent photocatalytic performance toward the AFB1 photodegradation. Furthermore, the possible photocatalytic degradation for AFB1 with the help of ZnO@NPC has been explicated systematically. This work provides a new insight into green and efficient degradation methods to improve the efficiency of decontamination of AFB1.
2 Experimental
2.1 Materials and chemicals
All the analytical grades of chemical and reagents (methanol, zinc nitrate hexahydrate [Zn(NO3)2·6H2O], 2-methylimidazole (C4H6N2), ethanol, and polyvinyl pyrrolidone (K30, PVP)) were obtained from the Sinopharm Chemical Reagent Co., Ltd (China). AFB1 (C17H12O6) was bought from Shanghai Macklin Biochemical Co., Ltd (China). Without additional purification, all chemical reagents were employed immediately upon receiving.
2.2 Synthesis of ZnO@NPC core–shell photocatalyst
The PVP modified ZIF-8 was applied as a precursor to synthesize the ZnO@NPC core–shell photocatalyst in this experiment. First, 3.8 g of C4H6N2 and 10 g of PVP were dissolved in 100 mL of methanol to form the light-yellow solution. Then, another 100 mL of methanol solution containing 4.5 g of Zn(NO3)2·6H2O was quickly transferred into the prepared solution and stirred for 5 min. This mixture was maintained at 60 °C for 15 h, and the white precipitates formed were centrifugated and washed three times with methanol dried out at 80 °C for 10 h to acquire PVP modified ZIF-8. Following, PVP modified ZIF-8 was directly pyrolyzed at 560 °C for 30 min, with the 2 °C/min heating rate under air atmosphere to obtain ZnO polyhedral structure. After that, 0.5 g of ZnO polyhedral structure was dispersed into 30 mL of methanol solution containing 9.1 g of C4H6N2 and 3 g of PVP, then incubated for 12 h at room temperature. The precipitate was centrifugated, washed with ethanol three times and dried out at 80 °C for 8 h to obtain ZnO@ZIF-8. Finally, the obtained ZnO@ZIF-8 was pyrolyzed at 800 °C for 90 min with a 2 °C/min heating rate under an Ar atmosphere. The synthetic route to fabricate ZnO@NPC core@shell polyhedral heterostructures is illustrated below in Fig. 1.
Depicts the synthetic route to fabricate ZnO@NPC photocatalyst.
2.3 Characterization
The patterns of XRD were produced via a Bruker D8 Advance equipped with Cu-Kα radiation (λ = 0.15418 nm) and set to 40 kV and 40 mA. SEM images were captured using a JSM-7600F apparatus with a 20-kV operating voltage. The TEM images were executed through a JEM-2100F device with a 200-kV accelerating voltage. At 77 K, N2 adsorption–desorption isotherms were measured with the help of Micromeritics (ASAP 2020) equipment. Each sample was degassed at 150 °C for 6 h before analysis. The BET technique was used to compute the specific surface area. With a 5 °C/min heating rate under an air atmosphere, a thermal gravimetric (TG) curve was obtained on a thermal instrument (Thermo plus (EVO2, Japan). The UV–vis datum were recorded using a spectrophotometer (PerkinElmer Lambda, 750S) at 200 nm to 800 nm. FT-IR examination was performed on a spectrophotometer (Bruker VERTEX 70 & ALPHA) in the 400–4000 cm−1 range. The electrochemical and photoelectrochemical (PEC) properties were carried out at the electrochemical workstation (CHI 760E, Shanghai, China). A standard three-electrode quartz cell with 0.1 mol/L of Na2SO4 was used as the electrolyte. The Ag/AgCl and Pt were used as the reference electrode and counter electrode, respectively. The ITO glass coated with the sample was used as the working electrode. The light source for PEC measurements is a 300 W xenon lamp. ESR was carried out on an electron paramagnetic resonance spectrometer (PLS-SXE300UV, Xenon source (λ = 320 ∼ 780 nm) with filter to eliminate the visible light, 300 W) to detect the production of ·O2– and ·OH during the photocatalytic reaction. 5,5-Dimethyl-1-pyrroline N-oxide (DMPO) was used to capture the produced ·O2– and ·OH in methanol. As for the ·OH capturing, 2 mg of the photocatalyst was dispersed in 10 mL of methanol under ultrasonic conditions for 5 min. Then, 200 μL of the above suspension was mixed with 100 μL of DMPO (50 mM) under ultrasonic conditions for 5 min. Finally, DMPO-·O2– signals were recorded under dark and 10 min irradiation. The DMPO-·OH signals were obtained under the similar DMPO-·O2– but replaced 100 μL of DMPO with 50 μL of DMPO.
2.4 Photocatalysis experiments
The photocatalytic activity of ZnO@NPC, ZnO@ZIF-8, ZnO, and ZIF-8 was determined by degrading AFB1 in the open air at room temperature under UV light irradiation (500 W). In the photocatalytic experiment, 0.05 g of the photocatalyst was dispersed in 100 mL of 5 ppm AFB1 aqueous solution. A 120-mL glass reactor was swirled magnetically (in the dark) for 30 min to achieve adsorption–desorption equilibrium. Then, the UV light was turned on, and the suspension underwent the photocatalysis experiment. A 7 mL of the suspension was extracted at predetermined time intervals, centrifugated, and examined using a UV–vis spectrophotometer to determine the changes in aflatoxin concentration. After the first photocatalytic reaction, the photocatalyst powder was collected, washed and dried for the following photocatalytic degradation reaction. The above steps were repeated for five cycles of degradation to investigate the stability of the photocatalyst.
3 Results and discussion
3.1 XRD analysis
Fig. 2a shows the XRD patterns of ZIF-8, ZnO, ZnO@ZIF-8 and ZnO@NPC. The synthesized ZIF-8 exhibits six obvious characteristic peaks at 18.08°, 16.50°, 14.75°, 12.77°, 10.42°, and 7.38°, which are ascribed to the (2 2 2), (0 1 3), (0 2 2), (1 1 2), (0 0 2), and (0 1 1) of ZIF-8 reflections, respectively (Yang et al., 2018). When ZIF-8 was pyrolyzed at 560 °C for 30 min, the characteristic peaks corresponding to ZIF-8 disappeared. It showed new peaks at 69.08°, 67.93°, 66.35°, 62.85°, 56.58°, 47.54°, 36.25°, 34.44°, and 31.76°, which is corresponding to the (2 0 1), (1 1 2), (2 0 0), (1 0 3), (1 1 0), (1 1 0), (1 0 2), (0 2 2), and (1 0 0) planes of wurtzite-type ZnO, respectively (Fig. 2b) (Caglar et al., 2009). ZIF-8 has transformed into ZnO after being heated at 560 °C under an air atmosphere. Fig. 2c shows the XRD patterns of the obtained ZnO after being absorbed in methanol solution dissolving with 2-methylimidazole and PVP after being aged at room temperature for 12 h. Except for the characteristic peaks of ZnO, it also shows the characteristic peaks of ZIF-8. ZnO can be used as a Zn source for ZIF-8 synthesis. Fig. 2d below illustrates the patterns of XRD for ZnO@ZIF-8 after being pyrolyzed at 800 °C under Ar atmosphere. The ZIF-8 characteristic peaks are disappeared, only showing the characteristic peaks of wurtzite-type ZnO. The organic ligands of ZIF-8 were carbonized at 800 °C under an Ar atmosphere.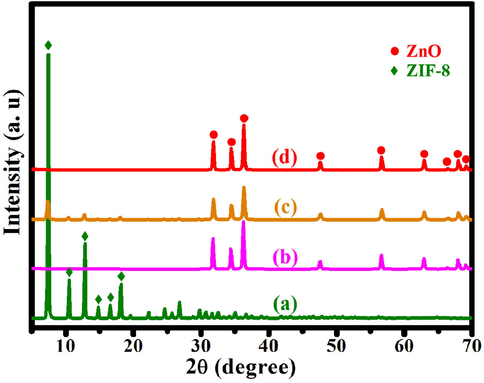
XRD patterns of (a) ZIF-8, (b) ZnO, (c) ZnO@ZIF-8, (d) ZnO@NPC.
3.2 FT-IR analysis
FT-IR spectra are used to analyze the functional groups of ZnO@NPC, ZIF-8, ZnO@ZIF-8, and ZnO. As presented in Fig. 3, ZIF-8 exhibits different peaks at 759, 1145, 1306, 3133, and 2927 cm−1. The peaks at 1306, 1145, and 759 cm−1 are allotted to the bending signals of imidazole rings (Lin et al., 2015). At 2927 and 3133 cm−1, the peaks correspond to the aliphatic and aromatic C–H stretches, respectively (Wang et al., 2016). The characteristic peak of ZnO is at about 458 cm−1, ascribing to the Zn-O vibration. When ZnO is immersed in the 2-methylimidazole and PVP solution for 15 h, it exhibits the characteristic peaks of ZnO and ZIF-8, demonstrating the formation of ZIF-8. After that, ZnO@ZIF-8 was pyrolyzed at 800 °C under the Ar atmosphere. It shows peaks at 1570, 1240, and 458 cm−1 associated with the C = C, C-N, and Zn-O stretching vibrations, respectively. Besides that, ZnO@NPC exhibits vibration bands between 1025 and 1275 cm−1 attributed to epoxy (C-O-C) (Atchudan et al., 2018).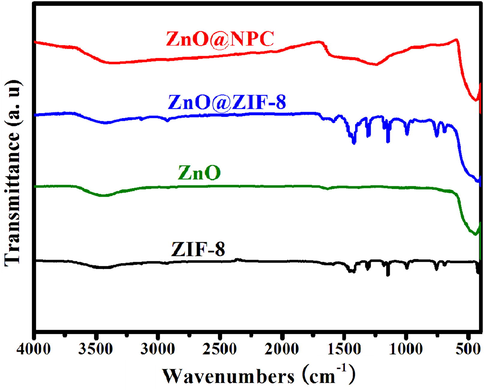
FT-IR spectra for ZnO@NPC, ZIF-8, ZnO@ZIF-8 and ZnO.
3.3 Scanning electron microscope and transmission electron microscopy
The morphology and internal structure were analyzed by scanning electron microscopy (SEM) and transmission electron microscopy (TEM). The results are shown in Fig. 4. From Fig. 4a, PVP modified ZIF-8 particles exhibit a polyhedral structure and their particle size is about 2.5 μm. Fig. 4b is the ZIF-8 derived ZnO, which holds the polyhedral structure and shows the particle size of 1.3 μm. ZnO.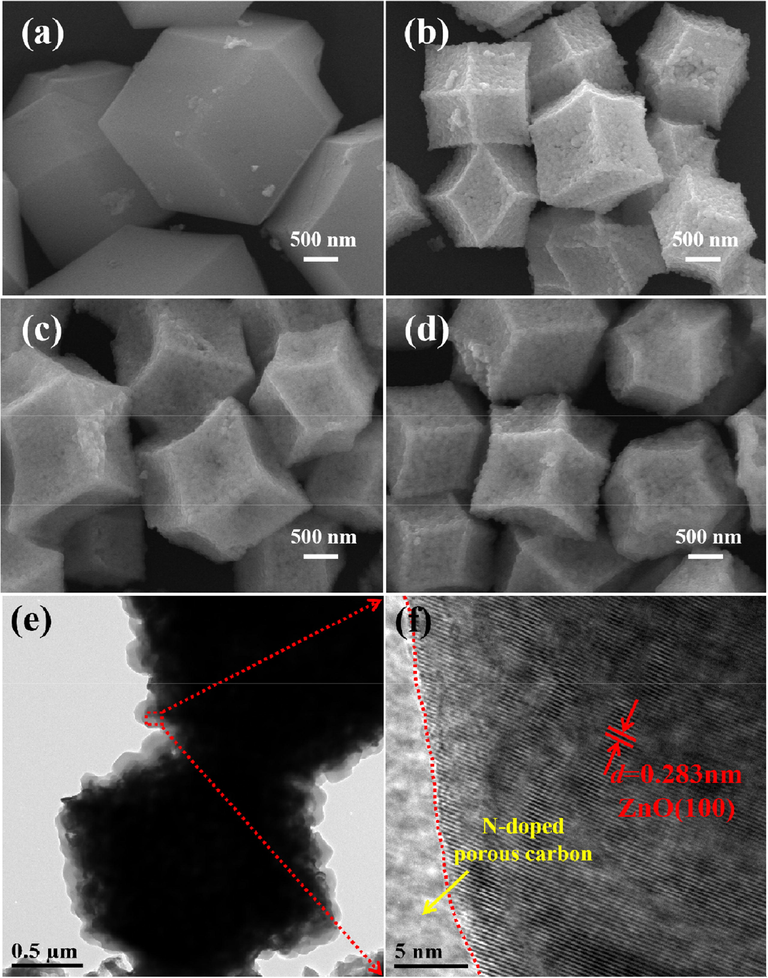
SEM images of (a) ZIF-8, (b) ZnO, (c) ZnO@ZIF-8, ZnO@NPC and TEM image of ZnO@NPC: (e) low-magnification, (f) high-magnification..
polyhedral structure is composed of small nanoparticles. The pyrolysis of organic ligands may cause a decrease in particle size. According to the XRD patterns and FT-IR spectra, these small nanoparticles belong to ZnO. Fig. 4c depicts the ZnO@ZIF-8. Compared with ZnO, the ZnO@ZIF-8 also exhibits a polyhedral structure. Remarkably, about 2.0 μm of the particle size for ZnO@ZIF-8 was observed, which is more significant than ZnO polyhedral structure. It may be attributed to the transformation of parts of ZnO into ZIF-8. When ZnO@ZIF-8 is pyrolyzed at 800 °C under Ar atmosphere, it maintains the polyhedral heterostructures (Fig. 4d). However, the particle size decreases to 1.6 μm, which is more significant than ZnO. (Fig. 4b). It deduces the creation of porous carbon on the surface of the ZnO polyhedral structure. Fig. 4e and Fig. 4f show the high and low magnification images for ZnO@NPC. From Fig. 4e, ZnO@NPC exhibits polyhedral heterostructures. Except that the surface of ZnO@NPC is coated by a layer of material. Fig. 4f demonstrates the ZnO@NPC high-magnification image, which shows clear fringes with a 0.283 nm lattice spacing corresponding to ZnO's (1 0 0) plane (Li et al., 2019). The coated material exhibits a porous structure. According to XPS and FT-IR characterization, this porous structure may be ascribed to N doped carbon.
3.4 XPS analysis
Chemical compositions and element states of ZnO@NPC were investigated by XPS analysis. Fig. 5a illustrates the XPS survey spectrum of ZnO@NPC. ZnO@NPC is composed of Zn, O, N and C elements. The spectrum for high-resolution Zn 2p is shown in Fig. 5b, deconvoluted into two peaks at 1022.08 and 1045.08 eV, assigned to Zn 2p3/2 and Zn 2p1/2 spin-orbital splitting photoelectrons. The peak separation value of Zn 2p3/2 and Zn 2p1/2 is 23 eV. According to the previous report, it is ascribed to the energy splitting of ZnO (Vanalakar et al., 2015). The C 1 s spectrum high-resolution is deconvoluted into three peaks at 284.58, 285.48, and 288.48 eV (as shown in Fig. 5c), which is ascribed to the graphitic sp3 carbon sp2/disorder C = O/O = C-OH functional groups and (C = C/C–C), C-OH/C-N, respectively (Muthuchamy et al., 2018). Fig. 5d shows the N 1 s spectrum in high-resolution, deconvoluted into two distinct peaks 398.58 and 400.88 eV corresponding to (C3)-N functional groups and C-N-C (Atchudan et al., 2016). The XPS results reveal that.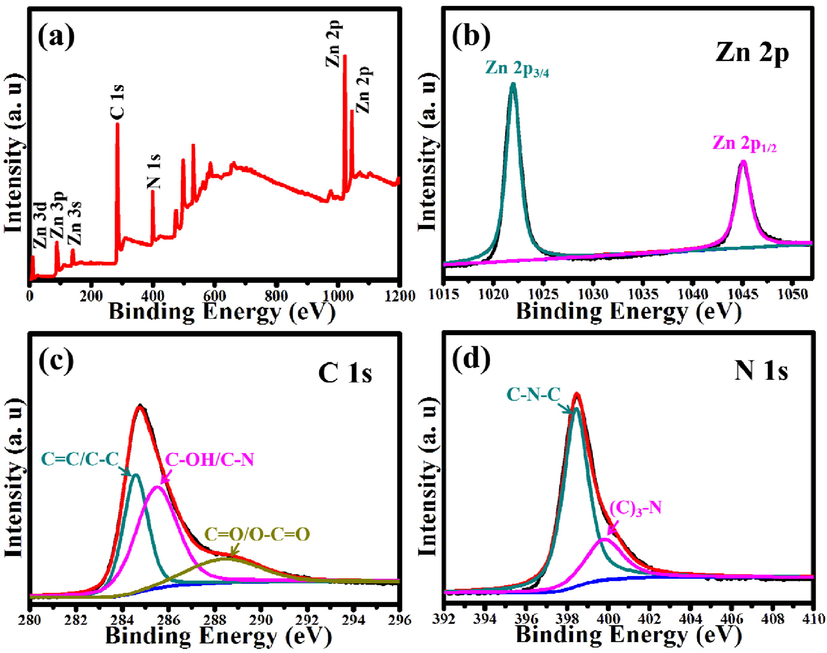
(a) XPS survey spectrum of ZnO@NPC and the corresponding high-resolution spectra of (b) Zn 2p, (c) C 1 s and (d) N 1 s.
N-atom is just chemically bonded in the carbon. Furthermore, ZnO@NPC exhibits a high degree of graphitization, consistent with the above FT-IR spectrum results.
3.5 N2 adsorption–desorption isotherms
The isotherms of N2 adsorption–desorption for ZIF-8, ZnO, ZnO@ZIF-8 and ZnO@NPC are displayed in Fig. 6. Due to the microporous frameworks of ZIF-8, it shows a distinctive type-I N2 adsorption–desorption isotherm. The high absorption step in the P/P0 < 0.1 regions is ascribed to the adsorption of micropores (Wang et al., 2016). ZnO's N2 adsorption–desorption isotherm exhibits low adsorption at low pressures and multilayered adsorption at high pressures, attributed to slits formed during nanoparticle assembly. It validates the ZnO polyhedral assembly's mesoporous structure (Payra et al., 2020). The ZnO@ZIF-8 and ZnO@NPC exhibit similar curves with ZIF-8 and ZnO, respectively. It verifies that ZnO@ZIF-8 and ZnO@NPC exhibit microporous and mesoporous structures, respectively. The textural parameters of ZnO@ZIF-8, ZIF-8@NPC, ZnO, and ZIF-8 are displayed in Table 1 below. The ZnO@ZIF-8 (550.7 m2/g) specific surface area was higher than ZnO (7.2 m2/g), ascribed to the contribution of ZIF-8. More interestingly, the average pore diameter and specific surface area of ZnO@NPC were 5.81 nm and 51.2 m2/g, respectively, which may be attributed to the organic ligand’s transformation into N-doped porous carbon during the pyrolysis process.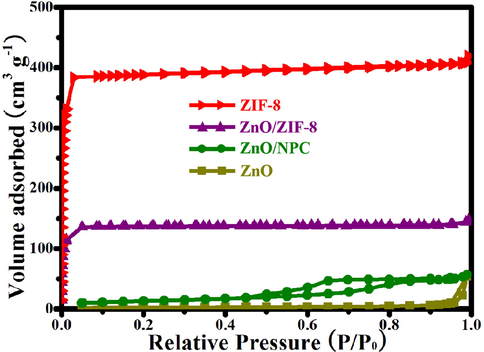
N2 adsorption–desorption isotherms of ZIF-8, ZnO, ZnO@ZIF-8 and ZIF-8@NPC.
Sample
SBET (m2/g)[a]
Smicro (m2/g)[b]
Vtotal (cm3/g)[c]
Vmicro (cm3/g)[d]
D (nm)[e]
ZIF-8
1069.9
1014.9
0.632
0.577
2.36
ZnO
7.2
0.4
0.021
0.001
17.08
ZnO@ZIF-8
550.7
540.4
0.217
0.208
2.51
ZnO@NPC
51.2
2.7
0.074
0.003
5.81
3.6 TG curve analysis
The TG analysis was used to evaluate the content of N-doped porous carbon (NPC) in the ZnO@NPC core@shell polyhedral heterostructures. The result is shown in Fig. 7. At the beginning stage, the weight loss belongs to the adsorbed water in ZnO@NPC. The N-doped porous carbon contains some Zn elements is derived from ZIF-8. It can be oxidized into ZnO during the TG analysis and releases gases at high temperatures. As shown in Fig. 7, the obvious weight loss happened from 250 to 460 °C, which is ascribed to the oxidation of N-doped porous carbon. After heating to 600 °C, Zn elements is absolutely transformed into ZnO, and the weight loss of ZnO@NPC virtually remains constant when the temperature is increased further. ZnO@NPC lost 10.62 % of its weight, whereas ZIF-8-derived N-doped porous carbon in the air lost.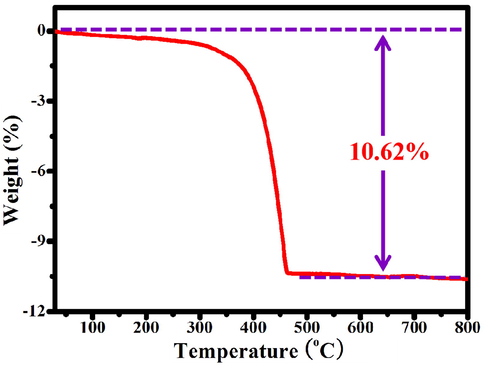
TG curve of ZnO@NPC under air atmosphere.
65.34 % of its importance. Hence, the content of N-doped porous carbon in ZnO@NPC core@shell polyhedral heterostructures can be calculated as 16.25%.
3.7 UV–vis diffuse reflectance spectra
The UV–vis diffuse reflectance spectra of ZIF-8@NPC, ZnO@ZIF-8, ZnO and ZIF-8 are shown in Fig. 8. We found that ZIF-8 shows a strong UV–vis diffuse reflectance spectrum in the 200 to 250 nm wavelength range, while ZnO exhibits a strong UV light absorption ability occurring in the 200–400 nm wavelength range. When ZnO is coated with a layer of ZIF-8, ZnO@ZIF-8 almost has the same absorption diffuse reflection spectra as ZnO. Compared with ZnO, the ZnO@NPC shows strong UV–vis diffuse reflectance spectra at the 200–400 nm wavelength range, which can be credited to the attribution of the ZnO core. Furthermore, the light absorption wavelength of ZnO@NPC extends to 800 nm, which may be due to the coating of N-doped porous carbon on ZnO. The synergistic impact of the ZnO and N-doped porous carbon increases its visible-light sensitivity.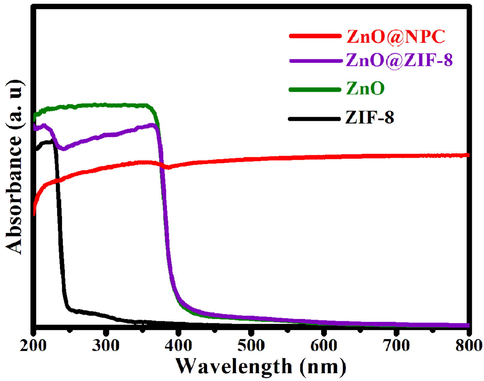
The UV–vis absorbance spectra of ZIF-8, ZnO, ZnO@ZIF-8 and ZIF-8@NPC.
3.8 Photocatalytic performance
To assess the photocatalytic performance for all samples, the AFB1 was degraded under UV light irradiation at room temperature. Typically, a 0.05 g of the photocatalyst was mixed with 100 mL of AFB1 solution (5 ppm). To create a suspension, the mixture was sonicated for 5 min before agitation for 25 min in the dark to achieve adsorption–desorption equilibrium. Then the suspension was subjected to UV light for photocatalytic degradation. Meanwhile, a 7 mL of suspension was withdrawn from the photoreactor at regular intervals and centrifugated to obtain the clear AFB1 solution. The concentration of the obtained clear AFB1 solution can be measured using UV–vis spectrophotometer. The change in concentration at regular time intervals for AFB1 corresponds to different photocatalysts, as shown in Fig. 9a. After 30 min of dark reaction, ZnO can absorb 6.5% of AFB1. However, ZnO@NPC can absorb 64.1% of AFB1, even higher than ZnO@ZIF-8 (24.6%) and ZIF-8 (54.1%). Like the previous reports, ZIF-8 has adsorption selectivity (Sun et al., 2020; Pavasupree et al., 2006), which makes the absorption ability of ZnO@ZIF-8 and ZIF-8 lower than ZnO@NPC, even though the specific surface areas of these are higher than ZnO@NPC. All the suspensions were visible to UV light; after 48 min of UV light irradiation. The ZnO@NPC degraded 94.8% of AFB1, higher than ZnO (80.4%). However, ZnO@ZIF-8 and ZIF-8 can degrade 32.3% and 59.9% of AFB1, respectively. The cross-section size of AFB1 molecules is more significant than the ZIF-8 frameworks aperture. AFB1 molecules could not infiltrate into the ZIF-8 shell through the photocatalysis procedure. So ZnO@ZIF-8 and ZIF-8 exhibit low photocatalytic activity for degradation of AFB1.
(a) Photocatalytic degradation of Blank, ZnO@NPC, ZnO@ZIF-8, ZnO, and ZIF-8 (b) the five repetitive cycles for the photocatalytic degradation of AFB1 using ZnO@NPC under UV light and (c) corresponding XRD patterns of ZnO@NPC for before the reaction and after the reaction.
For repeated five cycles, the ZnO@NPC was selected as a catalyst to degrade the AFB1 to demonstrate the photocatalyst's stability further (Fig. 9b). The photocatalytic activity of ZnO@NPC reduces by 1.71% after five repeated cycles. ZnO@NPC exhibits excellent reparation and reusability. Fig. 9c shows the XRD patterns of ZnO@NPC before the reaction and after the reaction. The XRD patterns of ZnO@NPC after the reaction are nearly identical to those before the reaction. It implies that after five repeated cycles, the phases of ZnO@NPC remain unchanged. The photocatalytic activity of this slight decrease could be attributable to the catalyst's inevitable loss during the washing process.
3.9 Transient photocurrent responses and electrochemical impedance spectra
The transient photocurrent was used to investigate the separation of photo-induced electrons and holes in ZnO@NPC. A good photocatalyst with enhanced photocatalytic activity has a good separation efficiency of photo-induced electrons and holes. It has been reported that the higher intensity of photocurrent density corresponds to the less recombination of photo-induced electrons and holes. Thus it will bring better photocatalytic activity (Liu et al., 2021). As shown in Fig. 10a, ZnO@NCP has a higher photocurrent density than ZnO. The photocurrent density of the ZnO@NPC electrode is about 2.2 times as high as that of the ZnO, indicating that the coating of N-doped porous carbon on ZnO can make it exhibit a higher separation efficiency photo-induced electrons and holes. Besides, electrochemical impedance spectroscopy measurements were further used to investigate the separation efficiency of photo-induced electrons and holes. Fig. 10b shows the Nyquist plot of ZnO and ZnO@NPC. The arc radius in the Nyquist plot of ZnO@NPC is smaller than that of ZnO, revealing that ZnO@NPC's interface charge transfer efficiency is improved. The excellent photoelectrochemical properties of ZnO@NPC also reveal its excellent photocatalytic activity.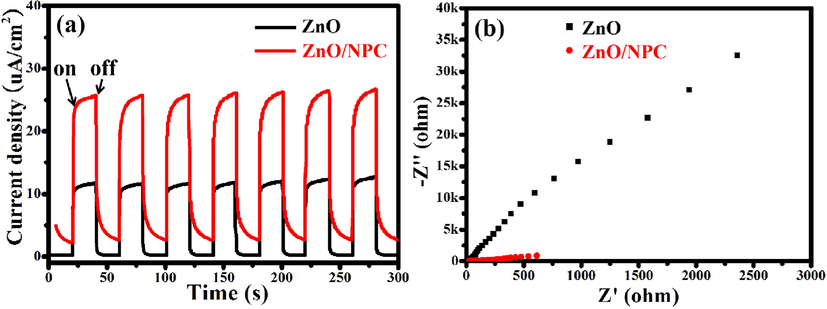
(a) Transient photocurrent responses and (b) electrochemical impedance spectra of ZnO and ZnO@NPC.
3.10 ESR spectroscopy
To investigate the mechanism of photocatalytic degradation, ESR spectroscopy of ZnO@NPC was obtained by using DMPO as the spin trap to capture ·O2– and ·OH under UV light irradiation (Liu et al., 2021). Fig. 11a and Fig. 11b are the ESR spectra of DMPO-·OH and DMPO-·O2– for ZnO@NPC, respectively. There are no ESR signals for ZnO@NPC under dark conduction, indicating that DMPO-·OH and DMPO-·O2– are not produced. However, the characteristic peaks of DMPO-·OH (Fig. 11a) and DMPO-·O2– (Fig. 11b) are detected after UV light irradiation. These results verify that both ·OH and ·O2–, produced by ZnO@NPC under UV light irradiation, contribute to photocatalytic degradation.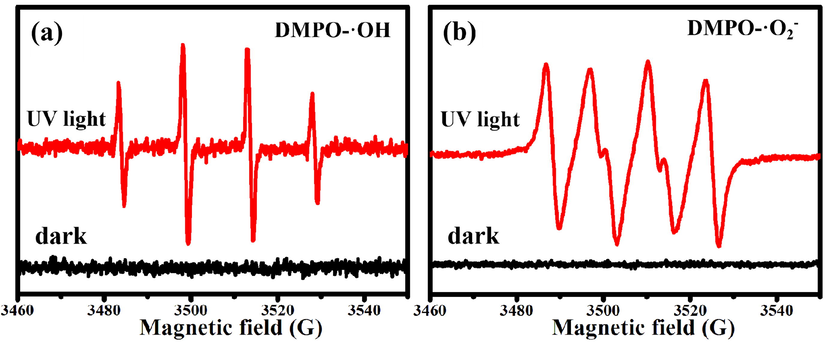
ESR spectra of (a) DMPO-·OH and (b) DMPO-·O2– for ZnO@NPC.
3.11 Photocatalytic mechanism of AFB1 degradation on ZnO@NPC
According to the previous reports, the degradation of AFB1 on photocatalyst is a complex process (Magzoub et al., 2019; Jamil et al., 2017). In this case, ZnO@NPC was fabricated by facile processes and used as a photocatalyst to degrade the AFB1 solution under UV light irradiation. The possible photocatalytic degradation for AFB1 with the help of ZnO@NPC is proposed in Fig. 12. Based on the above analysis, the photocatalytic efficiency of ZIF-8, ZnO, and ZnO@ZIF-8 is lower than ZnO@NPC. That might be attributed to the synergistic effect of ZnO and N-doped porous carbon. ZnO can be activated by UV light irradiation, generating electrons (e-) and holes (h+) pairs on its conduction band (CB) and valence band (VB), respectively. The generated electrons (e-) are easily moved to the N-doped carbon, leading to an effective charge separation. The generated electrons (e-) and holes (h+) can combine with hydroxide ions (OH–) and dissolved oxygen (O2) to produce ·OH (hydroxyl) and ·O2– (superoxide) radicals, respectively.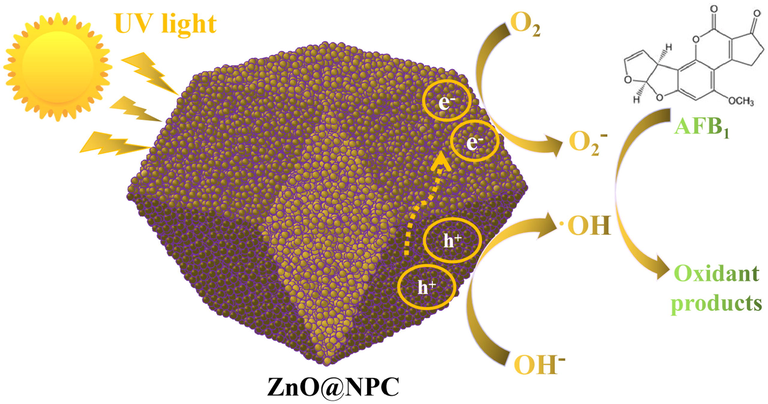
The schematic representation of the photocatalytic mechanism of AFB1 degradation on ZnO@NPC photocatalyst under UV light irradiation.
Furthermore, the N-doped porous carbon can absorb AFB1 molecules on their surface or pores because of their high specific surface area, forming a layer of high concentration molecules of AFB1. The synergetic effect of adsorption on N-doped porous carbon and photocatalysis on ZnO makes ZnO@NPC exhibit superior photocatalytic activity for degradation of AFB1 under UV light irradiation. The produced ·OH and ·O2– can oxidize AFB1 into different products.
4 Conclusion
In conclusion, ZnO@NPC core–shell photocatalyst was successfully synthesized via facile processes. After thermal treatment, ZIF-8 was changed into ZnO, and the generated ZnO acts as a template and provides Zn2+ for fabricating ZIF-8 on the surface of ZnO. The fabricated ZnO@ZIF-8 core–shell is transformed into ZnO@N-doped porous carbon (ZnO@NPC) core–shell structure after pyrolysis under Ar atmosphere. The results show that the content of N-doped porous carbon in ZnO@NPC core@shell polyhedral heterostructures is 16.25%. The coating of N-doped porous carbon on ZnO can extent its the light absorption wavelength to 800 nm, leading to increasing its photocatalytic activity. The ZnO@NPC can degrade 94.8% of AFB1 after 48 min of UV-light irradiation, which is superior than ZnO@ZIF-8 (32.3%), ZnO (80.4%) and ZIF-8 (59.9%). Furthermore, ZnO@NPC exhibits excellent reparation and reusability. After five repeated cycles, the photocatalytic activity of ZnO@NPC just reduces by 1.71%. We concluded from these findings that ZnO@NPC core–shell heterostructures might be potentially used as a photocatalyst to clean some aflatoxin-contaminated food.
Acknowledgements
The authors wish to acknowledge the financial support from the Lishui Science & Technology Bureau Research Fund (Grant No. 2019ZDYF12), the Natural Science Foundation of Fujian Province (2022 J011201), the Program for Outstanding Young Scientific Research Talents in Fujian Province University (Min-KeJiao, 2018, No 47), the Lishui Science & Technology Bureau Research Fund (Grant No. 2019ZDYF12) and the XPS analysis performed by the Shiyanjia Lab (www.shiyanjia.com).
Declaration of Competing Interest
The authors declare that they have no known competing financial interests or personal relationships that could have appeared to influence the work reported in this paper.
References
- Nitrogen-doped carbon dots originating from unripe peach forfluorescent bioimaging and electrocatalytic oxygen reduction reaction. J. Colloid Interface Sci.. 2016;482:8-18.
- [Google Scholar]
- Concurrent synthesis of nitrogen-doped carbon dots for cell imaging and ZnO@nitrogen-doped carbon sheets for photocatalytic degradation of methylene blue. J. Photoch. Photobiolo. A. 2018;350:75-85.
- [Google Scholar]
- Photocatalytic degradation of organic pollutants using TiO2-based photocatalysts: a review. J. Clean. Prod.. 2020;268:121725
- [Google Scholar]
- Metal-free photocatalytic degradation of 4-chlorophenol in water by mesoporous carbon nitride semiconductors. Catal. Sci. Technol.. 2012;2:1396-1402.
- [Google Scholar]
- Engineering paths of sustainable and green photocatalytic degradation technology for pharmaceuticals and organic contaminants of emerging concern. Curr. Opin. Green. Sust.. 2021;29:100465
- [Google Scholar]
- Novel strategies for degradation of aflatoxins in food and feed: a review. Food Res. Int.. 2021;140:109878
- [Google Scholar]
- Unravelling the pathways of air plasma induced aflatoxin B1 degradation and detoxification. J. Hazard. Mater.. 2021;403:123593
- [Google Scholar]
- Detoxification of aflatoxin B1 using nano-sized Sc-doped SrTi0.7Fe0.3O3 under visible light. J. Photoch. Photobiolo. A. 2017;341:127-135.
- [Google Scholar]
- A modified sol-gel synthesis to yield a stable Fe3+/ZnO photocatalyst: Degradation of water pollutants and mechanistic insights under UV and visible light. J. Environ. Eng.. 2020;2020(8):104282
- [Google Scholar]
- Polymer-assisted freeze-drying synthesis of Ag-doped ZnO nanoparticles with enhanced photocatalytic activity. Ceram. Int.. 2019;45:494-502.
- [Google Scholar]
- In Situ fabrication of a perfect Pd/ZnO@ZIF-8 core-shell microsphere as an efficient catalyst by a ZnO support-induced ZIF-8 growth strategy. Nanoscale. 2015;7:7615-7623.
- [Google Scholar]
- Hierarchically porous ZnO/g-C3N4 S-scheme heterojunction photocatalyst for efficient H2O2 production. Langmuir. 2021;37:14114-14124.
- [Google Scholar]
- Visible-light-driven Ag/AgCl@In2O3: a ternary photocatalyst for the degradation of tetracycline antibiotics. Catal. Sci. Technol.. 2020;10:8230-8239.
- [Google Scholar]
- Photocatalytic detoxification of aflatoxins in Sudanese peanut oil using immobilized titanium dioxide. Food Control.. 2019;95:206-214.
- [Google Scholar]
- Coronavirus persistence on a plastic carrier under refrigeration conditions and its reduction using wet wiping technique, with respect to food safety. Food Environ. Virol.. 2020;12:361-366.
- [Google Scholar]
- High-performance glucose biosensor based on green synthesized zinc oxide nanoparticle embedded nitrogen-doped carbon sheet. J. Electroanal. Chem.. 2018;816:195-204.
- [Google Scholar]
- Synthesis, characterization, photocatalytic activity and dye-sensitized solar cell performance of nanorods/nanoparticles TiO2 with mesoporous structure. J. Photoch. Photobio. A. 2006;184:163-169.
- [Google Scholar]
- Probing the photo- and electro-catalytic degradation mechanism of methylene blue dye over ZIF-derived ZnO. J. Hazard. Mater.. 2019;373:377-388.
- [Google Scholar]
- A correlation story of syntheses of ZnO and their influence on photocatalysis. Adv. Powder Technol.. 2020;31:510-520.
- [Google Scholar]
- A trade-off between adsorption and photocatalysis over ZIF-derived composite. J. Hazard. Mater.. 2020;393:122491
- [Google Scholar]
- Highly active WO3 semiconductor photocatalyst prepared from amorphous peroxo-tungstic acid for the degradation of various organic compounds. Appl. Catal. B-Environ.. 2010;94:150-157.
- [Google Scholar]
- Unusual photoluminescence of Cu-ZnO and its correlation with photocatalytic reduction of Cr(VI) B Mater. Sci.. 2017;40:1415-1420.
- [Google Scholar]
- Degradation of zearalenone and aflatoxin B1 by Lac2 from Pleurotus pulmonarius in the presence of mediators. Toxicon. 2021;201:1-8.
- [Google Scholar]
- Tunable LiCl@UiO-66 composites for water sorption-based heat transformation applications. J. Mater. Chem. A. 2020;8:13364-13375.
- [Google Scholar]
- Controlled growth of ZnO nanorod arrays via wet chemical route for NO2 gas sensor applications. Sens. Actuators B. 2015;221:1195-1201.
- [Google Scholar]
- Enhanced photocatalytic degradation performance of organic contaminants by heterojunction photocatalyst BiVO4/TiO2/RGO and its compatibility on four different tetracycline antibiotics. Adv. Powder Technol.. 2019;30:1882-1896.
- [Google Scholar]
- Rapid construction of ZnO@ZIF-8 heterostructures with size-selective photocatalysis properties. ACS Appl. Mater. Interfaces. 2016;8:9080-9087.
- [Google Scholar]
- Assessment of pops contaminated sites and the need for stringent soil standards for food safety for the protection of human health. Environ. Pollut.. 2019;249:703-715.
- [Google Scholar]
- Visible-light photocatalysis of organic contaminants and disinfection using biomimetic-synthesized TiO2-Ag-AgCl composite. Appl. Surf. Sci.. 2022;588:152886
- [Google Scholar]
- Microwave-assisted preparation, characterization and photocatalytic properties of a dumbbell-shaped ZnO photocatalyst. J. Hazard. Mater.. 2010;179:438-443.
- [Google Scholar]
- Synthesis of ZnO/ZIF-8 hybrid photocatalysts derived from ZIF-8 with enhanced photocatalytic activity. Inorg. Chem. Front.. 2018;5:687-693.
- [Google Scholar]
- Liquid exfoliation of g-C3N4 nanosheets to construct 2D–2D MoS2/g-C3N4 photocatalyst for enhanced photocatalytic H2 production activity. Appl. Catal. B-Environ.. 2019;246:120-128.
- [Google Scholar]


