

Translate this page into:
Characterization of phenolic constituents and evaluation of antioxidant properties of leaves and stems of Eriocephalus africanus
⁎Corresponding author at: QOPNA, Department of Chemistry, University of Aveiro, 3810-193 Aveiro, Portugal. Tel.: +351 234 370360; fax: +351 234370084. susanacardoso@ua.pt (Susana M. Cardoso)
-
Received: ,
Accepted: ,
This article was originally published by Elsevier and was migrated to Scientific Scholar after the change of Publisher.
Peer review under responsibility of King Saud University.
Abstract
Eriocephalus africanus, an Asteraceae plant endemic from South Africa and naturalized in the Mediterranean region, is commonly used in culinary and in traditional medicine. Despite the claimed health benefits attributed to this plant by the folk medicine, there is still a lack of scientific data to support this information.
The present study describes the main phenolic composition of hydroethanolic extracts from stems and leaves of E. africanus, along with the assessment of their antioxidant properties. The identification of the phenolic constituents on the stems and leaves from E. africanus was carried out by LC-DAD-ESI/MSn, and the structures of the two major HPLC-eluted compounds were further confirmed by NMR analysis.
Both extracts were rich in mono- and di-caffeoylquinic acids, which accounted for approximately 90% and 74% of total quantified phenolics, for the stems and leaves extracts, respectively. Besides, eriodictyol-hexuronide was found in considerable amounts in the extract from the leaves. One must highlight that these compounds together with other minor phenolic acids (namely other caffeoyl, ferulic and protocatechuic acid derivatives) and flavonoids (including hesperetin and eriodictyol) were herein identified for the first time.
Furthermore, through three in vitro methods, namely 2,2-diphenyl-1-picrylhydrazyl (DPPH•) radical scavenging, ferric reducing antioxidant power and lipid peroxidation inhibition capacity assays, the antioxidant capacity of the extracts was measured, revealing promising properties.
Overall, these results are an important contribution for the elucidation of the phenolic composition of E. africanus, as well as for the understanding of the biological properties of this medicinal plant species.
Keywords
Eriocephalus africanus
Phenolic compounds
Caffeoylquinic acid
Antioxidant
Mass spectrometry
Nuclear magnetic resonance

1 Introduction
The genus Eriocephalus, native from South Africa and naturalized in the Mediterranean region, is a very large and diversified member of the family Asteraceae (tribe Anthemideae), enclosing 32 reported species (Njenga et al., 2005; Verdeguer et al., 2009). Some of these plants are economically important due to diverse usage in food, pharmaceutical, cosmetic and perfume industries (Njenga and Viljoen, 2006).
Eriocephalus africanus is commonly known as “kapokbos” (Afrikaans), “cape snowbush” or “wild rosemary” due to its leaf morphology similar to that of Rosemary (Rosmarinus officinalis L.) (Merle et al., 2007). It is a small fast growing evergreen shrub, with green-grey foliage and snow white flowers of a distinctive fragrance that give rise to cottony seeds (Merle et al., 2007; Salie et al., 1996).
Like other types of rosemary, E. africanus is often used in cooking. Dried or fresh leaves and young tops are finely chopped and used in soups, salads, vegetables, meat and other foods (Department of Agriculture Forestry and Fisheries, 2013). Besides, it can also be used to flavour wines, vinegar, oil and butter (Department of Agriculture Forestry and Fisheries, 2013; van Deventer-Terblanche, 2011; Njenga and Viljoen, 2006; Oliver and McVicar, 2010). Infusions of the plant are used as diuretic and diaphoretic, as well as to treat gastrointestinal disorders, asthma, coughs, fever and painful conditions. Moreover, this plant has also been traditionally used as medicine for the treatment of inflammation and dermal complications (Njenga and Viljoen, 2006; Salie et al., 1996).
The majority of the claimed health benefits of E. africanus remain to be proved, but scientific data supporting a few beneficial activities of the plant have already been reported. In particular, organic (ethanol, methanol and chloroform) extracts of E. africanus have been shown to exhibit antifungal capacity against Candida albicans, while organic and aqueous extracts were reported to be effective against Staphylococcus aureus (Salie et al., 1996). Also, an aqueous extract of E. africanus has been proved to significantly attenuate nociception and pyrexia in in vivo mice models, thus confirming its analgesic and antipyretic properties (Amabeoku et al., 2000). Moreover, antipyretic, analgesic, anti-allergic, anti-depressant, antiseptic, anti-inflammatory and antioxidant properties were reported for acetone extracts and essential oils of E. africanus leaves (Njenga, 2005).
The lack of scientific knowledge regarding E. africanus is also extended to its bioactive compounds. This is the case of phenolic compounds that, to our knowledge, have not been previously identified in this plant. Hence, the present study aimed not only to elucidate the main phenolic components of the leaves and stems of E. africanus, but also to contribute to the knowledge of the antioxidant properties of the plant and/or plant extracts.
2 Material and methods
2.1 Chemicals
The phenolic standards chlorogenic acid, ferulic acid and eriodictyol were obtained from Extrasynthese (Genay Cedex, France). Ethanol, methanol, n-hexane and acetonitrile of HPLC purity were purchased from Lab-Scan (Lisbon, Portugal). Iron(II) sulphate, potassium hexacyanoferrate(III), iron chloride(III), 6-hydroxy-2,5,7,8-tetramethylchroman-2-carboxylic acid (trolox), butylated hydroxyanisole (BHA), trichloroacetic acid (TCA) and DPPH• were obtained from Sigma Chemical Co. (St. Louis, MO, USA). Ascorbic acid and sodium phosphate were purchased from Panreac (Barcelona, Spain) and thiobarbituric acid (TBA) from Acros Organics (Geel, Belgium).
2.2 Plant material
The plants of E. africanus were cultivated and collected from the fields of the Coimbra College of Agriculture. After collection, the leaves were separated from the stems and the two parts of the plant were separately dried for 5 days at 36 °C in a ventilated incubator.
2.3 Extraction of phenolic compounds
Dried stems and leaves (10 g) of E. africanus were separately grounded and extracted with 150 mL of an 80% ethanol solution (v/v) at room temperature for 20 min and the resulting solutions were filtered. The residues were extracted in the same conditions for three times and the filtrated solutions were concentrated under reduced pressure in a rotary evaporator following defatting with n-hexane. The defatted solutions were then frozen at −20 °C, freeze-dried and stored in vacuum in a desiccator in the dark, for subsequent use. The extraction procedure was performed in triplicate.
2.4 HPLC–DAD–ESI/MSn
The LC-DAD-ESI/MSn analysis was performed on an Ultimate 3000 (Dionex) apparatus equipped with an ultimate 3000 Diode Array Detector and coupled to a mass spectrometer. The chromatographic system consisted of a quaternary pump, an autosampler, a degasser, a photodiode-array detector and an automatic thermostatic column compartment. Analysis was run on a Hichrom Nucleosil C18 column (250 mm × 4.6 mm i.d.; 5 μm particle diameter, end-capped) and its temperature was maintained at 30 °C. The mobile phase was composed of (A) acetonitrile and (B) 0.1% of formic acid (v/v), both degassed and filtered before use. The solvent gradient started with 90–70% of solvent B over 20 min, from 70–40% of solvent B over 10 min, and from 40–0% of solvent B over 5 min.
For the HPLC analysis, each extract (5 mg) was dissolved in 1 mL of 50% of ethanol (v/v). All samples were filtered through a 0.2 μm Nylon membrane (Whatman). The flow rate was 0.7 mL min−1 and split out 200 μL min−1 to MS. UV–Vis spectral data for all peaks were accumulated in the range 250–500 nm and chromatographic profiles were recorded at 280 nm.
The mass spectrometer used was an Amazon SL (Bruker Daltonics) ion trap MS equipped with an ESI source. Control and data acquisition were carried out with the Compass Data Analysis data system (Bruker Daltonics, Bremen, Germany). Nitrogen above 99% purity was used and the gas pressure was 520 kPa (75 psi). The instrument was operated in negative-ion mode with electrospray ionization (ESI) needle voltage set at 5.00 kV and an ESI capillary temperature of 200 °C. The full scan covered the mass range from m/z 70 to 700. Collision-induced dissociation (CID)-MS/MS and MSn experiments were simultaneously acquired for precursor ions using helium as the collision gas with collision energy of 10–40 arbitrary units.
2.5 Identification and quantification of the phenolic compounds
The total phenolic compounds were quantified through Folin–Ciocalteu method (Pereira et al., 2012) with some modifications. A mixture of 1580 μL of milliQ water, 100 μL of Folin–Ciocalteu reagent and 20 μL of plant extract solution (2 mg/mL) was prepared. After 3 min, 300 μL of Na2CO3 17% (w/v) was added and the mixture was homogenized and incubated for 30 min at 40 °C. The absorbance was measured at 700 nm and the amount of total phenolic compounds was expressed as gallic acid equivalent (mg GAE)/g dried weight of plant material, using a calibration curve of gallic acid as standard (0.001–0.01 μg/ml).
The identification of individual phenolic compounds in the HPLC analysis was achieved by comparison of their retention times, UV–Vis spectra and MSn spectra data with those of the closest available reference standards and data reported in the literature, while hesperetin (minor phenolic co-eluted at 24.0 min) together with the compounds eluting at 4.2, 20.9 and 21.9 min was identified based solely on data reported in the literature. In addition, the structure of phenolic compounds eluting in the two major HPLC-eluting fractions was further confirmed by NMR analysis. The HPLC-collected fractions were freeze-dried and the obtained powder (2–3 mg) was re-dissolved in DMSO-d6. The 1H spectra were recorded at 298 K on a Bruker Avance 500 spectrometer operating at 500.13 MHz. 2D NMR (heteronuclear single quantum coherence, using gradient pulses for selection i.e. (1H,13C) gHSQC, and heteronuclear multiple quantum coherence, using gradient pulses for selection i.e. gHMBC) spectra were acquired in the same experimental conditions as previously described (Pereira et al., 2012). 13C NMR chemical shift assignments were made from the projections of the heteronuclear HSQC and HMBC experiments.
The quantification of the main individual phenolic compounds in both plant extracts was performed by peak integration at 280 nm, through the external standard method, using the most close reference compounds available. The detection and quantification limits (LOD and LOQ, respectively) were determined from the parameters of the calibration curves represented in Table 1, being defined as 3.3 and 10 times the value of the regression error divided by the slope, respectively (Ermer et al., 2005; Snyder et al., 2010). Note that phenolic compounds that were detected in MS analysis as a minor [M−H]− ion and were not simultaneously detected by UV-spectra analysis, were herein considered as trace components. 3-CQA, 3-caffeoylquinic acid; FA, ferulic acid; PCA, protocatechuic acid; ERD, eriodictyol.
Standard compound
Range concentration (μg/mL)
na
Slope (area counts/mg)
Intercept (area counts/mg)
R2
LOD (μg/mL)
LOQ (μg/mL)
3-CQA
31.3–500
5
667 (±16)
−7 (±3)
0.9996
21
63
FA
8.8–175
5
1233 (±34)
1 (±1)
0.9993
10
29
PCA
12.5–250
5
1367 (±20)
6 (±2)
0.997
18
56
ERD
3.3–30
5
984 (±11)
1 (±0)
0.9978
3
8
2.6 Antioxidant properties
2.6.1 DPPH• scavenging assay
The ability of scavenging DPPH• was performed following the procedure previously described (Pereira et al., 2013a). Briefly, 0.1 mL of six different concentrations (0.1–1 mg/mL) of the extracts was prepared and added to 1.9 mL of a 76 μM methanolic solution of DPPH• in a test tube, followed by vigorous stirring. After 30 min of incubation in the dark, the absorbance of the mixtures was measured in a spectrophotometer (Dr Lange, XION 500, Germany) at 517 nm, against a blank (absence of DPPH•). The radical scavenging activity of each ethanolic extract was calculated as the percentage of DPPH• discoloration, using the equation of Yen and Duh (1994): % DPPH• scavenging = (Ac(0) − Ae(t))/Ac(0) × 100, where: Ac(0) = Absorbance of the control at t = 0 min; Ae(t) = Absorbance of the extract at t = 30 min.
Based on graphic values of percentage of DPPH• inhibition vs. extract concentration, the IC50 (concentration of the extract able to inhibit the 50% of the DPPH•) of each extract was estimated. Ascorbic acid was used as the reference.
2.6.2 Ferric reducing antioxidant power assay
The reducing power assay was performed according to the procedure described before (Pereira et al., 2013a). For both extracts, eight different concentrations (0.01–0.09 mg/mL) were prepared, and 0.5 mL of each was mixed with 2.5 mL of 0.2 M phosphate buffer (pH 6.6) and 2.5 mL of 1% potassium hexacyanoferrate [K3Fe(CN)6] aqueous solutions. After 20 min of incubation at 50 °C, 2.5 mL of 4% TCA was added followed by a vigorous stirring. Thereafter, 2.5 mL of each solution was transferred to new vials where 2.5 mL of deionized water and 0.5 mL of 0.1% of iron chloride (FeCl3) were added, and the absorbance was then measured at 700 nm. A linear regression analysis was carried out by plotting the mean absorbance against the concentrations, and the IC50 value was determined considering the extract concentration that provides 0.5 of absorbance. BHA was used as a reference compound.
2.6.3 Lipid peroxidation inhibitory capacity in the presence of thiobarbituric acid reactive substances (TBARS)
The TBARS assay was performed according to an adaptation of the method of Ananthi et al. (2010). Briefly, 100 μL of 1.4% swine brain homogenate was incubated with different concentrations (0.1–0.5 mg/mL) of extracts and the lipid peroxidation was initiated by the addition of 100 μL FeSO4 (10 mM) plus 100 μL ascorbic acid (0.1 mM). After incubation at 37 °C for 30 min, 500 μL of 28% (w/v) TCA and 2 mL of 2% (w/v) TBA were added to this reaction mixture which was again incubated in a boiling water bath for 20 min. The tubes were then centrifuged at 3500 rpm for 10 min at the temperature of 4 °C. The extent of lipid peroxidation was evaluated on the supernatant by the estimation of TBARS level by measuring the absorbance at 530 nm. The IC50 was then determined considering the concentration at which a sample caused a 50% decrease of malondialdehyde (MDA) formation. Trolox was used as the reference compound.
2.6.4 Statistical analysis
All the data were expressed as mean ± standard error of the mean (SEM) of three independent assays and analysed through unpaired Student’s t-test or ANOVA combined with Tukey’s test (GraphPad Prism 5). P values of less than 5% (p < 0.05), were considered to be significant.
3 Results and discussion
3.1 Total phenolic quantification and identification of phenolic compounds from E. africanus
The hydroethanolic extracts of stems and leaves of E. africanus represented 15% ± 1 and 13% ± 1 of the dried plant material, respectively and the total phenolic compounds recovered accounted for 321 mg GAE/g of dried stems and 171 mg GAE/g of dried leaves.
Overall, the HPLC–DAD–MSn analysis (Fig. 1 and Table 2) allowed to conclude that these extracts were particularly enriched in mono- and dicaffeoylquinic acids, which accounted for approximately 90% and 74% of the total quantified phenolics in this analysis, for stems and leaves, respectively. Besides those compounds, the extracts contained minor amounts of other phenolic acids and flavanones. The latter constitute the unique flavonoids in E. africanus extracts and were predominantly found in the leaves. A description of E. africanus phenolic composition and their comparison between stems and leaves is further described below. It should be highlighted that, to our knowledge, this is the first study reporting these phenolic compounds not only in the plant E. africanus but also in the genus Eriocephalus.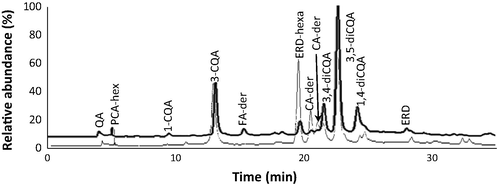
Chromatographic profile of Eriocephalus africanus hydroethanolic extracts at 280 nm. Chromatogram corresponding to stems extract is represented in bold lines, and while the thin lines represent the chromatogram corresponding to the leaves extract. QA – quinic acid; PCA-hex – protocatechuic acid-hexoside; 1-CQA – 1-caffeoylquinic acid; FA-der – ferulic acid derivative; ERD-hexa – eriodictyol-hexuronide; CA-der – caffeic acid derivative; 3,4-diCQA – 3,4-dicaffeoylquinic acid, 3,5-diCQA – 3,5-dicaffeoylquinic acid; 4,5-diCQA – 4,5-dicaffeoylquinic acid; ERD – eriodictyol.
RT (min)
λmax
Compound (MW)
Main ESI/Man fragments
mg/g dried materiala
Compound
Stems
Leaves
4.2
269
192
MS2[191]: 173
–
–
Quinic acid
5.3
279
316
MS2[315]: 153; MS3[153]: 109
0.4 ± 0.0
–
Protocatechuic-acid-4-glucoside
9.7
324
354
MS2[353]: 191; MS3[191]: 173, 109
–
–
1-Caffeoylquinic acid
13.4
219, 239, 325
354
MS2[353]: 191, 179
7.3.±0.1
6.9 ± 0.3
3-Caffeoylquinic acid
15.6
324
560
MS2[559]: 193; MS3[193]: 134
1.5 ± 0.0
–
Ferulic acid derivative
19.9
283
464
MS2[463]: 287, 151; MS3[287]: 151; MS4[151]: 107
1.6 ± 0.1⁎⁎
7.8 ± 0.1
Eriodictyol-O-hexuronide
20.9
318
518
MS2[517]: 355, 311, 179; MS3[355]: 311, 179, 175, 113, 135; MS4[311]:175, 113, 135
–
1.6 ± 0.1
Caffeoyl-hexuronide derivative
21.9
319
518
MS2[517]: 355, 311, 473, 293, 179; MS3[355]: 311, 179, 175, 113, 135; MS4[311]:175, 113, 135, 251, 293
–
1.1 ± 0.0
Caffeoyl-hexuronide derivative
22.9
217, 241, 325
516
MS2[515]: 353; MS3[353]: 173, 179, 191, 135; MS4[173]: 111, 155
5.6 ± 0.2⁎
4.0 ± 0.2
3,4-Dicaffeoylquinic acid
24.0
218, 326
516
MS2[515]: 353; MS3[353]: 191, 135; MS4[191]: 173, 127
19.4 ± 0.2⁎⁎
16.3 ± 0.1
3,5-Dicaffeoylquinic acid
610
MS2[609]: 301; MS3[301]: 286, 213
–
–
Hesperetin
24.9
218, 242, 327
516
MS2[515]: 353, 203, 299, 255, 173, 179; MS3[353]: 173, 179
5.4 ± 0.1⁎
3.7 ± 0.1
1,4-Dicaffeoylquinic acid
28.4
228, 288
288
MS2[287]: 151
0.2 ± 0.0
0.2 ± 0.0
Eriodictyol
3.1.1 Caffeic acid derivatives
Seven distinct caffeic acid derivatives were detected in the hydroethanolic extracts of stems and leaves of E. africanus, constituting the majority of the identified compounds (Fig. 1 and Table 2). These compounds, eluted at 9.7, 13.4, 20.9, 21.9, 22.9, 24.0 and 24.9 min showed characteristic UV spectra consistent to that described for caffeic and caffeoylquinic acid derivatives (Schütz et al., 2004; Weisz et al., 2009). Of those, the major representative constituents of both extracts were eluted at 13.4 and 24.0 min, respectively.
The compound eluting at 13.4 min was identified as a mono-caffeoylquinic acid and was assigned to chlorogenic acid i.e., 3-O-caffeoylquinic acid, since its retention time, MS data and corresponding MS2 fragmentation pattern were in agreement with that of the standard compound. Moreover, all the identified 1H and 13C NMR signals (Table 3) were consistent with those reported in the literature for 3-O-caffeoylquinic acid (Schütz et al., 2004; Weisz et al., 2009; Wong et al., 2014). The esterification position of quinic acid to the phenolic moiety was as well confirmed by the observed correlation in HMBC spectrum between H-3′ of the sugar residue and C-1 of the caffeic acid (data not shown).
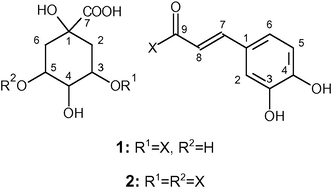
(1) 3-Caffeoylquinic acid
(2) 3,5-Dicaffeoylquinic acid
Atom
13C (ppm)
1H (ppm)
Atom
13C (ppm)
1H (ppm)
1
125.5
–
1a
125.6
–
1b
125.5
–
2
114.6
7.04 (d, J 2.0)
2a
114.7
7.06 (d, J 2.1)
2b
114.6
7.04(d, J 2.1)
3
145.5
–
3a
145.5
–
3b
145.5
–
4
148.3
–
4a
148.4
–
4b
148.2
–
5
115.7
6.77 (d, J 8.2)
5a
115.8
6.78 (d, J 8.3)
5b
115.7
6.77 (d, J 8.2)
6
121.4
6.98 (dd, J 8.2 and 2.0)
6a
121.4
7.001 (dd, J 8.2 and 2.1)
6b
121.2
7.000 (dd, J 8.3 and 2.1)
7
144.9
7.42 (d, J 15.9)
7a
145.1
7.45(d, J 16.0)
7b
144.5
7.48 (d, J 16.0)
8
114.2
6.16 (d, J 15.9)
8a
114.1
6.25 (d, J 16.0)
8b
114.1
6.17 (d, J 16.0)
9
165.8
–
9a
166.1
–
9b
165.6
–
1′
72.5
–
1′
72.5
–
2′
33.4
1.94–2.09 (m)
2′
33.4
2.01–2.11 (m)
3′
70.9
5.07 (q, J 4.3)
3′
70.9
5.14 (br s)
4′
70.9
3.65 (br s)
4′
70.9
3.88 (br s)
5′
69.2
3.92 (br s)
5′
69.2
5.19–5.20 (m)
6′
37.2
1.76 (dd, J 4.3 and 7.8) and 2.03–2.09 (m)
6′
35.3
1.93–195 and 2.13–2.16 (2m)
7′
175.0
–
7′
173.0
–
Notably, for both extracts, 3-O-caffeoylquinic acid represented approximately 17% of the quantified phenolics and its total recovery was similar for stems and leaves (7.3 ± 0.1 and 6.9 ± 0.3 mg/g dried stems and leaves, respectively), thus suggesting that this phenolic compound is equally distributed in these two plant organs. In turn, the isomeric form of this compound, i.e. 1-caffeoylquinic acid (with retention time of 9.7 min), was only detected as a minor constituent in both extracts with slight prevalence in the stems.
The other prevalent caffeoylquinic acid derivative (eluted at 24.0 min) was further recovered from the stems (19.4 ± 0.2 mg/g dried plant material) than from the leaves (16.3 ± 0.1 mg/g dried plant material). The structural identification of this compound was based on the UV–vis spectrum of the eluted fraction together with its analysis by electrospray ionization mass spectrometry (ESI-MS and ESI-MSn) and by NMR. In fact, its ESI-MS spectrum revealed a base peak at m/z 515, with a main MS2 product ion at m/z 353 (−162 Da, loss of caffeoyl moiety), which in turn showed main fragments on MS3 spectrum at m/z 191 (−162 Da, loss of other caffeoyl moiety), and at m/z 135. Additionally, the NMR analysis allowed the identification of all 1H signals and of several 13C signals (Table 3), which are in agreement with those previously reported for 3,5-dicaffeoylquinic acid (Tolonen et al., 2002; Zhao et al., 2014). The exact linkage of the two caffeoyl units to the sugar was undoubtedly elucidated by the connectivity observed in the HMBC spectrum between the H-3′ (δ 5.07 ppm, quart, J 4.3 Hz) and the caffeoyl carbonyl carbon at (δ 165.8 ppm) (data not shown).
Overall, 3,5-dicaffeoylquinic acid together with two other dicaffeoylquinic isomers (MW 516 Da) with retention times of 22.9 and 24.9 min, accounted for about 71% and 56% of the total quantified phenolics in the hydroethanolic extracts of stems and leaves, respectively. The UV–vis spectrum of these two compounds, as well as the fragmentation pattern of its molecular ion at m/z 515 and the corresponding MS2 pattern (which showed a base peak ion at m/z 353), was similar to that of 3,5-dicaffeoylquinic acid. Notwithstanding, these other two isomers could be identified based on MS2 and MS3 fragmentation pattern and on HPLC retention times, as compared to 3,5-dicaffeoylquinic acid.
Accordingly, the MS3 spectrum of the ion at m/z 353 eluting at 22.9 and 24.9 min showed a base peak ion at m/z 173, which indicates the presence of a caffeoyl moiety bonded to quinic acid at the position 4 (Clifford et al., 2003). It is also known that, among the three dicaffeoylquinic acid isomers that exist in nature with this feature (3,4-diCQA, 1,4-diCQA and 4,5-diCQA), both 1,4-diCQA and 4,5-diCQA elute after 3,5-diCQA under HPLC reversed-phase conditions (Clifford et al., 2003; Schütz et al., 2004; Weisz et al., 2009). Moreover, 1,4-diCQA is the only one showing the product ions at m/z 299, m/z 203 and m/z 255 in the MS2 spectrum of the ion at m/z 353 (Clifford et al., 2005). By these reasons, the compound detected at 24.9 min could be assigned to 1,4-diCQA. On the other hand, the compound eluting at 22.9 min was identified as 3,4-diCQA, since it eluted before 3,5-diCQA, such as described in the literature for HPLC reversed-phase conditions (Schütz et al., 2004).
The concentrations of the above identified diCQA isomers (3,4-diCQA and 1,4-diCQA) were similar for the same extract, yet, their overall recovery was higher in the stems extract (5.6 ± 0.2 and 5.4 ± 0.1 mg/g dried stems, respectively) than that in the leaves (4.0 ± 0.2 and 3.7 ± 0.1 mg/g dried leaves, respectively).
Notably, E. africanus extracts also contained two caffeoyl-hexuronide derivatives (with retention times of 20.9 and 21.9 min), which were substantially abundant in the leaves (1.6 ± 0.1 and 1.1 ± 0.0 mg/g dried plant material, respectively), while only vestigial amounts of these compounds were found in the stems extract. Both compounds had a molecular ion of 518 Da and possessed equivalent UV–vis and fragmentation patterns on MSn analysis. In particular, the base peak ion in the MS2 spectrum was observed at m/z 355 (−162 Da, i.e., equivalent to the loss of a caffeoyl moiety or of an hexose). Moreover, the MS3 spectrum of the latter ion corroborated the hypothesis of a caffeoyl-hexuronide derivative, as characteristic fragment ions of caffeic acid (at m/z 179 and m/z 135) and of an hexuronide acid (at m/z 175 and m/z 113) were registered (Bastos et al., 2007; Gu et al., 1999). Hence, albeit the overall structural information of these two isomers could not be achieved, the gathered information allowed us to conclude that these are caffeoyl-hexuronide with an additional caffeic acid and/or hexose moiety.
3.1.2 Other phenolic compounds
As previously mentioned, besides the caffeic acid derivatives, other phenolic compounds were only detected in low amounts in the hydroethanolic extracts of E. africanus. These included protocatechuic acid-hexoside ([M−H]− at m/z 315, eluted at 5.3 min) and a ferulic acid derivative ([M−H]− at m/z 560, eluted at 15.6 min) that overall accounted for 1.9 mg/g of dried stem and only appeared as vestigial components in leaves.
Flavonoids in E. africanus only comprised flavanones. Of these, hesperetin (co-eluted at 24.0 min) and eriodictyol (eluted at 28.4 min) were detected as minor components in the extracts of the two plant organs, while the most representative flavanone eluted at 19.9 min. This compound was assigned to eriodictyol-O-hexuronide since its MS data and fragmentation profile were consistent to those reported in the literature (Manach et al., 2004; Pereira et al., 2013b). Interestingly, its abundance was clearly more pronounced in the leaves extract with regard to that of the stems (7.8 ± 0.1 and 1.6 ± 0.1 mg/g dried material, respectively). This might be correlated to the presence of chloroplast in the leaves, since these organelles are known to be rich in flavonoids and appear to be capable of flavonoid biosynthesis (Agati et al., 2012).
3.2 Antioxidant properties of the hydroethanolic extracts
The antioxidant potential of the hydroethanolic extracts was estimated by three in vitro assays, namely DPPH• scavenging, reducing power and TBARS assays. While the DPPH• scavenging assay evaluates the sample ability to trap the DPPH•, in the reducing power assay, the sample antioxidant capacity is based on their ability to reduce Fe3+ to Fe2+. Finally, the TBARS method allows to estimate the samples ability to inhibit the malondialdehyde formation resulting from the lipids oxidative degradation.
Either stems or leaves extracts revealed a concentration-dependent effect in the three assays (data not shown). As indicated in Table 4, the IC50 estimated for the stems extracts was 17 ± 1 μg/mL, 57 ± 4 μg/mL and 418 ± 27 μg/mL for DPPH• scavenging, reducing power and lipid peroxidation assays respectively, while that of the leaves extracts was 28 ± 4 μg/mL, 96 ± 8 μg/mL and 333 ± 18 μg/mL, respectively. Interestingly, the IC50 herein estimated for DPPH• scavenging was lower than that previously described for acetone extracts from leaves, which ranged from 38 to 50 μg/mL (Njenga, 2005). This could be due to various aspects including different preparative procedures of the plant extracts, timing of collection of the plant material, geographical origin and variability between plants, soil composition and others not considered. Data represent the mean values ± S.E.M. of three independent assays performed in triplicate (N = 3).
Plant parts
Mass (% of dry weight)
Total phenolic content (mg GAE/g)
DPPH• (IC50) (μg/mL)
Reducing power (IC50) (μg/ml)
Lipid peroxidation (IC50) (μg/ml)
Stems
15 ± 1
321 ± 17#
17 ± 1⁎,#
57 ± 4⁎,##
418 ± 27⁎⁎
Leaves
13 ± 1
171 ± 7
28 ± 4⁎
96 ± 8⁎⁎
333 ± 18⁎⁎
Reference compound
–
–
7.0 ± 0.4a
18 ± 0b
50 ± 6c
Overall, the results obtained for the stems extracts were approximately 2-, 3- and 8-fold higher than those of the reference compounds used in DPPH• scavenging, reducing power and lipid peroxidation assays, respectively, while the results for the leaves extracts were 4-, 5- and 6-fold higher with respect to reference compounds for the same assays.
The gathered data suggest that both extracts possess relevant antioxidant capacity, either acting under single electron transfer reactions (as demonstrated in DPPH• and in the reducing power assays) or through H-atom donation (as occurring in TBARS). Having in mind that these extracts are enriched in mono- and dicaffeoylquinic acids, which in turn are recognized as having strong antioxidant character (and in particular measured in the herein used assays) (Hung et al., 2006; Nakajima et al., 2007; Ooi et al., 2011), it is reasonable to assume that these compounds can be at least partially responsible for the strong antioxidant capacities of the extracts of E. africanus. Note that in accordance with the total phenolic content determined, i.e., the higher abundance in the stems extract in regard to that of the leaves, the former showed better antioxidant activity in DPPH• scavenging and in reducing power assays than the latter (IC50 values’ ratio of leaves/stems is about 1.6–1.7 in DPPH• and reducing power assays). However, as this correlation is inverted in the TBARS assay (IC50 values’ ratio of leaves/stems of 0.8), it is also possible to suggest that other constituents (e.g. non-phenolic) are important contributing agents on the antioxidant ability via H-atom donation of E. africanus extracts.
4 Conclusion
The phenolic composition of hydroethanolic extracts from E. africanus stems and leaves was described here for the first time, by means of HPLC–DAD–ESI/MSn and NMR analysis. Therefore the described compounds, namely protocatechuic acid-glucoside, caffeoyl derivatives (particularly the mono- and dicaffeoylquinic acid isomers), ferulic acid derivative, eriodictyol-hexuronide and its aglycone, and hesperetin were newly identified in E. africanus. Both extracts were particularly enriched in mono- and dicaffeoylquinic acids with prevalence of 3-O-caffeoylquinic and 3,5-dicaffeoylquinic acids. Moreover, the flavonoid eriodictyol-O-hexuronide was also found to be relatively abundant in the leaves but not in the stems extract.
Both extracts showed potent antioxidant capacities, as measured in DPPH• scavenging, reducing power, and TBARS assays, although slight variations could be found in between the extracts of the two parts of the plant. Correlation of biological activity with the quantitative data of phenolic compounds suggested that caffeic acid derivatives might be particularly associated with the antioxidant activity of the extracts occurring through the electron donation mechanism.
Acknowledgements
We acknowledge Dr. Filipe Melo from the School of Agriculture of the Polytechnic Institute of Coimbra, for providing and identifying the plant material. The authors gratefully acknowledge the financial support provided by the Foundation for Science and Technology (FCT) to CERNAS (Project PEst-OE/AGR/UI0681/2011), to Coimbra Chemistry Centre of the University of Coimbra (FCT/PTDC/AAC-CLI/118092/2010, PEst-OE/QUI/UI0313/2014), and to FCT, the European Union, QREN, FEDER, COMPETE, for funding the Organic Chemistry, Natural Products and Food Stuffs (QOPNA) (project PEst-C/QUI/UI0062/2013; FCOMP-01-0124-FEDER-037296) and the Portuguese National NMR Network (RNRMN).
References
- Flavonoids as antioxidants in plants: location and functional significance. Plant Sci.. 2012;196:67-76.
- [Google Scholar]
- Effects of Tarchonanthus camphoratus and Eriocephalus africanus on nociception in mice and pyrexia in rats. Phytomedicine. 2000;7:517-522.
- [Google Scholar]
- In vitro antioxidant and in vivo anti-inflammatory potential of crude polysaccharide from Turbinaria ornata (Marine Brown Alga) Food Chem. Toxicol.. 2010;48:187-192.
- [Google Scholar]
- Phenolic antioxidants identified by ESI-MS from yerba mate (Ilex paraguariensis) and green tea (Camelia sinensis) extracts. Molecules. 2007;12:423-432.
- [Google Scholar]
- Hierarchical scheme for LC-MSn identification of chlorogenic acids. J. Agric. Food Chem.. 2003;51:2900-2911.
- [Google Scholar]
- Discriminating between the six isomers of dicaffeoylquinic acid by LC-MS(n) J. Agric. Food Chem.. 2005;53:3821-3832.
- [Google Scholar]
- Department of Agriculture Forestry and Fisheries, 2013. Wild Rosemary. South Africa.
- Cape Winelands Cuisine. South Africa: NB Publishers; 2011.
- Method Validation in Pharmaceutical Analysis: A Guide to Best Practice. Weinheim: Wiley; 2005.
- Analysis of O-glucuronide conjugates in urine by electrospray ion trap mass spectrometry. Fresenius. J. Anal. Chem. 1999:553-558.
- [Google Scholar]
- Antioxidant activity of caffeoyl quinic acid derivatives from the roots of Dipsacus asper Wall. J. Ethnopharmacol.. 2006;108:188-192.
- [Google Scholar]
- Polyphenols: food sources and bioavailability. Am. J. Clin. Nutr.. 2004;79:727-747.
- [Google Scholar]
- Chemical composition of the essential oils from Eriocephalus africanus L. var. africanus populations growing in Spain. Flavour Fragr. J.. 2007;22:461-464.
- [Google Scholar]
- Water extract of propolis and its main constituents, caffeoylquinic acid derivatives, exert neuroprotective effects via antioxidant actions. Life Sci.. 2007;80:370-377.
- [Google Scholar]
- The Chemotaxonomy, Phylogeny and Biological Activity of the Genus Eriocephalus L. (Asteraceae). Faculty of Health Sciences, University of the Witwatersrand; 2005.
- In vitro 5-lipoxygenase inhibition and anti-oxidant activity of Eriocephalus L. (Asteraceae) species. South African J. Bot.. 2006;72:637-641.
- [Google Scholar]
- Antimicrobial activity of Eriocephalus L. species. South African J. Bot.. 2005;71:81-87.
- [Google Scholar]
- Jekka’s Herb CookBook. London: Ebury Publishing; 2010.
- Cytotoxic, apoptotic and anti-α-glucosidase activities of 3,4-di-O-caffeoyl quinic acid, an antioxidant isolated from the polyphenolic-rich extract of Elephantopus mollis Kunth. J. Ethnopharmacol.. 2011;135:685-695.
- [Google Scholar]
- Phenolic constituents of Lamium album: focus on isoscutellarein derivatives. Food Res. Int.. 2012;48:330-335.
- [Google Scholar]
- Protective effects of phenolic constituents from Cytisus multiflorus, Lamium album L. and Thymus citriodorus on liver cells. J. Funct. Foods. 2013;5:1170-1179.
- [Google Scholar]
- Simultaneous characterization and quantification of phenolic compounds in Thymus x citriodorus using a validated HPLC–UV and ESI–MS combined method. Food Res. Int.. 2013;54:1773-1780.
- [Google Scholar]
- Preliminary antimicrobial screening of four South African Asteraceae species. J. Ethnopharmacol.. 1996;52:27-33.
- [Google Scholar]
- Identification and quantification of caffeoylquinic acids and flavonoids from artichoke (Cynara scolymus L.) heads, juice, and pomace by HPLC-DAD-ESI/MS(n) J. Agric. Food Chem.. 2004;52:4090-4096.
- [Google Scholar]
- Introduction to Modern Liquid Chromatography. New Jersey: John Wiley & Sons Inc.; 2010.
- Identification of isomeric dicaffeoylquinic acids from Eleutherococcus senticosus using HPLC-ESI/TOF/MS and 1H-NMR methods. Phytochem. Anal.. 2002;13:316-328.
- [Google Scholar]
- Phytotoxic effects of Lantana camara, Eucalyptus camaldulensis and Eriocephalus africanus essential oils in weeds of Mediterranean summer crops. Biochem. Syst. Ecol.. 2009;37:362-369.
- [Google Scholar]
- Identification and quantification of phenolic compounds from sunflower (Helianthus annuus L.) kernels and shells by HPLC-DAD/ESI-MSn. Food Chem.. 2009;115:758-765.
- [Google Scholar]
- Caffeoylquinic acids in leaves of selected Apocynaceae species: their isolation and content. Pharmacogn. Res.. 2014;6:67-72.
- [Google Scholar]
- Scavenging effect of methanolic extracts of peanut hulls on free-radical and active-oxygen species. J. Agric. Food Chem.. 1994;42:629-632.
- [Google Scholar]
- Isolation and identification of colourless caffeoyl compounds in purple sweet potato by HPLC-DAD-ESI/MS and their antioxidant activities. Food Chem.. 2014;161:22-26.
- [Google Scholar]


