

Translate this page into:
Differential pulse voltammetric assessment of phthalate molecular blocking effect on the copper electrode modified by multi-walled carbon nanotubes: Statistical optimization by Box-Behnken experimental design
⁎Corresponding author. Safa@iaurasht.ac.ir (Fariba Safa)
-
Received: ,
Accepted: ,
This article was originally published by Elsevier and was migrated to Scientific Scholar after the change of Publisher.
Abstract
Abstract
This research not only assesses the phthalate molecular blocking effect on differential pulse voltammetric nanosensor, but also qualifies phthalate blockers at too low concentrations. To achieve these goals, the copper surface is modified by a two-ingredient paste containing electroencephalographic gel (EEG) and multi-walled carbon nanotubes (MWCNTs). The Fe2+/Fe3+ couple was chosen as a voltammetric signal generator. Di-buthyl phthalate (DBP), di-methyl phthalate (DMP), diethyl hexyl phthalate (DEHP) and dicyclo hexyl (DCHP) phthalate were assessed to block the surface of fabricated nanosensor. The Box-Behnken design (BBD) was used to optimize the experimental major parameters; Fe2+ and supporting electrolyte (KCl) concentrations, pH and MWCNTs/EEG ratio. The phthalate molecular blocker cuts the Fe2+ oxidation signal because of holding Fe2+ ions back from the surface of the nanosensor. The optimum conditions were obtained as CFe2+= 402 µM, CKCl = 0.13 M, pH = 8.2 and MWCNTs/EEG ratio = 0.09. The field emission scanning electron microscopy (FESEM), X-Ray diffraction (XRD), Fourier transform infrared spectroscopy (FT-IR), Brunauer–Emmett–Teller (BET) porosity analysis, differential pulse voltammetry (DPV) and electrochemical impedance spectroscopy (EIS) were employed for evidence giving and gathering. The obtained results confirmed the molecular blocking effect of phthalates; and an accepted linear relationship between signal cutback and blocker concentration was observed. The limit of detection (LOD) and limit of quantitation (LOQ) were equal to 0.004–0.009 µgL−1 and 0.01–0.03 µgL−1, respectively. Finally, the fabricated nanosensor was successfully utilized in aqueous real sample analyses, and satisfactory results were obtained.
Keywords
Phthalic acid esters
Multi-walled carbon nanotubes
Molecular blocking effect
Voltammetric nanosensor
Box-Behnken design

1 Introduction
Environmental pollution, especially pollution of water resources, is currently an important challenge for humans and living organisms. The wastewater produced by industries can contaminate water resources and create adverse effects on ecosystem life as well as the environment (Yousefi et al., 2019). Most of the water pollutants are organic compounds with toxic, carcinogenic, mutagenic and teratogenic effects (Zhang, et al., 2014). Among the pollutants, phthalic acid esters (PAEs) with an estrogen-like structure are of great importance due to the capability of disrupting the reproductive system of living organisms. These chemicals are commonly used in plastic (Julinová and Slavík, 2012; Zulfikar et al., 2022; Razavi et al., 2022), paint (Pirsaheb et al., 2022), and cosmetic industries (Tang et al., 2021) to increase the transparency, flexibility, durability, and longevity of the products. Based on the reported studies, there are many concerns about exposure to PAEs (Chen et al., 2005). Naarala (Naarala and Korpi, 2009) and Olujimi (Olujimi et al., 2012) reported carcinogenic effects of PAEs on the human body. Sedha et al. (Sedha et al., 2021) showed that PAEs interfere with normal spermatogenesis and cause DNA damage, testicular atrophy and cryptorchidism. Hoyer et al. (Hoyer et al., 2018) investigated the impact of DEHP metabolites on male reproduction and found a negative association between DEHP metabolites and testosterone levels. In another study, researchers determined the effects of DBP on lipid metabolism in liver and hepatocytes. Results suggested that DBP could cause hepatotoxicity in normal body and abnormal metabolic bodies are more sensitive to the toxicity (Yang et al., 2021).
PAEs can be determined by gas chromatography (GC) (Holadova et al., 2007), high performance liquid chromatography (HPLC) (Liang et al., 2008; Orsi et al., 2006), liquid chromatography coupled to mass-spectrometry (LC-MS) (Net et al., 2015), GC–MS (Li et al., 2021a,b), and liquid chromatography-gas chromatography coupled to mass-spectrometry (LC-GC–MS) instruments (Espinosa et al., 2021). Moreover, different electrochemical methods have been employed for sensitive determination of DEHP (Xiong et al., 2014; Annamalai and Vasudevan, 2020), DEHP, DEP, DMP, and DBP (Zia et al., 2013), DBP (Bolat et al., 2019), and DPP (He and Li, 2021).
In recent years, electrochemical analyses based on the chemically modified electrodes have been widely used as selective and sensitive analytical methods in environmental assays (Wu et al., 2017). These studies have shown that chemical modification of an electrode may significantly improve the quality of the electrochemical results (Padigi et al., 2007; Yu et al., 2012).
Multi-walled carbon nanotubes are attractive nanomaterials for electrochemical applications due to specific chemical, geometrical, conductivity, electrical, and mechanical features (Wang et al., 2009; Baughman et al., 2002). Moreover, a gigantic surface area has made MWCNTs a promising choice for fabrication of electrochemical sensors (Keyvanfard et al., 2014; Dorraji and Jalali, 2014; Naganathan et al., 2018, Liao and Ko, 2015). In recent years, MWCNTs–based electrodes have been successfully utilized for detection of various substances such as H2O2 (Duan et al., 2020), 4-aminoantipyrine (Gowda et al., 2015), dopamine (Keerthi et al., 2019), glucose and amino acids (Gutierrez et al., 2016), quercetin (Kan et al., 2016), clostridium tetani (Liu et al., 2016), heavy metals (Palisoc et al., 2018), phenol (Wang et al., 2018), bilirubin (Thangamuthu et al., 2018), meldonium (Güney, 2019), methdilazine (Khan et al., 2017), ibuprofen, naproxen (Montes et al., 2016), tetrabromobisphenol A (Zhou et al., 2016), sulpiride (Khalil et al., 2020), and luteolin (Zeng et al., 2021). The major part of published research only focused on electrochemical signal enlargement. In contrast, the blocking effect of organic molecules on the surface of electrodes on different redox probes has recently received some attention in the field of electrochemical sensors. Kullapere et al. (2012) reported the blocking effects of 4-nitrophenyl and 4-decylphenyl groups on the Au electrode for electrochemical reduction of oxygen. Mooste et al. (Mooste et al., 2015) compared the effects of different surface blockers on the Ni electrode on cathodic peak current of ferricyanide ions and found that 4-bromobenzene and 4-nitrophenyl had the minimum and maximum blocking effects, respectively. The blocking effect of 1,10-phenanthroline on the surface of a platinized-platinum electrode on the Cu2+/Cu0 redox couple has been previously indicated by Rospendowiski et al. (2018). Moreover, Tabanlıgil Calam and Yılmaz (2021) suggested 1-amino-2-naphthol-4-sulphonic acid as an effective blocker which decreases the anodic peak current of ferrocyanide ions on the surface of a glassy carbon electrode. Dick et al. (2015) reported detection of electrochemically inactive biomacromolecules such as antibodies, enzymes, and DNA by blocking a solution redox reaction when molecules were adsorbed on the electrode sites and blocked them. In that study, they were used a large concentration of potassium ferrocyanide on an ultra-microelectrode. Darvishi et al. (2021) reported surface blocking of an azolla modified copper electrode for trace determination of PAEs as molecular barricade by differential pulse voltammetry.
The response surface method (RSM) includes a collection of mathematical and statistical methods for optimization of the process parameters and identifying the optimal conditions to obtain the best analytical response. The method consists of three main steps of: (i) performing statistically designed experiments, (ii) developing a significant mathematical model, and (iii) prediction of the optimum responses via the experimental data (Maran and Manikandan, 2012). The Box-Behnken design is one of the most widely used response surface designs for obtaining statistical conclusions from experiments. The Box–Behnken design makes possible to study the main and interactive effects of the various factors on the response (Tekindal et al, 2012).
To assess the phthalate molecular blocking effect on the fabricated nanosensor, differential pulse voltammetric signal of a Fe2+/Fe3+ couple was utilized. The powerful instruments were employed to give valuable information during nanosensor fabrication and its surface blocking. The Box-Behnken design was used to optimize the experimental parameters including modifier to gel ratio, solution pH, concentrations of Fe2+ ions and the supporting electrolyte. In continuing with our previous study on the blocking of an azolla modified electrode surface (as a biosensor) (Darvishi et al., 2021), we utilize MWCNTs for modification of Cu electrode surface to obtain a nanosensor for detection of trace PAEs in aqueous solutions via the blocking effect of PAEs to decrease the Fe2+/Fe3+ anodic signal. According to the information we have, the electrode modification by MWCNTs and the optimization of parameters by the Box-Behnken design were investigated for the first time in this study.
In fact, in this research, phthalate blocks the electrode surface and reduces the signal, and we obtained the concentration from the reduction of the signal. In previous reports, the increase of a substance led to the growth of the signal, but herein, instead of increasing the signal, its decrease was investigated.
2 Materials and methods
2.1 Chemicals and reagents
MWNTs with a purity of >95 wt% (carbon nanotubes), outer diameter of 20–30 nm and the length of 10–30 μm were obtained from Nanosany corporation (Mashhad, Iran). Phosphoric acid 85% (w/w), iron (II) chloride tetrahydrate (FeCl2·4H2O) 99% (w/w), iron (III) chloride hexahydrate (FeCl3·6H2O) 99% (w/w), potassium chloride 99% (w/w), sodium chloride 99% (w/w), were purchased with high purity from Merck (Darmstadt, Germany). Sodium hydroxide, DBP, DMP, DCHP and DEHP were purchased from Sigma-Aldrich (Milwaukee, WI, USA).
The electroencephalography gel was purchased from Abzar darman corporation (Tehran, Iran). Based on EDAX results, the MWCNTs have C -more than 97% (w/w) and Co, Cl, S and Al elements lower than 3% (w/w).
Stock solutions of PAEs (1000 mg L−1) were prepared by dissolution of known amount of each chemical in methanol. Moreover, a stock solution of Fe2+ ions (10−3 mol L−1) was prepared by dissolving a certain amount of FeCl2·4H2O in doubly distilled water. Phosphate buffer (0.01 mol L−1, pH = 7) was utilized for pH adjustment of the solutions, and KCl, NaCl, KNO3 and Na2SO4 solutions (1 mol L−1) were prepared and used as the supporting electrolyte.
2.2 Instruments
All the electrochemical experiments were performed with a Potentiostat-Galvanostat instrument (µAutolab, Netherlands) equipped with a three-electrode cell consisting of nanosensor, Ag/AgCl, and platinum rod as the working, reference and auxiliary electrodes, respectively. FT-IR spectrometer (Shimadzu, Model 8900, Japan) was used to characterize the functional groups of the MWCNTs before and after injection of PAEs. Crystal structure of the MWCNTs was determined by an X-ray diffractometer (XRD, Model PW1730, Philips, the Netherlands) using Cu Kα radiation (λ = 0.1541 nm) at 2θ angle in the range of 10◦ to 80◦, and energy dispersive X-ray spectroscopy (EDS, Model MIRAII, TESCAN, Czech Republic) was employed for the elemental analysis. Porosity of MWCNTs was determined by Brunauer–Emmett–Teller analysis (Model BELSORP MINI II, BEL, Japan) via heating up to 450 °C in vacuum. Moreover, the morphology and size of the MWCNTs were characterized by field emission scanning electron microscopy (FESEM, Model MIRAII, TESCAN, and Czech Republic). A Metrohm pH meter (model 827, Switzerland) was utilized for pH adjustments.
2.3 Modification of copper electrode surface with MWCNTs
In this work, a cylindrical copper electrode (I.D. = 7 mm, O.D. = 10 mm) was modified by MWCNTs and used as the working electrode for trace determination of PAEs by DPV. To modify the copper electrode, a certain amount of MWCNTs was mixed with the electroencephalography gel and the copper electrode was uniformly coated by the smooth and adhesive paste. The modified electrode was then air-dried for 10 min and the fabricated nanosensor was used for PAEs determinations via blocking the surface of the electrode and reduction in the DPV signal of the Fe2+/Fe3+ anodic peak.
2.4 Analytical procedure for determination of PAEs
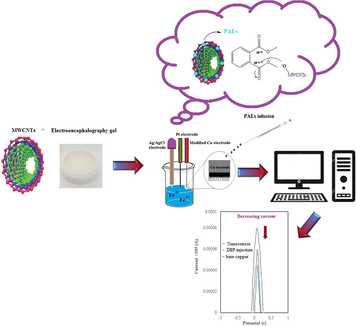
Electrochemical determination of the PAEs was performed based on their surface blocking effect on the fabricated nanosensor for oxidation of ferrous ions. In each experiment, 5 mL Fe2+ solution (10−3 mol L−1), 1 mL phosphate buffer (0.01 mol L−1, pH = 7), and 4 mL supporting electrolyte solution (0.1 mol L−1) were added to the electrochemical cell. Then, the differential pulse voltammogram was recorded in the potential range of −1.0 to 1.0 V with a scan rate of 0.1 V s−1 and the anodic peak current was measured for Fe2+/Fe3+ as the redox probe. The same procedure was repeated after injecting 20 µL of each PAEs solution into the surface of the modified electrode by a microsyringe, which resulted in a decrease in the anodic peak current for Fe2+ ions. Finally, the difference between the measured peak currents (Δi) was recorded as the DPV response. After each experiment, the modified working electrode was rinsed with pure methanol, sanded and washed again with pure methanol to ensure removing the modifier from the electrode surface. Finally, the electrode was placed in doubly distilled water. Surface modification of copper electrode and the electrochemical system are schematically indicated in Fig. 1.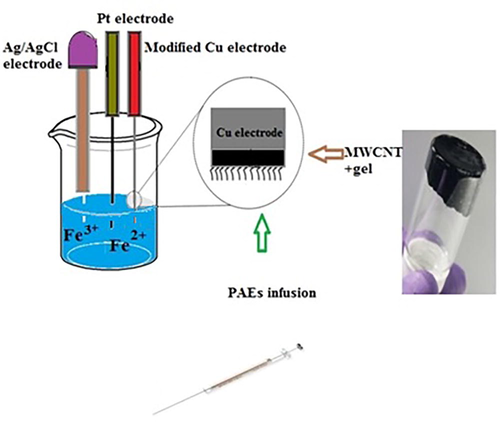
Schematic image of modification of Cu electrode by MWCNTs.
2.5 Optimization of the conditions
In the study, the univariate method was first employed to determine the optimum value of the solution pH, type of the supporting electrolyte, and volume of the DBP solutions. In the experiments, the anodic peak current of the Fe2+/Fe3+ pair was recorded before and after injection of DBP into the electrode surface to obtain the DPV response (Δi). Further studies were then conducted through designing the experiment and subsequent statistical analyses using Design-Expert software (version 11.0). A Box-Behnken design with four factors (modifier to gel ratio, solution pH, concentrations of Fe2+ and the supporting electrolyte) was used for statistical optimization of the electrochemical process. The studied factors and their levels can be seen in Table 1 and the BBD matrix is given in the Table S1.
Variable
Symbol
Levels
−1
0
+1
Fe2+ (μmol L−1)
A
250
400
550
pH
B
7.2
7.7
8.2
Supporting electrolyte (mol L−1)
C
0.05
0.10
0.15
Modifier/gel ratio
D
0.05
0.07
0.09
3 Results and discussion
3.1 Characterization of MWCNTs modified copper electrode
BET analysis was used to measure the specific surface area (SSA) and the porosity of the MWCNTs. The bigger the surface area, the higher chance of Fe2+ electrooxidation on the modified surface of electrode. The results were: SSA = 62.21 m2 g−1, total volume of pores = 0.473 cm3 g−1 and specific diameter of each pore = 30.4 nm. These findings are so promising for on-going modification steps.
Fig. 2 shows the XRD pattern of MWCNTs which displays a peak at 2θ ≈ 26° corresponding to the 002 plane of the graphitic structure of the modifier. Also, the peaks at 43° and 54° correspond to the 100 and 004 reflections (Atchudan et al., 2015). These characteristic peaks confirm the structure of MWCNTs.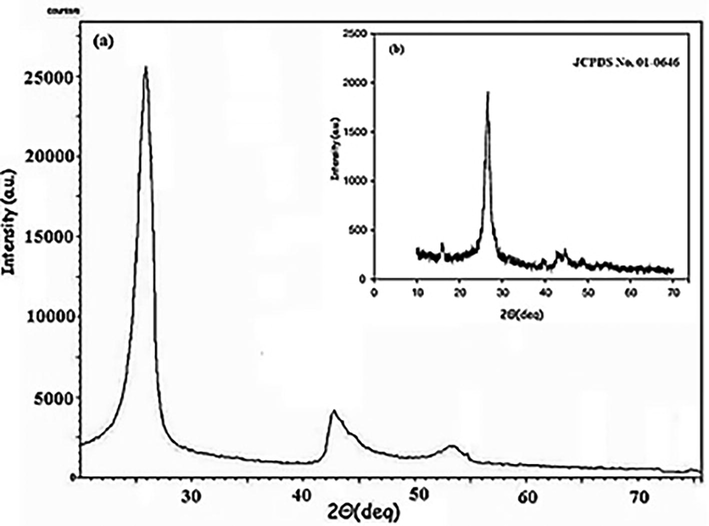
XRD pattern of MWCNTs (a) and ref pattern (b).
To visualize very fine topographic properties of the modified surface of electrode, before and after PAEs injection, low-kinetic-energy electrons penetrated to the immediate material surface employed via FESEM. The images of MWCNTs and MWCNTs-PAEs were shown in Fig. 3. The nano-scale dimensions of the MWCNTs are completely obvious in the first image (a). Comparison of the images suggests that no significant change occurs in the surface structure of the MWCNTs after spiking by PAEs.
FESEM images of MWCNTs before (a) and after spiking by DEHP (b), DBP (c), DCHP (d), and DMP (e).
Adequate mechanistic information regarding nanosensor-blocker interaction is so complicated to obtain. In spite of this obstacle, FT-IR was used to study the interaction. The spectra of raw MWCNTs, nanosensor and PAEs-injected nanosensor were shown in Fig. 4. In Fig. 4a, several peaks at 1725 cm−1, 2353 cm−1 and 3400–3600 cm−1 are good indications for the carbonyl, carboxylic and hydroxide groups of MWCNTs electrocatalyst, respectively. After blending the MWCNTs with EEG, the fabricated nanosensor was analysed as shown in Fig. 4b. The carbonyl stretching vibration appeared at 1725 cm−1. In the other region, a decrease was observed on the COOH peak around 2352 cm−1. Moreover, additional peaks in the range of 3400–3700 cm−1 were detected. Here is the start of a challenging part of mechanistic insight into interactions. The EEG gel is mainly based on polyacrylate and sodium chloride. The sodium acrylate ingredient is a suitable candidate for Na+exchange with strong H-bonded (COOH) on MWCNTs electrocatalyst. The proposed reactions are summarized below: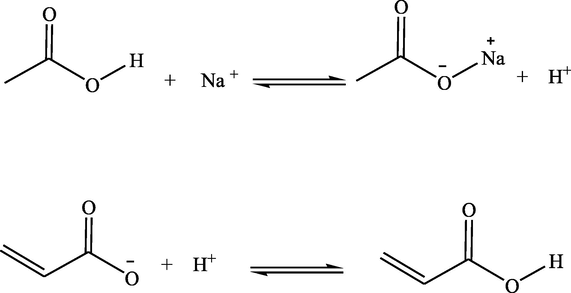
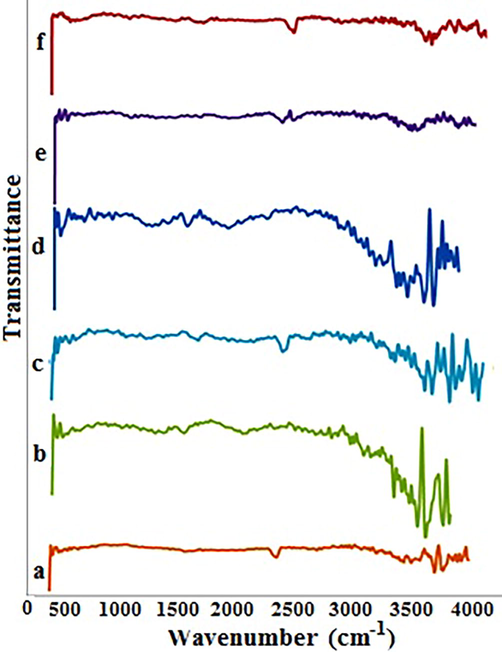
FT-IR spectra of MWCNTs before spiking (a), MWCNTs-EEG (b) and MWCNTs after spiking by DEHP (c), DBP (d), DCHP (e) and DMP (f).
It seems that the above-mentioned reactions and high coverage of the surface (because of the high weight fraction of EEG in the nanosensor) are responsible for the remarkable signal decrease around 2355 cm−1. Also, since the proposed reactions are in equilibrium, new peaks were created in the OH range (3400–3700 cm−1). Fig. 4c-d correspond to the blocker-injection step. It’s clear that the injection of various blockers carries the peaks, somewhat.
The carbonyl stretching vibration was observed at 1628 cm−1 (DCHP), 1626 cm−1 (DMP), 1718 cm−1 (DEHP) and 1720 cm−1 (DBP). The conjugated carbonyl in cases of DCHP and DMP tend to lower FT-IR wavenumbers. The major alteration occurred in the OH region (3400–3700 cm−1). These changes in OH signals may be related to an oxygen-hydrogen interaction of the phthalate carbonyl group and MWCNTs surface hydroxyl. This idea is in agreement with previously reported one (Baghayeri et al., 2014; Yu et al., 2014; Gupta et al., 2013; Lehman et al., 2011; Rausch et al., 2010; Ren et al., 2011; Abdel-Ghani et al., 2015). At a pH higher than 6, the surface of the MWCNTs electrocatalyst is negatively charged. This negative surface attracts Fe2+ ions via immigration. As a result, this immigration amplifies the total oxidation current of Fe2+. After blocker injection, the negative sites on MWCNTs electrocatalyst surface (O−), fall in electrostatic attraction with partially positive carbon of carbonyl groups of PAEs. This phenomenon not only blocks the negative sites (O−) of the electrocatalyst (MWCNTs), but also creates spatial hindrance on interface of the nanosensor.
3.2 Optimization strategies
As previously mentioned, in preliminary experiments, the optimum levels of the solution pH, type of the supporting electrolyte and volume of the DBP solution were determined by the univariate method. Fig. 5 displays the effect of the solution pH on the value of Δi showing the maximum value of Δi at pH = 8. Therefore, this pH was chosen as the optimal pH level. The effect of the supporting electrolyte type on the value of Δi in DBP solution is illustrated in Fig. 5. As indicated, KCl (0.1 mol L−1) resulted in the best response and was chosen as the supporting electrolyte. Additionally, Fig. 5 illustrates the effect of the DBP solution volume on the Δi value. As shown, the best response belonged to the 20 µL of DBP solution and then, this volume was selected as the optimum volume.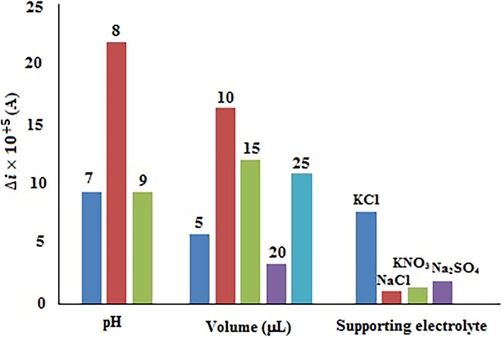
The results of optimizing the effects of solution pH, the volume of DBP solution, and type of the supporting electrolyte by the univariate method.
In this study, BBD as a response surface design was utilized to obtain the optimum levels of the parameters affecting the electrochemical response of the modified electrode. The effects of the experimental variables including the modifier to gel mass ratio (0.05–0.09), solution pH (7.2–8.2), Fe2+ concentration (250–550 μmol L−1), and supporting electrolyte concentration (0.05–0.15 mol L−1) on the response (Δi) were investigated to determine the best combination of variables for the analyses. The statistical parameters of the polynomial models developed for the determination of DBP are shown in Table 2. As shown, the highest values of the correlation coefficient (R2), adjusted correlation coefficient (Adj R2) and predicted correlation coefficient (Pred R2) were observed for the quadratic model developed for the electrochemical response. A value close to 1 for R2 indicates a strong relationship between the experimental and predicted responses. Furthermore, adjusted R2 (0.9187) indicated an improvement in fitting with the use of a quadratic model. The predicted R2 value (0.8537) matches with the adjusted R2. The quadratic response surface model in terms of actual factors is as follows:
Model
Standard deviation
F
p-value
Sequential p-value
Lack of Fit p-value
PRESS
R2
Adj R2
Pred R2
Linear
3.17 × 10⁻⁶
0.9091
0.0277
0.4744
0.0277
3.72 × 10⁻¹⁰
0.1316
−0.0132
−0.03426
2-factor interaction
2.73 × 10⁻⁶
2.40
0.0443
0.0704
0.0443
4.22 × 10⁻¹⁰
0.5172
0.2489
−0.5202
Quadratic
8.97 × 10⁻⁷
38.07
0.9043
< 0.0001
0.9043
4.06 × 10⁻¹¹
0.9593
0.9187
0.8537
Cubic
1.13 × 10⁻⁶
0.3532
0.5743
0.9124
0.5743
2.76 × 10⁻¹⁰
0.9724
0.8710
0.0034
The statistical significance of the developed quadratic model was evaluated by ANOVA. Table 3 shows the results of ANOVA for the quadratic model. According to the results, p-value lower than 0.0001 for AD, BD, CD, and A2 indicates significant effects of the factors on the response. Moreover, the parameters C, D and C2 showed significant effects at a certainty of >99%.
Source
Sum of squares
df
Mean square
F-Value
p-value
Model
2.660 × 10⁻¹⁰
14
1.900 × 10⁻¹¹
23.60
< 0.0001
significant
A
5.796 × 10⁻¹²
1
5.796 × 10⁻¹²
7.20
0.0178
B
1.421 × 10⁻¹²
1
1.421 × 10⁻¹²
1.77
0.2052
C
1.608 × 10⁻¹¹
1
1.608 × 10⁻¹¹
19.97
0.0005
D
1.319 × 10⁻¹¹
1
1.319 × 10⁻¹¹
16.38
0.0012
AB
2.352 × 10⁻¹³
1
2.352 × 10⁻¹³
0.2921
0.5973
AC
2.220 × 10⁻¹²
1
2.220 × 10⁻¹²
2.76
0.1190
AD
2.647 × 10⁻¹¹
1
2.647 × 10⁻¹¹
32.88
< 0.0001
BC
3.803 × 10⁻¹⁴
1
3.803 × 10⁻¹⁴
0.0472
0.8311
BD
4.219 × 10⁻¹¹
1
4.219 × 10⁻¹¹
52.39
< 0.0001
CD
3.576 × 10⁻¹¹
1
3.576 × 10⁻¹¹
44.41
< 0.0001
A2
9.195 × 10⁻¹¹
1
9.195 × 10⁻¹¹
114.19
< 0.0001
B2
1.263 × 10⁻¹²
1
1.263 × 10⁻¹²
1.57
0.2309
C2
9.994 × 10⁻¹²
1
9.994 × 10⁻¹²
12.41
0.0034
D2
2.160 × 10⁻¹³
1
2.160 × 10⁻¹³
0.26383
0.6126
Residual
1.127 × 10⁻¹¹
14
8.052 × 10⁻¹³
Lack of Fit
5.465 × 10⁻¹²
10
5.465 × 10⁻¹³
0.3764
0.9043
Not significant
Pure Error
5.808 × 10⁻¹²
4
1.452 × 10⁻¹²
Total
2.773 × 10⁻¹⁰
28
Normal probability plot of the residuals and the plot of the predicted versus actual responses are shown in Fig. 6. As shown in Fig. 6a, the normal probability plot of residuals is linear that confirms the model adequacy. Also, because of the small residuals, it can be concluded that there are no possible irregularities. According to Fig. 6b, the model predicted Δi values are relatively close to the diagonal line showing goodness of fit of the developed model for predicting the electrochemical responses and confirmed that the obtained responses are very close to the predicted responses.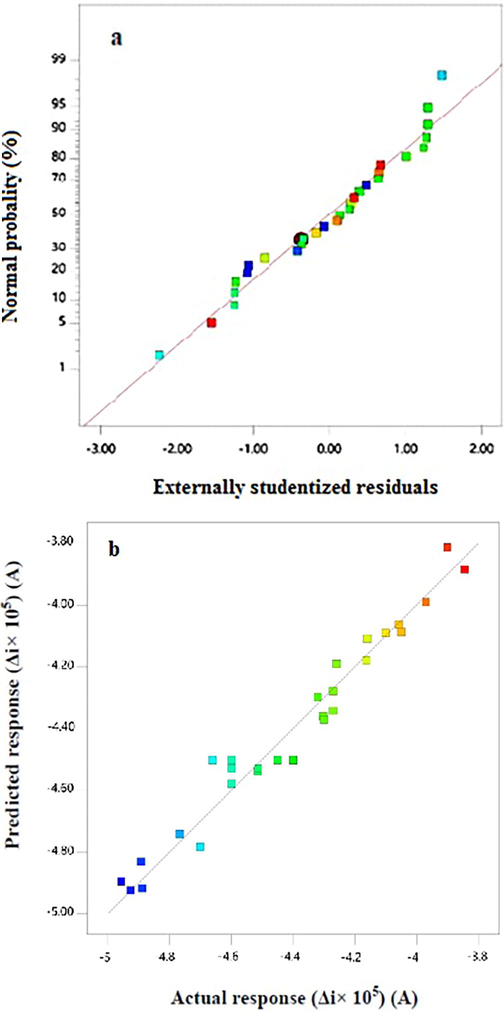
Normal probability plot of residuals (a) and plot of the residuals versus predicted responses (b).
Fig. 7 shows the perturbation plot exhibiting the effect of each of the independent variables on the response. This figure is useful to compare the effect of all factors in the experiment and each response was plotted by changing one factor over its entire range with other factors as constants (Maran and Manikandan; 2012). As shown in Fig. 7, parameter A has more deviation than B, C and D from the reference point. Also, B and C have small deviations comparatively. A steep slope or curvature in the plots suggests the sensitivity of the response factor on the variable (Oh et al., 1995).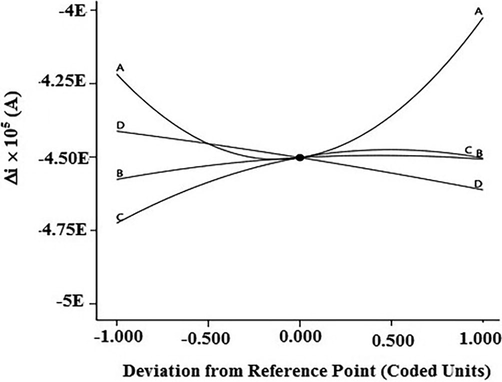
Perturbation plot showing the effects of experimental variables on the response. A: Fe2+ concentration, B: pH, C: supporting electrolyte, D: modifier/gel ratio.
The three-dimensional response surface plots for the significant two-factor interactions of AD, CD, and BD are presented in Fig. 8. The interaction effect of the modifier/gel ratio and solution pH on the response (CFe2+ = 400 µM and CKCl = 0.1 M) is shown in Fig. 8a. The plot shows that with increasing the modifier/gel ratio, the response of the electrode increased. Also, the figure indicates that pH effect on the response depends on the modifier/gel ratio. Fig. 8b shows the combined effects of modifier/gel ratio and the supporting electrolyte concentration at pH = 7.7 and CFe2+ = 400 µM. As it can be seen, the response increases by increasing the supporting electrolyte concentration and the effect of modifier/gel ratio is similar to plot a. Fig. 8c indicates the interaction effect of modifier/gel ratio and Fe2+ concentration on Δi value at pH = 7.7 and 0.1 M KCl. Obviously, the response decreases by increasing the Fe2+concentration. Also, above 430 µM of Fe2+, the response increases with increasing the concentration.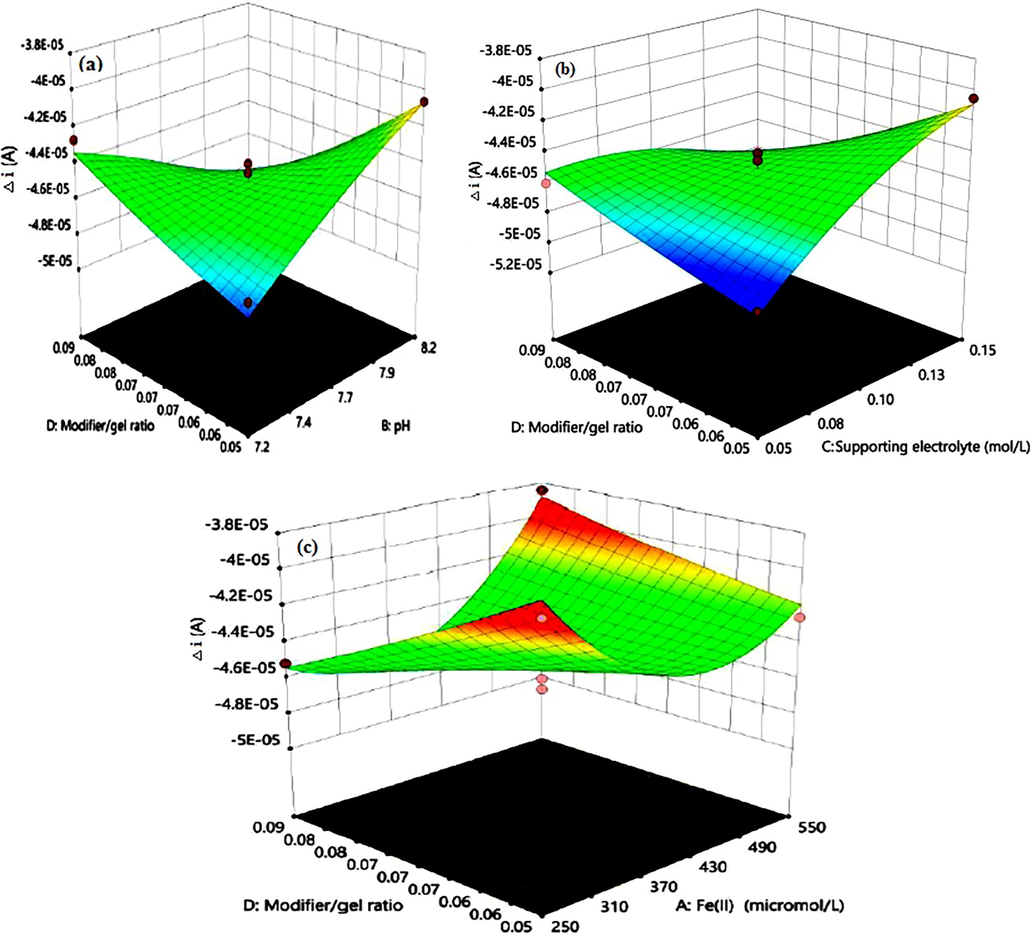
3D response surface plots for two-factor interaction effects of modifier/gel ratio and pH (a), modifier/gel ratio and supporting electrolyte concentration (b), modifier/gel ratio and Fe2+ concentration (c).
The main purpose of the response surface technique was to obtain the optimal values for each factor that cause maximum response (Δi). To obtain the optimal conditions, four model predicted experiments were conducted, and the experiment for which the response was close to the predicted answer by the design was selected. According to the percentage of error obtained, one experiment was selected as the optimal condition and was used for further experiments. Comparison of the error percentage, predicted and experimental values were shown in Table 4. Therefore, Fe2+ concentration of 402 µM, pH = 8.2; and concentration of 0.13 M for KCl as the supporting electrolyte was selected as the optimal condition.
Fe2+ (μmol L−1)
pH
Supporting electrolyte (mol L−1)
Modifier/gel ratio
Predicted Δi × 10+5
Experimental Δi × 10+5
E %
475
7.4
0.06
0.05
−5.02112
−4.5852
8.682
443
7.5
0.05
0.05
−5.0443
−4.6316
8.182
350
8.2
0.12
0.09
−5.03389
−4.935
1.964
402
8.2
0.13
0.09
−5.0349
−5.123
1.749
3.3 Electrochemical impedance spectroscopy
Surface modification of the nanosensor and injection of PAEs to its modified surface will change the resistive nature of the interface. The electrochemical impedance spectroscopy was used to touch these changes during above-mentioned steps.
Fig. 9(a) shows the Nyquist plot of the nanosensor. Based on the circuit fitting and simulation, the constructed circuit can be drawn as Fig. 9(b). Analysis of the proposed circuit resulted to these figures: total resistance (RT) = 654.8 KΩ and charge transfer resistance (RCT) = 549.4 KΩ. The Rsei assigned for solid Fe(OH)3 and electrolye interface layer due to trace formation of Fe(OH)3 in just vicinity of the bare copper surface at pH = 7.0.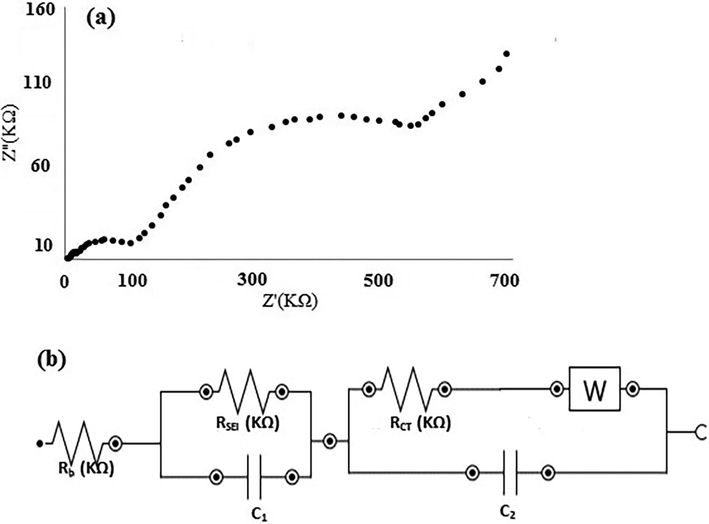
Nyquist plot of the bare copper electrode (a) and equivalent circuit model (b).
From the Nyquist plot in Fig. 10(a), it is obvious that a new element should be added to the equivalent circuit of the modified surface of a nanosensor as drawn in Fig. 10(b). The Rnanosensor element comprises the modification step and an MWCNTs/EEG paste layer. In this case, RT = 571.2 KΩ and RCT = 489.3 KΩ. The RSEI rises 1.5 times, which means well-built coverage of the bare surface of the copper electrode during the modification step. The modification step uses two materials; first, MWCNTs powder that will increase conductance as an electrocatalyst and second, EEG that amplifies not only charge transfer process but also paste conductance. These ingredients determine the resistance of prepared paste. According to above-mentioned data, the modified surface shows a −12.8% decrease in RT and −10.9% decline in RCT. The recent findings reveal the most important role of bare copper surface modification by MWCNTs/EEG, which makes electron transfer easier. This may be related to the large specific surface area, high porosity and electrocatalytic character of MWCNTs.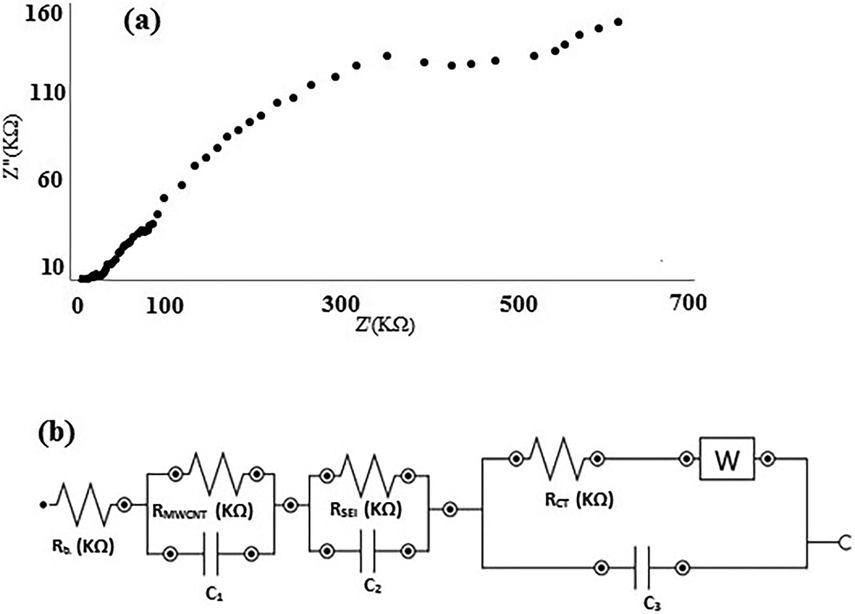
Nyquist plot of the modified electrode (a) and equivalent circuit model (b).
In Fig. 11(a), the impedance spectrum of nanosensor after blocker injection could be seen. Injection of PAEs as blockers enlarges charge transfer resistance because of their blocking effect on the nanosensor’s surface. This remarkable increase caused the RSEI to be lost inside of the semicircle part. Blocker injection not only alters the resistance (RT = 665.8 KΩ and RCT = 612.2 KΩ), but also eliminates one part of circuit as seen in Fig. 11(b). Both of surface modification and injection of blocker increase the resistance. Comparing with modified surface, these growths are equal to 16.6% in RT and 25.1% in RCT. For that reason (25.1% magnification of RCT), blocker effectively interacts with the surface of nanosensor and blocks active sites of oxidation and consequently, oxidation peak appears on the lower position in DPV. Fig. 11 and its equivalent circuit lead us to the most interesting reason of this research.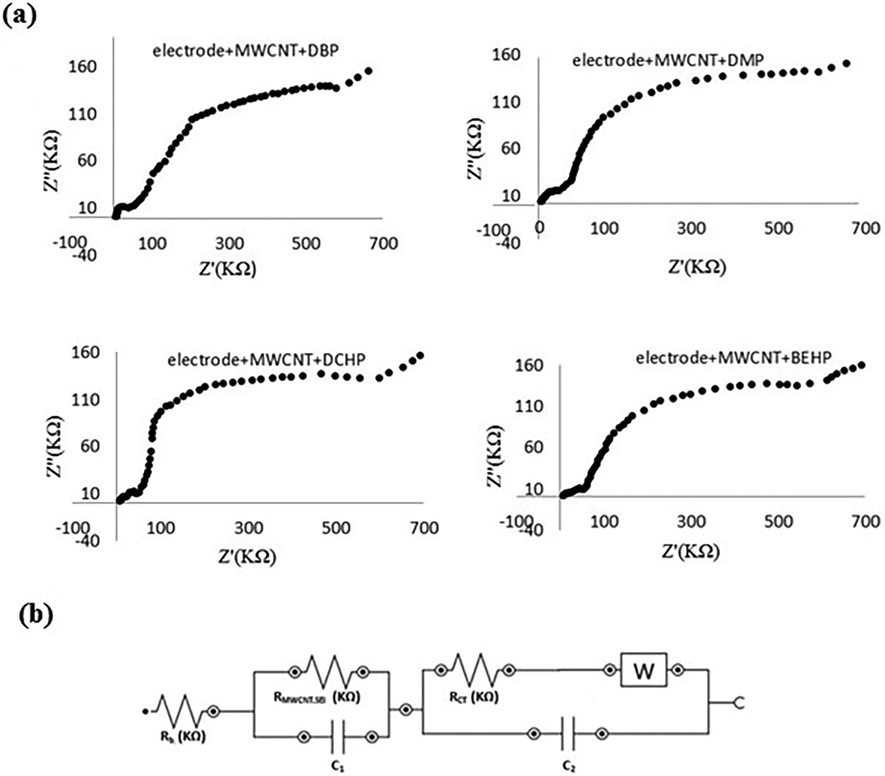
Impedance spectra of nanosensor after injection of PAEs (a) and equivalent circuit model (b).
The various RCT values for PAEs were calculated and summarized in Table 5. The results in table, confirm the existence of correlation between PAEs nature and changes in resistance (ΔRCT). In the other words, chemical structure of PAEs is a key factor affecting ΔRCT. So, this can be used in characterization of various PAEs based on ΔRCT at the same concentration level. By taking a closer look, spatial hindrance of PAEs plays major role in RCT shifts. The smaller blocker provides the better point-by-point coverage of surface that concludes the bigger shift in charge transfer resistance.
The above-mentioned results, give us exciting sign of future opportunity for developing the impedimetric nanosensor of PAEs. This nanosensor will work based on the charge transfer resistance shifts versus changes of PAEs concentration. It is clear that the small changes in carbonyl group polarity will affect ΔRCT and bring selectivity for impedimetric nanosensor of PAEs. Further research is needed to confirm these novel findings.
3.4 Electroanalytical performance of nanosensor
3.4.1 Figures of merit
The figures of merit provide valuable information about the sensitivity, precision and linear range of nanosensor. So, the figures of merit of the proposed nanosensor were determined under the optimum conditions for determination of PAEs. In this study, separate standard solutions of PAEs in the concentration range of 0.1 to 5000 µg L−1 were used as blocker and the resulted DPV signals were measured. Correlation between the response (Δi) and the concentration of PAEs via DPV used as the calibration curve. A linear relation between response and CPAEs were obtained in this range under the optimum conditions. The oxidation current was extracted from the differential pulse voltammogram and was given in Table 6 along with the concentrations of PAEs that show a good linear relationship between the oxidation current and the concentration. As shown in Fig. 12, different solutions of PAEs were used as blocker and the resulted DPV signals were measured. It was concluded that with increasing in the concentration of PAEs, the current decreases and the potential shifts to the right and positive values.
−Δi (A) × 10+5
C (μg L−1)
DBP
DMP
DCHP
DEHP
0.1
1.52
4.68
2.52
1.28
0.5
1.7
4.72
2.58
1.37
1
1.85
4.77
2.64
1.45
3
2.38
4.89
2.83
1.68
5
2.73
5.10
3.14
1.86
10
2.92
5.17
3.17
2.00
15
3.07
5.35
3.22
2.13
25
3.22
5.52
3.47
2.31
50
3.45
5.75
3.64
2.55
75
3.69
5.92
3.87
2.75
100
3.86
6.14
4.01
2.99
250
4.05
6.33
4.25
3.17
500
4.33
6.61
4.37
3.28
750
4.47
6.78
4.66
3.53
1000
5.05
6.95
4.95
3.74
5000
5.87
7.16
5.12
3.97
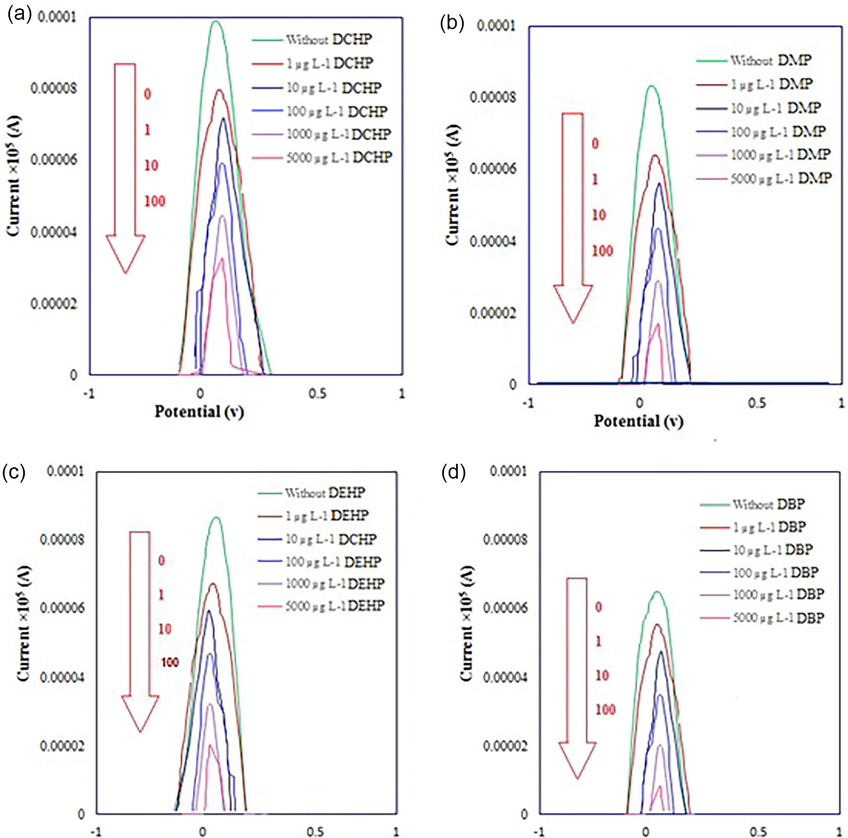
Anodic peak current of Fe2+/Fe3+ pairs after addition of PAEs as blocker to the MWCNTs modified Cu electrode. (Fe2+ concentration of 402 µM, 0.10 M KCl, pH = 8.0, modifier to gel ratio = 0.09, and 20 µL of PAEs solution).
Limit of detection and limit of quantification were obtained based on the following equations:
PAEs
LOD (µg L−1)
LOQ (µg L−1)
LDR (µg L−1)
Linear equation
Correlation coefficient (R2)
0.1–5
y = −2 × 10⁻⁶x − 2 × 10⁻⁵
0.9836
DBP
0.004
0.01
10–100
y = −1 × 10⁻⁷x − 3 × 10⁻⁵
0.9747
250–1000
y = −1 × 10⁻⁸x − 4 × 10⁻⁵
0.9252
0.1–5
y = −8 × 10⁻⁷x − 5 × 10⁻⁵
0.9875
DMP
0.009
0.03
10–100
y = −1 × 10⁻⁷x − 5 × 10⁻⁵
0.96
250–1000
y = −8 × 10⁻⁹x − 6 × 10⁻⁵
0.9813
0.1–5
y = −1 × 10⁻⁶x − 3 × 10⁻⁵
0.9888
DCHP
0.008
0.03
10–100
y = −9 × 10⁻⁸x − 3 × 10⁻⁵
0.9594
250–1000
y = −1 × 10⁻⁸x − 4 × 10⁻⁵
0.9707
0.1–5
y = −1 × 10⁻⁶x − 1 × 10⁻⁵
0.9847
DEHP
0.008
0.03
10–100
y = −1 × 10⁻⁷x − 2 × 10⁻⁵
0.9779
250–1000
y = −8 × 10⁻⁹x − 3 × 10⁻⁵
0.9800
3.5 Real samples
The real samples create a real challenge for the nanosensor. To evaluate the suitability of the proposed modified electrode for analysis of real samples, PAEs were measured in different samples including well water (Lakani Street, Rasht, Guilan, Iran), tap water (Rasht, Iran), sea water (Caspian Sea, Guilan, Iran) and river water (Shafarood River, Masal, Guilan, Iran). The samples were first filtered to remove any particulates and then were analyzed by the standard addition method. Based on the method, the water samples were separately spiked by 20 μL of each PAEs (1 µg L−1) and the DPV responses were obtained at the optimum electrochemical conditions. Table 8 indicates the results of five replicated measurements. As shown, the recovery percentages were in the range of 98.0–100.0 with RSD values ranging from 1.4 to 6.3%, which confirmed the high accuracy and precision of the proposed method for determination of PAEs in real water samples.
Sample
PAEs
Added (µg L−1)
Found (µg L−1)
Recovery%
RSD%*
Tab water
DBP
3.0
2.96 ± 0.07
98.7
2.09
DMP
1.0
0.98 ± 0.08
98.0
2.52
DCHP
1.0
0.99 ± 0.08
99.0
3.12
DEHP
3.0
2.96 ± 0.05
98.7
2.93
Sea water
DBP
3.0
2.93 ± 0.04
97.7
2.95
DMP
1.0
0.99 ± 0.08
99.0
2.74
DCHP
1.0
1.00 ± 0.05
100.0
6.32
DEHP
3.0
2.95 ± 0.05
98.3
1.68
Well water
DBP
3.0
2.96 ± 0.05
98.7
1.43
DMP
1.0
0.98 ± 0.08
98.0
2.83
DCHP
1.0
1.00 ± 0.05
100.0
6.43
DEHP
3.0
2.96 ± 0.07
98.7
2.33
River water
DBP
3.0
2.96 ± 0.07
98.7
2.09
DMP
1.0
0.98 ± 0.08
98.0
1.53
DCHP
1.0
1.00 ± 0.04
100.0
6.31
DEHP
3.0
2.96 ± 0.07
98.7
3.09
3.6 The comparative performance
In order to show the comparative efficiency of nanosensor, the obtained results were tabulated with those reported by other researchers for PAEs determination (Table 9). As shown in Table 9, the detection limits of this work stay in the range of 0.004–0.009 µg L−1 which is better than other studies. As is evident, the proposed nanosensor possesses high sensitivity and satisfactory performance for determination of PAEs in the aqueous solutions.
PAEs
Electrode
LDR (µg L−1)
LOD (µg L−1)
LOQ (µg L−1)
Correlation coefficient (R2)
Ref.
DBP
Hanging Mercury Drop Minielectrode
55.67–2783.40
–
2324.14
0.9995
Qureshi et al., 2010
DBP
Meniscus Modified Silver Solid Amalgam Electrode
556.68–27834
–
556.69
0.9978
Qureshi et al., 2010
DEHP
β-cyclodextrin–graphene hybrid composite modified glassy carbon electrode
781.10–7029.92
46.87
–
0.9960
Xiong et al., 2014
DEHP
glassy carbon electrode modified with β-cyclodextrin/graphene/1,10-diaminodecane
78.11–468.67
3.91
–
0.991
Xiong et al., 2015
DBP
nitrogen doped graphene-CoSe2/gold nanowires
0.001–1000
0.00049
–
0.9940
Li et al., 2021a,b
DMP
Molecularly imprinted electrochemical impedance sensor
1.94–194.18
0.87
–
0.9797
Bolat et al., 2019
DBP
Bimodal sensor based on Upconversion fluorescent signal
10−3 −100
0.0087
–
0.9736
Rong et al., 2021
DBP
Bimodal sensor based on surface-enhanced raman scattering signal
10−2 −100
0.0109
–
0.9813
Rong et al., 2021
DMP
DBP
DCHP
DEHPAzolla modified copper electrode
0.5–1000
0.2–0.4
0.5–1.0
>0.99
Darvishi et al., 2021
DMP
DBP
DCHP
DEHPNanosensor
0.1–1000
0.004–0.009
0.01–0.03
>0.92
This study
4 Conclusions
The voltammetric signal decrease is the opposite side of routine electrochemical sensor modification. In this side, we intentionally injected the isolating molecular blocker into a fabricated nanosensor to measure signal cutback. The major parameters including Fe2+ and supporting electrolyte concentrations, pH and MWCNTs/EEG ratio were optimized using the Box-Behnken design. After optimization, an acceptable correlation appeared in the signal cutback-PAEs concentration graph. This finding not only assesses the phthalate molecular blocking effect on differential pulse voltammetric nanosensor, but also qualifies phthalate blockers at very low concentrations. After blocker injection, the negative sites on the surface of MWCNTs electrocatalyst (O−), fall into electrostatic attraction with partially positive carbon of phthalate carbonyl groups. This phenomenon not merely blocks the negative sites (O−) of the electrocatalyst (MWCNTs), but also creates spatial hindrance on interface of the nanosensor.
Acknowledgments
The authors are grateful to Rasht Branch, Islamic Azad University for supporting this research.
Declaration of Competing Interest
The authors declare that they have no known competing financial interests or personal relationships that could have appeared to influence the work reported in this paper.
References
- Individual and competitive adsorption of phenol and nickel onto multiwalled carbon nanotubes. J. Adv. Res.. 2015;6:405-415.
- [CrossRef] [Google Scholar]
- Detection of phthalate esters in PET bottled drinks and lake water using esterase/PANI/CNT/CuNP based electrochemical biosensor. Anal. Chim. Acta. 2020;1135:175-176.
- [CrossRef] [Google Scholar]
- Effects of nanofillers on the thermo-mechanical properties and chemical resistivity of epoxy nanocomposites. J. Nanosci. Nanotechnol.. 2015;15:4255-4267.
- [CrossRef] [Google Scholar]
- Multi-walled carbon nanotubes decorated with palladium nanoparticles as a novel platform for electrocatalytic sensing applications. RSC Adv.. 2014;4:49595-49604.
- [CrossRef] [Google Scholar]
- Carbon nanotubes – the route toward applications. Science. 2002;297:787-792.
- [CrossRef] [Google Scholar]
- Molecularly imprinted electrochemical impedance sensor for sensitive dibutyl phthalate (DBP) determination. Sens. Actuators B-Chem.. 2019;299:127000-127009.
- [CrossRef] [Google Scholar]
- Determination of phthalate esters in cosmetics by gas chromatography with flame ionization detection and mass spectrometric detection. Int. J. Cosmet. Sci.. 2005;27(4):205-210.
- [CrossRef] [Google Scholar]
- Surface blocking of azolla modified copper electrode for trace determination of phthalic acid esters as the molecular barricades by differential pulse voltammetry: response surface modelling optimized biosensor. RSC Adv.. 2021;11:32630-32646.
- [CrossRef] [Google Scholar]
- Observation of single-protein and DNA macromolecule collisions on ultramicroelectrodes. J. Am. Chem. Soc.. 2015;137(26):8376-8379.
- [CrossRef] [Google Scholar]
- Novel sensitive electrochemical sensor for simultaneous determination of epinephrine and uric acid by using a nanocomposite of MWCNTs–chitosan and gold nanoparticles attached to thioglycolic acid. Sens. Actuators B-Chem.. 2014;200:251-258.
- [CrossRef] [Google Scholar]
- Preparation of SnS2/MWCNTs chemically modified electrode and its electrochemical detection of H2O2. Anal. Bioanal. Chem.. 2020;412:4403-4412.
- [CrossRef] [Google Scholar]
- New analytical method for determination of phthalates in wastewater by on Line LC-GC-MS using the TOTAD interface and fraction collector. Processes. 2021;9 (6):920-933.
- [CrossRef] [Google Scholar]
- Fabrication of multiwalled carbon nanotube-surfactant modified sensor for the direct determination of toxic drug 4-aminoantipyrine. J. Pharm. Anal.. 2015;5(4):231-238.
- [CrossRef] [Google Scholar]
- Electrosynthesis of molecularly imprinted poly-o-phenylenediamine on MWCNT modified electrode for selective determination of meldonium. Electroanal.. 2019;31:661-670.
- [CrossRef] [Google Scholar]
- Adsorptive removal of dyes from aqueous solution onto carbon nanotubes: A review. Adv. Colloid Interface Sci.. 2013;193–194:24-34.
- [CrossRef] [Google Scholar]
- Electrochemical sensor for amino acids and glucose based on glassy carbon electrodes modified with multi-walled carbon nanotubes and copper microparticles dispersed in polyethylenimine. J. Electroanal. Chem.. 2016;765:16-21.
- [CrossRef] [Google Scholar]
- Synthesis of gold nanocubes/PEI-wrinkled CoSe2 nanomaterials and its application in electrochemical immunosensors for detection of dipropyl phthalate. Rare Met.. 2021;40:1099-1109.
- [CrossRef] [Google Scholar]
- Headspace solid-phase microextraction of phthalic acid esters from vegetable oil employing solvent based matrix modification. Anal. Chim. Acta. 2007;582(1):24-33.
- [CrossRef] [Google Scholar]
- Impact of di-2-ethylhexyl phthalate metabolites on male reproductive function: a systematic review of human evidence. Curr. Environ. Health Rep.. 2018;5(1):20-33.
- [CrossRef] [Google Scholar]
- Removal of phthalates from aqueous solution by different adsorbents: A short review. J. Environ. Manage.. 2012;94(1):13-24.
- [CrossRef] [Google Scholar]
- CD/AuNPs/MWCNTs based electrochemical sensor for quercetin dual-signal detection. Biosens. Bioelectron.. 2016;77:638-643.
- [CrossRef] [Google Scholar]
- A core-shell molybdenum nanoparticles entrapped f-MWCNTs hybrid nanostructured material based non-enzymatic biosensor for electrochemical detection of dopamine neurotransmitter in biological samples. Sci. Rep.. 2019;9:13075-13087.
- [CrossRef] [Google Scholar]
- Voltammetric determination of cysteamine at multiwalled carbon nanotubes paste electrode in the presence of isoproterenol as a mediator. Chin. Chem. Lett.. 2014;25:1244-1246.
- [CrossRef] [Google Scholar]
- Preparation and characterization of novel MWCNTs/Fe-Co doped TNTs nanocomposite for potentiometric determination of sulpiride in real water samples. Sci. Rep.. 2020;10:8607-8615.
- [CrossRef] [Google Scholar]
- MWCNTs based flexible and stretchable strain sensors. J. Semicond.. 2017;38(5):053003
- [CrossRef] [Google Scholar]
- Blocking properties of gold electrodes modified with 4-nitrophenyl and 4-decylphenyl groups. J. Solid State Electrochem.. 2012;16:569-578.
- [CrossRef] [Google Scholar]
- Evaluating the characteristics of multiwall carbon nanotubes. Carbon. 2011;49:2581-2602.
- [CrossRef] [Google Scholar]
- Dual mode competitive electrochemical immunoassay for dibutyl phthalate detection based on PEI functionalized nitrogen doped graphene-CoSe2/gold nanowires and thionine-Au@Pt core-shell. Sens. Actuators B. Chem.. 2021;331:129401-129411.
- [CrossRef] [Google Scholar]
- Analysis of 16 phthalate esters in wastewater from textile plants using headspace solid-phase microextraction and gas chromatography with mass spectrometric detection. Text. Res. J.. 2021;91(3–4):306-315.
- [CrossRef] [Google Scholar]
- Application of dispersive liquid-liquid microextraction and high performance liquid chromatography for the determination of three phthalate esters in water samples. Anal. Chim. Acta. 2008;609:53-58.
- [CrossRef] [Google Scholar]
- Potassium-promoted Mo/MWCNTs catalysts for effective partial oxidation of 1-dodecanol to 1-dodecanal. Appl. Catal. A. 2015;496:79-85.
- [CrossRef] [Google Scholar]
- A simple and sensitive electrochemical sensor for rapid detection of Clostridium tetani based on multi-walled carbon nanotubes. Anal. Methods. 2016;8:8280-8287.
- [CrossRef] [Google Scholar]
- Response surface modeling and optimization of process parameters for aqueous extraction of pigments from prickly pear (Opuntia ficus-indica) fruit. Dyes Pigm.. 2012;95:465-472.
- [CrossRef] [Google Scholar]
- Size effects of multi-walled carbon nanotubes on the electrochemical oxidation of propionic acid derivative drugs: Ibuprofen and naproxen. J. Electroanal. Chem.. 2016;775:342-349.
- [CrossRef] [Google Scholar]
- Blocking properties of nickel electrodes modified with aryldiazonium compounds. Int. J. Electrochem. Sci.. 2015;10:3803-3819.
- [Google Scholar]
- Cell death and production of reactive oxygen species by murine macrophages after short term exposure to phthalates. Toxicol. Lett.. 2009;188:157-160.
- [CrossRef] [Google Scholar]
- Ce doped ZnO/f-MWCNT moss ball like nanocomposite: a strategy for high responsive current detection of L-tryptophan. Microchim. Acta. 2018;185:96-104.
- [CrossRef] [Google Scholar]
- Reliable quantification of phthalates in environmental matrices (air, water, sludge, sediment and soil): A review. Sci. Total Environ.. 2015;515–516:162-180.
- [CrossRef] [Google Scholar]
- Optimizing conditions for the growth of Lactobacillus casei YIT 9018 in tryptone-yeast extract-glucose medium by using response surface methodology. Appl. Environ. Microbiol.. 1995;61:3809-3814.
- [CrossRef] [Google Scholar]
- Chemical monitoring and temporal variation in levels of endocrine disrupting chemicals (priority phenols and phthalate esters) from selected wastewater treatment plant and freshwater systems in Republic of South Africa. Microchem. J.. 2012;101:11-23.
- [CrossRef] [Google Scholar]
- An environmentally friendly reversed-phase liquid chromatography method for phthalates determination in nail cosmetics. Anal. Chim. Acta. 2006;555:238-241.
- [CrossRef] [Google Scholar]
- Carbon nanotube based aliphatic hydrocarbon sensor. Biosens. Bioelectron.. 2007;22:829-837.
- [CrossRef] [Google Scholar]
- Highly sensitive AgNP/MWCNT/ nafion modified GCE-based sensor for the determination of heavy metals in organic and non-organic vegetables. Sci. Rep.. 2018;8:17445.
- [CrossRef] [Google Scholar]
- Advanced oxidation processes for the removal of phthalate esters (PAEs) in aqueos matrics:a review. Rev. Environ. Health 2022
- [CrossRef] [Google Scholar]
- Voltammetric determination of aliphatic phthalate esters at a hanging mercury drop minielectrode and a meniscus modified silver solid amalgam electrode. Electroanal.. 2010;22(17–18):1957-1962.
- [CrossRef] [Google Scholar]
- Surfactant assisted dispersion of functionalized multi-walled carbon nanotubes in aqueous media. Composites: Part A. 2010;41:1038-1046.
- [CrossRef] [Google Scholar]
- Curcumin-loaded magnetic chitosan-based solid-phase extraction-gas chromatography of migrated phthalate esters from pacifiers and plastic toys into baby saliva. Microchem. J.. 2022;181:107686
- [CrossRef] [Google Scholar]
- Carbon nanotubes as adsorbents in environmental pollution management: A review. Chem. Eng. J.. 2011;170:395-410.
- [CrossRef] [Google Scholar]
- Development of a bimodal sensor based on upconversion nanoparticles and surface-enhanced Raman for the sensitive determination of dibutyl phthalate in food. J. Food Compos. Anal.. 2021;100:103929-103937.
- [CrossRef] [Google Scholar]
- Tuning electrochemical bistability by surface area blocking in the cathodic deposition of copper. ACS Omega. 2018;3(10):13636-13646.
- [CrossRef] [Google Scholar]
- Reproductive toxic potential of phthalate compounds - State of art review. Pharmacol. Res.. 2021;167:105536-105552.
- [CrossRef] [Google Scholar]
- Electrochemical determination of 8-hydroxy quinoline in a cosmetic product on a glassy carbon electrode modified with 1-amino-2-naphthol-4-sulphonic acid. Instrum. Sci. Technol.. 2021;49(1):1-20.
- [CrossRef] [Google Scholar]
- A cocktail of industrial chemicals in lipstick and nail polish: profiles and health implications. Environ. Sci. Technol. Lett.. 2021;8(9):760-765.
- [CrossRef] [Google Scholar]
- Box-benken experimental design in factorial experiments: the importance of bread for nutrition and health. Turk. J. Field Crops. 2012;17(2):115-123.
- [Google Scholar]
- Electrochemical sensor for bilirubin detection using screen printed electrodes functionalized with carbon nanotubes and grapheme. Sensors. 2018;18(3):800-812.
- [CrossRef] [Google Scholar]
- Fabrication of ultralong and electrically uniform single-walled carbon nanotubes on clean substrates. Nano Lett.. 2009;9:3137-3141.
- [CrossRef] [Google Scholar]
- Ni nanoparticle anchored on MWCNT as a novel electrochemical sensor for detection of phenol. Nano. 2018;13(11):1850134-1850144.
- [CrossRef] [Google Scholar]
- From electrochemistry to electroluminescence: Development and application in a ratiometric aptasensor for aflatoxin B1. Anal. Chem.. 2017;94:7578-7585.
- [CrossRef] [Google Scholar]
- Detection of di(2-ethylhexyl) phthalate through graphene–β-cyclodextrin composites by electrochemical impedance spectroscopy. Anal. Methods. 2014;6:1736-1742.
- [CrossRef] [Google Scholar]
- Fabrication of β-cyclodextrin/graphene/1,10-diaminodecane composite on glassy carbon electrode and impedimetric method for Di(2-ethyl hexyl)phthalate determination. J. Electroanal. Chem.. 2015;743:18-24.
- [CrossRef] [Google Scholar]
- Effects of dibutyl phthalate on lipid metabolism in liver and hepatocytes based on PPARα/SREBP-1c/FAS/GPAT/AMPK signal pathway. Food Chem. Toxicol.. 2021;149:112029-112037.
- [CrossRef] [Google Scholar]
- Evaluation of exposure to phthalate esters through the use of various brands of drinking water bottled in polyethylene terephthalate (PET) containers under different storage conditions. Environ. Eng. Manag. J.. 2019;6(4):247-255.
- [CrossRef] [Google Scholar]
- Improved electrochemical performance of Fe2O3 nanoparticles confined in carbon nanotubes. J. Mater. Chem.. 2012;22:13756-13763.
- [CrossRef] [Google Scholar]
- Aqueous adsorption and removal of organic contaminants by carbon nanotubes. Sci. Total Environ.. 2014;482–483:241-251.
- [CrossRef] [Google Scholar]
- Development of a new electrochemical sensing platform based on MoO3-polypyrrole nanowires/MWCNTs composite and its application to luteolin detection. Synth. Met.. 2021;271:116620-116627.
- [CrossRef] [Google Scholar]
- Electrochemical determination of 4-nitrophenol at polycarbazole/N-doped graphene modified glassy carbon electrode. Electrochim. Acta. 2014;146:568-576.
- [CrossRef] [Google Scholar]
- Synergetic signal amplification of multi-walled carbon nanotubes-Fe3O4 hybrid and trimethyl octadecylammonium bromide as a highly sensitive detection platform for tetrabromobisphenol A. Sci. Rep.. 2016;6(1):38000-38011.
- [CrossRef] [Google Scholar]
- Electrochemical impedance spectroscopy based MEMS sensors for phthalates detection in water and juices. J. Phys. Conf. Ser.. 2013;439:12026-12038.
- [CrossRef] [Google Scholar]
- Removal of phthalate ester compound from PVC plastic samples using magnetic molecularly imprinted polymer on the surface of superparamagnetic Fe3O4 (Fe3O4@MIPs) Environ. Nanotechnol. Monit. Manag.. 2022;17:100646
- [CrossRef] [Google Scholar]
Appendix A
Supplementary material
Supplementary material to this article can be found online at https://doi.org/10.1016/j.arabjc.2023.104874.
Appendix A
Supplementary material
The following are the Supplementary material to this article:Supplementary Table S1
Supplementary Table S1


