

Translate this page into:
The diagnostic combination of serum circulating miR-488 and lncRNA AC018761 as biomarkers for hypopharyngeal squamous cell carcinoma (HPSCC)
⁎Corresponding authors. jingwanghou@163.com (Jinqian Zhang), ynkmcxb@126.com (Xianbao Cao)
-
Received: ,
Accepted: ,
This article was originally published by Elsevier and was migrated to Scientific Scholar after the change of Publisher.
Abstract
Objective
The search for rapid and effective early diagnostic markers of hypotharyngeal carcinoma becomes particularly critical and important. Therefore, we explored the value of circulating expression of non-coding RNAs for the diagnosis of early hypotharyngeal cancer.
Methods
After screening HPSCC-related research data in the NCBI-GEO database, the practical report extraction language (Perl) was used to give genes different biotype attributes. The R language limma package was utilized to analyze the differential expression of lncRNAs and mRNAs, respectively.The quantitative RT-PCR (Reverse transcription-polymerase chain reaction) analysis were performed to determine the plasma expression levels of non-coding RNAs
Results
Compared with the control groups, the differential expression of 137 lncRNAs and 297 mRNAs in the plasma of HPSCC patients was statistically significant. There were 32 differentially expressed lncRNAs, 19 differentially expressed mRNAs. The score of LncRNA AC018761 + miR-488 was AUC = 0.846, the best cut-off value was ≥ 40 points, the sensitivity was 74.58%, and the specificity was 79.88%.
Conclusion
Our results indicated that the over-expression of lncRNA-AC018761 and miR-488 were significantly up-regulated in serum of patients with HPSCC. Therefore, lncRNA-AC018761 and miR-488 maybe the non-invasive independent predictor for early HPSCC with high sensitivity and specificity.
Keywords
Circulating non-coding RNAs
hypopharyngeal squamous cell carcinoma (HPSCC)
Biomarker
Non-invasive diagnosis (NID)

1 Introduction
Hypopharyngeal carcinoma refers to a malignant tumor derived from the epithelial tissue of the laryngeal mucosa, and is one of the most malignant tumors in the head and neck tumors (Garneau et al., 2018). Hypopharyngeal carcinoma is poorly differentiated, mainly infiltrating growth, and it is easy to invade adjacent tissues and organs such as the larynx, cervical esophagus, trachea, thyroid and even the root of the oropharynx and tongue. The cervical lymph node metastasis rate of clinical N0 patients was 52.6%, and the cervical lymph node metastasis rate of clinical N1-N3 patients was 83.5% (Aupérin, 2020). Due to the lack of specific clinical manifestations in the early stage of hypopharyngeal carcinoma, it is easy to be misdiagnosed as pharyngitis or pharyngeal neurosis. Therefore, a considerable proportion of hypopharyngeal cancers are already advanced when they are first diagnosed, and the 5-year survival rate is only 40–50% (Newman et al., 2015). Moreover, hypopharyngeal squamous cell carcinoma (HPSCC) accounts for 80% of hypopharyngeal cancers (Garneau et al., 2018; Aupérin, 2020; Newman et al., 2015). At present, it is lack of targeted drug or treatment in hypopharyngeal carcinoma, but surgical resection, radiotherapy and chemotherapy are also mainly adopted. Therefore, the development of specific molecular markers and drugs for hypopharyngeal carcinoma is of great significance on the prevention and treatment of hypopharyngeal carcinoma. Moreover, the search for rapid and effective early diagnostic markers of hypotharyngeal carcinoma becomes particularly critical and important (Belics et al., 2014).
When RNA is extracted, it can be found that it contains a large number of small RNA molecules. At present, these small RNA molecules have been very clearly defined and named, namely microRNAs (miRNAs) and long non-coding RNAs (lncRNAs). In the early days, scientists thought that these small RNAs were degradation products of large RNAs, but in fact they participated in the entire process of gene expression in cells (Lee and Ambros, 2001). miRNAs are 19–25 nucleotides in length and are short-strand linear non-coding RNAs (Krichevsky et al., 2003); which regulate the gene expression of target mRNAs by binding to the 3′ untranslated region (UTR), thereby affecting various cell biological processes, including development (Baehrecke, 2003); differentiation (Chim et al., 2008) and apoptosis (Tsui et al., 2004); etc. miRNAs are significantly expressed in the hypopharyngeal carcinoma (Bartel, 2004; Sasaki et al., 2019); which suggests that they can be used as novel nucleic acid markers; so they can potentially be used to monitor the process of tumorigenesis, such as hypopharyngeal carcinoma.
Non-coding RNAs (ncRNAs) are a class of RNA molecules that do not encode proteins but regulate protein expression, such as long non-coding RNA (lncRNA), microRNA (miRNA), circular RNA (circRNA) and endogenous siRNA, etc. As a new type of non-coding RNA with a length of>200 nucleotides, lncRNA plays a role in cell cycle regulation, cell fate determination, cell differentiation regulation, chromatin remodeling and processing, and epigenetic regulation. LncRNA plays an important role and has become a hot spot in genetic research (Ghafouri-Fard et al., 2022; Li et al., 2021), especially in regulating the expression of messenger RNA (mRNA) and the pathogenesis of hypopharyngeal carcinoma (Qian et al., 2017; Xu et al., 2020; Shen et al., 2020; Liu et al., 2020). It may inhibit miRNA activity by competing with mRNA as a “sponge” miRNA; then fine-tuning the expression of miRNA-mediated target genes (mRNA), thereby affecting the occurrence and development of diseases (Bridges et al., 2021).
At present, the diagnostic markers and related technologies used for hypotharyngeal carcinoma are still very limited in terms of accuracy, especially in early stage. Therefore, there is an urgent need to explore effective, simple, fast, efficient and accurate alternative non-invasive circulatory or histological indicators to predict or diagnose hypotharyngeal carcinoma.
Although many researchers have used a variety of non-invasive markers for the diagnosis of hypotharyngeal carcinoma, especially small molecule markers of microRNA in recent years, such as microRNA-21, microRNA-375, microRNA-675, microRNA-98, and microRNA-378d, etc (Sasaki et al., 2019; Liu et al., 2020; Wang et al., 2019; Wang et al., 2020; Li et al., 2021). But; there is still no relevant combination of multiple microRNA small molecules combined with lncRNA in related research reports about the early diagnosis of hypopharyngeal carcinoma. This article aims to explore the diagnostic value and clinical significance of a variety of microRNA combined with lncRNA in hypopharyngeal carcinoma.
2 Materials and Methods
2.1 Data download and preprocessing
Hypotharyngeal carcinoma was used as the search term, and then it was entered into the database of GEO come from the National Center for Biotechnology Information (US) (https://www.ncbi.nlm.nih.gov/GEO DataSets) for searching the hypotharyngeal carcinoma-related datasets. Therefore, we got three data set GSE144711, GSE101491, and GSE117558. Then, the platform of Affymetrix Human Genome U133 (Plus 2.0 Array) was utilized to detect the human plasma samples of patient with hypopharyngeal squamous cell carcinoma (HPSCC) (Experimental group-Stage Ⅰ, n = 48), meanwhile control groups included Stage Ⅱ (n = 37) group, Stage III + IV (n = 41) group, and healthy controal (HC) group (n = 34). The preprocessed downloaded original probe matrix information and platform annotation files were used to obtain gene expression matrix information. The Practical Report and Extraction Language (Perl) was a high-level, general and dynamic programming language, and often used to give gene attributes in distinguishing between lncRNA and mRNA.
2.2 Differential expression analysis of lncRNA and mRNA
The statistical software R 3.6.2 and R language limma package were used for gene differential expression analysis. This software was based on Bioconductor specifically for processing expression profile chip data. The empirical Bayes test in the Limma software package was used to detect DEGs between the plasma of hypotharyngeal cancer patients and healthy people. The selection condition of DEGs was log fold change (logFC) > 2 or < -2, P < 0.05. And R language was used to draw heat map to visualize DEGs.
2.3 Predict miRNA and target genes and construct ceRNA network
We utilized pre-downloaded database and Perl to predict the miRNA related to each lncRNA, and then prediction software such as TargetScan, miRDB, miRTarBase, etc. were used to predict the target gene (mRNA) of miRNA, then analyzed the interaction with the differentially expressed mRNA. Moreoer, Cytoscape 3.7.2 software (Shannon et al., 2003) was used to construct a visualized ceRNA regulatory network.
2.4 GO and KEGG enrichment analysis
Gene Ontology (GO) and Kyoto Encyclopedia of Genes and Genomes (KEGG) pathway enrichment analysis were implemented for target genes in the ceRNA network (Shannon et al., 2003). The online database DAVID 6.8 (https://david.ncifcrf.gov/) (Livak and Schmittgen, 2001) was used to perform GO enrichment analysis for the biological process (BP), cell components (CC) and molecular function (MF) (https://www.geneontology.org) based on gene function annotation. R language was utilized to analyze the enrichment of KEGG pathway, and explore the signal pathway of significant enrichment of DEGs (Differential expression genes). P < 0.05 was considered statistically significant.
2.5 Patients and controls
The patients with hypopharyngeal squamous cell carcinoma (HPSCC) were performed in the department of our hospital from January 2010 to December 2020. At the same time, the data of patients were recorded and their blood samples were collected. During the same period, the data of control groups and blood samples were collected.
2.6 Expression detection of non-coding RNAs
Take 5 ml of fasting cubital venous blood from each group of subjects, centrifuge at 3,000 r/m for 10 min. Then the collection operation of liquid upper layer, the extraction of serum RNA was conducted according to the instructions of non-coding RNAs extraction kit (Thermo Fisher's TaqMan), and then non-coding RNAs were reverse transcribed into cDNA with transcription kit (Takara BIO Co., Ltd.).
Furthermore, the non-coding RNAs were detected with fluorescent quantitative kit for qRT-PCR reaction, RNU6B was used as the internal control to normalize the expression. The reaction conditions were pre-denaturation at 94 °C for 3 min, denaturation at 94 °C for 30 s, annealing at 50 °C for 30 s, and extension at 72 °C for 30 s, and 40 cycles were performed. The data was calculated using the 2-ΔΔCt method (Bar-Joseph et al., 2012). The total volume of the PCR reaction system was 20.0 µl; including 10.0 µl LightCycler 480 SYBR Green I mixture (Roche, Germany), 0.8 µl forward PCR primers (10 µM), 0.8 µl reverse PCR primers (10 µM), 1.0 µl cDNA Template (<100 ng) and 7.4 µl RNase-free water. Use LightCycler 480 (Roche, Germany) to perform quantitative PCR detection. The reaction conditions are as follows: pre-denaturation at 95 °C for 5 min; 95 °C for 12 s, 60 °C for 8 s, and 72 °C for 15 s as a cycle. 40 cycles; solubility curve analysis was 95 °C for 5 s, 65 °C for 60 s; finally cooling at 40 °C for 30 s. Each reaction was performed 6 times. The relative non-coding RNAs expression level was calculated using the CFX Manager Software v2.1 software from Bio-Rad, Germany, and the calculation method used the 2−ΔΔCt method (Bar-Joseph et al., 2012). The primer sequences were shown in Table 1.
Non-coding RNA
Primer sequences
miR-488
Upstream 5′-CCTGGCTTTTCATTCCTATGTGA-3′
Downstream 5′-GCTTCGGCAGCACATATACTAAA-3′
LncRNA-AC018761
Upstream 5′-CATTCAACGCTGTCGGTGAGT-3′
Downstream 5′-GCTGTCAACGATACGCTACGTAACG-3′
U6
Upstream 5′-TGACCTCAACTACATGGTCTACA-3′
Downstream 5′-CTTCCCATTCTCGGCCTTG-3′
2.7 Statistics
The statistical processing was performed using SPSS 26.0 and GraphPad Prism 6.0 software. The count data was expressed as a percentage ‘%’, and the measurement data was expressed by the mean ± standard deviation (x ± s). The two groups of measurement data were compared by t test, and the count data was compared by χ2 test. The logistic multiple regression model was used to analyze the relevant factors. Moreover, the relationship was analyzed by the receiver operating characteristic (ROC) curve to analyze the diagnostic efficacy of non-coding RNAs. ROC curve was drew, the area under curve (AUC), sensitivity, specificity, Youden index, and optimal cutoff value were calculated. P < 0.05 was considered statistically significant (* P < 0.05; ** P < 0.01; *** P < 0.001).
3 Results
3.1 Analysis of differential gene expression
Compared with the control group, the differential expression of 137 lncRNA and 297 miRNA in the plasma of hypotharyngeal carcinoma patients was statistically significant. Among them, 47 were up-regulated in lncRNA expression, and 90 were down-regulated. Meanwhile, there were 119 up-regulated and 178 down-regulated miRNA expression. The numbers of differentially expressed lncRNA and miRNA were shown in Table 2. The differential expression analysis of lncRNA (Table 3) and miRNA (Table 4) was shown in the volcano diagram (Fig. 1). Visualize heat maps for the differentially expressed lncRNA and mRNA parts, as shown in Fig. 2 and Fig. 3. Note: AveExpr, the average expression; B, the logarithmic value of the standard deviation obtained after Bayesian test. Note: AveExpr, the average expression; B, the logarithmic value of the standard deviation obtained after Bayesian test.
lncRNA expression logFC>2 or <-2
miRNA expression logFC>2 or <-2
Up-regulation genes
47
119
Down-regulation genes
90
178
Total sum of DEGs
137
297
LncRNA
LogFC
AveExpr
t
P
B
LINC01522
−6.08
5.18
−115.59
4.33E-16
25.76
AC005828
−5.68
4.99
−108.86
7.59E-16
25.45
AC131956
−5.34
4.83
−107.24
8.73E-16
25.37
AL162293
−5.46
4.86
−89.41
4.78E-15
24.28
LINC00566
−5.68
5.04
−87.09
6.12E-15
24.11
AC098617
6.00
5.16
81.16
1.18E-14
23.64
MRGPRF-AS1
−6.03
5.30
−73.48
3.00E-14
22.94
TMEM246-AS1
−4.41
5.81
−65.12
9.27E-14
22.02
AC018761
−3.00
6.67
−57.51
2.96E-13
21.03
AC046136
−3.23
7.41
−55.75
3.96E-13
20.77
AP003031
−2.46
7.75
−54.64
4.77E-13
20.60
AL513188
4.16
6.19
50.51
9.93E-13
19.93
LINC01494
−2.36
8.73
−50.11
1.07E-12
19.86
AC100773
2.28
7.37
48.06
1.58E-12
19.50
KIF9-AS1
2.03
9.27
48.00
1.60E-12
19.49
AC021035
2.66
5.54
47.61
1.72E-12
19.42
SRRM2-AS1
−2.21
9.04
−46.42
2.19E-12
19.19
LINC00928
4.35
4.90
46.14
2.31E-12
19.14
AC007608
−2.57
8.31
−45.43
2.67E-12
19.00
ITGA9-AS1
−2.24
8.37
−44.85
3.01E-12
18.89
miRNA
logFC
AveExpr
t
P
B
miR-let-7b
−4.97
4.62
−124.43
2.17E-16
26.13
miR-125a
−7.29
5.90
−78.24
1.67E-14
23.39
miR-499a
−2.99
8.61
−74.18
2.74E-14
23.01
miR-761
−3.62
3.96
−73.37
3.04E-14
22.93
miR-99b
−5.06
4.68
−70.73
4.28E-14
22.65
miR-488
−4.03
7.11
−69.89
4.78E-14
22.57
miR-9a
3.71
7.39
69.05
5.36E-14
22.47
miR-93
−3.11
9.77
−67.81
6.34E-14
22.34
miR-874
−4.17
4.24
−66.90
7.19E-14
22.23
miR-27a
3.70
10.36
66.81
7.29E-14
22.22
miR-4782
−3.09
6.40
−63.55
1.16E-13
21.83
miR-30c
3.85
4.14
63.02
1.26E-13
21.77
miR-4700
−3.65
3.99
−60.29
1.90E-13
21.41
miR-744
−2.52
9.15
−58.94
2.35E-13
21.23
miR-4458
4.11
8.20
58.27
2.62E-13
21.14
miR-4429
−3.50
6.73
−56.60
3.43E-13
20.90
miR-4306
2.07
8.07
54.74
4.69E-13
20.62
miR-424
−5.32
5.03
−53.99
5.33E-13
20.50
miR-let-7b
2.90
6.57
53.24
6.07E-13
20.38
miR-125a
−4.28
7.17
−53.24
6.08E-13
20.38
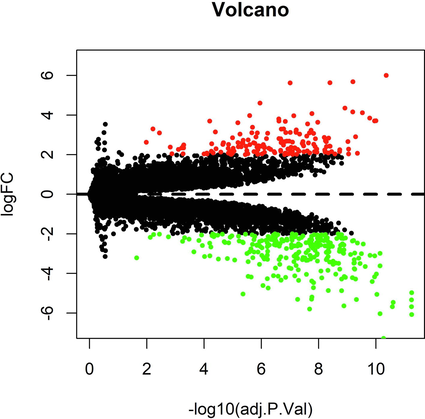
Gene differential expression profile volcano map (Red: up-regulated; green: down-regulated). The differential expression analysis of lncRNA and miRNA was performed and shown in the volcano diagram.
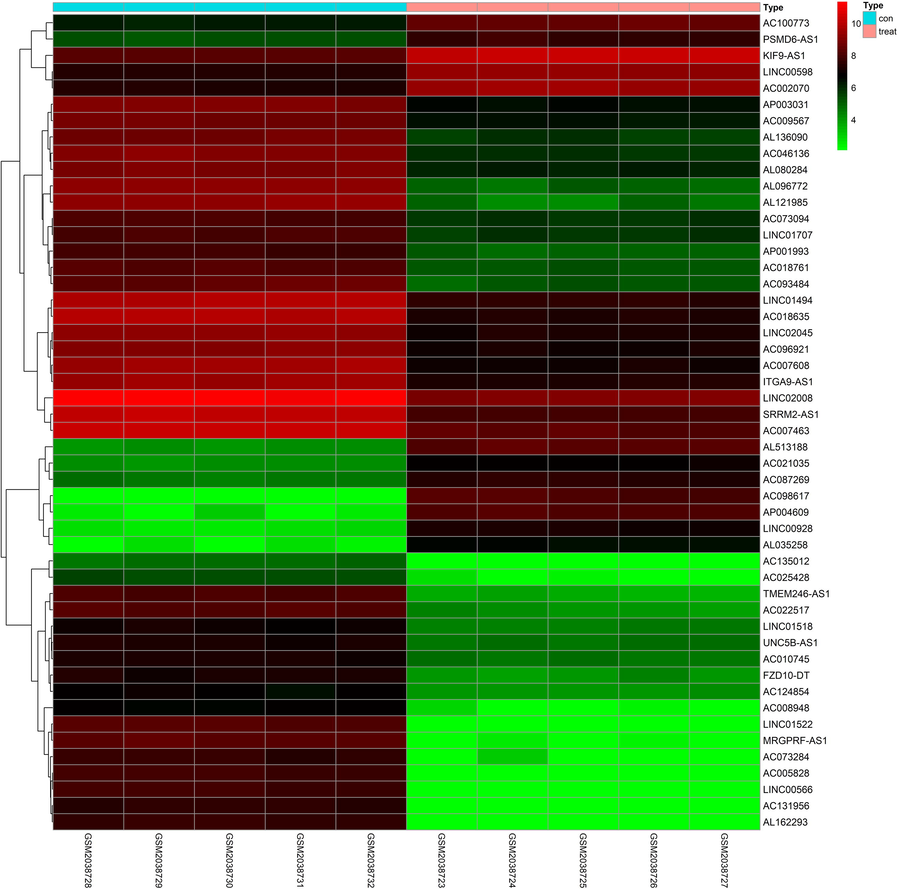
LncRNA expression profile heatmap (Top 50). It was the visualize heat maps for the differentially expressed lncRNA parts. (Con: plasma of controls; treat: plasma of hypotharyngeal cancerpatients; abscissa: sample ID; ordinate: gene symbol).
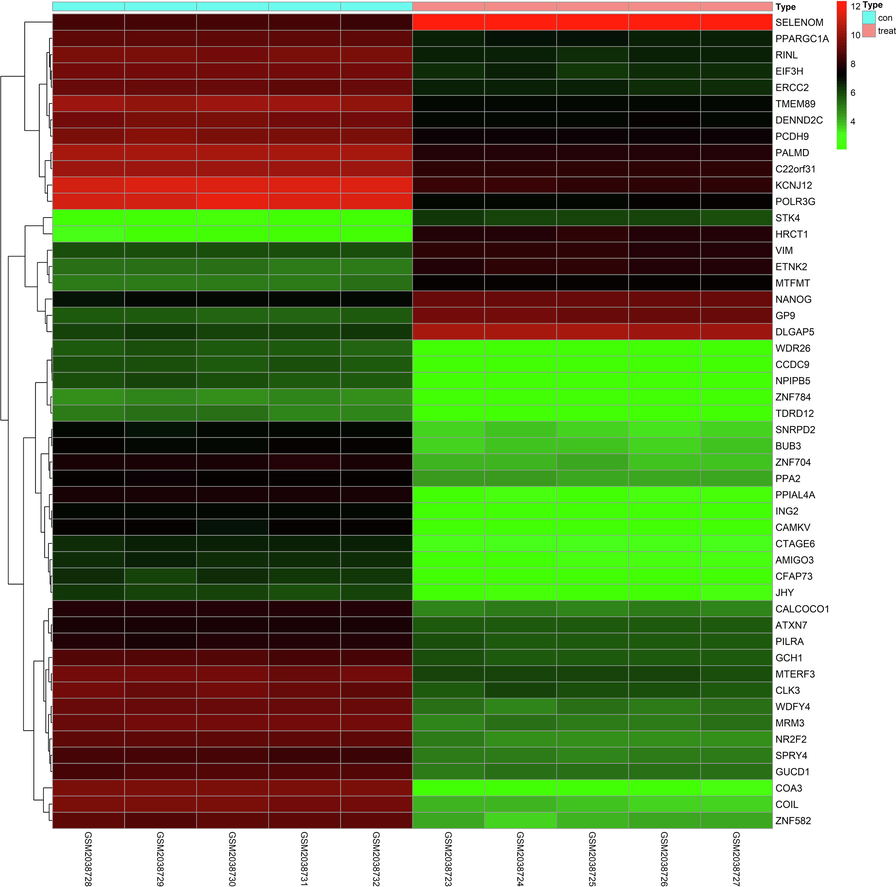
Mrna expression profile heatmap (top 50). It was the visualize heat maps for the differentially expressed mRNA parts. (Con: plasma of controls; treat: plasma of hypotharyngeal cancerpatients; abscissa: sample ID; ordinate: gene symbol).
3.2 The construction of ceRNA network
After predicting miRNA and mRNA, the ceRNA network was constructed (Fig. 4). In this figure, the purple “V” shape, the green triangle, and the cyan circle represent lncRNA, miRNA, and mRNA, respectively. In this network, there were 32 differentially expressed lncRNAs, 19 differentially expressed mRNAs, and 13 miRNAs that can simultaneously target lncRNAs and mRNAs.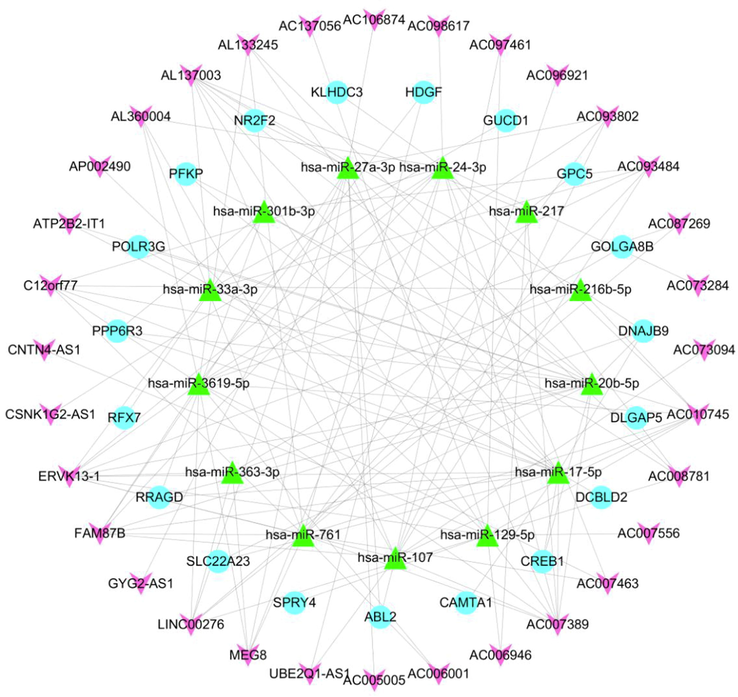
LncRNA-miRNA-mRNA ceRNA network construction. After predicting miRNA and mRNA, the ceRNA network was constructed. (Purple V, lncRNA; green triangle, miRNA; cyan circle, mRNA; connecting line: targeting interaction between genes).
3.3 GO enrichment analysis
GO enrichment analysis of the target genes in the ceRNA network indicated that the target genes were enriched into 6 different GO subsets, including two aspects of biological process (BP) and cell components (CC) with statistical significance, such as the unfolded protein response mediated by IRE1, intracellular receptor signaling pathway, cell proliferation, regulation of autophagy, nuclear chromatin, cytoplasm (Table 5 and Fig. 5). The R language ggplot2 package was used for visual presentation. Note: Category is the type of GO subset, including BP and CC; Term is the name of the GO subset; Count is the number of enriched genes; Gene Symbol is the gene name.
Category
Term
Count
P
Gene Symbol
BP
GO:0036498 ∼ IRE1-mediated unfolded protein response
3
0.00
KLHDC3, DNAJB9, HDGF
BP
GO:0030522 ∼ intracellular receptor signaling pathway
2
0.04
NR2F2, DCBLD2
BP
GO:0008283 ∼ cell proliferation
3
0.04
POLR3G, HDGF, DLGAP5
BP
GO:0010506 ∼ regulation of autophagy
2
0.04
RRAGD, ABL2
CC
GO:0000790 ∼ nuclear chromatin
3
0.01
KLHDC3, CREB1, POLR3G
CC
GO:0005737 ∼ cytoplasm
10
0.03
GOLGA8B, KLHDC3, RRAGD, SPRY4, PPP6R3, CAMTA1, DNAJB9, HDGF, DLGAP5, PFKP
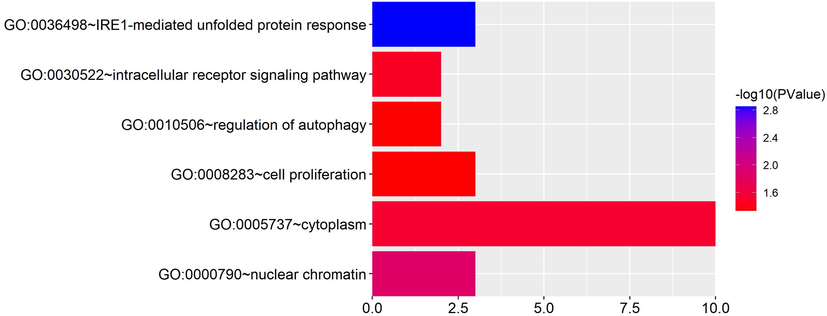
The visualization of GO enrichment analysis for target genes. GO enrichment analysis of the target genes in the ceRNA network indicated that the target genes were enriched into six different GO subsets, including two aspects of biological process (BP) and cell components (CC) with statistical significance, such as the unfolded protein response mediated by IRE1, intracellular receptor signaling pathway, cell proliferation, regulation of autophagy, nuclear chromatin, cytoplasm. (Abscissa: number of genes; ordinate: GO Term).
3.4 KEGG enrichment analysis
KEGG pathway enrichment analysis was performed on the target genes in the ceRNA network, and it was found that the target genes were enriched in the glucagon signaling pathway, AMPK signaling pathway, vasopressin-regulated water reabsorption, and renin secretion circadian rhythm and other 20 signal pathways (Table 6 and Fig. 6) with statistically significant. For the above KEGG pathways that met the requirements, part of the visual presentation was performed with the R language. Note: KEGG ID is the pathway ID; Term is the pathway namet; Count is the number of enriched genes; Gene Symbol is the gene name.
KEGG ID
Term
P
Gene Symbol
Count
hsa04922
Glucagon signaling pathway
0.00
PFKP, CREB1
2
hsa04152
AMPK signaling pathway
0.00
PFKP, CREB1
2
hsa00030
Pentose phosphate pathway
0.02
PFKP
1
hsa00052
Galactose metabolism
0.02
PFKP
1
hsa03020
RNA polymerase
0.02
POLR3G
1
hsa04710
Circadian rhythm
0.02
CREB1
1
hsa00051
Fructose and mannose metabolism
0.02
PFKP
1
hsa04962
Vasopressin-regulated water reabsorption
0.03
CREB1
1
hsa05030
Cocaine addiction
0.03
CREB1
1
hsa05416
Viral myocarditis
0.04
ABL2
1
hsa04623
Cytosolic DNA-sensing pathway
0.04
POLR3G
1
hsa04927
Cortisol synthesis and secretion
0.04
CREB1
1
hsa00010
Glycolysis/Gluconeogenesis
0.04
PFKP
1
hsa04924
Renin secretion
0.04
CREB1
1
hsa05031
Amphetamine addiction
0.04
CREB1
1
hsa05230
Central carbon metabolism in cancer
0.04
PFKP
1
hsa01230
Biosynthesis of amino acids
0.04
PFKP
1
hsa04918
Thyroid hormone synthesis
0.04
CREB1
1
hsa04612
Antigen processing and presentation
0.04
CREB1
1
hsa03018
RNA degradation
0.04
PFKP
1
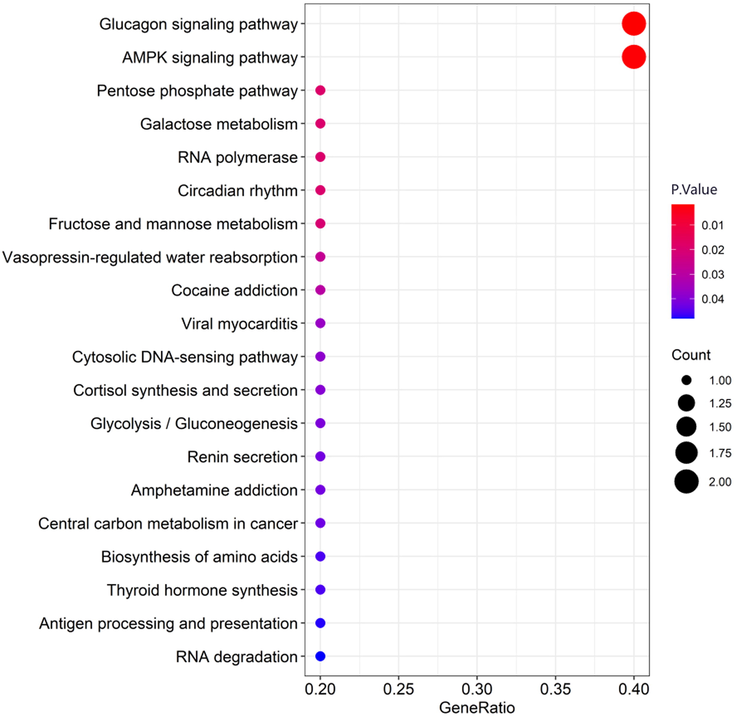
Partial visualization of KEGG pathway enrichment analysis for target genes (The bubble plot). KEGG pathway enrichment analysis was performed on the target genes in the ceRNA network, and it was found that the target genes were enriched in the glucagon signaling pathway, AMPK signaling pathway, vasopressin-regulated water reabsorption, and renin secretion circadian rhythm and other 20 signal pathways. (Count: number of enriched genes; GeneRatio: number of enriched genes/number of background genes).
3.5 Identification of biomarkers
Biomarkers were identified from the ceRNA network, including: nine lncRNAs, namely up-regulated FAM87B, AL133245, AC018761, and down-regulated AL137003, C12orf77, AC010745, ATP2B2-IT1, AC007389, ERVK13-1. Besides, there were three miRNAs, namely hsa-miR-20b-5p, hsa-miR-17-5p, and hsa-miR-488.
Furthermore, the qRT-PCR experiments were conducted, these results demonstrated that the expression of lncRNA-AC018761 (Fig. 7) and miR-488 (Fig. 8) in patients (Stage Ⅰ) were both significantly higher than the control groups, including Stage Ⅱ, Stage III + IV, and HC (Healthy control) groups. But, there was no obviously difference among Stage Ⅱ, Stage III + IV, and HC groups about the expression level of lncRNA-AC018761 (Fig. 7) or miR-488 (Fig. 8).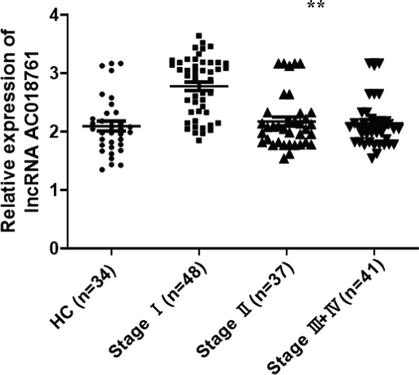
The qRT-PCR result of lncRNA-AC018761 expression levels. The qRT-PCR experiments were conducted, the result demonstrated that the expression of lncRNA-AC018761 in patients (Stage Ⅰ) was significantly higher than the control group (P < 0.01), even patients (Stage Ⅱ and III + IV) (P < 0.01). But, its expression levels in patients (Stage Ⅱ and III + IV) was slightly higher than the healthy control (HC) group (P > 0.05).
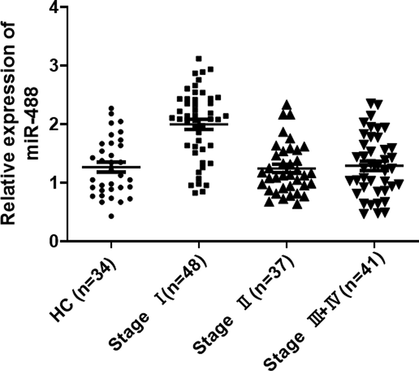
The qRT-PCR result of miR-488 expression levels. The qRT-PCR experiments were conducted, the result demonstrated that the expression of miR-488 in patients (Stage Ⅰ) was significantly higher than the control group (P < 0.01), even patients (Stage Ⅱ and III + IV) (P < 0.01). But, its expression levels in patients (Stage Ⅱ and III + IV) was slightly higher than the healthy control (HC) group (P > 0.05).
3.6 The assessment of diagnostic predictive value
According to the ROC curve, the score of LncRNA AC018761 + miR-488 was AUC = 0.846, miR-488 was AUC = 0.798, and LncRNA AC018761 was AUC = 0.802. There was no statistically significant difference in the AUC of the three scoring systems (P > 0.05, Table 7). The ROC curve was shown in Fig. 9.
Index
Optimal cutoff value
AUC
95% CI
Sensitivity (%)
Specificity (%)
Youden index
LncRNA AC018761 + miR-488
≥40
0.846
0.784–0.908
74.58
79.88
0.545
miR-488
≥16
0.798
0.729–0.868
76.27
71.14
0.474
LncRNA AC018761
≥158
0.802
0.735–0.870
69.49
83.09
0.526
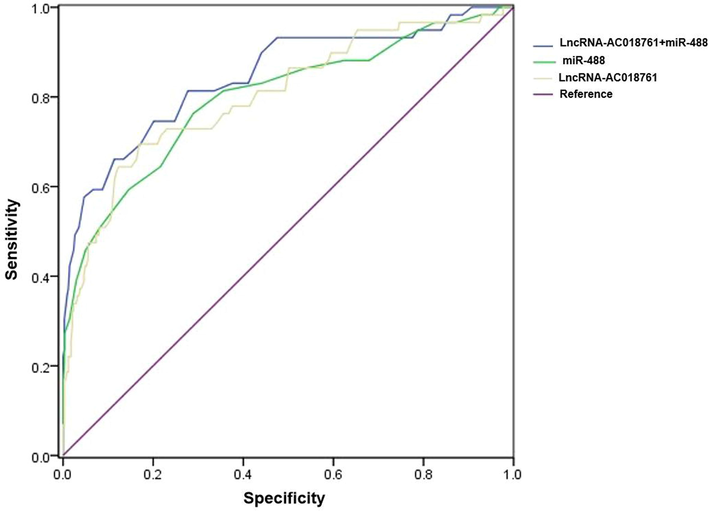
The assessment of diagnostic predictive value. According to the ROC curve, the score of LncRNA AC018761 + miR-488 was AUC = 0.846, miR-488 was AUC = 0.798, and LncRNA AC018761 was AUC = 0.802.
4 Discussion
In breif, our work explored a single serum independent diagnostic marker or its combination for early diagnosis of hypopharyngeal squamous cell carcinoma (HPSCC). Through the bioinformatics analysis, we first obtained the patient's plasma lncRNA, mRNA gene expression profile. Moreover, among the differentially expressed lncRNA, mRNA and miRNAs that could target each other at the same time. Besides, a ceRNA regulatory network was successfully constructed, from which the targeted regulation of the lncRNA-miRNA-mRNA axis could be clearly and intuitively analyzed. In this network, there were 32 differentially expressed lncRNAs, 19 differentially expressed mRNAs, and 13 miRNAs that could simultaneously target lncRNAs and mRNAs. Then we conducted enrichment analysis on 19 target gene mRNAs in the network, and found that they were enriched into six different GO subsets, including biological processes (BP) and cellular components (CC), such as IRE1-mediated unfolded protein response, intracellular receptor signaling pathway, cell proliferation, regulation of autophagy, nuclear chromatin, and cytoplasm.
Biological processes are often dynamic, thus researchers must monitor their activity at multiple time points. The most abundant source of information regarding such dynamic activity is time-series gene expression data. These data are used to identify the complete set of activated genes in a biological process, to infer their rates of change, their order and their causal effects and to model dynamic systems in the cell (Giraldo et al., 2019). In-depth characterisation of each of the cellular components in cancer has shed light on the convoluted network of interactions between the numerous components within a tumour mass (Wang and Li, 2019).
Hypopharyngeal squamous cell carcinoma (HPSCC) is an intricately process of protein, RNA and other biological molecules, involving a wide range of molecular responses, signal transduction, and cell proliferation. There are several enriched genes in each of the above subsets, which suggested that these biological processes or cell components and their enriched genes or protein molecules might play an important role in the occurrence and development of hypopharyngeal squamous cell carcinoma (HPSCC). Further analysis of the KEGG pathway showed that the target genes were mainly enriched in 20 signal pathways including glucagon signaling pathway, AMPK signaling pathway, vasopressin-regulated water reabsorption, renin secretion, and circadian rhythm.
There are many different signaling pathways that contribute to development and cellular homeostasis. In diseases, especially cancer, development components of these pathways often become mutated or overexpressed causing dysregulation of cellular signaling. Cell signaling is the “catch-all” phrase that provides an overview of the communication system and is often linked to a single signaling pathway. In this one simple term, there is a sense of cells communicating with one another and changing their behavior as a result of such communication. This ability of cells to sense external signals and respond to them is a basic requirement for tissue development and repair, immunity, and homeostasis. Signal transduction defines the precise series of molecular events that occur to convert an external stimulus into a cellular response (Wu et al., 2023).
Through analyzing the expression profile of the gene chip, we obtained the differential expression profile of lncRNA and mRNA, and constructed a ceRNA network. Through enrichment analysis of the differential target genes in the network, we explored the possible association with the occurrence and development of hypopharyngeal squamous cell carcinoma (HPSCC), and there were night lncRNAs upstream of the lncRNA-miRNA-mRNA axis, namely the up-regulated FAM87B, AL133245, AC018761 and down-regulated AL137003, C12orf77, AC010745, ATP2B2-IT1, AC007389 and ERVK13-1 might compete with CREB1 and PFKP to bind hsa-miR-20b-5p, hsa-miR-17-5p, and hsa-miR-488. Thereby, it affected the expression of the three miRNAs on the target genes CREB1 and PFKP, and down-regulating the latter expression levels, which played a key role in the pathogenic mechanism of hypopharyngeal squamous cell carcinoma (HPSCC).
The cyclic-AMP-responsive element (CRE)-binding protein (CREB) family of transcription factors has been implicated in many processes, including memory formation and maintenance, circadian rhythms and cell survival in vitro. There are three members of the CREB family-CREB, CRE-modulatory protein (CREM) and activating transcription factor 1 (ATF1). These proteins activate transcription by binding to CREs in the promoter regions of target genes [28].
In this work, the results of qRT-PCR experiments indicated the over-expression of lncRNA-AC018761 and miR-488 maybe the independent predictor for early hypopharyngeal squamous cell carcinoma (HPSCC) with high sensitivity and specificity. This work had certain reference value for further understanding of the pathophysiological process of hypopharyngeal squamous cell carcinoma (HPSCC), and provided experimental theoretical basis for exoloring the novel therapeutic targets.
For the first time, our research group studied the clinical application value of circulating non-coding RNA as a non-invasive diagnostic marker for patients with hypopharyngeal squamous cell carcinoma (HPSCC) through experiments with a certain sample size. However, this study still had certain limitations due to many reasons, that is, the experimental sample was a single center, the sample size was limited, and so on. In addition, this research group will perform the further research on related mechanisms of HPSCC and carrying out comprehensive multi-center clinical research work in future.
CRediT authorship contribution statement
Jiahong Pei: Conceptualization, Methodology, Data curation, Writing – original draft. Jinqian Zhang: Conceptualization, Methodology, Data curation, Writing – original draft. Tianshu Li: Data curation, Writing – original draft. Cun Feng: Visualization, Investigation. Yanfei Guan: Software, Supervision. Shunmin Gong: Writing – review & editing. Xianbao Cao: Conceptualization, Methodology, Data curation, Writing – original draft.
Acknowledgement
Not applicable.
Statement of Ethics
This study was approved by the Medical Research Ethics Committee of the The First People’s Hospital of Yunnan Province, The Affiliated Hospital of Kunming University of Science and Technology. Each patient was gave informed consent and signed a written informed consent form.
Funding Sources
This work was supported by grants from the Science and Technology Plan Project Funds of Yunnan Province (No. 202001AY070001-126), Kunming University of Science and Technology Medical Joint Project (KUST-KH2022038Y), and the Key Basic Research Program of Yunnan Province (No. 202201AS070065).
Declaration of Competing Interest
The authors declare that they have no known competing financial interests or personal relationships that could have appeared to influence the work reported in this paper.
References
- Epidemiology of head and neck cancers: an update. Curr. Opin. Oncol.. 2020;32:178-186.
- [Google Scholar]
- Studying and modelling dynamic biological processes using time-series gene expression data. Nat. Rev. Genet.. 2012;13:552-564.
- [Google Scholar]
- Detection and characterization of placental microRNAs in maternal plasma. Clin. Chem.. 2008;54:482-490.
- [Google Scholar]
- A microRNA array reveals extensive regulation of microRNAs during brain development. RNA. 2003;9:1274-1281.
- [Google Scholar]
- An extensive class of small RNAs in Caenorhabditis elegans. Science. 2001;294:862-864.
- [Google Scholar]
- Roles and mechanisms of exosomal non-coding RNAs in human health and diseases. Signal Transduct. Target. Ther.. 2021;6:383.
- [Google Scholar]
- Differentially-expressed mRNAs, microRNAs and long noncoding RNAs in intervertebral disc degeneration identified by RNA-sequencing. Bioengineered. 2021;12:1026-1039.
- [Google Scholar]
- Inhibition of long non-coding RNA MALAT1 elevates microRNA-429 to suppress the progression of hypopharyngeal squamous cell carcinoma by reducing ZEB1. Life Sci.. 2020;262:118480
- [Google Scholar]
- Analysis of relative gene expression data using real-time quantitative PCR and the 2(-Delta Delta C(T)) Method. Methods. 2001;25:402-408.
- [Google Scholar]
- Survival trends in hypopharyngeal cancer: a population-based review. Laryngoscope. 2015;125:624-629.
- [Google Scholar]
- Upregulation of the long noncoding RNA UCA1 affects the proliferation, invasion, and survival of hypopharyngeal carcinoma. Mol. Cancer. 2017;16:68.
- [Google Scholar]
- Biliary reflux as a causal factor in hypopharyngeal carcinoma: New clinical evidence and implications. Cancer. 2019;125:3554-3565.
- [Google Scholar]
- Cytoscape: a software environment for integrated models of biomolecular interaction networks. Genome Res.. 2003;13:2498-2504.
- [Google Scholar]
- Expression of the long noncoding RNA RP11-169D4.1-001 in Hypopharyngeal Squamous cell carcinoma tissue and its clinical significance. J. Clin. Lab. Anal.. 2020;34:e23019.
- [Google Scholar]
- Systematic micro-array based identification of placental mRNA in maternal plasma: Towards non-invasive prenatal gene expression profiling. J. Med. Genet.. 2004;41:461-467.
- [Google Scholar]
- CD36 tango in cancer: signaling pathways and functions. Theranostics.. 2019;9:4893-4908.
- [Google Scholar]
- MicroRNA-98/PTEN/AKT pathway inhibits cell proliferation and malignant progression of hypopharyngeal carcinoma by MTDH. Oncol. Rep.. 2019;41:863-874.
- [Google Scholar]
- MALAT1 knockdown inhibits hypopharyngeal squamous cell carcinoma malignancy by targeting microRNA-194. Oncol. Lett.. 2020;20:173-182.
- [Google Scholar]
- The TRPM7 channel reprograms cellular glycolysis to drive tumorigenesis and angiogenesis. Cell Death Dis.. 2023;14:183.
- [Google Scholar]
- Blocking long noncoding RNA MALAT1 restrained the development of laryngeal and hypopharyngeal carcinoma. Eur. Arch. Otorhinolaryngol.. 2020;277:611-621.
- [Google Scholar]


