

Translate this page into:
Multi-scale pore structure transformation of shale under mixed acid acidification method
⁎Corresponding authors at: School of Safety Engineering, China University of Mining & Technology, Xuzhou, Jiangsu 221116, China. wangliang@cumt.edu.cn (Liang Wang), cumtsafe@cumt.edu.cn (Qingquan Liu)
-
Received: ,
Accepted: ,
This article was originally published by Elsevier and was migrated to Scientific Scholar after the change of Publisher.
Abstract
Most of the acid fluids used in the existing acidfrac process have the shortcomings of plugging pores, polluting formation and poor effect. The method of adding nitric acid in a specific proportion to conventional acid can avoid the above problems to a certain extent. A mixture of HCl: HF: HNO3 (3:1:1) was used to acidize the shale of the Longmaxi Formation in Sichuan and the Piyuancun Formation in Jiangxi for 24 h. The mineral fractions and pore structures of the samples were then analyzed using scanning electron microscopy-energy dispersive spectrometry, X-ray diffraction, low-pressure nitrogen adsorption, and nuclear magnetic resonance. The results showed that by reducing the mineral constituents of shale, the 2–15-nm sized pores decreased, 1–10-μm sized pores increased, and fractal dimensions decreased. The mixed acid solution caused cross-scale porosity expansion in the shale and increased gas circulation within the matrix. The process of acid mixing in the shale pore structure was divided into four stages: surface dissolution, macroporous dissolution, meso–microporous dissolution, and feedback dissolution.
Keywords
Mixed acid acidification method
Shale
Mineral constituent
Pore structure
Pore size distribution characteristic

1 Introduction
As a clean and efficient energy source, the development of shale gas, which is composed of organic-rich shale (Yu and Sepehrnoori 2013, Sun et al., 2021), could effectively alleviate the natural gas shortage. Global shale gas production is growing at an average annual rate of 17%, reaching 7688 × 108 m3 in 2020, and accounting for 19.9% of global natural gas production (BP 2021). China, the world’s largest energy consumer with the most shale gas resources (Wang 2010, Administration and Kuuskraa 2011), has effectively exploited its resources in recent years, and shale gas production has sustained rapid growth (Dai et al., 2020a, 2020b). In 2010, China’s shale gas production was expected to reach 200 × 108 m3 by 2020 (Sun et al., 2021). Shale reservoirs, as storage sites for shale gas, have the characteristics of autogenous self-storage, high density, and low permeability (Perry and Lee 2007). The complex pore structure of shale is key to determining the quality of reservoirs and evaluating the potential of shale gas resources. The volume and connectivity of shale pores and fractures significantly influence gas transport, percolation, and storage (Sun et al., 2019). Therefore, studying shale pore structure and physical parameter characteristics is important for shale gas recovery. In the commercial exploitation of shale gas, shale reservoir pores and fracture structures are modified primarily by hydraulic fracturing, which is used as a representative reservoir modification technology to enhance the permeability of shale reservoirs and the recovery ratio of shale gas.
Although hydraulic fracturing has been effective in increasing permeability, related problems such as the lack of water resources in most areas of China where shale gas accumulates and the depth of the reservoirs involved make it not entirely suitable for shale gas development (Gao et al., 2021). Shale reservoirs generally contain high amounts of clay minerals, calcite, dolomite, and pyrite, that easily react with acids. Therefore, instead of conventional hydraulic fracturing fluids, acid fracturing fluids can be used to enhance the permeability of shale reservoirs by demineralizing shale (Mohtarami et al., 2017, Hou et al., 2019, Wang et al., 2021a, 2021b). Numerous studies have been conducted on shale and mineral acidification using various acids under different conditions. To study the dissolution rate of minerals at different temperatures and pH values, Alkattn et al. (Alkattan et al., 1998) used hydrochloric acid (HCl) for single-component limestone and calcite and determined that the mineral dissolution rate increased with increasing pH and temperature. Al-Harahsheh et al. (Al-Harahsheh et al., 2009) used four types of acids on shale samples and found that they significantly reduced the carbonate mineral content and improved gas production rates. Gai et al. (Gai et al., 2014) found that HCl did not destroy the organic matter inside the Longkou shale after acidization. Liu et al. (Liu et al., 2022) determined that the porosity and pore structure of shale significantly improved after the composite effect of pressure and HCl treatment. These studies show that acid improves shale permeability by changing the mineral constituents and porosity characteristics of shale. However, most current shale acidizing studies have focused on dilute HCl or other simple acid systems. In contrast, nitric acid (HNO3) and mixed earth acids have often been studied in other acidizing studies on similar unconventional gas reservoirs such as coal and sandstone (Zhao et al., 2018, Ni et al., 2020). These other acidic systems often have different effects on reservoir permeability enhancement processes, and may be some shortcomings such as plugging pores, polluting strata and poor anti-reflection effect. At present, the research on mixed-acid systems mainly focuses on acidizing technology of sandstone, and it is mainly the mixing of HCl and HF (Li et al., 2016). Some scholars have also conducted comparative studies on the effect of mixed-acid system of HCl and organic acids (such as acetic acid, formic acid, phosphoric acid, etc.) (Shafiq et al., 2013), or the mixed-acid system of HF and organic acids on sandstone (Yang et al., 2012, Leong and Ben Mahmud 2019). However, there is still a lack of research on the effect of mixed-acid systems related to HNO3 on sandstone and other rocks. Therefore, studying the effects and mechanisms of different mixed-acid systems on the mineral constituents and microscopic pore structures of shale based on existing successful acid permeation systems is essential to enhance the acidification and permeation of shale reservoirs.
Unlike conventional rock reservoirs, shale pore networks mainly consist of organic matter (OM) and inorganic mineral pores (Zhang et al., 2019). Loucks et al. (Loucks et al., 2012) classified pores within shale into mineral matrix interP pores, mineral matrix intraP pores, and intraP OM pores based on the location of the pores in relation to the particles. Sun et al. (Sun et al., 2020) classified pores as transport, dead-end, and closed. Although scholars have classified shale pores differently because of different research focuses, the methods of studying pore structure are consistent and are usually based on piezometry, nitrogen (N2) adsorption, scanning electron microscopy (SEM), nuclear magnetic resonance (NMR), and computed tomography (Chen et al., 2016, Liu et al., 2018, Shi et al., 2018, Liu et al., 2019, Zhang and Chen 2020, Zhang et al., 2021). N2 adsorption can effectively reflect mesopore distribution characteristics. SEM can directly observe the distribution of large pores on the surface. In recent years, NMR has been widely used to determine shale pore structures owing to its “comprehensive, nondestructive, and rapid” characteristics (Yao et al., 2010).
In this study, a mixed acid acidification method formed by adding HNO3 to earth acids was applied to shale, and its effect on the shale mineral fraction and multi-scale pore structure distribution characteristics was investigated. The mineral constituents of shale were determined using X-ray diffraction (XRD). The surface and pore characteristics of the shale surface were observed using SEM-energy dispersive spectrometry (EDS). The mesopore size characteristics were analyzed using low-pressure N2 adsorption. Finally, NMR was used to further demonstrate macropore size variations.
2 Experiment
2.1 Sample preparation
The Upper Auriferous Piyuancun Formation outcrop shales in the Jiurui Basin, Jiangxi Province, and the Lower Silurian Longmaxi Formation shales in the Sichuan Basin, Sichuan Province, both of them are marine sedimentary organic-rich shales, gray-black and dense in Jiangxi (JX) and black in Sichuan (SC). The original bulk samples and sampling sites of the two shales are shown in Fig. 1. For various experimental studies before and after acidification, the fresh, unweathered shale blocks at the bottom of the outcrop were collected first. The shale was crushed and sieved into powder of<325 mesh and 60–80 mesh, as well as drilled, cut and polished along the lamination direction to make cylinders of diameter 25 mm and height 50 mm, and cubes of 5 mm in length and width, respectively. Due to the heterogeneity of shale, pre-acidification and post-acidification tests used the same group of samples before and after acidification to ensure accurate results.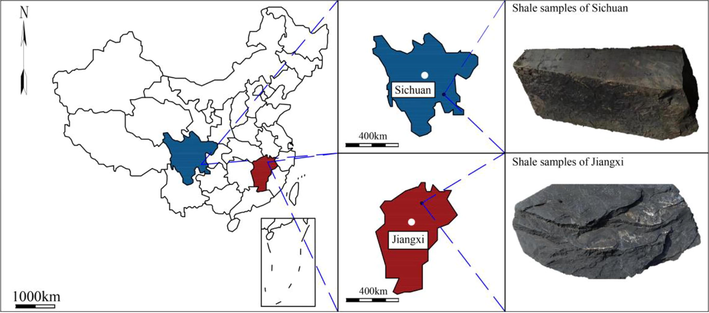
Sampling location.
2.2 Acidizing treatment
In conventional oil and gas reservoirs, mud acid, a mixture of 10–15% hydrochloric acid (HCl) and 3–8% hydrofluoric acid (HF), is often used for acidization. However, intermediate products, such as silica gel and fluoride salts, produced during the reaction between HF and minerals usually block the pore throats of shales, which not only limit the effects of acid dissolution but also causes permanent secondary damage to shale reservoirs. When HNO3 is injected into a certain proportion of mud acid, “Aqua regia” (HNO3: HCl = 1:3) is simultaneously formed. It has strong oxidation capacity, can react with most metals and metal oxides, and can strongly dissolve local blockades without damaging the formation structure. Moreover, in the actual application process, solid powdered HNO3 is usually injected into the formation first and then into the soil acid. HNO3 has no contact with HCl in the ground or during the injection process and has little corrosive effect on the equipment and pipelines, ensuring construction safety in the acidization and reflection improvement process. Overall, the method of adding HNO3 to conventional soil acid to form a HNO3-acidizing system has the advantages of removing inorganic clogging, penetrating deep pores, and reducing secondary pollution.
Therefore, this experiment chooses to add 3% HNO3 solution to the conventional earth acid mixed with 12% HCl and 3% HF to form a nitric acid acidification system of HCl: HF: HNO3 = 3:1:1. While HCl and HF play their original roles, HNO3 reacts with the intermediate products to prevent the pore throat of the sample from being clogged, and the reaction equation is (Liu et al., 2005):
The different samples from the SC and JX groups were placed in different plastic test tubes and a pre-configured acid mixture (12% HCl + 3% HF + 3% HNO3) was injected into the test tubes to completely submerge the samples. The caps of the test tubes were tightened after applying plastic wrap to prevent the acid from evaporating. After placing all tubes in a fume hood for 24 h at 20 ℃ and 101 kPa, the samples were washed with anhydrous ethanol after acidification.
2.3 Analysis methods
The JX and SC samples before and after acidification were characterized by four analytical methods: SEM-EDS, XRD, N2 adsorption and NMR. COMPACT with a resolution of 2 nm@30 kV and a magnification of 2 k, was used to watch the surface and pore structure of the shale (the same surface center was photographed before and after acidification to enhance comparability), and the SEM images were thresholded and binarized to quantify the changes in the surface morphology and pore structure of the shale. At the same time, the complete surface of the sample was scanned by energy dispersive spectrometer (EDS), and the content of surface elements was quantitatively analyzed. Powder samples with particle size less than 325 mesh were used in the XRD test to perform, and the Bruker D8 Advancei was used to obtain diffraction patterns in the 2θ range of 4–70°. The main mineral constituent variation of the samples were analyzed by the spectra.
Because the internal pore structure of shale is predominantly mesoporous, N2 adsorption was used to analyze the changes in the mesoporous structure system of the samples. The samples used were powder samples of 60–80 mesh particle size, which were dried in a desiccator at 50 °C for 12 h before testing (including the SEM and XRD test samples above), and isothermal adsorption data were obtained using a low-pressure physisorption instrument at 77 K with a relative pressure in the range of 0.01–0.99. Based on the isothermal adsorption data obtained form the samples, the Barrett-Joyner-Halenda (BJH) model, the Brunauer-Emmett-Teller (BET) method, and the Density functional theory (DFT) model were used to compare and analyze the changes in the total pore volume (TPV), the specific surface area (SSA), and the pore size distribution (PSD) of the samples, respectively.
To compare with the gas adsorption method and to describe the pore structure characteristics of the samples more comprehensively and accurately, NMR experiments were conducted on cylindrical samples with 25 mm diameter and 50 mm height which were scanned by MIUMAG MINIMR-60 for 16 times, and the samples were tested separately after saturation with water to obtain the T 2 distribution curves of the samples after saturation with water to determine the changes in relaxation characteristics of the samples and to reflect the large-scale pore structure changes of the samples.
The sample preparation and main experimental device flow mentioned in this experimental study are shown in Fig. 2.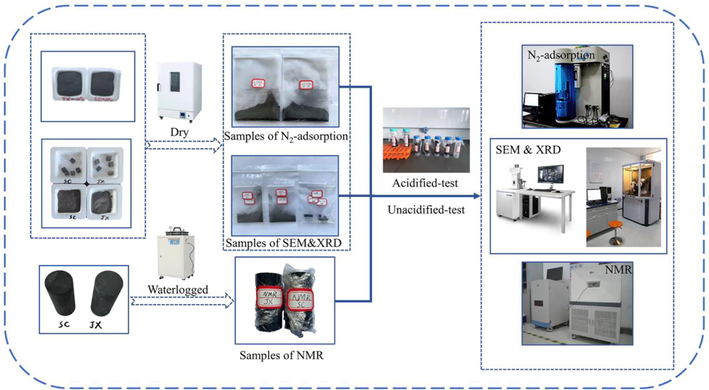
Samples handling and main experimental equipment and procedures.
3 Results and discussion
3.1 Surface morphology and surface pore structure analysis
3.1.1 Changes in the surface morphology and surface pore structure
The surface pore structure and morphology of the samples were analyzed by SEM, as shown in Fig. 3. The original surface structures of the SC and JX samples differed; the surface of the SC shales was relatively flat and was accompanied by a certain amount of minerals whereas the surface of the JX shales was entirely broken. The surface structure exhibited flake stacking and brecciated structures, with quartz and other minerals attached to the surface or interspersed in the flake stacking. Due to the dissolution of minerals by the mixed acid solution, large pores with a diameter of approximately 10 μm appeared on the surface of both the SC and JX shales after acidification. The JX shale had a low number of large pores, instead exhibiting mostly relatively small and flattened pores from dissolved minerals in the lamellar stacks. However, some differences in the degree of alteration of the surface morphology between the two shale samples were observed owing to the differences in surface structure and mineral constituents. The generation of large pores on the shale surface improved pore connectivity, enhancing fluid percolation in the shale and its exchange with the external environment.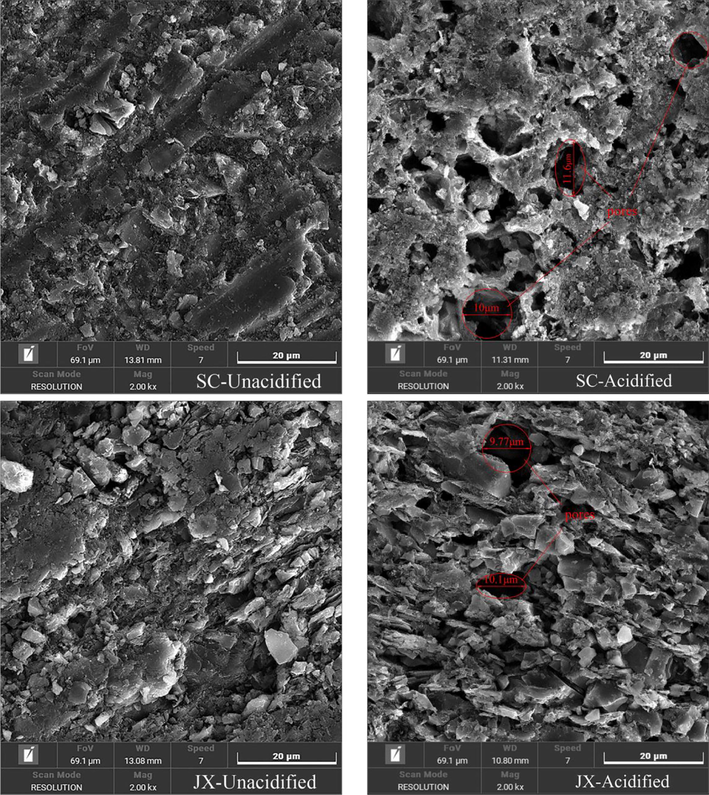
SEM images of samples.
The image digitization method more comprehensively analyzed the surface macropore structure of the shale samples. First, an SEM image was imported into Avizo software for median filtering and the Interactive Thresholding module was used to obtain the pores on the surface of the sample images by threshold segmentation. Then, the Label Analysis and Volume Fraction modules were used to calculate pore size and surface porosity. The threshold pore images were also imported into MATLAB for binarization, and the fractal box dimensions of the samples were obtained by the FracLab toolbox. The process is demonstrated in Fig. 4.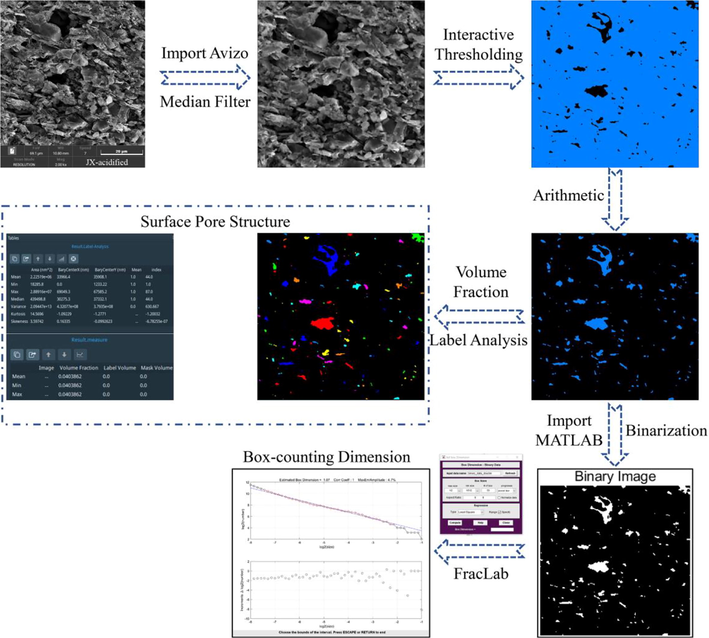
SEM surface pore analysis process.
The surface pore structure parameters of the samples are shown in Table 1. The minimum surface pore area was not significantly altered in both the SC and JX samples, but the maximum surface pore area increased by one order of magnitude in both groups. The surface porosity of the two groups of samples increased by 2.96% and 2.74%, respectively, and the box dimension increased by 0.226 and 0.278, respectively. The surface pore structure of both groups changed to some extent under the action of the mixed acid solution. The significant increase in the maximum surface pore area indicates that the mixed acid solution caused an increase in the surface pore size in both sets of samples. Moreover, the change in surface porosity indicates an increase in the pore number, and an increase in the box dimension reflects an increase in the surface pore complexity. The surface morphology observed in the SEM images of the samples showed that the mixed acid solution had different alteration effects on the two groups of samples. However, the results suggested that the improvement of the surface macropore structures of the samples from two different regions were consistent. This phenomenon reflects the stabilization effect of the mixed acid acidification method on the surface macropore.
Samples
Minimum pore area
(nm2)Maximum pore area
(nm2)Surface porosity
(%)Box-counting Dimension
Dimension R2
(%)
SC
Unacidified
1.83 × 10⁴
4.39 × 10⁶
1.08
0.844
95.6
Acidified
1.83 × 10⁴
2.89 × 10⁷
4.04
1.07
95.3
JX
Unacidified
1.83 × 10⁴
3.89 × 10⁶
0.99
0.872
95.9
Acidified
1.83 × 10⁴
4.18 × 10⁷
3.73
1.15
95.9
Although the simultaneous use of qualitative image observations and quantitative image digitization for SEM image analysis can more comprehensively represent and analyze the information presented in the SEM images of the shale samples, it still has limitations. Threshold segmentation in image digitization is the key to accurately extracting surface pore information (Pal et al., 2022). In this study, the interactive threshold segmentation by Avizo accurately extracted the surface pores to the maximum extent. However, some pores were inevitably over-segmented due to the surface complexity of the SEM images and the limitation of SEM resolution. However, this does not mean that the extracted surface pore structure parameters are invalid. Although the minimum pore surface area remained unchanged due to the errors mentioned, it still reflected the upper limit of the mixed acid action to substantially increase the surface pore size. The box dimension was mainly used to quantitatively depict the spatial complexity of the image surface and texture characteristics. In this study, the surface pore complexity of the shale samples are shown in the SEM images. Although the values have uncertainties due to errors, the comparisons from before and after acidification still reflected the trend of increasing surface pore complexity. The pore structure system of shale generally includes macropores, mesopores and micropores. Although SEM image can reveal changes in the surface macropores, the acid-soluble microfractures formed by the continuous dissolution of the mixed acid solution caused more changes in the mesopore and micropore structures of the shale with sufficient exposure time (Mohtarami et al., 2017, Hou et al., 2019, Sheng et al., 2021). These changes in the pore structure system can generate effective secondary pores and significantly affect the gas storage capacity of shale reservoirs (Hui et al., 2019, Dai et al., 2020a, 2020b). Therefore, this study also analyzed the internal pore structure system of the shale matrix by N2 adsorption isotherms and NMR.
3.1.2 Changes in the surface elements
The composition and content of the surface chemical elements in the shale samples of SC and JX before and after the mixed acid treatment were determined based on the X-ray spectra of the EDS analysis, as shown in Fig. 5. Except for the trace metal elements, the three main elements in the SC and JX samples were oxygen, carbon, and silicon. This indicated that the mineral constituents of both the SC and JX shale samples were mainly composed of carbonate and silicate minerals, and that the carbonate mineral content was greater than that of the silicate minerals. After the dissolution of the mixed acid solution, the carbon and oxygen contents in the two groups of shale samples decreased and the elemental silicon content increased. This comprehensive phenomenon indicated that the two main minerals were entirely reduced, with a dominant reduction of carbonate minerals. Because of the effect of HNO3 in the mixed acid solution, the generation of intermediate precipitates after the reaction of HCl and HF with the minerals was reduced. In addition, new quartz grains produced by the dissolution of silicate minerals on the shale surface contributed to the increase in elemental silicon. The combined changes in the three elements reflected the changes in the major minerals that were directly responsible for the changes in the surface pore structure of the samples (Dai et al., 2020a, 2020b). The final result is reflected in the changes in the surface morphology as shown in the SEM images in Fig. 2. In addition to the changes in the three major elements, the changes in the remaining trace elements mainly depended on changes in the three minor elements (Lyu et al., 2018). The variations in the different trace elements in the shale samples can be explained by their specific mineral constituents. The mineral constituents of the two sets of samples before and after acidification were further analyzed using XRD because EDS analysis is a semi-quantitative method.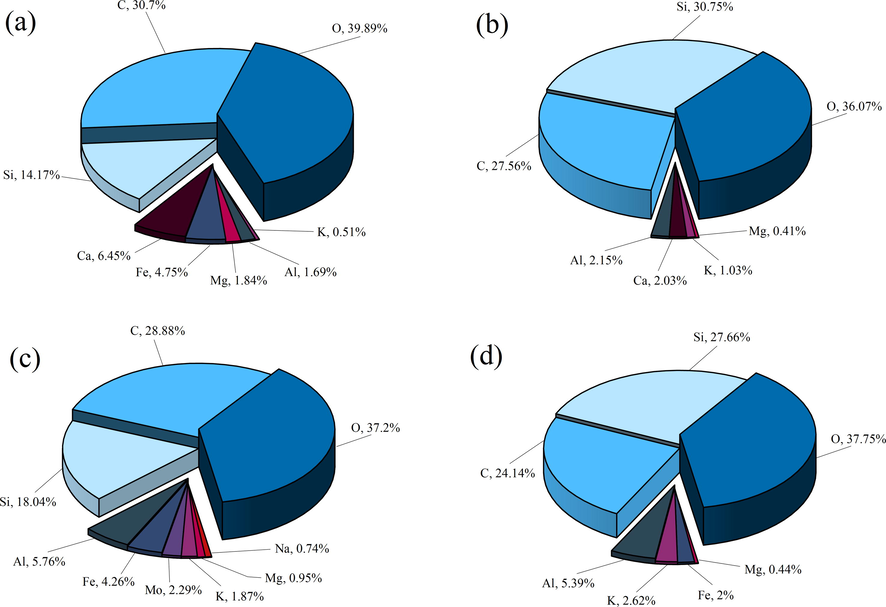
The surface chemical element composition of samples was obtained by EDS. (a) SC samples before acidification. (b) SC samples after acidification. (c) JX samples before acidification. (d) JX samples after acidification.
3.2 Mineral constituent analysis
To determine the mineral constituents and changes in the samples, the XRD spectra obtained before and after acidification were retrieved using the Jade 6.5 software. The XRD spectra and minerals corresponding to each peak are shown in Fig. 6. The mineral constituents of the SC and JX samples differed, with the SC samples mainly including quartz, calcite, dolomite, and muscovite, and the JX samples mainly including quartz, calcite, chlorite, muscovite, and albite. After the acidizing treatment, the mineral species and peak intensities of the shale samples changed significantly. Muscovite, calcite, and microcline were removed from the JX samples, and calcite and dolomite were also removed from the SC samples, mainly because of the reactions between the mineral constituents of the samples and the acid mixture (Hamer et al., 2003, Carroll et al., 2013, Sheng et al., 2021).
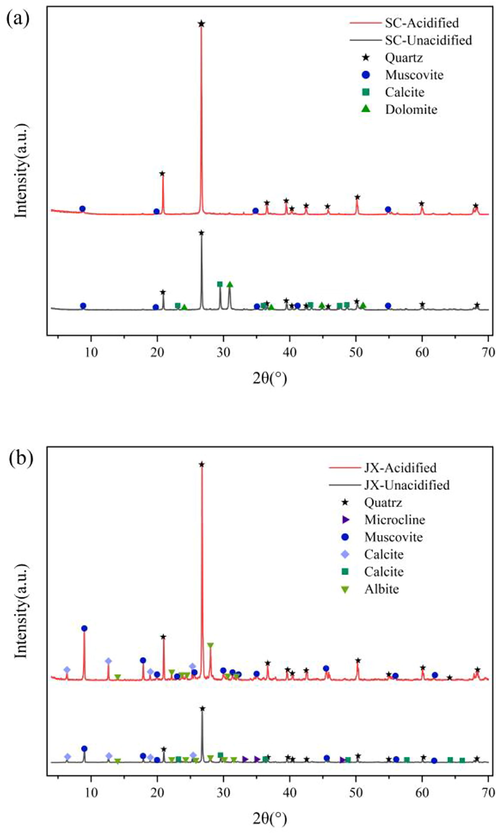
XRD patterns of samples. (a) SC samples. (b) JX samples.
Although all minerals except muscovite reacted with the mixed acid solution, the solubility differences did not result in the same degree of variation in the relative content of each mineral in the samples. The specific changes in the relative mineral content measured with XRD are shown in Fig. 7. In addition to the direct removal of minerals, the relative quartz content in the SC samples increased from 42% to 92.7% and the relative muscovite content increased from 2.8% to 7.3%. In the JX samples, the relative of quartz, albite, and chlorite contents increased from 25%, 20.5%, and 3.7% to 56.3%, 25%, and 5.5%, respectively, while the relative muscovite content decreased slightly from 14.9% to 13.2%. The substantial increase in the relative quartz contents in both samples was primarily due to the lower solubility of quartz in an acidic environment compared with other minerals (Rempel et al., 2011). In the JX sample, microcline and albite underwent the reactions in Eqs. (6) and (7) to produce SiO2, while chlorite reacted in an acidic environment to produce silicic acid (H4SiO4; Eq. (8)). The chemical equilibrium between quartz and H4SiO4 broke, resulting in the conversion of H4SiO4 to quartz, contributing to its increase (Harvey et al., 2013).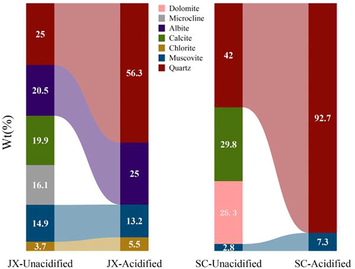
Mineral content diagram of samples.
3.3 Pore structure analysis
3.3.1 Changes in the N2 adsorption/desorption isotherms
The N2 adsorption/desorption isotherms of the samples are shown in Fig. 8. When the relative pressure (P/P0) is less than when P/P0 < 0.1, the adsorption curve slightly rises and N2 is adsorbed in the pores as a monolayer. With an increase in the P/P0, the adsorption curve began to increase slowly, and the N2 monomolecular layer adsorption gradually became multilayer adsorption until P/P0 = 0.8 reached saturation (Ni et al., 2020). At P/P0 > 0.8, owing to capillary condensation in the pores of the sample, the number of adsorbed layers increased to infinity, resulting in a rapid increase in the adsorption curve. The isotherms of both the SC and JX shale samples showed obvious hysteresis loops, usually due to capillary condensation or the ink-bottle effect when the P/P0 was reduced (Pinson et al., 2018). The hysteresis curves of the four sample groups were similar to those of the H3 and H4 types, which mainly manifest as wedge-shaped and parallel-plate pores that are closely related to the structure of laminated shales (Ding et al., 2021). Moreover, when P/P0 was at approximately 0.45, the N2 desorption curves of the four other groups exhibited a “forced closure” phenomenon, namely the tensile strength effect (TSE). This indicates that the shale also contained ink-bottle-like pores (Li et al., 2019a, 2019b). According to the IUPAC classification criteria (Thommes et al., 2015) and Kelvin’s equation (Nguyen et al., 2013), shale pores are classified as Type II pores. The N2 adsorption isotherms of the two sample groups showed a steeply rising trend and ultimately reached P/P0 = 0.99, indicating the presence of connected macropores with diameters > 300 nm (Nguyen et al., 2013, Pinson et al., 2018).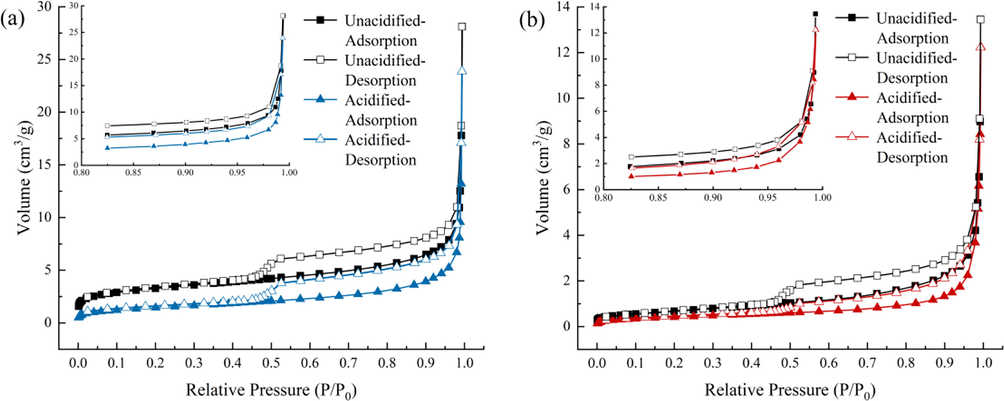
N2 adsorption/desorption isotherms of samples. (a) SC samples. (b) JX samples.
A comparison of the isotherms before and after acidification showed that the hysteresis loop morphology did not significantly change, indicating that the pore structure of the SC and JX samples also did not change significantly after the acidizing treatment (Wu and Sun 2010). However, the N2 adsorption capacity of the samples from both groups decreased after acidification (Fig. 8). In the SC samples, it decreased from 28.1209 cm3/g to 23.9041 cm3/g, showing a decrease of 14.99%. In the JX shale samples, it decreased from 13.4445 cm3/g to 12.2314 cm3/g, with a decrease of 9.02%. The P/P0 value enabled a certain degree of response to the type of pore structure. At low P/P0, N2 is usually adsorbed in macropores and it is often adsorbed in mesopores and micropores at high P/P0. Thus, at higher P/P0, N2 is mainly adsorbed by micropores and mesopores in shale. Because the N2 adsorption of shale samples is connected with the pore volume and specific surface area, a comprehensive analysis of the pore structure was conducted to determine the specific reasons for the decrease in N2 adsorption.
3.3.2 Changes in the pore volume and specific surface area
The pore volume and surface area of the samples were obtained by BET equation and BJH theoretical model, respectively (Schmitt et al., 2013, Bardestani et al., 2019). Table 2 lists the pore volume and specific surface area of two samples. V 1 is the micropore volume, V 2 is the mesopore volume, V 3 is the macropore volume, V T is the total pore capacity, and SBET is the BET specific surface area. It can be seen from the table that the V T and SBET of SC and JX shale decreased after the action of mixed acid, the SBET of SC and JX decreased by 55.59% and 39.97%, and the V T decreased by 11.97% and 9.07%, respectively.
Samples
SBET (m2/g)
Pore Volume (×10-4 cm3/g)
V 1
V 2
V 3
V T
SC
Unacidified
11.659
1.29
94.11
323.6
419
Acidified
5.178
5.73
64.03
299.1
368.86
JX
Unacidified
2.467
1.64
40.76
166
208.4
Acidified
1.481
1.25
26.95
161.3
189.5
To further analyze the reasons for the decrease in the SBET and V T of the samples, the pore volumes for each stage in Table 2 were converted into the percentage superimposed histograms shown in Fig. 9. The proportion of micropores, mesopores, and macropores in the SC and JX samples were 0.31%, 22.46%, 77.23% and 79%, 19.56%, 79.65%, respectively. After mixed acid acidification, although the V T of the two sample groups decreased, the proportion of pores in each stage varied. The percentages of mesopores in the SC and JX samples decreased to 17.36% and 14.22%, respectively, while those of macropores increased to 81.09% and 85.12%, respectively. The percentage of micropores increased to 1.55% in SC samples and decreased to 0.65% in JX samples. Because the proportion of micropores in the samples was < 1%, the pore size changes were concentrated in mesopores and macropores. Owing to the dissolution effect of the mixed acid, the pores gradually transformed into larger pores after mutual penetration. The effect of HNO3 in the mixed acid solution made it difficult for the carbonate minerals and feldspars to block the pores after dissolution. Therefore, as the number of macropores gradually increased, the permeation rate further accelerated, leading to further transformation of macropores into connected macropores or microfractures. As shown by the SEM surface pore analysis in Section 3.1, the scale of these connected macropores reached the micron level. This also explains the decrease in the SBET and V T of the samples. Because the maximum pore size of 300 nm was measured with N2 adsorption (Fig. 10), the decrease in the measured SBET and V T was caused by pores dissolving into > 300-nm sized pores. Under the action of a mixed acid, the pore structure distribution improved and the increase in large pores was conducive to the flow and transportation of shale gas resources in the reservoir.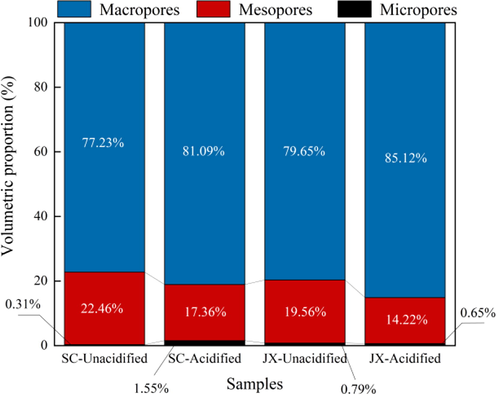
Pore size proportion diagram of each stage.
Pore size distribution of samples based on the BJH model. (a) SC samples. (b) JX samples.
3.3.3 Changes in the pore size distribution characteristics
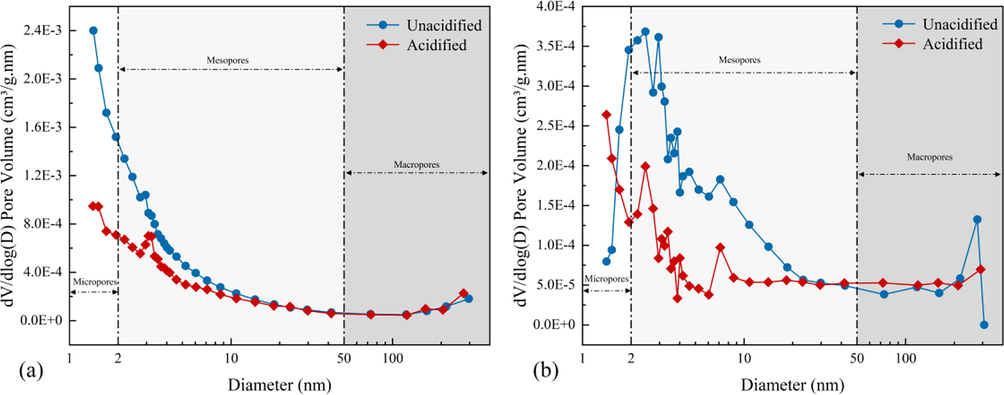
To further clarify the modification of the pore structure by the mixed acid solution, the pore size distribution of the samples was analyzed. To avoid the influence of the TSE (Groen et al., 2003), this study used the DFT method to analyze the N2 adsorption isotherms of the samples. DFT is a molecular dynamics method that reflects the thermodynamic properties of fluids in porous materials. It provides adsorption models and more accurately reflects the pore size distribution than traditional thermodynamic methods such as BJH. The nonlocalized density functional theory (NLDFT) theory was first applied to the pore size analysis of microporous carbon by 1993, which assumed that the adsorption isotherms were obtained by the relative distribution of numerous “single-pore” adsorption isotherms in the covered pore size range. NLDFT describes the properties of fluids confined in pores at the molecular level and can relate the molecular properties of adsorbent gases to their adsorption properties in pores of different sizes. It is suitable for the range of 0.35 nm to 100 nm micropores to mesopores.
As shown in Fig. 11, the pore size distribution of the samples were in the range of 0–80 nm, as obtained by fitting the NLDFT model. The pore size distributions of the SC and JX samples exhibited multi-peak characteristics and were mainly distributed in the mesopore range of 2–10 nm. The JX shale still had multiple peaks in the 20–80 nm range, indicating that the pore size diversity of both shale samples was good; however, the overall pore size diversity of the JX shale was better. Combined with the BJH pore size distribution shown in Fig. 10, the peaks in the 2–15 nm pore size range of the shale samples were significantly reduced after the mixed acid treatment. Because the peaks are related to the adsorption performance (Groen et al., 2003, Liu et al., 2015), those of the shale samples were weakened after acidification. In the pore size range of 15–35 nm, the curves of the samples alternated and the pore size distribution of the samples showed alternating curves and minor changes, indicating that the pores in this range were not affected by the mixed acid treatment. The overall change in the pore size distribution of the 35–80 nm samples was insignificant. The peak area of the SC shales decreased slightly after acidification. In contrast, the JX shales increased to some extent, indicating that the mixed acid treatment improved the pore diversity of the JX shale in this range. Overall, the acid mixture mainly affected the pores in the size range of 2–15 nm while the other ranges were essentially the same as those before acidification.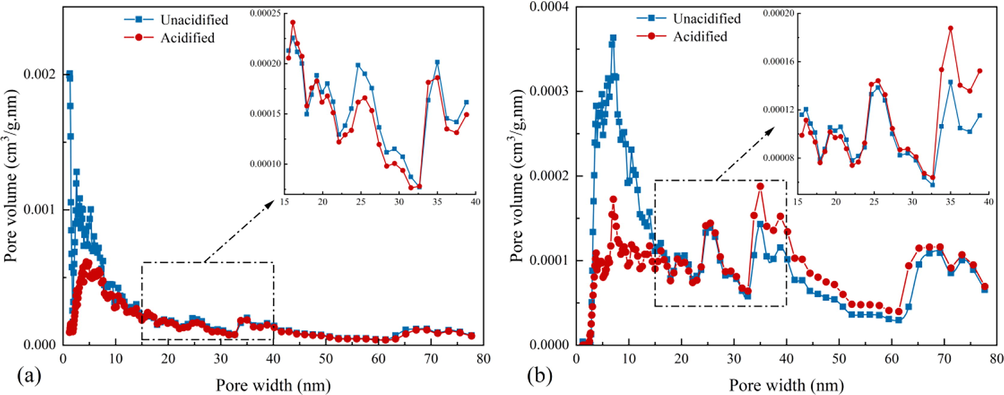
Pore size distribution of samples based on the NLDFT model. (a) SC samples. (b) JX samples.
In addition, the shale samples exhibited a more uniform pore distribution after the mixed acid treatment, and the pore volume no longer significantly varied in different pore size ranges. This phenomenon is connected with quartz being a major mineral constituent of the samples as it is more stable in acidic environments than other minerals, minimizing the clay swelling effect. Meanwhile, inorganic mineral rocks contribute more to the large pores in the shale matrix (Li et al., 2019a, 2019b), making the shale pore size distribution homogeneous after acidification. After acidification, the JX shale samples had more mineral species remaining than the SC shale samples, making the pore size distribution of the JX shale samples less homogenized than that of SC shale samples. Therefore, the dissolution effect of the mixed acid solution improved the shale pore scale distribution.
3.3.4 Changes in the fractal characteristics
Fractal geometry theory has been used widely in the quantitative expression of surface roughness and pore complexity in heterogeneous porous media since it was proposed (Rahner et al., 2018, Cheng et al., 2021, Wang et al., 2021a, 2021b). The fractal dimension can describe the complexity of pore scale distribution quantitatively. There is a positive correlation between fractal dimension and pore complexity (Han et al., 2020). The Frenkel–Halsey–Hill (FHH) model equation is as follows (Avnir and Jaroniec 1989):
Fig. 12 illustrates the FHH model fitting diagram of the SC and JX shales. As shown in the N2 adsorption/desorption curves in Section 3.3.1, the shale samples show obvious hysteresis loops at approximately P/P0 = 0.45–0.5, indicating that the N2 adsorption/desorption curve reflects different shale pore characteristics of the samples at different P/P0 stages. By obtaining the fractal dimension D at relatively low and high pressures, the fractal characteristics of pores can be distinguished at different stages. The fractal dimension is calculated as D1 when P/P0 < 0.45 and D2 when P/P0 > 0.5. The values and fits of the fractal dimensions D1 and D2 of the samples are shown in Table 3.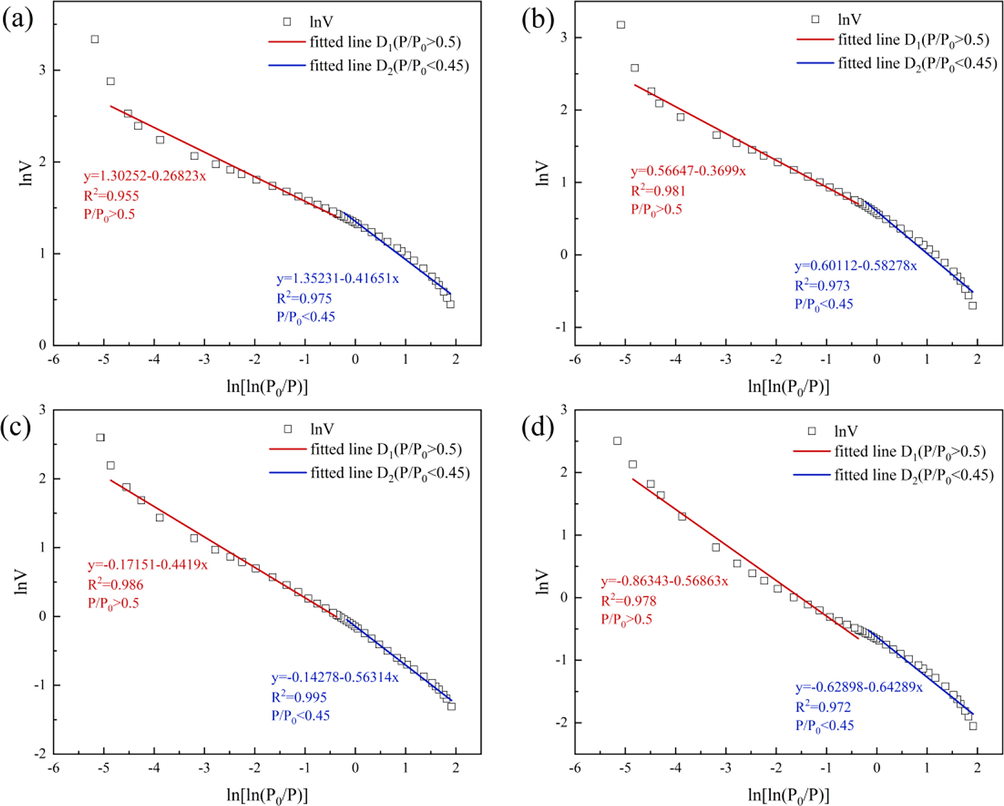
Fractal dimension of samples. (a) SC samples before acidification. (b) SC samples after acidification. (c) JX samples before acidification. (d) JX samples after acidification.
Samples
Fractal Dimension of
Pore Surface (D1)Fractal Dimension of
Pore Structure (D2)
Fitted Equation
R2
D1
Fitted Equation
R2
D2
SC-Unacidified
y = 1.35231–0.41651x
0.975
2.5835
y = 1.30252–0.26823x
0.955
2.7318
SC-
Acidifiedy = 0.60112–0.58278x
0.973
2.4172
y = 0.56647–0.3699x
0.981
2.6301
JX-Unacidified
y = -0.14278–0.56314x
0.995
2.4369
y = -0.17151–0.4419x
0.986
2.5581
JX-
Acidifiedy = -0.62898–0.64289x
0.972
2.3571
y = -0.86343–0.56863x
0.978
2.4314
As shown in Table 3 that D1 and D2 of the SC samples were higher than those of the JX samples, indicating higher pore surface and structural complexities. The D1 and D2 of the SC and JX samples were considerably reduced after the acidizing process, indicating that the surface and structural complexities of the pores were reduced by the dissolution effect of the mixed acid solution. The shale sample pores transitioned from a complex structure to a regular structure and finally tended to be uniform.
Related studies have shown that the presence of minerals in the pore space exacerbates the inhomogeneity and irregularity of pore morphology (Morsy et al., 2015, Hongchao et al., 2019, Jingna et al., 2020). The prominence produced by mineral filling exacerbated the complexity of the pore surface and the dissolution of the mixed acid solution demineralized the shale. Owing to the effect of HNO3 to avoid precipitation after mineral acidification, the permeability rate of the adjacent pores was maintained. The pores of the samples gradually connected to form fractures and large-diameter pores and the pore types were progressively dominated by them, decreasing the surface complexity and pore distribution, which is consistent with the analysis presented in Section 3.3.2. Combined with the analysis of the pore structure in Section 3.3.3, this also reflects that the reduction of the fractal dimension is beneficial to the gas flow inside the shale, making the shale gas resources in the reservoir easier to extract.
3.4 NMR T 2 spectrum analysis
Using NMR to analyze the fluid characteristics in shale pores mainly by measuring the lateral relaxation time T 2 distribution of hydrogen nuclei. There are usually three relaxation mechanisms in the pores of porous media such as rock or coal: surface relaxation, free relaxation and diffusion relaxation (Zhang et al., 2018), and surface relaxation plays a significant role:
Eq. (10) can be further simplified as:
The NMR T2 spectrum of the SC and JX samples before and after acidification are shown in Fig. 13. Before acidification, the samples had two peaks at 0.1–10 ms and 10–100 ms, which represented the surface and free relaxation peaks, respectively. After acidification, the T2 spectra of the two sets of samples changed significantly. In the SC shale sample, the interval width of each relaxation stage increased, the surface relaxation peak decreased and shifted to the left, the free relaxation peak increased significantly, and the surface relaxation and free relaxation peaks change from independent to connected. The widths of the relaxation intervals and surface relaxation peaks of the JX shale sample were similar. However, a continuous double peak also appeared in the surface relaxation range while the free relaxation peak decreased and shifted to the right. A diffusion relaxation peak appeared at > 100 ms. As shown in Table 4, the nuclear magnetic porosity of the SC and JX shale samples increased by 187% and 423%, respectively. Compared with the cumulative porosity and incremental porosity of the SC and JX samples before acidification, these significantly increased after acidification.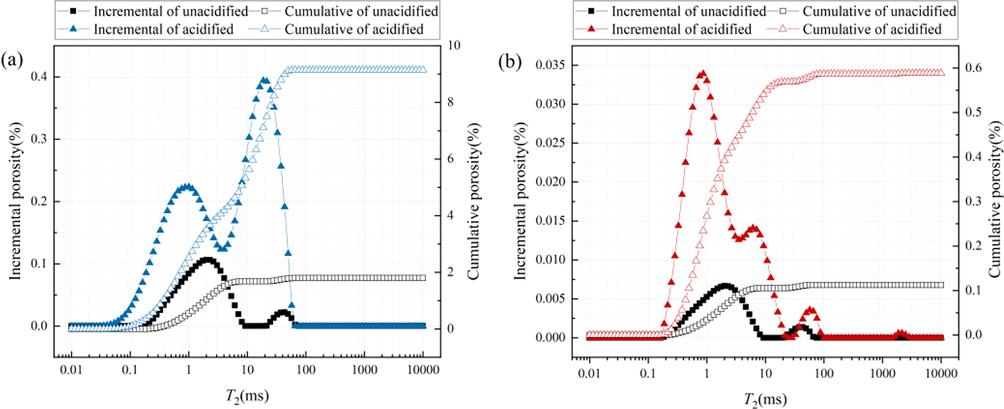
NMR T 2 spectrum of samples. (a) SC samples. (b) JX samples.
Samples
NMR porosity (%)
Porosity ratio
at different stages (%)
<10 ms
10–100 ms
>100 ms
SC
Unacidified
3.1855
98.6
1.4
0
Acidified
9.1408
58.3
41.7
0
JX
Unacidified
0.1125
93.5
6.5
0
Acidified
0.5885
91.8
7.8
0.4
Because a unified standard for classifying pore types according to the pore diameters obtained by NMR does not exist (Liu et al., 2020), the different ranges of lateral relaxation times, T2 < 10, 10–100, and > 100 ms, were reported by Li et al. (Li et al., 2017) to correspond with pores in the three pore size ranges < 0.1, 0.1–1, and > 1-μm, respectively. According to the changes in the porosity ratios of the SC and JX samples at each stage before and after acidification, the < 0.1-μm sized pore proportion of the two groups decreased, the porosity ratio of 0.1–1-μm increased, and the interpore connectivity and pore size diversity increased after acidification. Furthermore, the pore size range with improved connectivity and increased size diversity was further identified in the 0.3–1-μm pore size by combining the results of the N2 adsorption pore size percentage and distribution analyses (Section 3.3).
By comparing the porosity ratio variation between SC and JX, the porosity ratio of the SC samples changed significantly at different stages and the porosity ratio of pore size 0.1–1-μm increased by 40.3%, whereas that of the JX samples increased by only 1.3%. The difference between the SC and JX samples was due to the difference in their mineralogical compositions. Due to the acid solution, the more significant proportion of carbonate minerals in the SC samples increased the number of 0.1–1-μm sized pores while large amounts of carbonate and silicate minerals in the JX samples increased the number of 0.1–1-μm sized pores less significantly, with new > 1-μm sized pores appearing. The mixed acid solution used in this experiment had a good anti-reflection effect on shale with different mineral compositions and could transform the main gas adsorption pores into gas migration pores through dissolved minerals.
3.5 Action process of mixed acid on shale pores
According to the analysis results of the NMR T2 spectrum and combined with the changes in the pore size percentage and distribution pattern of the SEM surface pores and N2 adsorption, the action process of the mixed acid on the shale pores was divided into four stages (Fig. 14):
-
Surface dissolution: The mixed acid solution first acts on the shale surface and gradually dissolves pores with a maximum diameter of approximately 10 μm.
-
Macroporous dissolution: The surface porosity of the shale increases after surface dissolution, allowing more acid to gradually penetrate the shale, acting first on the macropores and further increasing the pore size to 0.3–1-μm.
-
Meso–microporous dissolution: As the shale is further dissolved by the acid, it begins to act on the mesopores and micropores. Because the number of micropores in shale accounts for only a small percentage, the acid mainly targets mesopores in the range of 2–15-nm, causing most of the pores in this range to be converted into mesopores or macropores with pore sizes > 35-nm.
-
Feedback dissolution: As most of the 2–15-nm sized mesopores are converted into mesopores or macropores sized > 35-nm, the pore connectivity within the shale increases dramatically and the distribution of pore sizes < 100-nm becomes homogenized. The dissolution effect forms a positive feedback loop with an increase in macropores owing to the less reactive precipitation in the acid system. This leads to the appearance of more 0.3–1-μm sized macropores, resulting in the reduction of shale SSA and pore volume after acidification in the range of N2 adsorption detection. Finally, a cross-scale hole-expansion effect is achieved.
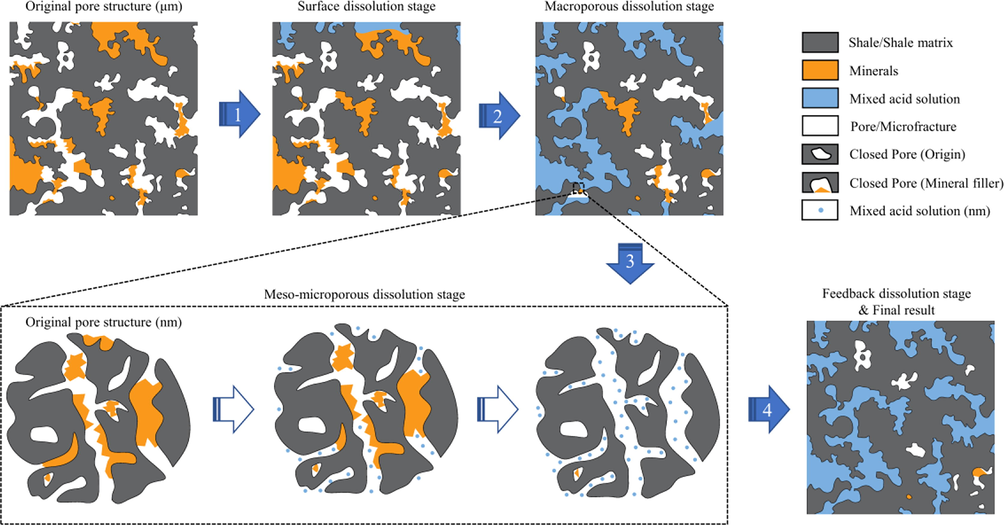
- The action process of mixed acid on shale pores.
4 Conclusion
To solve the shortcomings of acid in the current acidfrac process, such as pore plugging and formation pollution, exploring the effect of new mixed acid on shale pore structure. This study investigated the effects of a mixed acid acidification method formed from a 3:1:1 mixture of HCl: HF: HNO3 on the mineral constituents and pore structures of shale. In addition, the effects of the complete stages of the nitrate acidification system on the pore structure of the shale were clarified based on the different ranges of pore distribution reflected by various technical means. The conclusions of this study are as follows:
-
The surface pore structure of shale was analyzed by digitizing SEM images. The maximum surface pore size of shale increased to approximately 10 μm after acidification. The surface porosity and box dimension value increased as surface pore complexity increased. This indicates that the connectivity between the shale pores and the external environment improved, enhancing gas exchange and percolation between the shale and external environment.
-
The dissolution by the acid mixture altered the mineral constituents of shale. The relative quartz content increased, whereas that of carbonate, silicate, and clay minerals decreased after the acidizing treatment. This phenomenon was related to the difference in mineral solubility during acid and quartz precipitation.
-
The pore action of the mixed acid solution on the shale did not alter the pore shape but significantly reduced the SSA and TPV, which also significantly reduced its gas adsorption capacity. The number of 2–15-nm sized mesopores decreased and the number of 0.3–1-μm sized pores increased due to the dissolution of the mixed acid solution. Simultaneously, acid dissolution also homogenized the pore size distribution and improved the pore connectivity.
-
The fractal dimension of the shale decreased after the acidizing treatment. This is proportional to the complexity of the pore structure and surface; therefore, the acid dissolution effect reduced the pore structure and surface complexities of the shale. This phenomenon is linked to shale demineralization.
-
The mixed acid solution produced a cross-scale expansion of shale. Based on the different degrees of pore structure analysis by SEM, N2 adsorption, and NMR, the complete action process of the mixed acid solution on the shale pore structure was divided into four stages: surface dissolution, macroporous dissolution, meso–microporous dissolution, and feedback dissolution.
This study further explored the shale acidification mechanism of the HCl: HF: HNO3 acid mixture. In future work, the alteration of the mineral fraction and pore structure could be further analyzed using 3D reconstruction. Moreover, a quantitative comparison of the desorption capacity of shale before and after mixed acid acidification should be conducted to elucidate the practical effects and application prospects of mixed acids for shale gas extraction.
Acknowledgments
The authors are grateful to the financial support the National Natural Science Foundation of China (No. 51974300 and 52174216), the Fundamental Research Funds for the Central Universities (No. 2021YCPY0206 and 2020ZDPY0224), and a Project Funded by the Priority Academic Program Development of Jiangsu Higher Education Institutions (PAPD).
Declaration of Competing Interest
The authors declare that they have no known competing financial interests or personal relationships that could have appeared to influence the work reported in this paper.
References
- World shale gas resources: an initial assessment of 14 regions outside the United States. US Department of Energy; 2011.
- Effect of demineralization of El-lajjun Jordanian oil shale on oil yield. Fuel Process. Technol.. 2009;90:818-824.
- [Google Scholar]
- An experimental study of calcite and limestone dissolution rates as a function of pH from− 1 to 3 and temperature from 25 to 80℃. Chem. Geol.. 1998;151:199-214.
- [Google Scholar]
- An isotherm equation for adsorption on fractal surfaces of heterogeneous porous materials. Langmuir. 1989;5:1431-1433.
- [Google Scholar]
- Experimental methods in chemical engineering: specific surface area and pore size distribution measurements—BET, BJH, and DFT. Can. J. Chem. Eng.. 2019;97:2781-2791.
- [Google Scholar]
- BP. 2021. BP statistical Review of World Energy. Retrieved 4.19, 2022, from https://www.bp.com/en/global/corporate/energy-economics/statistical-review-of-world-energy.html.
- Reactivity of Mount Simon sandstone and the Eau Claire shale under CO2 storage conditions. Environ. Sci. Tech.. 2013;47:252-261.
- [Google Scholar]
- Micro and nano-size pores of clay minerals in shale reservoirs: Implication for the accumulation of shale gas. Sed. Geol.. 2016;342:180-190.
- [Google Scholar]
- The effect of subcritical and supercritical CO2 on the pore structure of bituminous coals. J. Nat. Gas Sci. Eng.. 2021;94:104-132.
- [Google Scholar]
- Several essential geological and geochemical issues regarding shale gas research in China. J. Nat. Gas Geosci.. 2020;5:169-184.
- [Google Scholar]
- Factors affecting shale microscopic pore structure variation during interaction with supercritical CO2. J. CO2 Utilization. 2020;38:194-211.
- [Google Scholar]
- Nanometer pore structure characterization of taiyuan formation shale in the Lin-Xing area based on nitrogen adsorption experiments. Minerals.. 2021;11:298.
- [Google Scholar]
- Effect of inherent and additional pyrite on the pyrolysis behavior of oil shale. J. Anal. Appl. Pyrol.. 2014;105:342-347.
- [Google Scholar]
- Experiences and lessons learned from China's shale gas development: 2005–2019. J. Nat. Gas Sci. Eng.. 2021;85:1036-1048.
- [Google Scholar]
- Pore size determination in modified micro-and mesoporous materials. Pitfalls and limitations in gas adsorption data analysis. Microporous Mesoporous Mater.. 2003;60:1-17.
- [Google Scholar]
- Dissolution of ripidolite (Mg, Fe-chlorite) in organic and inorganic acid solutions. Soil Sci. Soc. Am. J.. 2003;67:654-661.
- [Google Scholar]
- Experimental analysis of the pore structure and fractal characteristics of different metamorphic coal based on mercury intrusion-nitrogen adsorption porosimetry. Powder Technol.. 2020;362:386-398.
- [Google Scholar]
- Geochemical implications of gas leakage associated with geologic CO2 storage — A qualitative review. Environ. Sci. Tech.. 2013;47:23-36.
- [Google Scholar]
- The influence of surfactant on pore fractal characteristics of composite acidized coal. Fuel. 2019;253:741-753.
- [Google Scholar]
- Investigation on acid fracturing treatment in limestone formation based on true tri-axial experiment. Fuel. 2019;235:473-484.
- [Google Scholar]
- Effect of supercritical CO2 exposure on the high-pressure CO2 adsorption performance of shales. Fuel. 2019;247:57-66.
- [Google Scholar]
- Effects of pulse wave on the variation of coal pore structure in pulsating hydraulic fracturing process of coal seam. Fuel. 2020;264:116906
- [Google Scholar]
- A preliminary screening and characterization of suitable acids for sandstone matrix acidizing technique: a comprehensive review. J. Pet. Explor. Prod. Technol.. 2019;9:753-778.
- [Google Scholar]
- Research on quantitative analysis for nanopore structure characteristics of shale based on NMR and NMR cryoporometry. Energy Fuel. 2017;31:5844-5853.
- [Google Scholar]
- Organic matter pore characterization of the Wufeng-Longmaxi shales from the fuling gas field, Sichuan Basin: Evidence from organic matter isolation and low-pressure CO2 and N2 adsorption. Energies. 2019;12:1207.
- [Google Scholar]
- Pore characteristics and influencing factors of different types of shales. Mar. Pet. Geol.. 2019;102:391-401.
- [Google Scholar]
- Kinetic mechanics of the reactions between HCl/HF acid mixtures and sandstone minerals. J. Nat. Gas Sci. Eng.. 2016;34:792-802.
- [Google Scholar]
- Application of nuclear magnetic resonance (NMR) in coalbed methane and shale reservoirs: a review. Int. J. Coal Geol.. 2020;218:1032-1061.
- [Google Scholar]
- Impact of pore structure on gas adsorption and diffusion dynamics for long-flame coal. J. Nat. Gas Sci. Eng.. 2015;22:203-213.
- [Google Scholar]
- A comprehensive pore structure study of the Bakken Shale with SANS, N2 adsorption and mercury intrusion. Fuel. 2019;245:274-285.
- [Google Scholar]
- Shale pore size classification: an NMR fluid typing method. Mar. Pet. Geol.. 2018;96:591-601.
- [Google Scholar]
- Acid fracturing technique for carbonate reservoirs using nitric acid powder. J. Can. Pet. Technol.. 2005;44
- [Google Scholar]
- Experimental study on the influence of acid-pressure compound effect on multi-scale pore evolution of oil shale. Arab. J. Sci. Eng. 2022:1-14.
- [Google Scholar]
- Spectrum of pore types and networks in mudrocks and a descriptive classification for matrix-related mudrock pores. AAPG Bull.. 2012;96:1071-1098.
- [Google Scholar]
- Experimental investigation on the mechanical properties of a low-clay shale with different adsorption times in sub-/super-critical CO2. Energy. 2018;147:1288-1298.
- [Google Scholar]
- Investigating of chemical effects on rock fracturing using extended finite element method. Theor. Appl. Fract. Mech.. 2017;89:110-126.
- [Google Scholar]
- Effect of low-concentration HCl on the mineralogy, physical and mechanical properties, and recovery factors of some shales. J. Unconventional Oil Gas Resources. 2015;9:94-102.
- [Google Scholar]
- Pore connectivity and hysteresis in gas adsorption: a simple three-pore model. Colloids Surf. A Physicochem. Eng. Asp. 2013;437:56-68.
- [Google Scholar]
- Effect of nitric acid on the pore structure and fractal characteristics of coal based on the low-temperature nitrogen adsorption method. Powder Technol.. 2020;367:506-516.
- [Google Scholar]
- Perry, K., Lee, J., 2007. Unconventional gas reservoirs: tight gas, coal seams, and shales. Working Document of the NPC Global Oil and Gas Study. 18,
- Inferring pore connectivity from sorption hysteresis in multiscale porous media. J. Colloid Interface Sci.. 2018;532:118-127.
- [Google Scholar]
- Fractal dimensions of pore spaces in unconventional reservoir rocks using X-ray nano-and micro-computed tomography. J. Nat. Gas Sci. Eng.. 2018;55:298-311.
- [Google Scholar]
- An experimental investigation of trace element dissolution in carbon dioxide: applications to the geological storage of CO2. Chem. Geol.. 2011;289:224-234.
- [Google Scholar]
- Characterization of pore systems in seal rocks using nitrogen gas adsorption combined with mercury injection capillary pressure techniques. Mar. Pet. Geol.. 2013;39:138-149.
- [Google Scholar]
- Comparison of using combination of acetic acid and hydrochloric acid with only hydrochloric acid as matrix pre flush. Int. J. Petroleum Geosci. Eng.. 2013;1:41-49.
- [Google Scholar]
- Characteristics of micro-fracturing in shales induced by dilute acid. J. Nat. Gas Sci. Eng.. 2021;88:1038-1055.
- [Google Scholar]
- Micrometer-scale fractures in coal related to coal rank based on micro-CT scanning and fractal theory. Fuel. 2018;212:162-172.
- [Google Scholar]
- Shale Gas exploration and development in China: current status, geological challenges, and future directions. Energy Fuel. 2021;35:6359-6379.
- [Google Scholar]
- Multiscale connectivity characterization of marine shales in southern China by fluid intrusion, small-angle neutron scattering (SANS), and FIB-SEM. Mar. Pet. Geol.. 2020;112:104101
- [Google Scholar]
- Fractal analysis of pores and the pore structure of the Lower Cambrian Niutitang shale in northern Guizhou province: Investigations using NMR, SEM and image analyses. Mar. Pet. Geol.. 2019;99:416-428.
- [Google Scholar]
- Physisorption of gases, with special reference to the evaluation of surface area and pore size distribution (IUPAC Technical Report) Pure Appl. Chem.. 2015;87:1051-1069.
- [Google Scholar]
- Effective policies for renewable energy—the example of China's wind power—lessons for China's photovoltaic power. Renew. Sustain. Energy Rev.. 2010;14:702-712.
- [Google Scholar]
- Measurement and modeling of coal adsorption-permeability based on the fractal method. J. Nat. Gas Sci. Eng.. 2021;88:103824
- [Google Scholar]
- Evolution of permeability and mesostructure of oil shale exposed to high-temperature water vapor. Fuel. 2021;290:119786
- [Google Scholar]
- Sorption–desorption hysteresis of phenanthrene—effect of nanopores, solute concentration, and salinity. Chemosphere. 2010;81:961-967.
- [Google Scholar]
- Yang, F., Nasr-El-Din, H.A., Al-Harbi, B., 2012. Acidizing sandstone reservoirs using HF and formic acids. In: SPE International Symposium and Exhibition on Formation Damage Control, OnePetro.
- Petrophysical characterization of coals by low-field nuclear magnetic resonance (NMR) Fuel. 2010;89:1371-1380.
- [Google Scholar]
- Yu, W., Sepehrnoori, K., 2013. Simulation of gas desorption and geomechanics effects for unconventional gas reservoirs. In: SPE Western Regional & AAPG Pacific Section Meeting 2013 Joint Technical Conference, OnePetro.
- Particle size effect on pore structure characteristics of lignite determined via low-temperature nitrogen adsorption. J. Nat. Gas Sci. Eng.. 2020;84:103633
- [Google Scholar]
- Characterization of closed pores in longmaxi shale by synchrotron small-angle x-ray scattering. Energy Fuel. 2021;35:6738-6754.
- [Google Scholar]
- Mineral-controlled nm-μm-scale pore structure of saline lacustrine shale in Qianjiang Depression, Jianghan Basin, China. Marine Petroleum Geol.. 2019;99:347-354.
- [Google Scholar]
- Petrophysical characterization of oil-bearing shales by low-field nuclear magnetic resonance (NMR) Mar. Pet. Geol.. 2018;89:775-785.
- [Google Scholar]
- Experimental study of the pore structure and permeability of coal by acidizing. Energies. 2018;11:1162.
- [Google Scholar]


