

Translate this page into:
Formation mechanism and thermal decomposition properties of hydration products of superfine tailings cemented paste backfill
⁎Corresponding author at: School of Civil and Resource Engineering, University of Science and Technology Beijing, Beijing 100083, China. bin.han@ustb.edu.cn (Bin Han)
-
Received: ,
Accepted: ,
This article was originally published by Elsevier and was migrated to Scientific Scholar after the change of Publisher.
Peer review under responsibility of King Saud University.
Abstract
Filling mining with solid waste resources as aggregates is an important development direction for cleaner production in mines. The hydration products have an important effect on the mechanical properties of superfine tailings cemented paste backfill (SCPB). This paper investigates the mechanism of hydration product formation and thermal decomposition properties of SCPB by a series of experiments combined with thermal decomposition kinetics. Also, to optimize the mechanical properties of SCPB, the effect of Nano SiO2 (NS) on the related properties of SCPB is investigated. The results show that there are two main stages of the thermal decomposition of SCPB, and the kinetic models of these two stages are both reaction order models. After adding NS, the kinetic model of the second stage of thermal decomposition of SCPB is changed to random nucleation and growth model. The substances that undergo thermal decomposition reactions in the first stage are mainly hydration products such as ettringite and C-S-H, while the substances that undergo thermal decomposition reactions in the second stage are carbonates. The activation energy E and pre-exponential factor A of the first stage of thermal decomposition of SCPB with NS added are significantly improved, which indicates a more stable structure of its hydration products. The microscopic test results show that NS can promote the hydrolysis of C3S and gypsum and increase the production of hydration products, which in turn improves the strength of SCPB. In addition, the addition of NS to SCPB decreases the Ca/Si and increases the average silica chain length of C-S-H gels, while the H2O/Si decreases and the silica group increases, resulting in the enhancement of the structure of C-S-H gels.
Keywords
Superfine tailings
Filling mining
Thermal decomposition
Hydration products
Microstructure

1 Introduction
Tailings are solid mineral wastes discharged from mineral processing plants, and it is one of the most productive and least utilized solid wastes in China (Qiu et al., 2020; Qi et al., 2020). Most of the tailings are stockpiled on the surface, which causes serious damage to the ecological environment and is against the current strategy of green mine construction and sustainable development (Yu et al., 2021; Zhang et al., 2022). To reduce the stock of tailings, scientists have developed tailings cemented paste backfill (CPB) technology (Hu et al., 2022; Zhang et al., 2022). With the gradual maturity and popularization of related technologies, the utilization rate of the tailings has gradually increased. However, with the development of mineral processing technology, the particle size of tailings is getting finer and finer, which also brings a series of negative effects to superfine tailings cemented paste backfill (SCPB), especially the mechanical properties of SCPB can be greatly affected (Liu et al., 2020).
Previous research shows that the hydration product is a key factor in determining the mechanical properties of SCPB (Zhou et al., 2020; Guo et al., 2021; Sun et al., 2022). At present, most scholars use X-ray diffraction analysis (XRD), fourier infrared spectroscopy (FTIR), thermal gravimetric analysis (TG), and scanning electron microscopy (SEM) to investigate the hydration products of SCPB (Yellareddy et al., 2021; Saroha et al., 2022; Lv et al., 2017; Mo et al., 2021; Martínez-Ortiz-de-Montellano et al., 2021). With the assistance of XRD, the composition of hydration products of SCPB can be investigated under different admixture types and dosages, cementitious material types and dosages, curing temperatures, and proportion, etc., and then the types of hydration products of SCPB can be initially determined, and the amount of different hydration products can also be qualitatively analyzed (Chen et al., 2021; Liu et al., 2020). The molecular structure of different hydration products in SCPB can be determined by the FTIR technique, which can help to further determine the type of hydration products (Ren et al., 2021; Li et al., 2018). In addition, the intensity of the different hydration products can be compared according to the intensity of the absorption bands. The TG technique enables to verification of the type and amount of partial hydration products produced according to the mass loss of SCPB corresponding to different temperatures of heating (Shalu et al., 2022; Asogekar and Verenkar, 2019). The microscopic morphology of the hydration products can be observed visually with the support of SEM.
All of the above research methods are used to qualitatively or quantitatively investigate the hydration products of SCPB by determining the structure or quantity of the substances. In this research, the hydration products are investigated from an energy perspective in combination with thermal analysis kinetics. Take the C-S-H gel in SCPB as an example, it has various molecular structures due to the different Ca/Si ratios and the content of crystal water in its molecules (Hou et al., 2021; Hou et al., 2022). The molecular structure affects the stability of C-S-H, leading to its variable effects on the mechanical properties of SCPB (Hou et al., 2021). The thermal analysis kinetics allows us to determine the stability of different structures from an aspect of energy. Information related to kinetics is usually obtained by thermal weight loss analysis at an isothermal or constant rate of temperature rise (Sikora et al., 2022; Panda et al., 2022; Gupta et al., 2020). However, thermal analysis kinetics is mostly used in research related to biomass materials and less studied in cement-based materials.
In this research, the formation mechanism and thermal decomposition properties of the hydration products of SCPB are investigated with the assistance of a series of microscopic analytical tools and combined with thermal analysis kinetics, and the kinetic equations of the thermal decomposition of SCPB are constructed. Based on the excellent performance of NS in optimizing the mechanical properties of cementitious materials, the mechanism of the effect of NS on the relevant properties of SCPB is investigated. The results of the research are a guide to optimizing the mechanical properties of SCPB and improving the recycling rate of superfine tailings.
2 Materials and methods
2.1 Materials
2.1.1 Tailings
The tailings in this research are solid mineral wastes taken from a gold mine in Guizhou Province, China. The physical properties of the tailings are shown in Fig. 1(a) and Table 1 and the chemical composition is shown in Fig. 1(b) and Table 2. The medium particle size (d50) of the tailings is 24.44 μm and the proportion of particle sizes less than 20 μm and less than 75 μm are 43.74% and 93.26%, respectively, which indicates that the tailings are superfine. The coefficient of uniformity (Cu, Cu = d60/d10) of the tailings is 10.22 greater than 10, which indicates a good gradation. The basicity coefficient ((CaO%+MgO%)/(SiO2%+Al2O3%)) of the tailings is 0.04 less than 1, which indicates that it is an acidic material. The activity coefficient (CaO%/SiO2%) of tailings is 0.03, which indicates that it is an inert material.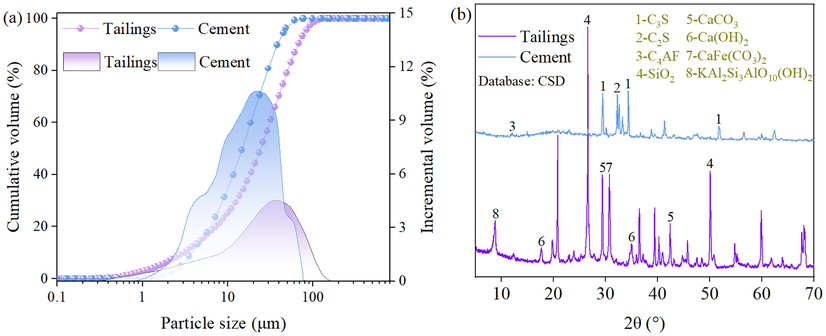
Properties of raw materials: (a) Particle size, (b) XRD test results.
Parameters
Tailings
Cement
Nano-SiO2
Appearance


Specific surface area, m2/kg
353.1
676.7
385.8 × 10³
Particle size range, μm
0.2 ∼ 220.8
1.1 ∼ 98.1
20.0 ∼ 30.0 × 10⁻³
d10, μm
2.8
3.8
–
d50, μm
24.8
14.9
–
d60, μm
32.5
18.6
–
D75, μm
49.3
25.8
Cu
11.5
4.9
–
Materials
SiO2
CaO
MgO
Fe2O3
Al2O3
MnO
SO3
TiO2
Tailings
67.85
2.66
0.63
2.58
18.47
0.19
0.94
0.33
Cement
11.89
44.13
0.63
2.64
2.96
–
2.50
0.27
Nano-SiO2
100%
–
–
–
–
–
–
–
2.1.2 Nano SiO2
The physical properties of NS, are a white powder solid with a purity of 99. 8%, a particle size of 20–30 nm, and a specific surface area of 385.8 m2/g are shown in Table 1.
2.1.3 Binder and water
PO42.5 silicate cement is selected as the binder, and tap water is used as the mixing water for the experiment. The initial and final setting times of the cement are 150 min and 220 min, respectively, and the 28d compressive strength and 28d flexural strength are 54.3 MPa and 8.7 MPa, respectively. The physical properties of the cement are shown in Fig. 1(a) and Table 1 and the chemical composition is shown in Fig. 1 (b) and Table 2.
2.2 Experiments
2.2.1 Experimental design
The experiments are aimed at investigating the hydration products and thermal decomposition properties of SCPB. Also, to optimize the mechanical properties of SCPB, the effect of NS on the relevant properties of SCPB is studied. The slurry concentration is set at 65%, cement dosage is 15%, NS dosages are 0% and 1.0% respectively, and the curing time is 28d, and the specific scheme is shown in Table 3.
Sample
Slurry concentration = 65%, Cement dosage = 15%
Curing time (d)
Tailings (kg)
Cement (kg)
Water (kg)
Nano-SiO2 (kg)
NS0
5.180
0.915
3.280
0.000
28
NS1
0.009
2.2.2 Testing methods
A series of test techniques are used to analyze the hydration products and thermal decomposition properties of SCPB, and the test process is shown in Fig. 2. The tests are as follows.
UCS test. The specimen curing temperature is 20 °C and the curing humidity is 95%. When the specimen is cured to 28d, the UCS test is carried out by WDW-2000 automatic pressure testing machine with a loading rate of 0.5 mm/min, and the UCS value is taken as the average of the test results of 3 specimens.
XRD test. The CPB specimens are ground into powder and their mineral phases are analyzed by X-ray diffractometer to determine the components of hydration products under different effect factors. XRD tests are performed in the 2θ range of 5 ∼ 70°, and data are collected using 7 s/step with a step size of 0.03°.
FTIR test. Infrared spectroscopic is to irradiate a beam of infrared rays of different wavelengths onto the molecules of a substance, different substances can absorb infrared rays of specific wavelengths, forming infrared absorption spectra, and the structural composition of the substance to be measured is deduced from the spectral bring, and the content of the substance to be measured is obtained according to the intensity of the absorption spectral band.
TG-DTG test. the TG curve mainly reflects the relationship between the mass of the substance and the temperature, and the DTG curve indicates the rate of change of mass as a function of time and temperature. In this test, the initial temperature is 20 °C, and the heating rate is 10 °C/min, 20 °C/min, and 30 °C/min respectively, and the test is stopped when the temperature rises to 900 °C.
SEM test. The specimens are taken from the fragments of each dose in this experiment, soaked in anhydrous ethanol for more than 48 h to terminate their hydration, then dried and ground. With the aid of a high magnification scanning electron microscope, the microscopic morphology of the samples to be tested are scanned and the results are used to analyze the microstructure and hydration products of the specimens.
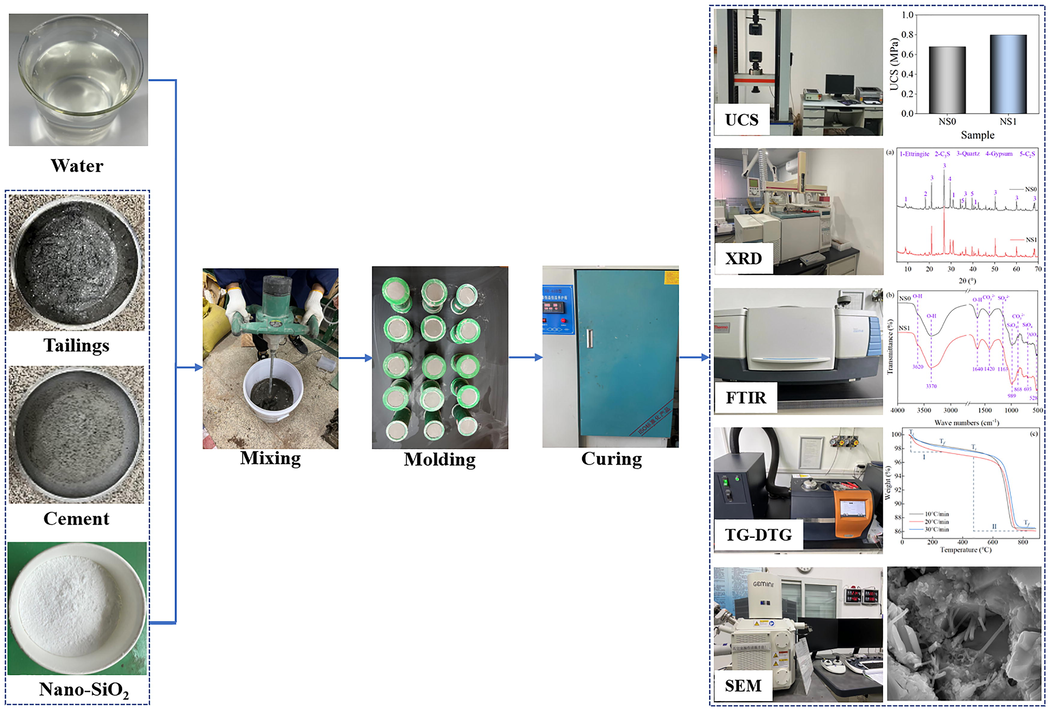
- Main experimental process.
2.3 Kinetic analysis
2.3.1 Kinetic equations of thermal decomposition
The thermal decomposition of cement-based materials is a heterogeneous reaction system and takes place under non-isothermal conditions (Hussain et al., 2018; Chen et al., 2020). The kinetic process of thermal decomposition can be described as follows (Sikora et al., 2022; Panda et al., 2022; Gupta et al., 2020).
In equation (1), α is the conversion rate of reactants to products during thermal decomposition; f (α) is the reaction mechanism function; A(min−1) is the pre-exponential factor; β(K/min) is the heating rate; E(kJ/mol) is the apparent activation energy; R is the universal gas constant, 8.314 J/(mol⋅K); and T(K) is the kelvin temperature.
In the thermal decomposition process, the conversion rate α is calculated by the following equation (Urciuolo et al., 2020).
In equation (2), m0 is the initial weight of the specimen; mt is the weight of the specimen at moment t; and m∞ is the final weight of the specimen.
The integral form of the kinetic equation for the thermal decomposition reaction is obtained by integrating equation (1) as follows (Li et al., 2022).
In equation (3), G(α) is the integral form of the reaction mechanism function; f (α) is the initial temperature of the thermal decomposition reaction.
2.3.2 Calculating the apparent activation energy E
The investigated thermal decomposition experiments are conducted at 3 heating rates of 10 °C/min, 20 °C/min, and 30 °C/min. To avoid errors due to the assumed reaction mechanism function, the TG data at different heating rates are calculated and the apparent activation energy E is obtained using the Flynn-Wall-Ozawa (FWO) method and the Kissinger-Akahira-Sunose (KAS) method (Urciuolo et al., 2020; Gao et al., 2020; Gupta and Kashani, 2021). The expressions of the FWO method and the KAS method are as follows.
2.3.3 Determine the most probable reaction mechanism function
In this research, the Integral master-plot method is used to determine the G(α) at different stages of thermal decomposition (Chen et al., 2017; Wang et al., 2019). The method determines the most probable G(α) and thus f(α) by comparing the morphology of theoretical master-plots with that of experimental master-plots. At room temperature T0, the thermal decomposition of cement-based materials is extremely slow, so equation (3) can be expressed approximately as follows.
In equation (6), uα = E/RTα; E is the average value of apparent activation energy calculated by the FWO and KAS methods; Tα is the temperature at which the conversion rate of the thermal decomposition reaction is α; and P(uα) is the temperature integral.
Since the temperature integral is a non-convergent integral, this research uses the Tang-Liu-Zhang-Wang-Wang approximation expression to approximate the expression P(uα) as follows (Wang et al., 2019).
Based on the E values obtained by the method in section 2.2.1, the variation of TG data can be simulated using an appropriate reaction mechanism function. The specific method is as follows.
Firstly, substituting α = 0.5 as a reference into equation (6) yields the following equation.
Secondly, dividing equation (6) by equation (8) yields the integral master-plot equation as follows.
The 15 common reaction mechanism functions f(α) and their integral forms G(α) are shown in Table S1 in the supplementary file (Alenezi and Al-Fadhli, 2018; Fu and Yao, 2022). The theoretical master-plots are obtained by plotting G(α)/G(0.5) and α, and the experimental master-plots are obtained by plotting f(α)/f(0.5) and α. By comparing the shapes and deviations of these 2 curves, the most probable G(α) can be determined, and thus the most probable f(α).
3 Results and discussions
3.1 Properties of thermal decomposition
The TG and DTG curves of SCPB at heating rates of 10 °C/min, 20 °C/min, and 30 °C/min are shown in Fig. 3. The thermal decomposition of SCPB mainly appears in the range of 33 °C ∼ 260 °C and 420 °C ∼ 820 °C. These two temperature intervals correspond to 2 heat absorption peaks, indicating that there are mainly 2 stages of thermal decomposition of SCPB. In the first stage, the mass loss mainly comes from the removal of ettringite crystals from the hydration products and water of crystallization from the C-S-H gels. The mass loss of 1.9% for the NS0 specimen and 2.7% for the NS1 specimen indicates that more hydration products are generated in the NS-doped SCPB. In the second stage, the mass loss is mainly from the dissipation of CO2 in the carbonate product. 11.2% mass loss for NS0 specimens and 11.1% mass loss for NS1 specimens indicate that the mass loss is essentially the same for both specimens at this stage. In addition, there is a weak heat absorption peak at around 400 °C from the dehydroxylation of Ca(OH)2. The Ca(OH)2 content within the specimen at the late stage of hydration is low, and thus the peak here is weak.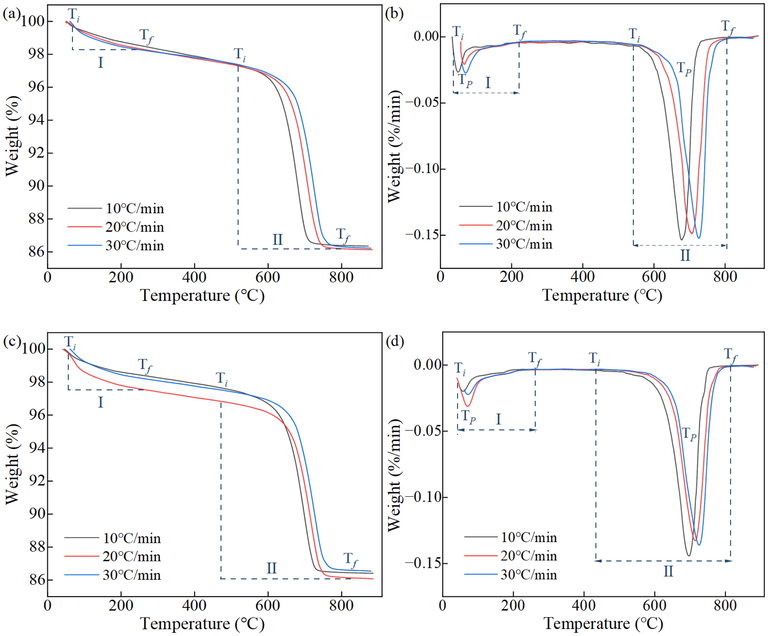
TG-DTG results: (a) and (b) are the TG and DTG curves of NS0, (c) and (d) are the TG and DTG curves of NS1.
The DTG parameters of SCPB at different heating rates are shown in Table 3. In the first stage, Ti of the NS0 specimen increases from 33.00 °C to 60.47 °C, TP increases from 50.41 °C to 72.08 °C, and Tf increases from 192.89 °C to 221.66 °C with the increase of β. In the second stage, Ti of the NS0 specimen increases from 561.01 to 578.75 °C, TP from 678.54 °C to 723.58 °C, and Tf from 755.49 °C to 807.44 °C with the increase of β. The same pattern is shown in the NS1 specimen, i.e., Ti, TP, and Tf are shifted to higher temperatures as β increases. This is mainly because the faster the rate of temperature increase, the more significant the hysteresis of the specimen to the temperature phenomenon.
3.2 Kinetic analysis
3.2.1 Calculation of apparent activation energy E
The kinetic equations of 1/T and lgβ and ln(β/T2) calculated from the TG data according to the FWO and the KAS methods are shown in Table S2 in supplementary files. A linear fit to the above data using the least squares method is shown in Fig. 4. The slope of the linear curve obtained by the FWO method is −0.4567E/R, and the slope of the linear curve obtained by the KAS method is -E/R. Since R is a constant value, the apparent activation energy E at different conversion rates can be calculated from the slope. As can be seen from Fig. 3, the R2 of all linear curves is greater than 0.9, which indicates the goodness of fitting of the curves and the suitability of the FWO and KAS methods for calculating the apparent activation energy of thermal decomposition of SCPB.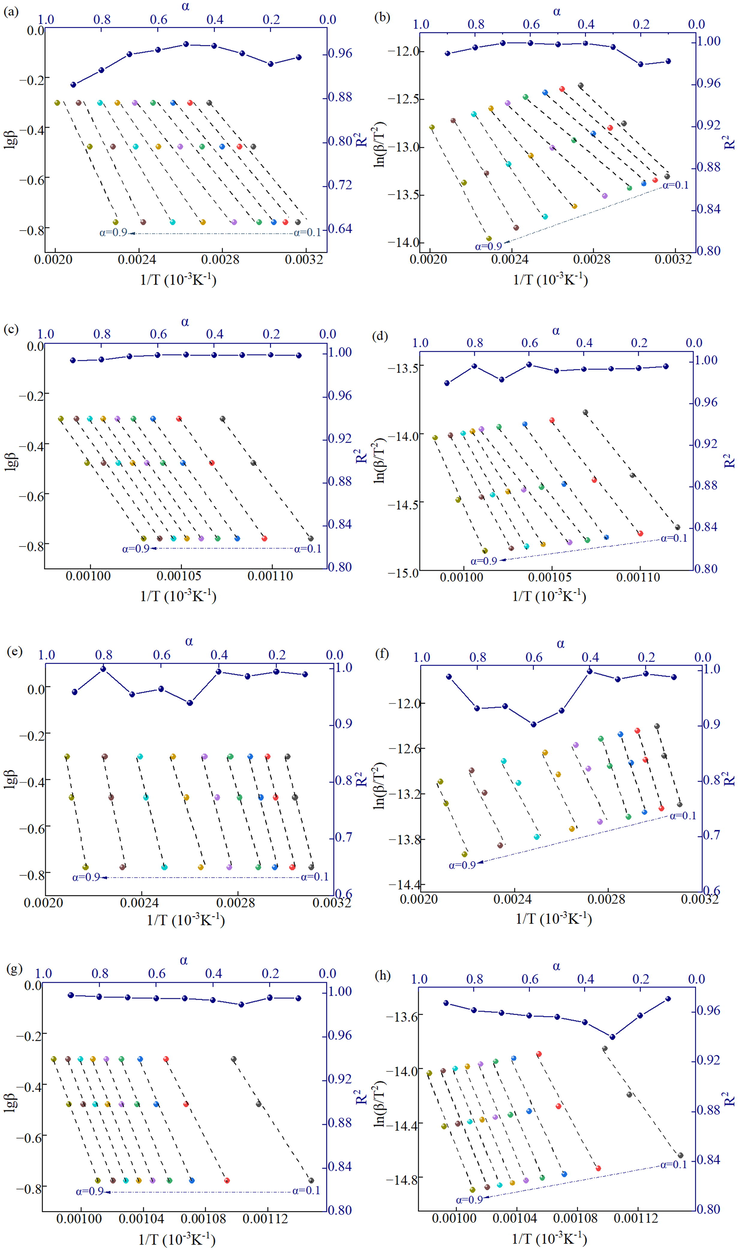
Kinetic fitting results: (a) and (b) for the first stage of NS0 specimen (FWO and KAS), (c) and (d) for the second stage of NS0 specimen (FWO and KAS), (e) and (f) for the first stage of NS1 specimen (FWO and KAS), (g) and (h) for the second stage of NS1 specimen (FWO and KAS).
The E of NS0 specimens calculated by the FWO and KAS methods are 35.34 kJ/mol and 30.91 kJ/mol for the first stage and 188.65 kJ/mol and 182.43 kJ/mol for the second stage. E of NS1 specimens are 37.46 kJ/mol and 32.99 kJ/mol for the first stage and 266.25 kJ/mol and 264.04 kJ/mol for the second stage. Overall, the E value calculated by the FWO method is slightly higher than that of the KAS method, but the results of both methods are identical, indicating that the calculation results are reliable. The arithmetic average of the apparent activation energies calculated by the 2 methods is used as the E values of different thermal decomposition stages, then the E of the first and second stages of thermal decomposition of NS0 specimens is 33.13 kJ/mol and 185.54 kJ/mol, and the E of the first and second stages of thermal decomposition of NS1 specimens is 35.23 kJ/mol and 265.15 kJ/mol. The E of the first stage of the thermal decomposition of SCPB is significantly lower than that of the second stage because the percentage of activated molecules and the bonding energy of the substance undergoing thermal decomposition in the second stage are higher than those in the first stage. The E of the first stage of thermal decomposition of the NS1 sample is higher than that of the NS0 sample, which indicates that the hydration products (ettringite and C-S-H) generated in the NS-doped SCPB are more stabilized and require higher energy to decompose, as demonstrated in this research in section 3.3.
3.2.2 Determine the most probable reaction mechanism function f(α)
The P(uα) corresponding to different α can be obtained by combining E calculated in section 3.1.1 for different thermal decomposition stages by equation (7). The experimental master-plots can be obtained by plotting P(uα)/ P(u0.5) vs. α. The experimental master-plots of P(uα)/ P(u0.5) vs.α. for different thermal decomposition stages of SCPB are shown in Fig. 5. It can be observed that the trends of experimental master-plots at different heating rates of the same thermal decomposition stage are the same and overlap, indicating that the experimental master-plots are not affected by the heating rate, and also indicating that only a unique kinetic model exists for each thermal decomposition stage.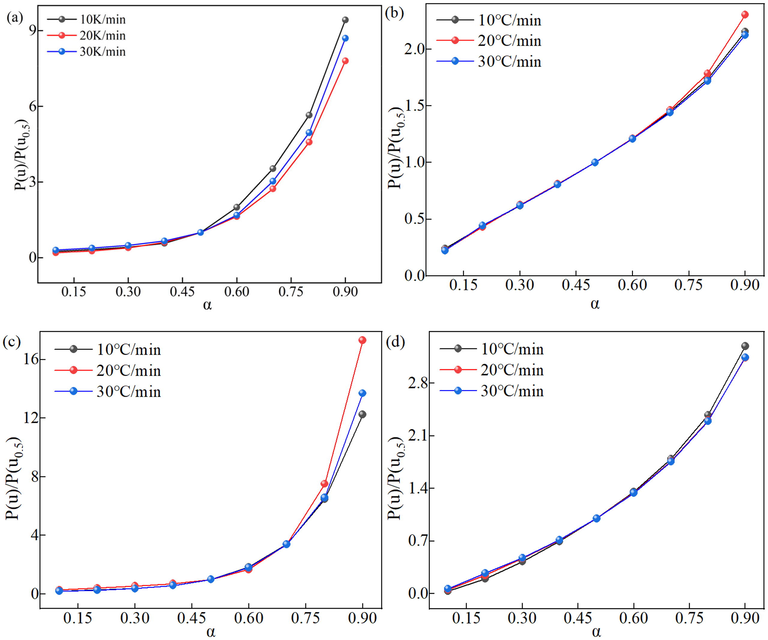
The experimental master-plots of P(uα)/ P(u0.5) vs.α. for different thermal decomposition stages of SCPB: (a) and (b) for the first stage of NS0, (c) and (d) for the first stage of NS1.
From Eq. (9), P(uα)/ P(u0.5) = G(α)/ G(0.5), so the experimental master-plots of P(uα)/ P(u0.5) with α are the experimental master-plots of G(α)/ G(0.5) with α. Based on the uniqueness of the kinetic model, the most probable reaction mechanism functions for different thermal decomposition stages are determined by comparing the experimental master-plots and theoretical master-plots with a heating rate of 20 °C/min, and the results are shown in Fig. 6. The experimental master-plots of the first stage of thermal decomposition of SCPB show the highest similarity to the theoretical master-plots O2 with an R2 of 0.978. O2 is a reaction order model with the function of the form G(α) = (1-α)-1-1. The experimental master-plots of the second stage of SCPB thermal decomposition show the highest similarity to the theoretical master-plots O1 with R2 of 0.996. O1 is a reaction order model with the function of the form G(α) = -ln(1-α). After adding NS, the experimental master-plots of the first stage of thermal decomposition of SCPB show the highest similarity to the theoretical master-plots O3 with an R2 of 0.966. O3 is a reaction order model with a function of the form G(α) = [(1-α)-2-1]/2. The experimental master-plots of the second stage of thermal decomposition of SCPB show the highest similarity to theoretical master-plots A1.5 with an R2 of 0.999. A1.5 is a random nucleation and growth model with a function of the form G(α) = [(1-α)-2-1]/2.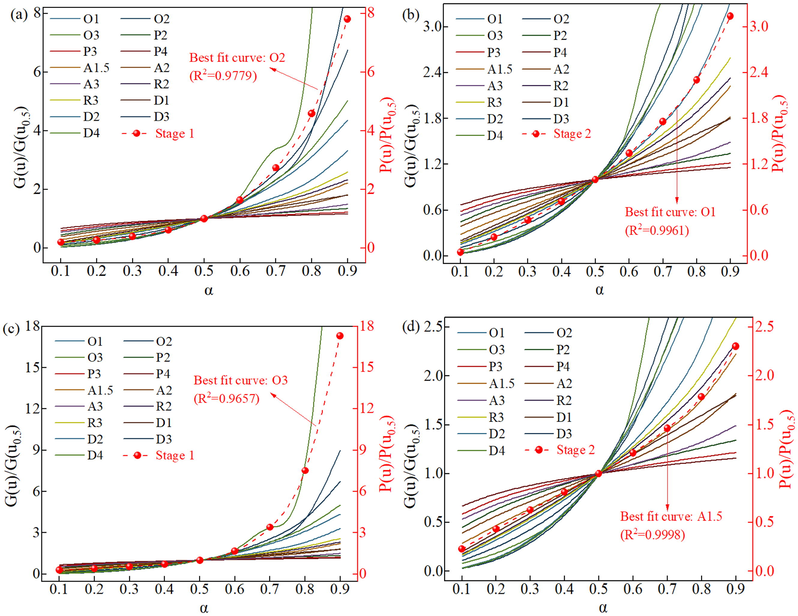
The comparison of experimental master-plots and theoretical master-plots: (a) and (b) for the first stage of NS0, (c) and (d) for the first stage of NS1.
3.2.3 Determine the pre-exponential factor A
The value of the pre-exponential factor represents the chance of effective collision of activated molecules during thermal decomposition (Campbell et al., 1991; Zhdanov, 1981; Bruce and Saidi, 1990). The larger the pre-exponential factor is, the more frequent the effective collision of activated molecules during thermal decomposition, i.e., the more intense the thermal decomposition reaction is.
The reaction mechanism functions f(α) (O1, O2, O3, and A1.5) for different thermal decomposition stages can be calculated by substituting into equation (6) to obtain the pre-exponential factor A for different thermal decomposition stages, as shown in Table 4. As can be seen from Table 4, the average A value of the first stage of thermal decomposition of SCPB is 2.65 × 10⁷ min−1, and after adding NS, the average A value is 6.5 × 10⁷ min−1, and the average A value is increased by 153.32%. The average A value of the second stage of thermal decomposition of SCPB is 6.2 × 10¹² min−1, and after adding NS, the average A value is 1.96 × 10¹⁷ min−1, and the average A-value increased exponentially. On the one hand, whether it is the NS0 specimen or NS1 specimen, as the temperature continues to increase, the activated molecules increase, their effective collisions are more and more frequent, the thermal decomposition reaction rate is faster and faster, and the pre-exponential factor increases correspondingly. On the other hand, the addition of NS increases the hydration products of SCPB (detailed analysis in section 3.3), which provides more active sites for the thermal decomposition reaction to proceed, resulting in a significant increase in the number of activated molecules, which in turn substantially increases their frequency of collisions, resulting in a significant increase in A. This indicates that NS acts as an activator during the thermal decomposition reaction of SCPB. It also shows from the side that NS doping effectively increases the production of hydration products during the curing process of SCPB, which plays a positive role in the enhancement of the macroscopic strength of SCPB. Substituting the 3 kinetic elements (A, E, and f(α)) in Table 4 into Eq. (1), the kinetic equations of SCPB at different stages of thermal decomposition are obtained as follows.(See Table 5).
*Ti, TP, and Tf are the initiation temperature, peak temperature, and final temperature of the heat absorption peak, respectively.
Specimen
β (℃/min)
Stage 1 (℃)
Stage 2 (℃)
Ti
TP
Tf
Ti
TP
Tf
NS0
10
33.00
50.41
192.89
561.01
678.54
755.49
20
57.17
68.51
218.65
574.38
704.68
781.93
30
60.47
72.08
221.66
578.75
723.58
801.22
NS1
10
46.15
57.69
213.36
419.46
781.87
697.48
20
50.47
70.19
224.8
447.9
714.61
807.44
30
60.99
72.23
259.02
468.34
725.77
823.94
Sample
Stage
β(℃/min)
E(kJ/mol)
A(min−1)
f (α)
NS0
1
10
33.1279
2.5410 × 10⁷
(1-α)2
20
1.8741 × 10⁷
30
3.4529 × 10⁷
2
10
188.646
6.3413 × 10¹²
1-α
20
6.0529 × 10¹²
30
6.1985 × 10¹²
NS1
1
10
35.2239
4.1737 × 10⁷
(1-α)3
20
9.1656 × 10⁷
30
6.1643 × 10⁷
2
10
265.1674
2.2767 × 10¹⁷
1.5(1-α)[-ln(1-α)]1/3
20
1.8221 × 10¹⁷
30
1.7831 × 10¹⁷
3.3 Mechanism of formation of hydration products
The XRD test results of SCPB are shown in Fig. 7(a). There are significant dispersion peaks and characteristic crystalline phase peaks in the range of 10°∼40° of the XRD pattern, and these diffraction peaks represent the phases mainly ettringite, C3S, quartz, gypsum, and C2S. Among them, ettringite is the hydration product, C3S, gypsum, and C2S are from cement, and quartz is from tailings and NS. C3S is mainly hydrolyzed in early hydration reactions and is an important source of early strength of cement-based materials. Compared with the NS0 specimen, the diffraction peak intensity of C3S is significantly lower in the NS1 specimen, which indicates that the addition of NS to SCPB can promote the hydrolysis of C3S, which is extremely beneficial to improve the early strength of SCPB. Compared with C3S, C2S reacts slowly, thus C2S is detected in all specimens. This indicates that the addition of NS can play a catalytic role, which to a certain extent promotes the excitation of sulfate and thus the hydrolysis of gypsum, thus increasing the production of hydration products.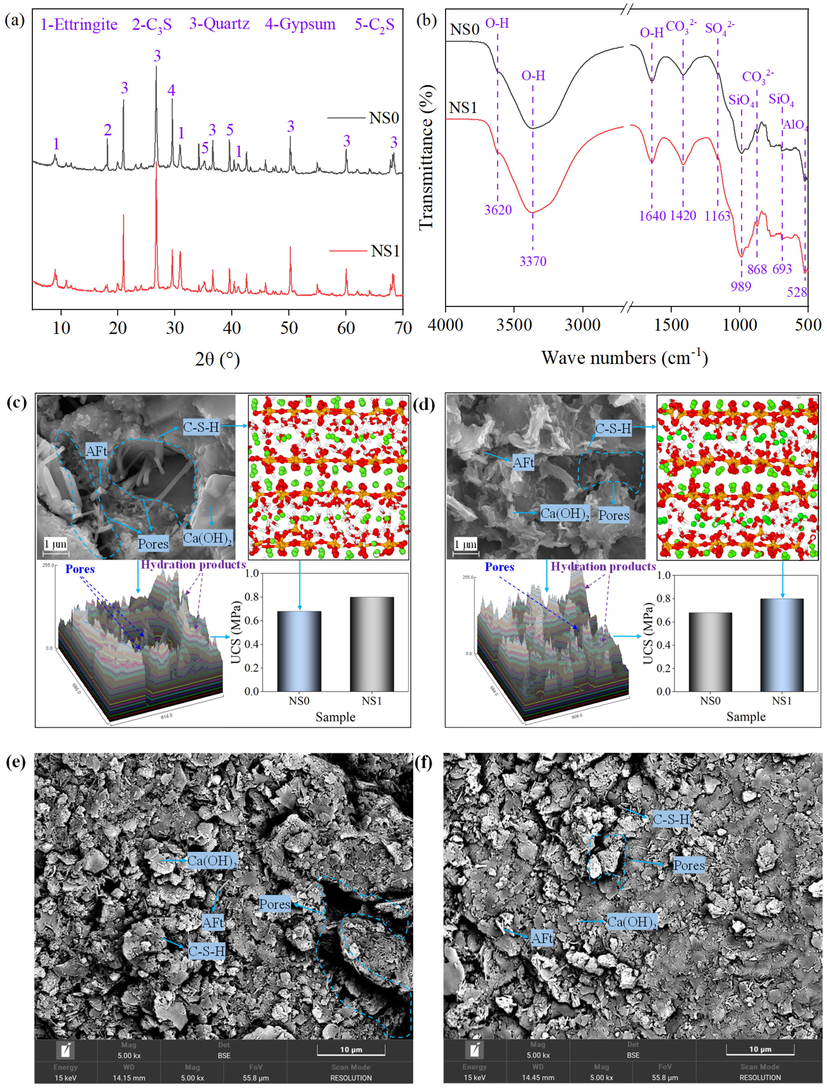
The micro analysis results: (a) XRD, (b) FTIR, (c) and (d) are SEM, grayscale analysis, and C-S-H molecular structure of NS0 and NS1 respectively, (e) and (f) are SEM of NS0 and NS1 respectively.
The molecular structures of the hydration products are analyzed based on FT-IR and the results are shown in Fig. 7(b). The characteristic peaks of O–H bonds indicate the presence of water molecules as well as OH– in the hydration products. The characteristic peaks of the stretching vibration of the O–H bond in this study are from gypsum at 3620 cm−1 and crystalline water of the hydration product at 3370 cm−1. The characteristic peak of the bending vibration is from the crystalline water of the hydration product at 1640 cm−1. The transmittance of the characteristic peaks of the O–H bonds located at 3370 cm−1 and 1640 cm−1 in the SCPB samples is significantly reduced after the addition of NS, which indicates that more hydration products such as ettringite and C-S-H are generated in SCPB, and this result is consistent with the results of XRD analysis. The characteristic peaks at 1420 cm−1 and 868 cm−1 are the characteristic peaks of stretching vibration and bending vibration from the C-O bond of the carbonated products. The characteristic peak at 1163 cm−1 is the bending vibration peak of the S-O bond of SO42- in gypsum and it is relatively low, which indicates that the gypsum in cement participates in the hydration reaction to a high degree. The characteristic peaks near 989 cm−1 and 693 cm−1 are the vibrational shrinkage peaks of the Si-O bond of silicon-oxygen tetrahedra (SiO4) in C-S-H, and the characteristic peaks near 528 cm−1 are the vibrational shrinkage peaks of the Al-O bond of aluminum-oxygen tetrahedra (AlO4) in ettringite. The addition of NS to SCPB reduced the transmittance of the above 2 characteristic peaks, which indicates that more hydration products are generated.
The SEM images, 3D grayscale images, C-S-H molecular structure, and UCS test results of SCPB are shown in Fig. 7(c)-(f). From the SEM images, the microstructure of SCPB is mainly composed of solid particles, C-S-H gels, Ca(OH)2 crystals, ettringite crystals, and pores. The NS0 specimen contains a large number of pores with dendritic crystals of ettringite distributed in the pores, accompanied by a few C-S-H gels (Sargam et al., 2021). The ettringite crystals in the NS1 specimen are encapsulated by the C-S-H gel to fill the pores, and thus its pores are less (AlKhatib et al., 2020). The three-dimensional grayscale image can quantitatively reflect the integrity of the microstructure of SCPB, and the higher the grayscale value the more complete its structure is, and at the same time its UCS is larger. The average grayscale value of 99.04 for the NS0 specimen and 106.82 for the NS1 specimen indicate that the integrity of the SCPB structure is improved by the addition of NS, which is consistent with the observation of SEM images (Hu et al., 2023). The UCS of the NS0 specimen is 0.68 MPa and the UCS of the NS1 specimen is 0.80 MPa, and the UCS is enhanced by 17.65% under the condition that the average greyscale value is increased by 7.86%. In general, the addition of NS to SCPB generates more hydration products such as C-S-H and ettringite. These hydration products fill in the solid inter-particles, resulting in a reduction of pore space, an increase in structural integrity, and an increase in the macroscopic strength of SCPB (Guo et al., 2021).
The Ca/Si (C/S) ratios of the C-S-H gels of NS0 and NS1 specimens are 2.05 and 1.69, respectively, using an energy spectrum analyzer. The molecular structures of the two C-S-H gels constructed using molecular dynamics indicate that the average silica chain length of C-S-H is 3.04 at a C/S of 1.69 and decreases to 2.70 at a C/S of 2.05. The decrease in the length of the silicon chain means that the strength of the molecular structure of C-S-H is weakened. In addition, C/S has a more significant effect on the water content of C-S-H. When C/S is 1.69, H2O/Si (H/S) is 1.74; when C/S increases to 2.05, H/S increases to 2.37. The increase of water molecules in C-S-H means that its SiO2 group decreases and defects are created in the silicon chains in the structure, which is the reason why the apparent activation energy E of the first stage of thermal decomposition (corresponding to the decomposition of hydration products) of the NS0 specimen is lower than that of the NS1 specimen. Therefore, the larger the H/S, the more unstable the C-S-H structure is, and the macroscopic performance of the strength of SCPB is reduced. It can be seen that SCPB doped with NS generates C-S-H gels with lower C/S and higher stability, and these gels fill the pores and enhance the structure of SCPB, which in turn enhances the strength of SCPB.
4 Conclusion
In this research, the formation mechanism and characteristics of the hydration products of SCPB are investigated by a series of experiments and combined with the kinetics of thermal decomposition. There are 2 main stages of the thermal decomposition of SCPB. The substances that undergo thermal decomposition reactions in the first stage are mainly hydration products such as ettringite and C-S-H, and the substances that undergo thermal decomposition reactions in the second stage are carbonates. As the heating rate increases, the heat absorption peaks of the different thermal decomposition stages are shifted toward higher temperatures. The kinetic models for both thermal decomposition stages of SCPB are reaction order models. After adding NS, the apparent activation energy and pre-exponential factor of its first stage increased by 6.3% and 153.3%, respectively; the apparent activation energy of the second stage increased by 40.6% and the pre-exponential factor increased exponentially. This indicates that the hydration products of SCPB with the addition of NS are more stable in structure on the one hand, and on the other hand, it shows that NS plays the role of activator in the thermal decomposition process of SCPB. NS can promote the hydrolysis of C3S and gypsum, increase the production of hydration products, and thus enhance the strength of SCPB. In addition, NS will have a pozzolanic reaction in SCPB, and the C/S and H/S of the resulting C-S-H gels decrease, and the average silicon chain length and SiO2 groups increase, which leads to the structural enhancement of the C-S-H gels. This is one of the reasons for the increased strength of SCPB. The results of the research have important significance for the performance optimization and efficient utilization of SCPB.
Declaration of Competing Interest
The authors declare that they have no known competing financial interests or personal relationships that could have appeared to influence the work reported in this paper.
References
- Thermal degradation kinetics of waste printed circuit boards. Chem. Eng. Res. Des.. 2018;130:87-94.
- [CrossRef] [Google Scholar]
- Development of high performance concrete using industrial waste materials and nano-silica. J. Mater. Res. Technol.. 2020;9(3):6696-6711.
- [CrossRef] [Google Scholar]
- Structural and magnetic properties of nanosized CoxZn(1–x)Fe2O4 (x= 0.0, 0.5, 1.0) synthesized via autocatalytic thermal decomposition of hydrazinated cobalt zinc ferrous succinate. Ceram. Int.. 2019;45(17, Part A):21793-21803.
- [CrossRef] [Google Scholar]
- Variation of the preexponential factor and activation energy for lithium diffusion in cubic titanium disulfide. J. Solid State Chem.. 1990;88(2):411-418.
- [CrossRef] [Google Scholar]
- Trends in preexponential factors and activation energies in dehydrogenation and dissociation of adsorbed species. Chem. Phys. Lett.. 1991;179(1):53-57.
- [CrossRef] [Google Scholar]
- Studies on thermokinetic of Chlorella pyrenoidosa devolatilization via different models. Bioresour. Technol.. 2017;244:320-327.
- [CrossRef] [Google Scholar]
- Sludge biochar as a green additive in cement-based composites: mechanical properties and hydration kinetics. Constr. Build. Mater.. 2020;262:120723
- [CrossRef] [Google Scholar]
- Utilization of modified copper slag activated by Na2SO4 and CaO for unclassified lead/zinc mine tailings based cemented paste backfill. J. Environ. Manage.. 2021;290:112608
- [CrossRef] [Google Scholar]
- Pyrolysis mechanism of natural fiber in cement-based composites at high temperatures. Constr. Build. Mater.. 2022;351:128986
- [CrossRef] [Google Scholar]
- Thermochemical conversion of sewage sludge: a critical review. Prog. Energy Combust. Sci.. 2020;79:100843
- [CrossRef] [Google Scholar]
- Improving the performance of superfine-tailings cemented paste backfill with a new blended binder. Powder Technol.. 2021;394:149-160.
- [CrossRef] [Google Scholar]
- Flowability of ultrafine-tailings cemented paste backfill incorporating superplasticizer: Insight from water film thickness theory. Powder Technol.. 2021;381:509-517.
- [CrossRef] [Google Scholar]
- Utilization of biochar from unwashed peanut shell in cementitious building materials – effect on early age properties and environmental benefits. Fuel Process. Technol.. 2021;218:106841
- [CrossRef] [Google Scholar]
- Latest trends in heavy metal removal from wastewater by biochar based sorbents. J. Water Process Eng.. 2020;38:101561
- [CrossRef] [Google Scholar]
- Unraveling disadhesion mechanism of epoxy/CSH interface under aggressive conditions. Cem. Concr. Res.. 2021;146:106489
- [CrossRef] [Google Scholar]
- Enhancing interfacial bonding between epoxy and CSH using graphene oxide: an atomistic investigation. Appl. Surf. Sci.. 2021;568:150896
- [CrossRef] [Google Scholar]
- Molecular dynamics study on sodium chloride solution transport through the Calcium-Silicate-Hydrate nanocone channel. Constr. Build. Mater.. 2022;342:128068
- [CrossRef] [Google Scholar]
- Strength investigation of the cemented paste backfill in alpine regions using lab experiments and machine learning. Constr. Build. Mater.. 2022;323:126583
- [CrossRef] [Google Scholar]
- Effects of mixing time and nano silica on some properties of superfine-tailings cemented paste backfill. Constr. Build. Mater.. 2023;378:131188
- [CrossRef] [Google Scholar]
- Cement catalyzed conversion of biomass into upgraded bio-oil through microwave metal interaction pyrolysis in aluminum coil reactor. J. Anal. Appl. Pyrol.. 2018;129:37-42.
- [CrossRef] [Google Scholar]
- The fabrication of SiBCN ceramic components from preceramic polymers by digital light processing (DLP) 3D printing technology. J. Eur. Ceram. Soc.. 2018;38(14):4597-4603.
- [CrossRef] [Google Scholar]
- Thermal properties and pyrolysis kinetics of phosphate-rock acid-insoluble residues. Waste Manag.. 2022;146:77-85.
- [CrossRef] [Google Scholar]
- Dynamic characteristics of superfine tailings–blast furnace slag backfill featuring filling surface. Constr. Build. Mater.. 2020;242:118173
- [CrossRef] [Google Scholar]
- Shrinkage behaviour, early hydration and hardened properties of sodium silicate activated slag incorporated with gypsum and cement. Constr. Build. Mater.. 2020;248:118687
- [CrossRef] [Google Scholar]
- Investigation of intercalation of diphenhydramine into the interlayer of smectite by XRD, FTIR, TG-DTG analyses and molecular simulation. Arab. J. Chem.. 2017;10(6):855-861.
- [CrossRef] [Google Scholar]
- C. Martínez-Ortiz-de-Montellano, J.F.D.J. Torres-Acosta, C.A. Sandoval-Castro, I. Fourquaux, H. Hoste, Scanning electron microscopy of different vulval structures in a Mexican Haemonchus contortus isolate, Veterinary Parasitology: Regional Studies and Reports. 26 (2021) 100640, https://doi.org/10.1016/j.vprsr.2021.100640.
- Functional group characteristics and pyrolysis/combustion performance of fly ashes from Karamay oily sludge based on FT-IR and TG-DTG analyses. Fuel. 2021;296:120669
- [CrossRef] [Google Scholar]
- Scrap computer keyboards a sustainable resource for silver (Ag) and low density oil (L D Oil) Sustain. Mater. Technol.. 2022;33:e471.
- [Google Scholar]
- Pressure drops of fresh cemented paste backfills through coupled test loop experiments and machine learning techniques. Powder Technol.. 2020;361:748-758.
- [CrossRef] [Google Scholar]
- Effects of packing density and water film thickness on the fluidity behaviour of cemented paste backfill. Powder Technol.. 2020;359:27-35.
- [CrossRef] [Google Scholar]
- Simultaneously improving mechanical and microwave absorption properties of a novel SiCf/SiOC & mullite hybrid ceramic matrix composite. J. Eur. Ceram. Soc.. 2021;41(15):7560-7571.
- [CrossRef] [Google Scholar]
- Effects of anionic and nonionic surfactants on the dispersion and stability of nanoSiO2 in aqueous and cement pore solutions. Cem. Concr. Res.. 2021;144:106417
- [CrossRef] [Google Scholar]
- B. Saroha, A. Kumar, R. Raman Maurya, M. Lal, S. Kumar, H. Kumar Rajor, I. Bahadur, D. Singh Negi, Adsorption of cysteine on metal(II) octacynaomolybdate(IV) at different pH values: Surface complexes characterization by FT-IR, SEM with EDXA, CHNS and Langmuir isotherm analysis, Journal of Molecular Liquids. 349 (2022) 118197, https://doi.org/10.1016/j.molliq.2021.118197.
- Effect of Mn-doping on the morphological and electrical properties of (Ba0·7Sr0.3) (MnxTi1−x)O3 materials for energy storage application. Ceram. Int.. 2022;48(18):25816-25825.
- [CrossRef] [Google Scholar]
- A systematic experimental study on biochar-cementitious composites: towards carbon sequestration. Ind. Crop. Prod.. 2022;184:115103
- [CrossRef] [Google Scholar]
- Preparation and characterization of a new alkali-activated binder for superfine-tailings mine backfill. Environ. Sci. Pollut. Res.. 2022;29(48):73115-73130.
- [CrossRef] [Google Scholar]
- On the agglomeration tendency of carbonaceous fuels in fluidized beds. Fuel. 2020;277:118187
- [CrossRef] [Google Scholar]
- Thermal characteristics and product formation mechanism during pyrolysis of penicillin fermentation residue. Bioresour. Technol.. 2019;277:46-54.
- [CrossRef] [Google Scholar]
- P. Yellareddy, C.N.S.S. Kumar, M. Gowrisankar, S. Babu, M.V. Rathnam, Study on molecular interactions of binary mixtures of 2,6 dimethyl cyclohexanone with substituted anilines at T = (303.15–313.15)K through thermodynamic properties and FT-IR spectra and correlation with the Jouyban–Acree model, Journal of Molecular Liquids. 343 (2021) 117708, https://doi.org/10.1016/j.molliq.2021.117708.
- Artificial intelligence model for studying unconfined compressive performance of fiber-reinforced cemented paste backfill. Trans. Nonferrous Met. Soc. Chin.. 2021;31(4):1087-1102.
- [CrossRef] [Google Scholar]
- Prediction of backfill strength based on support vector regression improved by grey wolf optimization. J. Shanghai Jiaotong Univ. (Sci.) 2022
- [CrossRef] [Google Scholar]
- Strength prediction and application of cemented paste backfill based on machine learning and strength correction. Heliyon. 2022;8(8):e10338.
- [Google Scholar]
- Effect of the lateral interaction of adsorbed molecules on preexponential factor of the desorption rate constant. Surf. Sci.. 1981;111(1):L662-L666.
- [CrossRef] [Google Scholar]
- Feasibility study and performance optimization of sand-based cemented paste backfill materials. J. Clean. Prod.. 2020;259:120798
- [CrossRef] [Google Scholar]
Appendix A
Supplementary material
Supplementary data to this article can be found online at https://doi.org/10.1016/j.arabjc.2023.104977.
Appendix A
Supplementary material
The following are the Supplementary data to this article:Supplementary data 1
Supplementary data 1


