

Translate this page into:
Hydrochemical appraisal and sources of contamination in high nitrate aquifer, Saudi Arabia
⁎Corresponding author at: Water Research Center, King Abdulaziz University, Jeddah 21598, Saudi Arabia. rnatarajan@kau.edu.sa (Natarajan Rajmohan),
-
Received: ,
Accepted: ,
This article was originally published by Elsevier and was migrated to Scientific Scholar after the change of Publisher.
Peer review under responsibility of King Saud University.
Abstract
A systematic study was executed in the Wadi Fatimah basin, Saudi Arabia to appraise the hydrochemical processes, contamination sources and water quality using an integrated approach namely geochemical methods, multivariate statistical analyses and water quality indices. In this aquifer, the average value of electrical conductivity and total dissolved solids is 4292 µS/cm and 2747 mg/l, respectively. The predominant hydrochemical facies are CaMgCl followed by NaCl. Further, 76% (hardness), 51% (major ions and NO3−) and 15% (F−) of samples surpassed the World Health Organization-prescribed drinking water limit. The contamination index and drinking water quality index (DWQI) also reveal that 25% and 46% of samples are not appropriate for drinking application. Spatial maps of major ions, total hardness and DWQI depict that water quality is deteriorated from upstream to downstream and extreme values exist in the downstream. Gibbs plots, ionic ratios, Pearson correlation coefficient and principal component analysis justify that groundwater chemistry is predominantly affected by evaporation, evaporite dissolution and ion exchange reactions followed by mineral weathering. High NO3− originates from nitrification, irrigation return flow and wastewater recharge. Groundwater F− is derived from weathering of fluoride minerals and enhanced by evaporation. This study emphasizes that proper treatment is required for groundwater before distribution for various uses in this basin.
Keywords
Groundwater
Ionic ratios
Geochemistry
Multivariate statistical analysis
Wadi Fatimah
Saudi Arabia

1 Introduction
Groundwater is a prominent potable water resource for various uses for numerous peoples around the world, mainly in arid and semi-arid regions (Besser et al., 2021; Ghiglieri et al., 2021; Yifru et al., 2021). Vast uses of groundwater in irrigation, industries and domestic sectors lead to groundwater depletion in the coastal regions and degraded water quality (Alshehri et al., 2021; Kammoun et al., 2021). Saline water invasion is very common in coastal aquifers owing to the over-extraction of groundwater that resulted from rapid population growth and commercial and other activities (Kanagaraj et al., 2018; Wen et al., 2019; Xu et al., 2021). Besides, the shallow aquifer is often vulnerable to surface and sub-surface contaminations sources namely dumping sites, landfills, sewage networks and irrigation return flow (Rehman and Cheema, 2016; Nethononda et al., 2019; Kammoun et al., 2021). Guo et al. (2022) studied the impact of landfills on groundwater quality in northwest China and reported that Fe, Mn, As and F accumulated in the aquifer due to landfill leachate. Irrigation return flow is also often documented for water quality degradation in the shallow aquifer (Nethononda et al., 2019; Gomez et al., 2021; Kammoun et al., 2021). Thus, identifying potential pollution sources and periodic monitoring of groundwater quality in the shallow aquifer is a crucial task in aquifer management to protect and conserve water resources.
Groundwater quality degradation results in various health issues for consumers and environmental problems . Groundwater contamination by NO3− and F− is often documented compared to other pollutants around the world (Oenema et al., 1998; Nolan et al., 2002; Fernandez-Cirelli et al., 2009; Furi et al., 2011; Cheong et al., 2012; Vithanage and Bhattacharya, 2015; El-Mountassir et al., 2022; Mukherjee and Singh, 2022). NO3− accumulation in the groundwater is a result of various factors namely fertilizers, manures application, pesticides, herbicides, sewage lines and septic tank leakages, wastewater discharge from various sources and accumulation of livestock waste (Rajmohan et al., 2017; Rajmohan, 2020; Torres-Martínez et al., 2021). Water with high NO3− is toxic to humans, which causes several diseases such as; methemoglobinemia, frequent abortions, thyroid gland issues, cancer, mutagenesis, etc (Wu and Sun, 2016; Stayner et al., 2021; Essien et al., 2022). Essien et al. (2022) reviewed the literature to assess the nexus between drinking water nitrate and cancer risk and found a strong relationship between them. Also, they found that the high NO3− causes specific cancer risks and congenital disabilities in humans.
Fluoride contamination is widely reported and around 200 million people are affected by fluorosis in 28 countries (Dhingra and Shah, 2021). Dhingra and Shah (2021) performed a detailed review of fluoride contamination worldwide and reported that the USA, India, Iran, China, Canada, Thailand, Pakistan, Algeria and Libya are chiefly affected by fluoride-related health hazards. Fluoride contamination in groundwater is a serious concern in arid and semi-arid regions (Radfard et al., 2019; Younas et al., 2019; Liu et al., 2021; Senthilkumar et al., 2021). Chronic consumption of F− rich water leads to various health hazards like skeletal and dental fluorosis in humans. Ligaments calcification, mottling of teeth, crippling, osteoporosis, calcification of blood vessels and respiratory tract infections are some of the F− related health issues reported in earlier studies (Ozsvath, 2009; Ghosh et al., 2013; Peckham et al., 2015; Kebede et al., 2016; Chowdhury et al., 2019; Jiang et al., 2019; Li et al., 2020; Dhingra and Shah, 2021). Fluoride enrichment in the groundwater is regulated by both natural phenomena and human activities. Weathering of fluoride-bearing rocks and minerals, evaporation and volcanic eruptions are predominant natural sources whereas the usage of phosphate fertilizers in agriculture and irrigation return flow are major anthropogenic sources of F− accumulation in the groundwater (Brindha et al., 2011; Furi et al., 2011; Haji et al., 2021; Liu et al., 2021; Mukherjee and Singh, 2022).
In Saudi Arabia (KSA), groundwater quality and quantity are a serious concern due to extremely arid climate. Rainfall is also erratic and causes flash floods that recharge the shallow aquifer (Mashat and Abdel, 2011; Masoud, 2015; Masoud et al., 2018; Masoud et al., 2019). The agricultural sector is the primary groundwater consumer in this country (MoWE, 2014). Extensive pumping from shallow aquifers depleted the groundwater level and degraded the water quality (Kanagaraj et al., 2018; Ranjbar et al., 2020). To overcome these challenges, KSA relay on non-traditional water resources such as desalinated seawater and treated wastewater. Apart from water scarcity, groundwater pollution is also a primary concern, which further worsens the water availability for various uses in Saudi Arabia (Alfaifi et al., 2020; Rajmohan et al., 2021a; Masoud et al., 2022; Rajmohan et al., 2022). Thus, a detailed investigation was carried out in the Wadi Fatimah basin, Saudi Arabia to explore the sources of contamination, geochemical processes and water quality status using an integrated approach namely, geochemical methods, multivariate statistical analyses and water quality indices. As groundwater quality is the key concern in this water-stressed basin, this study is essential for the effective and sustainable management of groundwater resources. This study was performed to (a) identify the sources of contamination and hydrochemical processes governing water chemistry through the geochemical and multivariate statistical approach, (b) elucidate the aquifer contamination status using the contamination index, and (c) assess water suitability for drinking by comparing with international standards and calculating water quality index. This work provides insight into the current status of groundwater contamination and its usability for various uses in this basin.
2 Study area
The Wadi Fatimah basin is located within the administrative boundaries of the Makkah region and it extends from northeast to southwest covering about 4869 km2, which represents the whole catchment starting from the upstream to the outlet at the Red Sea Coast (Fig. 1). The study basin is a portion of the Tihama coast of the Arabian shield, its upstream portion is starting from Al Taif Governorate and is sloping towards the Red Sea passing through the city of Makkah Al-Mukarramah, through several governorates and cities such as Al-Jumoum and reaching Jeddah City. The length of the Wadi Fatimah basin is about 150 km from the Taif to the coast of the Red Sea.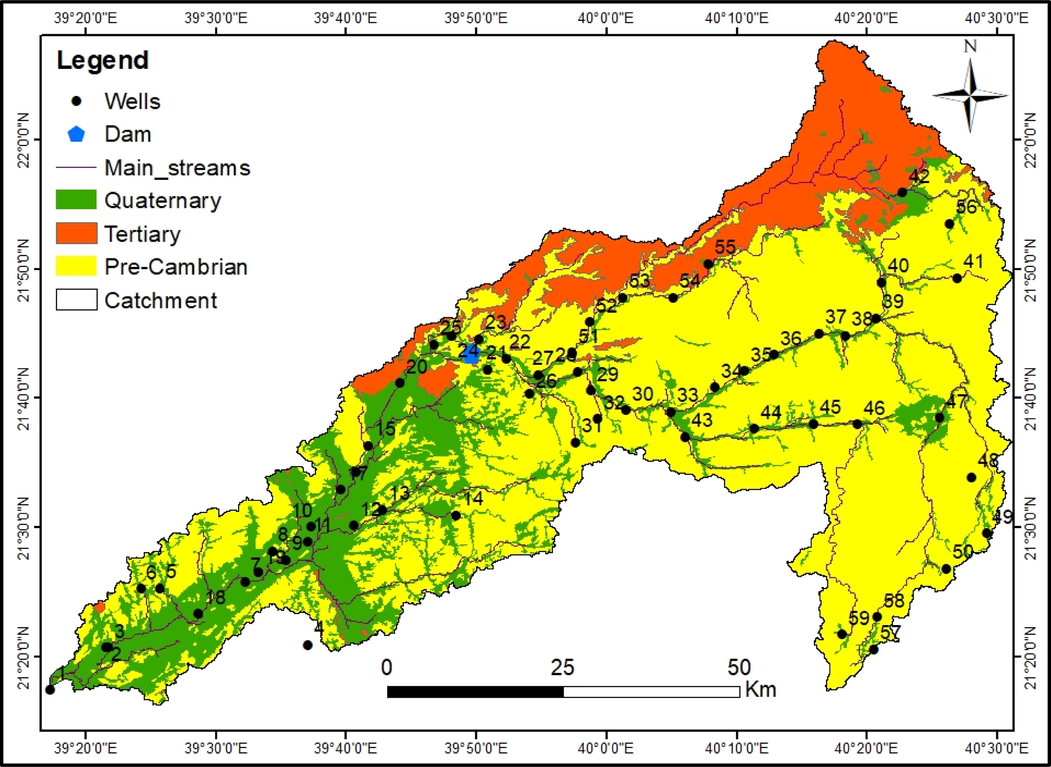
Location of sampling wells, geology and drainage pattern in the Wadi Fathima basin. Numbers – sampled wells number.
Geomorphologically, the Wadi Fatimah basin shows typical characteristics of Saudi hydrographic basins in the western region of the escarpment ridge of the Arabian Shield. It initiates from the eastern high mountainous range of sharp gradients and decreases down towards the west at the coastal plain of the Tihama region (Alyamani and Hussein, 1995; Hamimi et al., 2012; Masoud, 2015). The Wadi Fatimah basin’s elevation ranges between 10 and 2314 m. The Wadi Fatimah basin exhibits several geomorphological landscapes, which could be designated as; (1) Mountainous areas of high elevations that include mainly Precambrian rocks with an elevation of 2300 m (amsl; above mean sea level), which forms the water divide of the drainage basin. This mountainous region has an important factor in the rainfall pattern and runoff occurrences due to the topographic impact; (2) the hill region resides in the eastern and middle portions of the basin, which consists of undulating dissected and eroded rocks and (3) the Piedmont plains, which are located in the low elevated areas between the high lands and the Red Sea include morpho-tectonic depressions and the high order of the stream network.
Geologically, the Wadi Fatimah basin is composed of Precambrian, Tertiary rocks, and Quaternary alluvial deposits (Fig. 1) (Hamimi et al., 2012). The Basement (Precambrian) rocks consist of basalt to rhyolite volcanic rocks, metamorphic rocks, and includes intrusions of miscellaneous ages and compositions. The exposures of Tertiary rocks are encountered below the lava and Quaternary deposits by about 14 % of the area of the Wadi Fatimah basin. These Tertiary rocks are sandstone, shale, and mudstones with the conglomerate. Quaternary aquifer occupies a considerable percentage (22%) of the Wadi Fatimah basin with a range of 2–80 m thickness and is composed of alluvial, gravels, sands and Wadi deposits. The depth of groundwater, measured in this study, varies from < 1 m to 57.6 m, and a deeper water table is found in the centre of the study area.
3 Materials and methods
3.1 Water sampling and laboratory analysis
In the Wadi Fatimah basin, fieldwork was conducted to identify the borewells and dug wells for groundwater sampling. In the study area, wells are not uniformly distributed, and very limited wells are available for groundwater pumping due to the aridity and the topography of the area (Fig. 1). Water samples were collected from 59 wells (both bore and dug wells). Sampled wells' locations were georeferenced by a global position system (GPS, Garmin) to plot the spatial maps (Fig. 1). Depth to groundwater level was measured from available wells before pumping using a sounder. pH, electrical conductivity (EC), and temperature were measured for each sample using portable meter (SevenGo Duo SG23, Mettler Toledo). Water sampling, storage and chemical analysis were executed according to international standard protocols (APHA, 2017). Water samples were collected in 500 ml high-density polyethylene (HDPE) bottles in duplicate after the stabilization EC and pH during pumping. Sampling bottles were soaked and rinsed several times with 1:1 nitric acid followed by water and then rinsed with Millipore water. Before sampling, pre-cleaned HDPE bottles were again rinsed with the groundwater to be sampled. Before sampling, borewells were pumped for 10 to 15 min (Purging) to get fresh water representing the aquifer. Water samples were filtered (0.45 µm) and stored at 4 °C in the laboratory. Ion chromatography (Thermos Scientific, ICS 5000+) was used for the analysis of major and minor ions. The instrument was calibrated with standards before performing analysis. To check the accuracy of the analysis, known standards and blanks were run frequently in between the samples to avoid possible errors and to maintain the quality, precision and accuracy of the instrument. Bicarbonate and carbonate were measured using volumetric methods (APHA, 2017). The calculated ion balance error was 5%.
3.2 Data analysis
ArcGIS v10.3 software was employed to prepare the location map and spatial maps for the various parameters measured for the groundwater of the study area. Ionic ratios and other geochemical methods are adopted to evaluate geochemical processes and sources of contamination. Groundwater usability for drinking was assessed using international drinking water standards and the drinking water quality index (DWQI).
3.3 Multivariate statistical analysis
SPSS (version 16.0) was applied to calculate descriptive statistics and to conduct Pearson correlation analysis and principal component analysis (PCA). For PCA analysis, data were log-transformed and standardized to get a dimensionless data set. Standard scores (z-score) were used for PCA analysis (Güler et al., 2002; Ren et al., 2021). In the PCA analysis, 13 variables were used, and CO32− was excluded as it is absent in some samples. Varimax rotation with Kaiser normalization was adopted and Principal components with an eigenvalue greater than one were selected for further interpretation.
3.4 Drinking water quality index
The drinking water quality index (DWQI) is extensively used to categorize groundwater suitability for drinking in most studies (Adimalla and Qian, 2019; Kumar and Krishna, 2021; Kadam et al., 2022). DWQI is a single value obtained from multiple water quality parameters and a large data set. For each parameter, a weight (2 to 5) is assigned according to its relative importance (Table 1). DWQI is obtained from Eqs. (1) to (4).
Parameter
Weight
Relative weight
pH
3
0.079
TDS
5
0.132
TH
3
0.079
Na+
2
0.053
K+
2
0.053
Ca2+
3
0.079
Mg2+
3
0.079
Cl−
4
0.105
SO42−
3
0.079
NO3−
5
0.132
F-
5
0.132
3.5 Contamination index
The cumulative impacts of contaminants on drinking water were computed using the Contamination index (Cd), which is most often employed for metal pollution assessment in water (Backman et al., 1998). In this study, the cumulative impact of NO3− and F− on groundwater was computed using Cd, which is determined using Eqs. (5) and (6).
4 Results and discussion
4.1 General chemistry
Descriptive statistics computed for water quality data in the study site are given in Table 2. In this aquifer, the EC varied from 782 to 22,500 µS/cm (4292 µS/cm, average) and total dissolved solids (TDS) ranged from 500 to 14400 mg/l (2747 mg/l, mean). The EC is less than 3000 µS/cm and 5000 µS/cm in 58% and 75% of samples, respectively. Extreme salinity (EC > 10000 µS/cm) is recorded in well numbers 1, 5, 10, 11, 26 and 42 (Fig. 3). Unit – mg/l except pH and EC (µS/cm).
Min
Max
Average
STD
WHO (2017)
WHO (2017)
HDL
MAL
% of samples > HDL
% of samples > MAL
pH
6.6
7.8
7.3
0.2
6.5
7.5
–
22
EC
782
22,500
4292
4645
–
–
–
–
TDS
500
14,400
2747
2973
500
1500
100
49
TH
168
5615
1222
1197
100
500
100
76
Na+
34
2623
423
523
200
–
47
–
K+
1.41
22
8.1
3.52
12
–
14
–
Ca2+
51
1669
323
332
75
200
95
51
Mg2+
10
509
101
100
50
150
61
22
Cl−
73
5213
875
1146
200
600
76
44
CO32−
BDL
24
8.34
7.66
–
–
–
–
HCO3−
85.4
384
169
53
–
–
–
–
SO42−
45.5
3248
680
689
200
400
92
42
NO3−
0.62
144
51
31
45
–
51
–
F-
0.04
3.9
0.60
0.76
1.5
–
15
–
4.2 Hydrochemical facies and their spatial distribution
Groundwater quality data were plotted on the Chadha diagram (Chadha, 1999) to identify the hydrochemical facies in this aquifer. Fig. 2 depicts that water samples were plotted in two major facies and most of the samples (81%) are plotted on Ca-Mg-Cl facies and the rest of them on Na-Cl facies except one sample. Fig. 2 indicates that Cl is dominating over HCO3− in the groundwater. Depth to water level is plotted on the Chadha diagram to identify its relationship with hydrochemical facies. Groundwater in deep wells is normally expected to be HCO3− facies due to mineral water interaction. In the study site, deeper wells are also plotted on Ca-Mg-Cl facies (Fig. 2). The domination of chloride even in the deeper aquifer indicates that the water chemistry is most likely affected by the anthropogenic input, evaporation and evaporites (Kloppmann et al., 2013; Rajmohan et al., 2021b).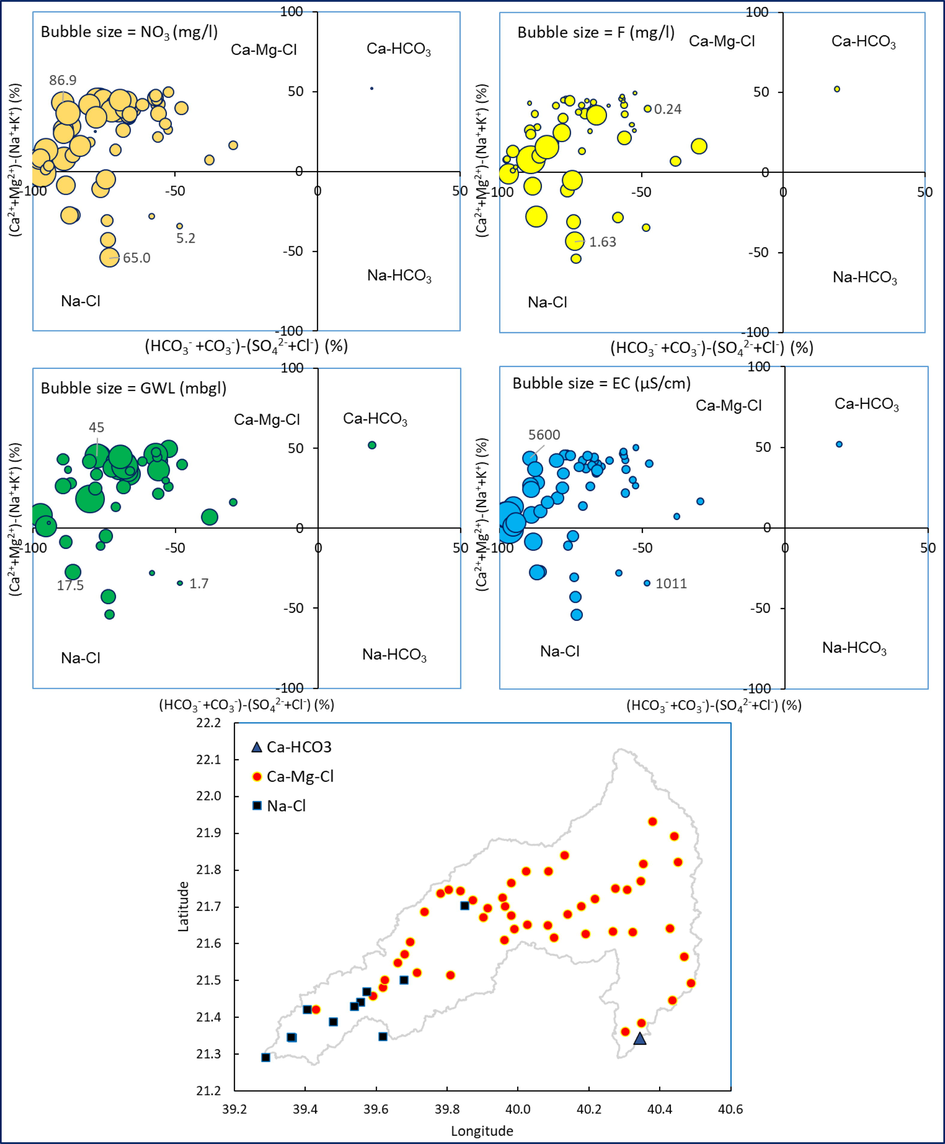
Relationship between hydrochemcial facies, NO3−, F−, EC and depth to groundwater level and spatial distribution of hydrochemical facies in the study site.
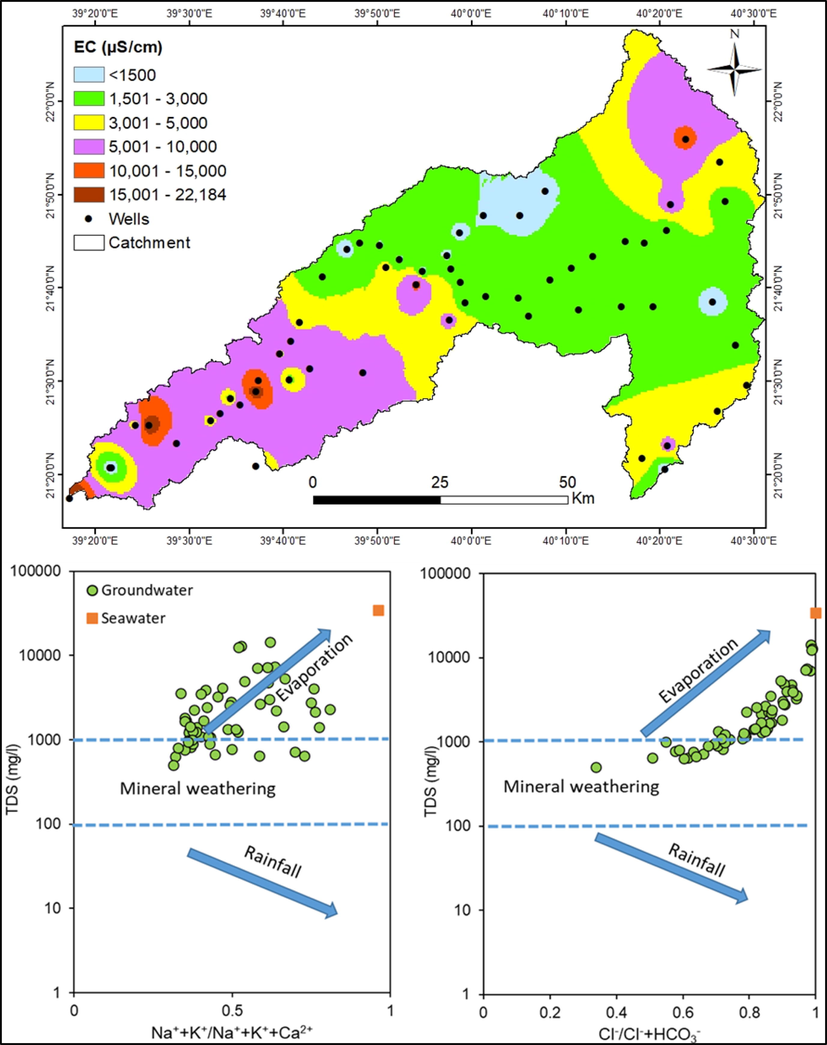
Spatial distribution of EC and predominant geochemical processes in Wadi Fathima basin.
Interrelationships between hydrochemical facies and NO3− pollution were studied (Fig. 2). Fig. 2 illustrates that high NO3− water is clustered in Ca-Mg-Cl facies. This observation implies that the groundwater with Ca-Mg-Cl facies is influenced by the surface and sub-surface contamination sources in the study area. In contrast to this observation, high fluoride is noticed in both facies, however, all wells in Na-Cl facies have high fluoride content. Elumalai et al. (2019) also reported a similar observation in South Africa. In the Na-Cl facies, F− concentration varied from 0.3 to 2.1 mg/l (1.2 mg/l, mean) while the range of F− in Ca-Mg-Cl facies is from 0.04 to 3.9 mg/l (0.5 mg/l, mean). High F− concentrations in Na-Cl facies suggest the role of evaporation on water chemistry (Rafique et al., 2015; Elumalai et al., 2019). Fig. 2 shows that wells with Na-Cl facies occurred in the coastal region. Water chemistry in the coastal region is likely impaired by evaporation and evaporite dissolution.
4.3 Geochemical processes and source of ions
In the study site, the EC is less than 3000 µS/cm in the upstream wells (Fig. 3). However, few wells in the north-eastern region (well no. 42 (11270 µS/cm), 40 (6150 µS/cm), 56 (4040 µS/cm)) and south-eastern (well no. 58 (5520 µS/cm), 49 (4400 µS/cm), 59 (3790 µS/cm), 50 (3550 µS/cm)) region have high EC. This observation is quite strange, and the water quality is most likely affected by the long storage, which facilitates the rock-water interaction. As per the geology, the study site is formed by volcanic formations (Basalt).
Gibbs plots are employed to explore the geochemical processes controlling water chemistry (Fig. 3). Gibbs applied the ionic ratios and TDS to differentiate the influences of rainfall input, weathering of minerals and evaporation processes on water chemistry. During evaporation, Na/Ca ratio increases along with TDS progressively due to the precipitation of carbonates and enrichment of salinity. Similarly, Cl/HCO3 ratio also rises due to the removal of HCO3− during evaporation. Fig. 3 explains that most of the water samples clustered in the evaporation zone. Na + K/Na + K + Ca ratios range from 0.31 to 0.81 with an average value of 0.49. The Cl/Cl + HCO3 ratios vary from 0.34 to 0.99 with a mean value of 0.80 and show a nexus with TDS and both are increased progressively. Thus, Gibbs plots suggest that groundwater quality is predominantly governed by evaporation (76%) and mineral weathering (24%) in the study site. Other studies also reported a similar inference in Saudi Arabia (Rajmohan et al., 2021b; Masoud et al., 2022). Fig. 3 also illustrates that water chemistry in this basin is not impaired by saline sources as there is a large gap between seawater and freshwater samples.
Ionic ratios are useful tools to explore the source of ions and geochemical processes in any aquifer (Rajmohan et al., 2021b; Elumalai et al., 2023). Fig. 4 illustrates the interrelation between Na/Cl and EC in the study site. The Na/Cl ratio varies from 0.4 to 1.7 with an average of 0.8. The dissolution of sodium salts and halites mostly maintains an equal ratio of Na and Cl in the aquifer. But higher values (Na/Cl > 1) indicate weathering of silicates minerals and/or cation exchange reactions (Meybeck, 1987; Rajmohan and Elango, 2004; Elumalai et al., 2023). In the study site, 24% of samples show higher values, which seems to be influenced by silicate weathering processes. Fig. 4 reveals that in the high salinity groundwater, the Na/Cl ratio is between 0.5 and 0.8 and it is constant while increasing salinity. This observation suggests that evaporation is a primary process governing water chemistry in these wells (Rajmohan and Elango, 2004). The Na/Cl ratio is less than the seawater ratio (Na/Cl = 0.85) in 64% of samples and less than one in 76% of samples, which implies that the Na is depleted by reverse ion exchange reactions and it is common in the coastal aquifers (Karroum et al., 2017; Rajmohan et al., 2021b).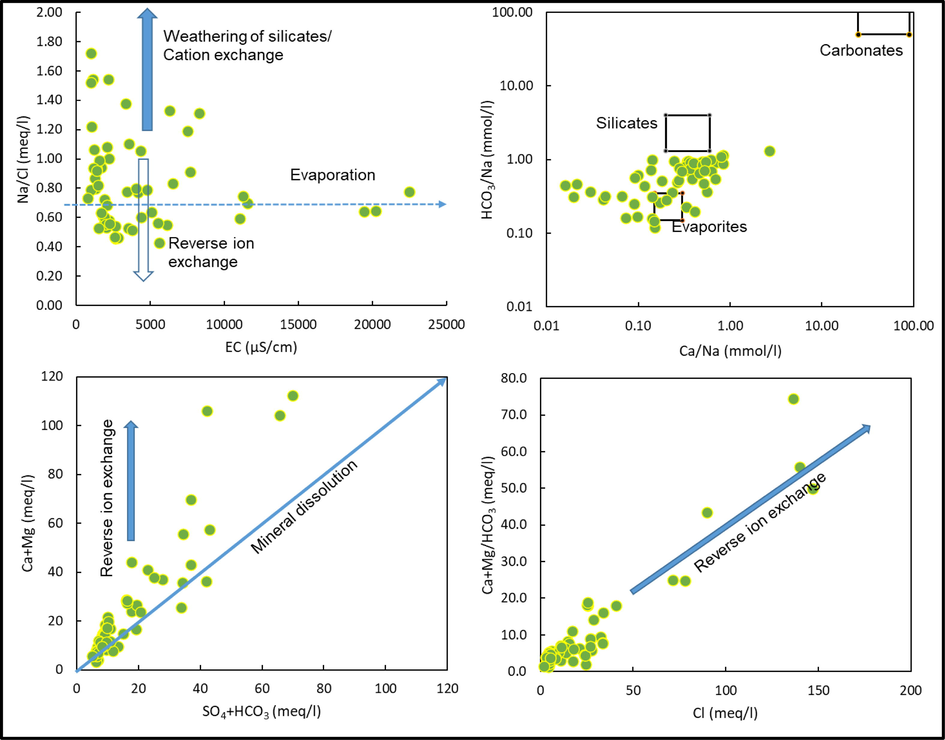
Geochemical processes regulating water chemistry in Wadi Fathima basin.
To explore and differentiate the role of silicate and carbonate weathering and evaporite dissolution on water chemistry, Na+ normalised molar HCO3− is plotted against Na+ normalised molar Ca2+ (Fig. 4). Both HCO3−/Na+ and Ca2+/Na+ molar ratios are less than one except for well numbers 52 and 57 in this study. Fig. 4 indicates that most of them are plotted between silicate and evaporite zones and on the evaporite zone. Few samples were clustered near the silicate zone. Fig. 4 justifies that the water chemistry is predominantly affected by evaporation and evaporite dissolution followed by the silicate weathering processes.
The contribution of weathering and ion exchange processes on water chemistry is assessed using the bivariate plot of Ca2++Mg2+ vs SO42−+HCO3− (Fig. 4). The Ca2+ and Mg2+ resulting from weathering of carbonates and silicates rocks and minerals are balanced by HCO3− alone. Likewise, SO42− is a predominant anion to balance cations resulting from the dissolution of sulphate minerals. Thus, if the Ca2+ and Mg2+ are received from carbonate, silicate and sulphate minerals, both will be balanced by SO42−+HCO3− and maintain a 1:1 equivalent ratio (Rajmohan and Elango, 2004). In this study, some samples follow the equiline and most of them deviated especially at higher concentrations. Elevated concentration of Ca2++Mg2+ over SO42−+HCO3− in this aquifer justifies the role of reverse ion exchange reactions (Rajmohan and Elango, 2004; Rajmohan and Prathapar, 2016; Rajmohan et al., 2021b). Equations (7) and (8) define cation exchange and reverse ion exchange reactions.
To verify the reverse ion exchange reactions, HCO3− normalised Ca2++Mg2+ is plotted against Cl−, which shows a strong positive correlation, and both are increasing progressively, which implies the role of reverse ion exchange reactions in the study area (Fig. 4).
4.3.1 Source of nitrate and fluoride
In this aquifer, NO3− and F− contaminations are a serious concern. Fig. 5a shows that EC and NO3− have strong positive relations. Even in high EC (>10000) water, this relationship is also noticed. Generally, groundwater salinity originated from multiple sources and varies with space. Likewise, NO3− in groundwater originates from various sources namely irrigation return flow, wastewater from the surface and sub-surface pollution sources and nitrification processes (Manikandan et al., 2020; Torres-Martínez et al., 2021; Panda et al., 2022). Chloride is also behaving like EC and expresses a significant positive correlation with NO3− (Fig. 5). Elevated NO3− concentration in high salinity water suggests that recharge of wastewater is mixed with existing high salinity groundwater followed by the evaporation processes. Rajmohan et al. (2021b) reported that salinity and NO3− were increased by the evaporation processes in the Al Lusub basin, Saudi Arabia.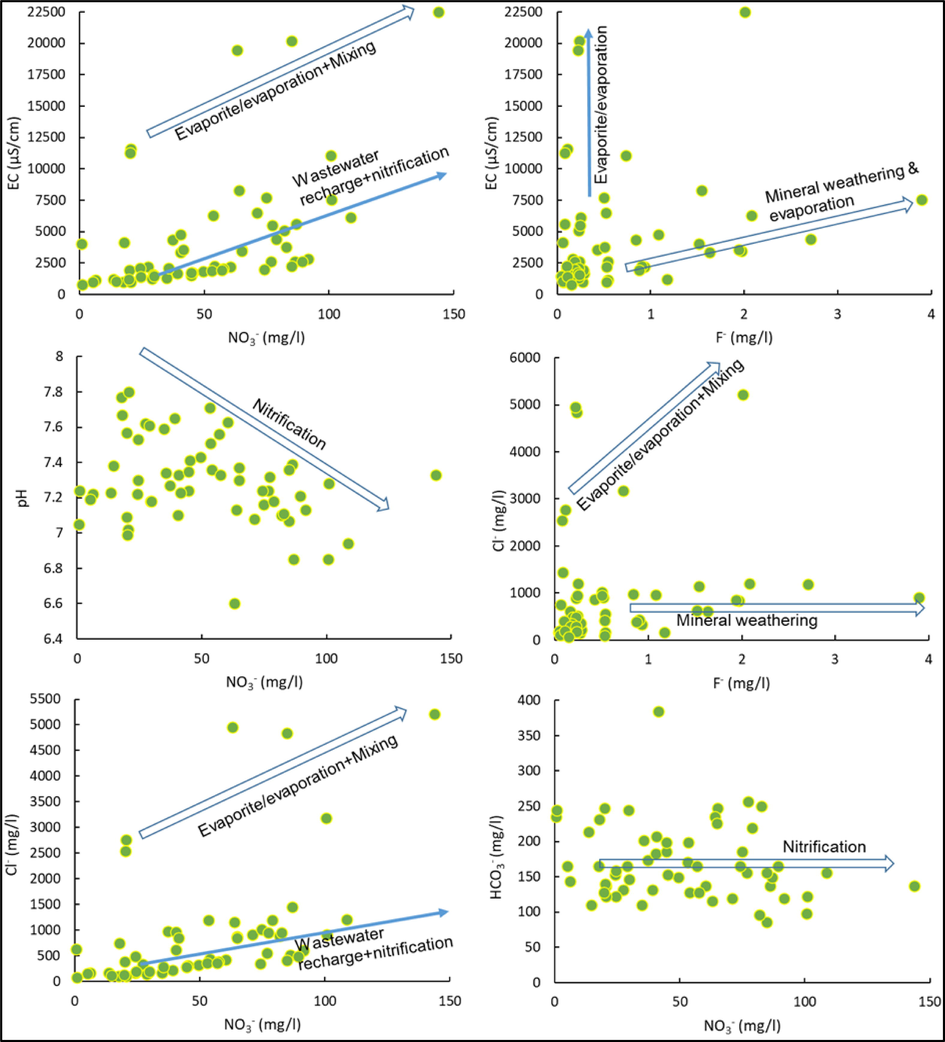
Geochemical processes and source of nitrate, fluoride and other ions in the groundwater.
In this aquifer, pH expresses a negative relationship with NO3− concentration in the groundwater and groundwater with high pH has low NO3− content (Fig. 5). Further, HCO3− concentration is mostly constant with increasing NO3− in the study region. Table 3 indicates that NO3− reveals a significant positive correlation with total hardness (r > 0.55, p < 0.01), Ca2+ (r > 0.52, p < 0.01) and Mg2+ (r > 0.54, p < 0.01), EC (r > 0.50, p < 0.01) and positive correlation with Cl− (r > 0.47, p < 0.01) and SO42− (r > 0.48, p < 0.01). These observations suggest that wastewater recharge and nitrification are important processes in this aquifer. In the study area, agricultural activities are an important factor since various fertilizers are often applied for farming. The common fertilizers used in the area are urea, diammonium phosphate, NPK, ammonium sulphate, gypsum, manure, compost and other micronutrients. Hydrolysis of urea and other nitrogen fertilizers leads to ammonium formation (Equation (9). In aerobic conditions, oxidation of ammonium renders NO3− in the aquifer (Equation (10).
pH
EC
TDS
TH
Na
K
Ca
Mg
Cl
SO4
NO3
pH
1
EC
−0.51
1.00
TDS
−0.51
1.00
1.00
TH
−0.55
0.98
0.98
1.00
Na
−0.44
0.98
0.98
0.93
1.00
K
−0.22
0.24
0.24
0.29
0.18
1.00
Ca
−0.56
0.96
0.96
0.98
0.90
0.36
1.00
Mg
−0.48
0.93
0.93
0.93
0.89
0.12
0.85
1.00
Cl
−0.52
0.98
0.98
0.97
0.97
0.25
0.96
0.89
1.00
SO4
−0.43
0.95
0.95
0.92
0.93
0.15
0.87
0.93
0.89
1.00
NO3
−0.29
0.50
0.50
0.55
0.43
0.07
0.52
0.54
0.47
0.48
1.00
Further, the decomposition of organic materials in an aerobic condition also generates nitrate in the aquifer (Equation (11). Nitrification is a dominant process in arid environments compared to denitrification due to its oxic nature (Gutiérrez et al., 2018).
Acidic protons, resulting from nitrification, reduces pH and trigger mineral dissolution. Generally, an acidic proton is neutralized by the carbonate dissolution in the vadose zone rather than silicates (Meybeck, 1987; Rajmohan et al., 2017). The constant trend in HCO3− with increasing NO3− and the significant positive correlation between NO3− and TH, Ca and Mg imply this process in this aquifer.
Like NO3−, fluoride contamination is also observed in this aquifer. Pearson correlation analysis indicates that there is no correlation between F− and other variables (Table 3). Fig. 5 indicates that F− concentration increases without affecting EC and Cl−. Well number 1 has high salinity (EC – 22,500 µS/cm) as well as F- (2.01 mg/l), which seems to be due to evaporation and wastewater recharge. In the remaining samples, both have a negative relationship. The interrelationship between F−, EC and Cl− suggests that weathering of fluoride minerals followed by evaporation is the predominant process governing F− content in the groundwater in this basin.
4.3.2 Principle component analysis
Principle component analysis was carried out in this study, which resulted in three PCs with 84% of the total variance (Table 4). PC1 accounted for 63% of the total variance and variables namely EC, TDS, TH, Na+, Ca2+, Mg2+, SO42− and Cl− are positively loaded. The high positive loading of these variables justified that groundwater chemistry is predominantly governed by evaporation and evaporite dissolutions in the study area. However, the negative loading of pH and positive loading of NO3− emphasise the role of nitrification in this aquifer. Oxidation of ammonium (Eq. (10) and decomposition of organic materials (Eq. (11) produce acidic proton (H+), which will reduce the pH. Therefore, NO3− shows a negative relationship with pH. Thus, this factor explains both natural and anthropogenic input on water chemistry. PC2 accounts for 11% of the total variance and only potassium is positively loaded in this factor. As aforementioned, agricultural activities are common in the study area and various fertilizers are often applied for farming. Hence, PC2 explains the impact of irrigation return flow and wastewater recharge from agricultural farms. PC3 explains 10% of the total variance in this study and F− and HCO3− are strongly loaded. In the correlation analysis, both F− and HCO3− are also not correlating with other parameters like K. HCO3− is a good indicator for mineral weathering in this study area. Further, earlier discussion strongly suggests that fluoride is predominantly originated from geogenic sources. Thus, PC3 explains the role of mineral weathering in the study area.
Variables
PC1
PC2
PC3
pH
−0.50
−0.42
−0.09
EC
0.98
0.14
−0.01
TDS
0.98
0.14
−0.01
TH
0.97
0.20
−0.05
Na+
0.96
0.07
0.05
K+
0.13
0.86
−0.03
Ca2+
0.93
0.27
−0.09
Mg2+
0.95
0.02
0.04
Cl−
0.96
0.17
−0.05
HCO3−
−0.28
0.37
0.80
SO42−
0.96
0.02
0.05
NO3−
0.60
−0.15
0.08
F-
0.29
−0.33
0.81
Variance (%)
63
11
10
Cumulative variance (%)
63
74
84
4.4 Groundwater suitability assessment
Groundwater quality is evaluated for drinking using international standards (WHO, 2017) and DWQI. The total hardness (TH), computed from calcium and magnesium (TH as CaCO3 mg/l) = 2.497 × Ca2+ +4.115 × Mg2+), ranged from 168 mg/l to 5615 mg/l with a mean value of 1222 mg/l (Table 2). In this aquifer, groundwater is very hard (TH > 300 mg/l) and 76% of samples surpassed the WHO recommended maximum allowable limit (MAL) for drinking. TH is between 500 and 1500 mg/l in most of the wells in the upstream region and higher values are recorded in the downstream wells (Fig. 6). The groundwater is slightly acidic to alkaline and the pH ranged from 6.6 to 7.8 (Table 2). Except for a few samples, pH is greater than 7 and 22% of samples exceeded the WHO MAL. In this aquifer, high Na+ and K+ are also notified and 47% (Na+) and 14% (K+) of samples surpassed the highest desirable limit (HDL) prescribed by the WHO for drinking. High K+ indicates that the water quality is degraded by irrigation return flow and intensive agricultural farming, which is justified by PCA as well. Similarly, Ca2+ and Mg2+ also show elevated concentrations in the study area, and 95% and 61% of samples surpassed HDL and 51% and 22% of samples surpassed MAL for Ca2+ and Mg2+, respectively, which are not appropriate for drinking (Table 2). In the case of Cl−, 76% and 44% of water samples surpassed the HDL and MAL, respectively that are unfit for drinking. Likewise, 92% and 42% of samples have high SO42− (>200 mg/l; >400 mg/l) and are not potable.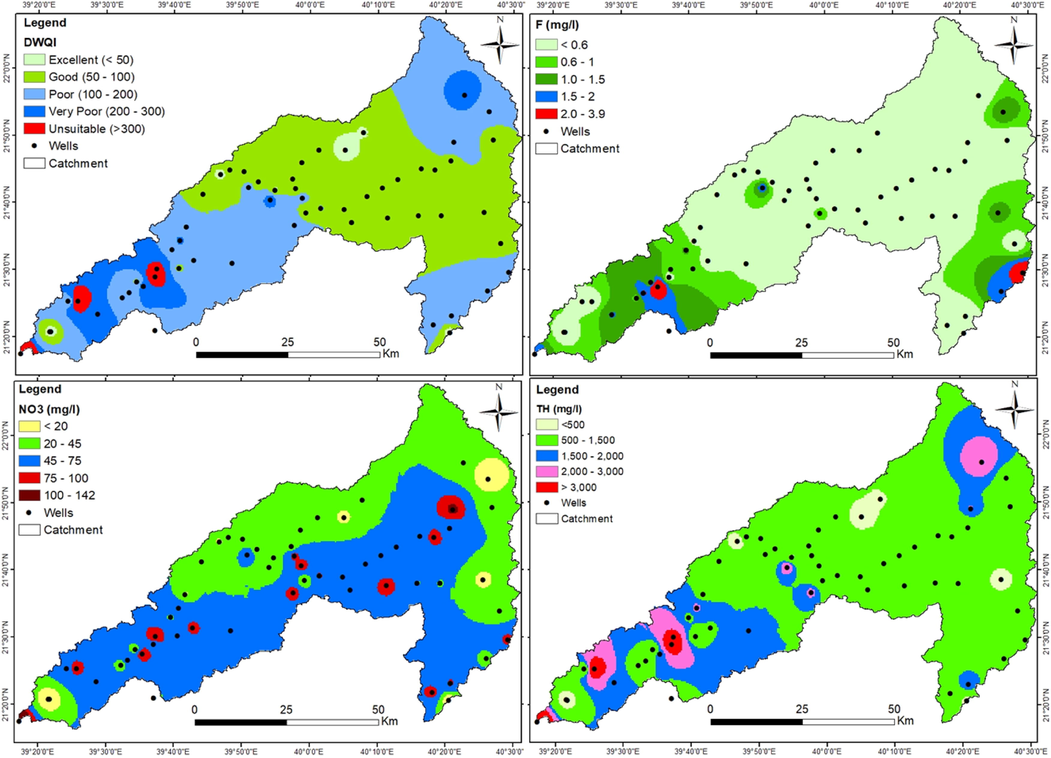
Groundwater quality contamination status in the study site.
The NO3− concentration varied from 0.62 mg/l to 144 mg/l (51 mg/l, mean). According to WHO recommendations, 51% of samples are unfit for drinking which causes severe health hazards for the consumer (Table 2). Fig. 6 depicts NO3− pollution status in the study area. Wells on the southern side and downstream are highly affected by NO3− contamination compared to the northern side and upstream. Extreme values (NO3− > 75 mg/l) are also found in selected wells in various pockets. As aforementioned, NO3− is resulted from nitrification processes and farming practices. Similarly, F− concentration is between 0.04 mg/l and 3.9 mg/l with a mean value of 0.6 mg/l. Fifteen percent of samples are unsuitable for drinking, which leads to acute health risks for consumers. F− contamination is identified in the wells that existed on the southeast and western sides (Fig. 6). Fig. 6 illustrates that except few pockets, F− concentration is <0.6 mg/l in most of the wells.
In this study, DWQI was also adopted to evaluate the water suitability for drinking at the study site. The DWQI ranged from 25 to 609 with a mean value of 131 ± 119 and the standard deviation expresses that the data set has a large variation. According to DWQI classification, 54% of samples fall into excellent (17%) and good (37%) classes, whilst 31% of samples are classified as poor that are unsuitable for drinking uses. Further, 15% of samples belongs to very poor (8%) and unsuitable (7%) classes. Overall, 46% of samples are not appropriate for drinking uses and required proper treatment before serving to the local communities. Fig. 6 illustrates that wells with excellent and good water appeared in the upstream regions except for small pockets in the northern and southern regions. Water quality has deteriorated while moving from the middle stream to downstream in the study site.
4.5 Contamination assessment
Contamination factor (CF) and contamination index (Cd) were calculated in the study site using Eqs. (5) and (6) to assess the groundwater pollution status. CF computed for NO3− and F-, which ranged from −1.0 to 2.2 and −1.0 to 1.6 with a mean value of 0.1 and −0.6, respectively. Based on CF of NO3−, 51% of samples are classified into low (42%) to medium (9%) contamination classes. Likewise, CF of F− suggests that most of the samples are free from F− contamination (85%) and the remaining fall in low contamination classes. As mentioned earlier, 51% and 15% of samples are unfit for drinking due to high NO3− and F−, which exceeded the WHO recommended limit. In the study site, Cd varied from −1.9 to 2.8 and 25% of samples show low to medium contamination. Overall, contamination assessment ensures that NO3− pollution is predominant compared to F− in the study site. The earlier discussion implies that NO3− is derived from anthropogenic sources whereas F− is derived from geogenic sources.
5 Conclusions
Hydrochemical processes and sources of ions were investigated in the Wadi Fatimah basin using an integrated approach. The predominant hydrochemical facies are Ca-Mg-Cl followed by Na-Cl. The interrelationship between hydrochemical facies and depth to water level, NO3− and F− suggest that groundwater in deep wells is also affected by anthropogenic input. Gibbs plots and ionic ratios suggest that the key chemical processes are evaporation and reverse ion exchange in the study site. Weathering of fluoride minerals followed by evaporation is principally governing the F− content in the groundwater. Geochemical methods and Pearson correlation analysis justify that wastewater recharge and nitrification followed by carbonate dissolution are important processes in this aquifer. Elevated NO3− concentration in high salinity water suggests that the recharge of wastewater is mixed with existing high salinity groundwater followed by evaporation. Principle component analysis resulted in three PCs (84%, total variance) and PC1 justifies the role of natural and anthropogenic input on water chemistry in addition to nitrification in this aquifer. PC2 explains the impact of irrigation return flow whereas the positive loading of F− and HCO3− in PC3 implies geogenic sources for fluoride.
Water quality assessment suggests that more than 76% of samples are not appropriate for drinking due to high hardness and other constituents. The contamination index and DWQI indicate that 46% and 75% of samples, respectively, are not appropriate for drinking uses. Overall, NO3− pollution is predominant compared to F− in the study site. Spatial distribution maps depict the water quality deterioration while moving from upstream to downstream and extreme values are seen in the downstream. This study recommends further research using advanced techniques/methods like isotopes to pinpoint the source of contaminations (ie. NO3−, F−) in the study area. In addition, groundwater needs proper treatment before going to supply for various applications in the study area. Application of remediation methods/techniques such as flash flood/rainwater recharge/storage, construction of check-dams, mixing of low and high salinity water, modern agricultural practices, etc, which will improve the water quality and reduce the pollution and salinity in this aquifer.
CRediT authorship contribution statement
Abdulaziz M. Alqarawy: Conceptualization, Writing – review & editing. Natarajan Rajmohan: Funding acquisition, Conceptualization, Investigation, Methodology, Software, Project administration, Supervision, Validation, Visualization, Writing – original draft, Writing – review & editing. Milad H.Z. Masoud: Conceptualization, Investigation, Writing – review & editing. Burhan A.M. Niyazi: Writing – review & editing. Burhan A.M. Niyazi: Writing – review & editing.
Acknowledgement
The authors extend their appreciation to the Deputyship for Research & Innovation, Ministry of Education in Saudi Arabia for funding this research work through the project number IFPRC-122-123-2020 and King Abdulaziz University, DSR, Jeddah, Saudi Arabia. Sincere thanks to the anonymous reviewers and editor for the valuable suggestions in revising the manuscript.
Funding
The authors extend their appreciation to the Deputyship for Research & Innovation, Ministry of Education in Saudi Arabia for funding this research work through the project number IFPRC-122-123-2020 and King Abdulaziz University, DSR, Jeddah, Saudi Arabia.
Declaration of Competing Interest
The authors declare that they have no known competing financial interests or personal relationships that could have appeared to influence the work reported in this paper.
References
- Groundwater quality evaluation using water quality index (WQI) for drinking purposes and human health risk (HHR) assessment in an agricultural region of Nanganur, south India. Ecotoxicol. Environ. Saf.. 2019;176:153-161.
- [Google Scholar]
- Assessment of groundwater quality in Southern Saudi Arabia: case study of Najran area. Arab. J. Geosci.. 2020;13:101.
- [Google Scholar]
- Influence of seawater intrusion and heavy metals contamination on groundwater quality, Red Sea coast, Saudi Arabia. Mar. Pollut. Bull 2021:165.
- [Google Scholar]
- Hydrochemical study of groundwater in recharge area, Wadi Fatimah basin, Saudi Arabia. Geo J.. 1995;37:81-89.
- [Google Scholar]
- Application of a groundwater contamination index in Finland and Slovakia. Environmental Geology. 1998;36:55-64.
- [Google Scholar]
- Ecologic and economic perspectives for sustainable irrigated agriculture under arid climate conditions: An analysis based on environmental indicators for southern Tunisia. J. Afr. Earth Sc.. 2021;177
- [Google Scholar]
- Fluoride contamination in groundwater in parts of Nalgonda District, Andhra Pradesh, India. Environ. Monit. Assess.. 2011;172:481-492.
- [Google Scholar]
- A proposed new diagram for geochemical classification of natural waters and interpretation of chemical data. Hydrgeol. J.. 1999;7:431-439.
- [Google Scholar]
- Groundwater nitrate contamination and risk assessment in an agricultural area, South Korea. Environ. Earth Sci.. 2012;66:1127-1136.
- [Google Scholar]
- A critical review on geochemical and geological aspects of fluoride belts, fluorosis and natural materials and other sources for alternatives to fluoride exposure. J. Hydrol.. 2019;574:333-359.
- [Google Scholar]
- A holistic study on fluoride-contaminated groundwater models and its widespread effects in healthcare and irrigation. Environ. Sci. Pollut. Res.. 2021;28:60329-60345.
- [Google Scholar]
- Temporal and spatial assessment of groundwater contamination with nitrate using nitrate pollution index (NPI), groundwater pollution index (GPI), and GIS (case study: Essaouira basin, Morocco) Environ. Sci. Pollut. Res.. 2022;29:17132-17149.
- [Google Scholar]
- Evaluation of high fluoride contaminated fractured rock aquifer in South Africa – Geochemical and chemometric approaches. Chemosphere. 2019;235:1-11.
- [Google Scholar]
- Geochemical evolution and the processes controlling groundwater chemistry using ionic ratios, geochemical modelling and chemometric analysis in uMhlathuze catchment, KwaZulu-Natal, South Africa. Chemosphere. 2023;312:137179
- [Google Scholar]
- Drinking-water nitrate and cancer risk: A systematic review and meta-analysis. Arch. Environ. Occup. Health. 2022;77:51-67.
- [Google Scholar]
- Environemntal effects of irrigation in arid and semi-arid regions. Chilean J. Agric. Res.. 2009;69:27-40.
- [Google Scholar]
- Fluoride enrichment mechanism and geospatial distribution in the volcanic aquifers of the Middle Awash basin, Northern Main Ethiopian Rift. J. Afr. Earth Sc.. 2011;60:315-327.
- [Google Scholar]
- Ghiglieri, G., Buttau, C., Arras, C., Funedda, A., Soler, A., Barbieri, M., Carrey, R., Domenech, C., Torrento, C., Otero, N., Carletti, A., 2021. Using a multi-disciplinary approach to characterize groundwater systems in arid and semi-arid environments: The case of Biskra and Batna regions (NE Algeria). Sci. Total Environ. 757.
- Sources and toxicity of fluoride in the environment. Res. Chem. Intermed.. 2013;39:2881-2915.
- [Google Scholar]
- Use of isotopes techniques to reveal the origin of water salinity in an arid region of Central-Western Argentina. Sci. Total Environ.. 2021;763
- [Google Scholar]
- Evaluation of graphical and multivariate statistical methods for classification of water chemistry data. Hydrogeology Journal. 2002;10:455-474.
- [Google Scholar]
- groundwater quality in and around a landfill in Northwest China: characteristic pollutant identification, health risk assessment, and controlling factor analysis. Exposure Health 2022
- [Google Scholar]
- An overview of nitrate sources and operating processes in arid and semiarid aquifer systems. Sci. Total Environ.. 2018;624:1513-1522.
- [Google Scholar]
- Origin and geochemical evolution of groundwater in the Abaya Chamo basin of the Main Ethiopian Rift: application of multi-tracer approaches. Hydrgeol. J.. 2021;29:1219-1238.
- [Google Scholar]
- Wadi fatima thin-skinned foreland FAT belt: a post amalgamation marine basin in the Arabian shield. Open Journal of Geology. 2012;2:271-293.
- [Google Scholar]
- Chronic fluoride exposure induces neuronal apoptosis and impairs neurogenesis and synaptic plasticity: Role of GSK-3β/β-catenin pathway. Chemosphere. 2019;214:430-435.
- [Google Scholar]
- Integrated approach for the evaluation of groundwater quality through hydro geochemistry and human health risk from Shivganga river basin, Pune, Maharashtra, India. Environ. Sci. Pollut. Res.. 2022;29:4311-4333.
- [Google Scholar]
- Coastal aquifer salinization in semi-arid regions: the case of Grombalia (Tunisia) Water. 2021;13
- [Google Scholar]
- Hydrogeochemical processes and influence of seawater intrusion in coastal aquifers south of Chennai, Tamil Nadu, India. Environ. Sci. Pollut. Res.. 2018;25:8989-9011.
- [Google Scholar]
- Geochemical processes controlling groundwater quality under semi arid environment: A case study in central Morocco. Sci. Total Environ.. 2017;609:1140-1151.
- [Google Scholar]
- Dietary fluoride intake and associated skeletal and dental fluorosis in school age children in rural Ethiopian rift valley. Int. J. Environ. Res. Public Health. 2016;13:756.
- [Google Scholar]
- Groundwater quality assessment using geospatial technique based water quality index (WQI) approach in a coal mining region of India. Arab. J. Geosci.. 2021;14
- [Google Scholar]
- Health risk in children to fluoride exposure in a typical endemic fluorosis area on Loess Plateau, north China, in the last decade. Chemosphere. 2020;243:8.
- [Google Scholar]
- Occurrence and distribution of groundwater fluoride and manganese in the Weining Plain (China) and their probabilistic health risk quantification. Exposure Health 2021
- [Google Scholar]
- Monsoon impact on groundwater chemistry and geochemical processes in the shallow hard rock aquifer. Catena. 2020;195:104766
- [Google Scholar]
- Analysis of rainfall over Saudi Arabia. JKAU: Met Env. Arid Land Agric. Sci.. 2011;22:59-78.
- [Google Scholar]
- Rainfall-runoff modeling of ungauged Wadis in arid environments (case study Wadi Rabigh—Saudi Arabia) Arab. J. Geosci.. 2015;8:2587-2606.
- [Google Scholar]
- Impact of flash flood recharge on groundwater quality and its suitability in the Wadi Baysh Basin, Western Saudi Arabia: an integrated approach. Environ. Earth Sci.. 2018;77:395.
- [Google Scholar]
- Assessment of artificial groundwater recharge potential through estimation of permeability values from infiltration and aquifer tests in unconsolidated alluvial formations in coastal areas. Environ. Monit. Assess.. 2019;191:31.
- [Google Scholar]
- Application of water quality indices and health risk models in the arid coastal aquifer, Southern Saudi Arabia. Environ. Sci. Pollut. Res. 2022
- [Google Scholar]
- Global chemical weathering of surficial rocks estimated from river dissolved loads. Am. J. Sci.. 1987;287:401.
- [Google Scholar]
- MoWE, 2014. National water strategy: to supply and protect the Kingdom’s most precious natural resource. Ministry of Water and Electricity, Kingdom of Saudi Arabia.
- Environmental fate and health exposures of the geogenic and anthropogenic contaminants in potable groundwater of Lower Ganga Basin, India. Geosci. Front.. 2022;13:101365
- [Google Scholar]
- Irrigation return flow induced mineral weathering and ion exchange reactions in the aquifer, Luvuvhu catchment, South Africa. J. Afr. Earth Sc.. 2019;149:517-528.
- [Google Scholar]
- Probability of nitrate contamination of recently recharged groundwaters in the conterminous United States. Environ. Sci. Tech.. 2002;36:2138-2145.
- [Google Scholar]
- Leaching of nitrate from agriculture to groundwater: the effect of policies and measures in the Netherlands. Environ. Pollut.. 1998;102:471-478.
- [Google Scholar]
- Fluoride and environmental health: a review. Rev. Environ. Sci. Bio/Technol.. 2009;8:59-79.
- [Google Scholar]
- Source apportionment and health risk assessment of nitrate in foothill aquifers of Western Ghats, South India. Ecotoxicol. Environ. Saf.. 2022;229:113075
- [Google Scholar]
- Are fluoride levels in drinking water associated with hypothyroidism prevalence in England? A large observational study of GP practice data and fluoride levels in drinking water. J. Epidemiol. Community Health. 2015;69:619.
- [Google Scholar]
- Health risk assessment to fluoride and nitrate in drinking water of rural residents living in the Bardaskan city, arid region, southeastern Iran. Desalin. Water Treat.. 2019;145:249-256.
- [Google Scholar]
- Geochemical controls of high fluoride groundwater in Umarkot Sub-District, Thar Desert, Pakistan. Sci. Total Environ.. 2015;530–531:271-278.
- [Google Scholar]
- Identification and evolution of hydrogeochemical processes in the groundwater environment in an area of the Palar and Cheyyar River Basins, Southern India. Environ. Geol.. 2004;46:47-61.
- [Google Scholar]
- Impact of evaporation on groundwater salinity in the arid coastal aquifer, Western Saudi Arabia. CATENA. 2021;196:104864
- [Google Scholar]
- Trace metals pollution, distribution and associated health risks in the arid coastal aquifer, Hada Al-Sham and its vicinities, Saudi Arabia. Chemosphere. 2022;297:134246
- [Google Scholar]
- Assessment of geochemical processes in the unconfined and confined aquifers in the Eastern Ganges Basin: a geochemical approach. Environ. Earth Sci.. 2016;75:1212.
- [Google Scholar]
- Hydrochemical evaluation and identification of geochemical processes in the shallow and deep wells in the Ramganga Sub-Basin, India. Environ. Sci. Pollut. Res.. 2017;24:21459-21475.
- [Google Scholar]
- Assessment of groundwater quality and associated health risk in the arid environment, Western Saudi Arabia. Environ. Sci. Pollut. Res.. 2021;28:9628-9646.
- [Google Scholar]
- Rajmohan, N., 2020. Groundwater Contamination Issues in the Shallow Aquifer, Ramganga Sub-basin, India. In: Kumar M, S.D., Honda R (Ed.). Emerging Issues in the Water Environment during Anthropocene: A South East Asian Perspective. Springer Nature, pp. 337–354.
- Investigation of transient sea level rise impacts on water quality of unconfined shallow coastal aquifers. Int. J. Environ. Sci. Technol.. 2020;17:2607-2622.
- [Google Scholar]
- Effects of sewage waste disposal on the groundwater quality and agricultural potential of a floodplain near Jeddah, Saudi Arabia. Arabian J. Geosci.. 2016;9:307.
- [Google Scholar]
- Hydrogeochemical Processes Affecting Groundwater Chemistry in the Central Part of the Guanzhong Basin, China. Archives of Environmental Contamination and Toxicology. 2021;80:74-91.
- [Google Scholar]
- Identifying fluoride endemic areas and exposure pathways for assessment of non-carcinogenic human health risk associated with groundwater fluoride for Gujarat state, India. Environ. Sci. Pollut. Res.. 2021;28:50188-50203.
- [Google Scholar]
- Exposure to nitrate from drinking water and the risk of childhood cancer in Denmark. Environ. Int.. 2021;155:106613
- [Google Scholar]
- Estimation of nitrate pollution sources and transformations in groundwater of an intensive livestock-agricultural area (Comarca Lagunera), combining major ions, stable isotopes and MixSIAR model. Environ. Pollut.. 2021;269:115445
- [Google Scholar]
- Fluoride in the environment: sources, distribution and defluoridation. Environ. Chem. Lett.. 2015;13:131-147.
- [Google Scholar]
- Influence of coastal groundwater salinization on the distribution and risks of heavy metals. Sci. Total Environ.. 2019;652:267-277.
- [Google Scholar]
- WHO, 2017. Guidelines for Drinking Water Quality: Fourth Edition Incorporating the First Addendum. World Health Organization, Geneva.
- Evaluation of shallow groundwater contamination and associated human health risk in an alluvial plain impacted by agricultural and industrial activities, Mid-west China. Exposure Health. 2016;8:311-329.
- [Google Scholar]
- Characteristics of coastal aquifer contamination by seawater intrusion and anthropogenic activities in the coastal areas of the Bohai Sea, eastern China. J. Asian Earth Sci.. 2021;217
- [Google Scholar]
- Water storage in dry riverbeds of arid and semi-arid regions: overview, challenges, and prospects of sand dam technology. Sustainability. 2021;13
- [Google Scholar]
- High levels of fluoride contamination in groundwater of the semi-arid alluvial aquifers, Pakistan: evaluating the recharge sources and geochemical identification via stable isotopes and other major elemental data. Environ. Sci. Pollut. Res.. 2019;26:35728-35741.
- [Google Scholar]


