

Translate this page into:
Green biopolymer and plasticizer for solid electrolyte preparation: FTIR, electrochemical properties and EDLC characteristics
⁎Corresponding authors. shujahadeenaziz@gmail.com (Shujahadeen B. Aziz), mfzkadir@um.edu.my (Mohd Fakhrul Zamani Kadir)
-
Received: ,
Accepted: ,
This article was originally published by Elsevier and was migrated to Scientific Scholar after the change of Publisher.
Peer review under responsibility of King Saud University.
Abstract
In this study a green electrolyte was developed by incorporating methylcellulose (MC) polymer with potassium thiocyanate as ion provider and plasticized with glycerol to enhance salt dissociation. The purpose of glycerol addition was to improve DC conductivity and to enhance the performance of an electric double-layer capacitor (EDLC) device. The electrochemical and structural characteristics of the green electrolyte were examined. The broadening of the FTIR bands and a decrease in intensity indicated the interaction between the electrolyte components. The suitability of the electrolyte films for device applications was confirmed by measuring ionic conductivity using electrochemical impedance spectroscopy (EIS) skills. A significant amount of charge was concentrated at the electrode–electrolyte interface because of the high dielectric constant of the electrolyte. The loss tangent (tan δ) and modulus (M“) spectra obtained from electrical impedance spectroscopy showed distinct peaks associated with ion relaxation processes. The results of the transference number measurement (TNM) experiment indicated that ions were more influential than electrons. The stability of the film under different voltage conditions was evaluated using the linear sweep voltammetry (LSV) method. The performance of the EDLC was determined through cyclic voltammetry (CV) and charge–discharge evaluations. The CV pattern of the device at low scan rates showed a non-Faradaic mode of charge storage with a nearly rectangular shape. The newly constructed EDLC exhibited an initial capacitance per unit mass of 79F/g, a utilization efficiency of 87%, a power density of 1950 W/kg, and an energy storage density of 12.1 Wh/kg.
Keywords
Plasticized polymer electrolyte
MC
Potassium salt
Electrical properties
EDLC device

1 Introduction
Solid electrolytes are ionic conducting substances that are non-aqueous based and have very low electrical conductivity. These electrolytes are also sometimes referred to as superionic conductors, rapid ion conductors, or optimized ionic conductors (Takahashi, 1989). Wright and his coworkers' study of the ion conduction in polymers has attracted a lot of interest in the world of scientific research. Polymer ion conductors have been more use in recent years due to their usefulness in a wide range of electrochemical devices including fuel cells, batteries, supercapacitors, and ion-selective membranes. (Nik Aziz et al., 2010). These materials offer several benefits over traditional electronic conductors, including high ion conductivity, flexibility, and the ability to work in challenging environments. Continuous investigation in the production, synthesis, and investigation of ionic polymers is resulting in the advancement of superior materials with improved performance.
Solid polymer electrolytes (SPEs) are being considered as a replacement for liquid electrolytes. SPEs excel in safety performance because they contain no hazardous solvents. SPEs are simple to work with and manipulate and exhibit good elastic relaxation properties under stress. (Ibrahim et al., 2012). The handling of solid waste is a major worldwide issue, especially considering the United Nations' goal to limit the rise in global temperature to 2 °C by 2050. The utilization of batteries is a major contributor to the buildup of solid waste, which can have harmful environmental impacts. The widespread use of potentially unsafe and non-biodegradable chemicals as electrolytes in commercial batteries is the primary factor (Mazuki et al., 2020). Researchers have paid attention to SPE development in recent years because of the variety of technological uses for SPEs, particularly in electrochemical devices. The creation of all solid-state electrochemical cells is possible due to the SPEs' better mechanical integrity and the polymer matrix's high flexibility (Brza et al., n.d.; Gray et al., 1989). To select a polymer host, it is important to take into account the following: (1) the presence of a series of polar groups that can donate an electron to coordinate with cations (2) the activation energy barrier for bonding to be low, promoting enhanced segmental mobility, and (3) an appropriate inter-coordination site distance, promoting the formation of multiple intra-polymer ionic bonds (Rao et al., 2012).
In the field of polymer electrolytes, selecting suitable materials is a crucial challenge for researchers. They are exploring natural polymers as potential candidates due to their accessibility, cost-effectiveness, and biodegradability. As a result, many types of solid polymeric electrolytes (SPEs) have been developed from sources like starch, cellulose, chitosan, and rubber (Nik Aziz et al., 2010). Natural polymers like cellulose are insoluble in water when they are in their purest form. Cellulose should be modified for solubilization in aqueous media. (Chai and Isa, 2013; Aziz et al., 2020). In this case, methyl cellulose (MC) is created by a methylation reaction that incorporates methyl chloride into the cellulose. This methylation of cellulose has the potential to produce film and is economical and eco-friendly. Additionally, methylated cellulose shows great mechanical and electrical properties and transparency (Shuhaimi et al., 2010; Aziz et al., 2021). One of the biopolymers with a superior capacity for film formation is MC. By removing intermolecular interactions, hydroxyl groups of cellulose are transformed into methyl ether groups and makes MC more soluble in water (Shamsuri et al., 2020).
Our previous studies showed that adding 40% KSCN to an MC solution raises the ionic conductivity to 1.54 × 10⁻⁷ S/cm. (Aziz et al., 2022). The insufficient presence of free ion carriers results in low electrical conductivity despite the high concentration of functional groups in the host polymer. Therefore, it is important to choose the appropriate plasticizer for the MC:KSCN host medium. To boost the DC conductivity of solid polymer electrolytes, various approaches, including the salt's lattice energy, size of cations, density of ions, and ionic mobility, should be considered (Hama et al., 2023). Potassium thiocyanate (KSCN) has lower lattice energy of 616 kJ/mol and is considered safer compared to lithium salts. (Yoder and Flora, 2005; Pan et al., 2020). Plasticizers have been widely used to modify polymers since the early 1800s. These organic compounds, which have a low molecular weight and are relatively inert, assist in minimizing the likelihood of contact between polymers, softening the polymers' three-dimensional structure and enhancing their ability to blend without rupturing. As a result, they help improve the workability and durability of polymers (Tyagi and Bhattacharya, 2019; Mekonnen et al., 2013). Glycerol and sorbitol are plasticizers capable of reducing internal hydrogen bonds and thus extending intermolecular distances. Bioplastics' matrix becomes less thick and permits the mobility of polymer chains (Lusiana et al., 1351; Laohakunjit and Noomhorm, 2004). In order to enhance their mechanical and structural characteristics for many of these applications, plasticizer molecules are frequently combined with film-forming compounds like polysaccharides. The impact of plasticizers on the mechanical characteristics of edible films has been extensively studied (Karbowiak et al., 2006). Previous research suggested that adding glycerol improved the tensile strength and elongation of films made of polysaccharides like chitosan and MC (Karbowiak et al., 2006; Lau et al., 2339). Moreover, Chen et. al., (Chen et al., 2021) were used glycerol as an antifreezing agent for their hydrogel electrolyte system.
It is well recognized that polymer electrolytes are the sympathy of electrochemical devices. Supercapacitors (SCs) have gained popularity as effective energy storage devices due to their ability to quickly charge and discharge, long lifespan, and reliable temperature behavior. Despite these advantages, supercapacitors still lag behind batteries in terms of energy density. In electrochemical supercapacitors, the performance of the device is heavily influenced by the properties of the electrolyte, which affects its capacity, power density, energy density, speed, stability, and safety. Therefore, careful consideration must be given to the choice of electrolyte in order to optimize the performance of the supercapacitor (Feng et al., 2021). SCs which include both conventional stacked SCs and new planar SCs, offer an alternative to commercial aluminum electrolytic capacitors (AECs). This is due to their small size, high capacitance, and ability to develop a kilohertz (kHz) frequency response. As a result, SCs can be used in place of AECs (Bhat et al., 2022). It has been demonstrated that an EDLC assembly that makes use of polymer electrolytes is an important progress. Earlier studies established that EDLC, a device with an energy density (E) extends to the battery region, will make a revolution in energy resources, especially using non-toxic materials, and may replace battery technology. The barrier in front of EDLC being commercialized is its energy density, which is lower than that of batteries. Thus, many researchers or companies focused to developing new forms of energy storage are focusing on the manufacture of EDLC devices with significantly high energy density. The results of the current study (E = 12.1 Wh/kg) may open a debate on the future of EDLC devices. In the current work, an EDLC device was presented that exhibits good performance over 800 cycles with high energy density. In this study, the conductivity of the MC:KSCN system was enhanced via glycerol addition. The plasticized film with a DC conductivity 8.53 × 10⁻⁴ S/cm was employed to construct the EDLC device successfully.
2 Methodology
2.1 Preparation of the plasticized SPEs
To prepare the MC solution, one gram of MC was dissolved in 80 ml of distilled water Afterwards, 40% of potassium thiocyanate (KSCN) salt was added into the solution and stirred using a magnetic stirrer for complete mixing. The solution was then plasticized by adding different amounts of glycerol (10%, 20%, 30% and 40%) resulting in the formation of four different materials: MCKSG1, MCKSG2, MCKSG3, and MCKSG4. Once the solution was thoroughly mixed, it was left to dry in a Petri dish and later dried further with blue silica gels. This process was completed so that the solution could be used for (EDLC) device preparation.
2.2 Electrochemical impedance spectroscopy
The impedance of glycerolized MC-based electrolyte films was studied using EIS. The [3532–50 LCR Hi TESTER-HIOKI] instrument was used to conduct EIS measurement over a frequency range from 50 Hz to 5 MHz. After the films were precisely cut into circular pieces with a diameter of 1 cm using a specialized cutting tool like scissor. The thickness of the polymer electrolyte used in this study falls within the range of 251–253 µm. These circular pieces were then compressed between a pair of stainless-steel electrodes using a spring mechanism. To monitor the complex impedance (Z*) data, the cell was connected to a computer program that enabled the measurement of the real (Z') and imaginary (Z“) components of the impedance data. The EIS measurement was carried out by applying an AC voltage to the cell and measuring the resulting current response, which allowed for the determination of the impedance properties of the films. The results of the EIS measurement provided crucial insights into the electrical conductivity and stability of the glycerol-modified MC-based electrolyte films, enabling the optimization of the films' properties for practical applications.
2.3 TNM and LSV examination
To determine the flow of electrons (te) and ions (tion) by an electrochemical experiment. The experimental setup consisted of a SS/electrolyte/SS configuration connected to a digital DC power supply (V and A device DP3003) and a multimeter (UNI-T UT803). The experiment was conducted at 30 °C with a voltage of 0.2 V applied. As the experiment proceeded, the cell became polarized, and it was determined that the highest level of conductivity was located among the two SS electrodes within the electrochemical cell.
In order to precisely quantify the ion and electron transport properties of the electrolyte, the ionic and electronic transference numbers were computed using well-established formulae. These transference numbers are crucial parameters in understanding the electrochemical behavior of the electrolyte, and the results of this experiment provide valuable information for researchers and engineers looking to optimize the performance of electrochemical devices.
An LSV with a DY2300 potentiostat was used to measure the break-down voltage with an operating weep rate of 10 mV s−1 and a voltage range of 0–2.5 V. In the LSV analysis, which exclusively used the highest conducting electrolyte. The working, counter, and reference electrodes were all made of stainless steel.
2.4 Electrode preparation for EDLC fabrication
A mixture of 3.25 g of activated carbon (AC) and 0.25 g of carbon black was subjected to grinding and homogenization in a planetary ball miller for a duration of 20 min. Activated carbon offers exceptional properties such as high conductivity, chemical stability, a large surface area (exceeding 1000 m2. g−1), cost-effectiveness, and significant porosity (pore width greater than 2 nm). On the other hand, carbon black serves as a conductor, bridging the activated carbon and SS electrodes. Subsequently, 0.5 g of polyvinylidene fluoride (PVdF) as a binder were dispersed in 15 ml of NMP for several hours. The resulting carbon powder was added to the PVdF-NMP dispersion and subjected to agitation for two hours, yielding a highly viscous black suspension. The suspension was cast onto a cleaned aluminum foil substrate using a doctor blade technique and then allowed to dry in a 60 °C oven. The resultant electrode was stored in a desiccator to maintain its quality.
2.5 EDLC characterization
The activated carbon (AC) electrodes were designed and fabricated into circular shapes, with a surface area of 2.01 cm2 for each electrode. The sample with the highest electrical conductivity was then placed between the two AC electrodes to form a CR2032 coin cell. This assembled cell was then inserted into a Teflon casing, as depicted in Fig. 1. The use of a Teflon casing serves to protect the cell from any external factors that may affect its performance and to ensure stable operating conditions. The CR2032 coin cell design allows for a compact and portable configuration, making it well-suited for various applications. The circular shape of the AC electrodes and the precise control of their surface area contribute to the uniformity and reproducibility of the cell's performance.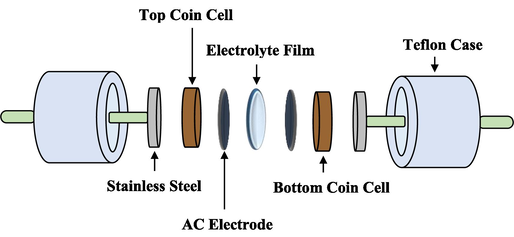
The representation of the EDLC configuration.
The electrochemical routine of the EDLC device was investigated by employing a number of characterization techniques, which can be seen elsewhere (Aziz et al., 2020; Aziz et al., 2021). The charge–discharge (NEWARE battery cycler with a current density of 1.5 mA/cm2) response of the EDLC provides insight into several key characteristics, including efficiency, equivalent series resistance (ESR), specific capacitance (C), energy density (E), and power density (P), which can be determined using the following equations.
3 Results and discussion
3.1 FTIR study
FTIR spectroscopy is a critical technique in the field of materials science. It is utilized to determine the functional group composition of organic compounds through the analysis of their IR absorption or transmission spectra. This approach is particularly effective in characterizing the complexation of functional groups in response to IR radiation (Sayed et al., 2022). Additionally, FTIR spectroscopy is the preferred method for the structural and compositional analysis of newly formed organic molecules that result from chemical reactions.
It is feasible to emphasize the interactions between the prepared SPE systems from MC, KSCN, and Gly. Fig. 2 depicts the FTIR spectra in the 4000–400 cm−1 region for MC-KSCN-based biopolymer electrolytes with different glycerol concentrations. The main predictors in the presence of created functional groups in electrolyte samples are fluctuating intensities and moving positions of the bands. It has been shown that such as (N and O) play important roles in the interaction of the lone pair electrons in the polymeric host. The development of a large peak at around 2900 cm−1 indicates the presence of C–H stretching modes, and the inclusion of a plasticizer also decreased its strength, as exhibited in Fig. 2 (Lu et al., 2007; Hadi et al., 2021; Ramesh et al., 2008; Aziz et al., 2021; Agrawal et al., 2010; Aziz and Abidin, 2013). Furthermore, a well-built peak at around 3360 cm−1 corresponds to the O–H stretching band (Hadi et al., 2021). The materials used in this work have strong interactions as a consequence of shifting peaks and changes in their intensities. According to the earlier study, the MC host polymer possesses different vibrational frequencies of OH and O = C-NHR (Aziz and Abidin, 2013). It is observed that the increase of glycerol concentrations in the MC-KSCN system leads to a decrease in the intensities of the peaks with a little shifting. Our previous FTIR study for the MC-KSCN based polymer electrolyte displayed the presence of C–H stretching modes is indicated by a significant peak at approximately 2900 cm−1. Moreover, the impact of doping on this process is also significant, as shown by the large peak centered at 3359 cm−1, which is the source of the –OH stretching (Aziz et al., 2022). Its noteworthy that the peaks appear for the MC-KSCN-Gly systems as well. A considerable interaction between the MC, KSCN, and Gly via a coordination link serves as evidence of the complexation process.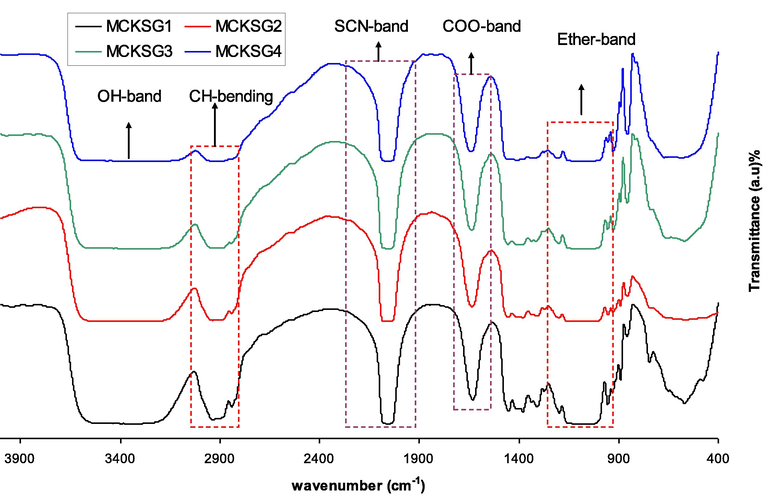
FTIR spectra of plasticized electrolytes.
3.2 Impedance spectroscopy (IS) analysis
IS has been used extensively in the investigation of ionic conductors. It has been well utilized to assess the performance of a wide range of electrical systems, including electrical double layer capacitors, fuel cells, batteries, fused salts, ion-conducting polymers, and glasses. The technique of impedance spectroscopy is also precious in the inspection of transport processes in ionic conductors and the assessment of device performance (Hadi et al., 2022). A Nyquist plot in Fig. 3 depicts the outcomes of an impedance spectroscopy study of a MC-KSCN solution that contained various amounts of plasticizer. In the plot, two distinct regions are typically observed: a high-frequency (HFr) semicircle and a low-frequency (LFr) spike (Article, 2020). The bulk impact of the electrolyte causes a high frequency semicircle, whereas blocking electrodes and the polarization effect lead to a low frequency slanted spike as a consequence of the accumulation of ions. The bulk resistance (Rb) is defined as the point of intersection between the half-circle and the spike. The semicircle formation reveals the bulk resistance value, which influences the ionic conductivity values. According to the Nyquist plot, the MCKSG1 containing 10 wt% of glycerol displayed both a semicircle and a spike, while the semicircle disappeared upon increasing the glycerol ratio to the system, demonstrating the decreased bulk resistance (Hadi et al., 2020c; Hadi et al., 2020d; Aziz et al., 2020a; Azlina et al., 2018). Thus, the increased glycerol ratio enhances the salt dissociation and improves the ionic conductivity. Its highly important to apply equation below to figure out the (
) ionic conductivity for the MCKSG electrolyte systems (Hadi et al., 2020a; Hadi et al., 2020b):
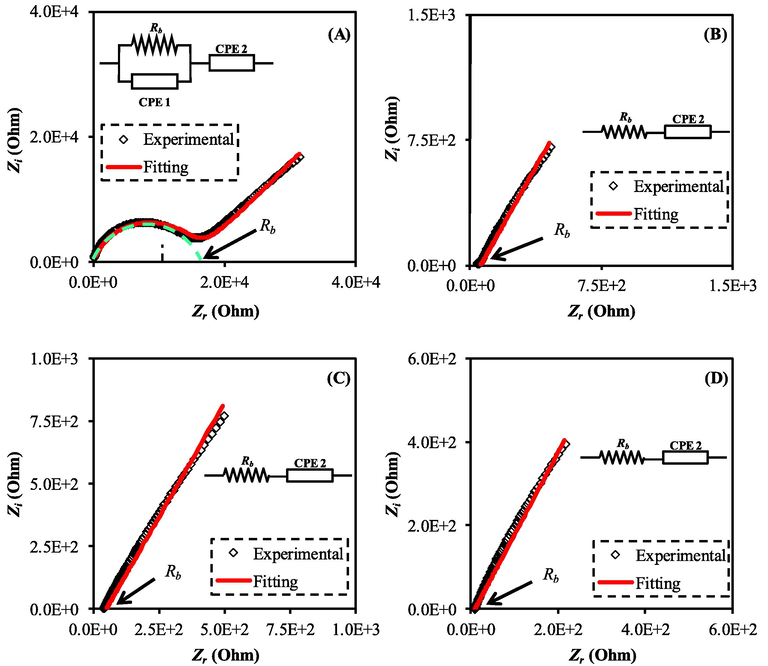
The impedance plot for the MC-KSCN containing various amount of plasticizer (a) MCKSG1, (b) MCKSG2, (c) MCKSG3, and (d) MCKSG4.
Sample
p1
p2
CPE1
CPE2
Rb
DC Conductivity
MCKSG1
1.30
0.81
1.43 × 10⁻⁹
1.52 × 10⁻⁶
16000.0
5.33 × 10⁻⁷
MCKSG2
1.08
1.05 × 10⁻⁵
60.0
1.42 × 10⁻⁴
MCKSG3
1.07
1.14 × 10⁻⁵
50.0
1.71 × 10⁻⁴
MCKSG4
1.10
1.90 × 10⁻⁵
10.0
8.54 × 10⁻⁴
Additionally, the presence of glycerol leads to the disruption of the Coulombic forces within the polymer matrix, thereby facilitating the creation of more pathways for ionic transport (Patel and Kumar, 2019; Nofal et al., 2020; Hamsan et al., 2020). Table 2 presents a comparison of the conductivity values obtained in the current study with those reported in previous literature.
Polymer system
DC (S/cm)
Reference
MC-PC-NH4Cl-ZnO
3.13 × 10⁻⁴
(Dennis et al., 2022)
MC-KSCN
1.57 × 10⁻⁷
(Aziz et al., 2022)
MC-NH4NO3
3.5 X 10⁻⁷
(Series, 2020)
MC-DN-NH4F-glycerol
2.25 × 10⁻³
(Aziz et al., 2021)
MC-KI
1.93 × 10⁻⁵
(Nofal et al., 2021)
MC-KSCN-glycerol
8.53 × 10⁻⁴
This work
The mathematical expressions used for determining the impedance of
element (
),
, and
associated with the EEC model for the sample exhibiting both a semicircle and spike shape can be written as follows (Hadi et al., 2021; Hadi et al., 2022):
While for the samples having only a slanted spike, the equations become
Here, , and denote the capacitance of element, capacitance at high and low frequencies, respectively. The amount by which a semicircle deviates from an imaginary axis is denoted by ; whereas, controls the inclination of the tilted line with respect to the real axis.
Where PC stands for pectin, NH4Cl is an ammonium chloride, ZnO is a zinc oxide, NH4NO3 is an ammonium nitrate, DN is a dextran, NH4F is an ammonium fluoride, and KI stands for the potassium iodide.
3.3 Dielectric properties
Dielectric assessment is a vast instrument to comprehend crucial knowledge concerning the manners of the polymer electrolyte (Selva Kumar and Bhat, 2009; Aziz et al., 2017; Falqi et al., 2018). It is essential to grasp both the segmental relaxation processes within the polymer and the way ions are transported. Fig. 4 displays the alteration in the ε' as frequency changes for MC-KSCN-Gly films with different amounts of glycerol. The complex permittivity function, represented by ε*(ω) = ε'(ω) + ε“(ω), is a material property that is affected by factors such as temperature, the nature of the polymer electrolyte, and the frequency at which it operates (Okutan and Şentürk, 2008; Batoo et al., 2009). The real and imaginary components of the complex permittivity (ε*) can be calculated from the Z' and Z” components of the complex impedance (Z*), through the use of specific relationships (Khiar et al., 2006; Padmasree and Kanchan, 2005).
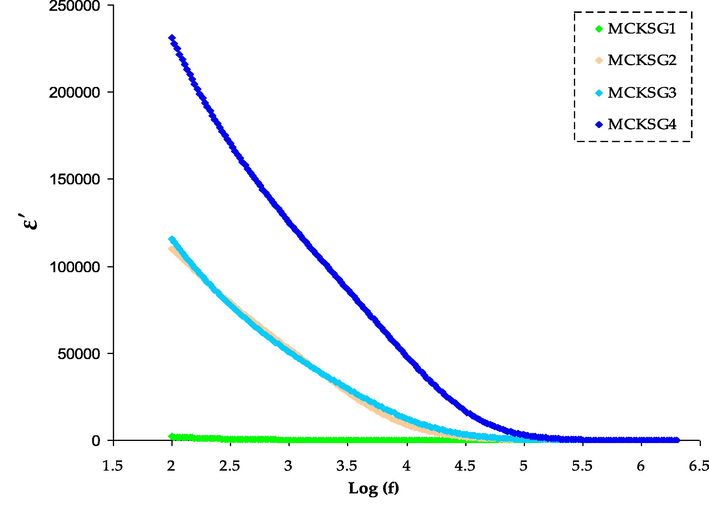
The ɛ' variations for the MCKSG electrolytes.
The ability of a material to accumulate electrical charge is determined using the dielectric constant. It is possible to infer from this correlation that an increase in the number of free mobile ions causes a corresponding increase in conductivity (Khiar et al., 2006). The quantity of charge that a substance can store will grow as its dielectric constant rises. In pure crystalline polymer electrolytes, ions are more difficult to move due to the ordered packing of the coordinative bonds between the molecules. Therefore, if the polymer electrolytes have crystallographic flaws, ionic conduction will happen more readily. Consequently, in the amorphous areas of the polymer electrolytes, charge carriers can travel rapidly. The degree of flexibility in polymer chains plays a critical role in determining the density and movement of charge carriers. The interactive bonds within the extremely flexible polymer chains make it simple to separate the solvating ions from them, thus increasing the ionic conduction.
Assessing the ionic conductivity in polymer electrolytes poses a complex challenge because of the multiple factors that can impact ion transport properties, including the dissociation of salt, ε' of the polymer matrix, concentration of salt, the mobility of polymer chains, and degree of ion aggregation (Agrawal et al., 2009; Aziz and Abidin, 2015; Aziz, 2013). Although the ionic conductivity of these materials is sufficiently high, conducting dielectric analysis of ion-conducting solid polymer electrolytes (SPEs) provides valuable insights. Studying dielectric relaxation processes is beneficial for understanding ion transport behavior and gaining further knowledge about the interaction between ions and molecules in solid polymer electrolytes (Pradhan et al., 2008).
The dielectric loss spectra for plasticized MC:KSCN:Gly electrolytes are displayed in the graphical representation of the dielectric loss spectra for the plasticized MC:KSCN:Gly electrolytes are denoted in Fig. 5. The figure reveals that the peaks in the relaxation spectra for the electrolyte are displayed with relatively low intensities. The appearance of this phenomenon is a result of the concentration of mobile ions at the interface between the electrode and electrolyte at LFr, caused by the prolonged use of a reversed electrical field. This leads to elevated values for both the dielectric components, ε′ and ε″ (Subba Reddy et al., 2006). With various plasticizer concentrations, the MC:KSCN:Gly electrolyte exhibits variations in tangent loss with frequency in Fig. 6. Tangent loss spectra with a peak that occur at a particular frequency. The plasticized electrolyte shows relaxations that are almost entirely attributable to rapid ion relaxations. The plasticized electrolytes exhibit a single relaxation process, demonstrating that the plasticizer raises the segmental mobility of the polymer chains and, as a result, increases the free volume, facilitating ion transport (Hirankumar and Mehta, 2018). The ion transport within the MC matrix is enhanced by the relatively fast segmental motion combined with the mobility of ions. It has been observed that the addition of plasticizers improves the segmental mobility of polymer chains and increases the amorphous nature of the host polymer (Sadiq et al., 2022). Similarly, plasticized electrolytes exhibit a significantly high quantity of loss tangent. This is attributed to the fact that plasticizers increase the level of amorphousness in the materials, and the presence of mobile dilute molecules facilitates segmental movement by enhancing the available free volume. Conduction losses are mostly responsible for the rise in tan δ of the current polymer electrolyte. Because of this relationship, tan δ = σ/2πfε′, the electrical conductivity and tan δ are connected. The direct influence of the sample's dc conductivity on these losses is notable. This conductivity generates currents that, being in an AC field, align with the applied voltage and consequently induce dielectric losses. The reduction in relaxation time is evidenced by the shift of peak maxima towards higher frequencies. Similar findings have also been reported in the literature (Aziz et al., 2022; Abdullah et al., 2022). The polarization and electric field are in phase at low frequencies. The loss angle (or phase shift) is quite tiny. The polarization lags beyond the electric field at higher frequencies. The phase change in this situation causes the dielectric to lose energy and release heat. When the polarization's relaxation time is close to the duration of the applied field, a resonant state occurs where the loss tangent (tan δ) reaches its highest value. Jiang et al. (Jiang et al., 2007) declare that the main factor behind the rise in tan δ at HFr applied fields is due to resistive losses, as the mobile charges in the electrolyte film can't keep up with the electric fields at these higher frequencies. Fig. 8 shows the growth of tan δ with frequency, accomplishment a peak and after that declining. The figure demonstrates that the highest tan δ shifts to higher frequencies as the Gly concentration boosts. Peak frequencies shift forward with Gly, suggesting that as Gly is elevated, the relaxation time gets shorter (Elkholy and Sharaf El-Deen, 2000). Thus, plasticizers develop a sophisticated and efficient channel for ion mobility.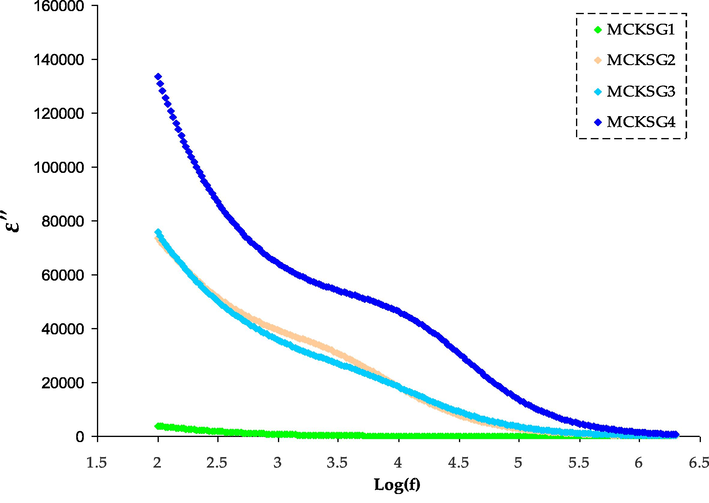
The ε″ variations for the MCKSG electrolytes.
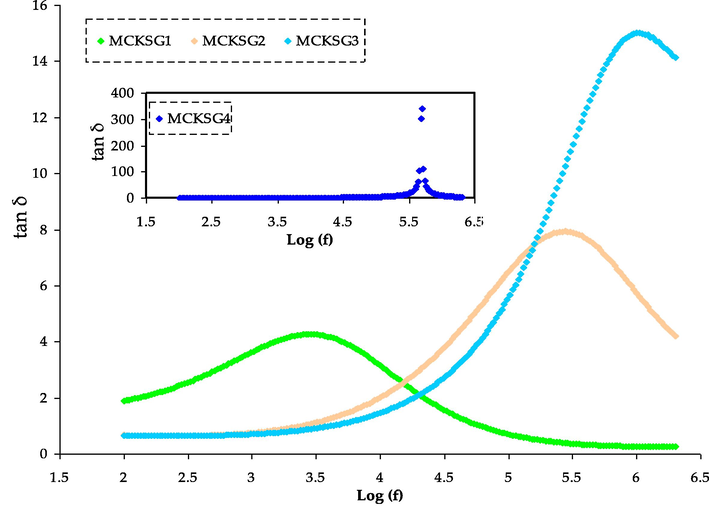
The tan δ spectra for the MCKSG electrolytes.
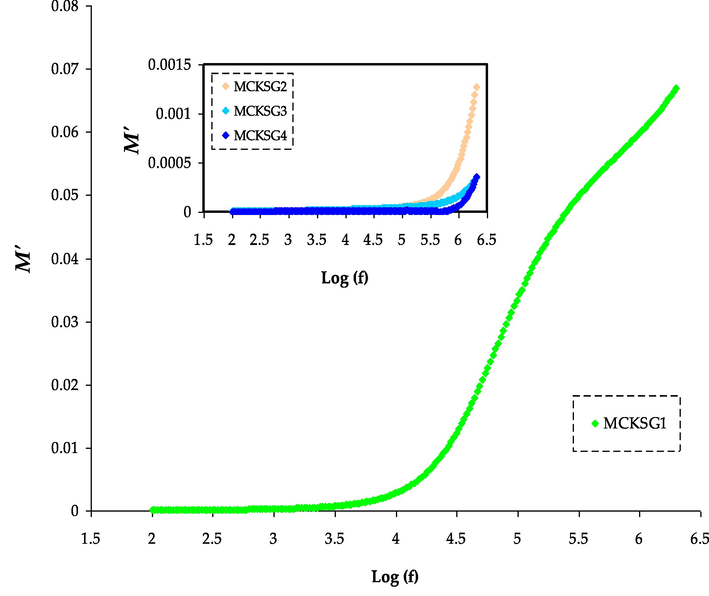
The M′ spectra for the MCKSG electrolytes.
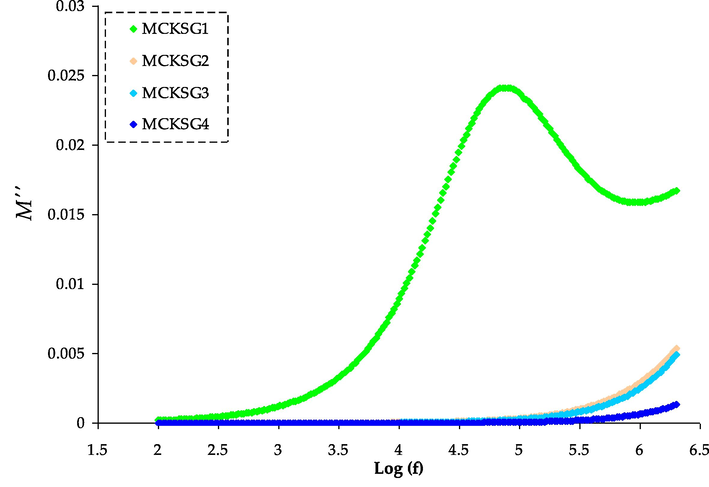
The M′′ spectra for the MCKSG electrolytes.
3.4 Modulus analysis
Studies of electrical modulus (EM) could be employing to talk about the polymer electrolyte’s dielectric manners. Using electrical modulus formalism would make it easier to conduct additional research on the dielectric behavior. Modulus illustration is beneficial for decreasing the electrode polarization signal intensity or emphasizing minor features at HFr (Aziz, 2016).
The EM spectra are a tool to study the conductivity and associated relaxation processes in polymers and ionic conductors (Aziz et al., 2010). In Fig. 7, the frequency dependence of the real component (M′) of the EM for the MC-KSCN-glycerol film is depicted at ambient temperature. It is clear that the real part of the EM starts off with a minimal value at LFr and gradually increases to a maximum value at high frequencies. The value of M′ is directly proportional to frequency and eventually reaches a greatest value of M∞ = 1/ε∞ at the highest frequencies. The movement or motion of charge carriers under the effect of an applied electric field is believed to be the cause of the behavior (Aziz, 2015). Additionally, M′, which achieves a maximum value, may be a result of the conduction phenomena brought on by the mobility of the ions carriers in a short range (Ram and Chakrabarti, 2008). As glycerol rises, M′ tends to decrease, which is the reverse of permittivity. A rise in plasticizer leads to an increase in the mobility of both the polymer and charge carriers, which causes the values of M′ to decrease (and ε′ to rise) in the LFr area (Arous et al., 2007).
The plot in Fig. 8 demonstrates the link between the imaginary component of the EM signal and frequency for a range of different glycerol concentrations. In the imaginary modulus spectra, a prominent peak indicative of relaxation can be observed. The M″ spectra disclose a peak that demonstrates a robust connection between ionic and polymer segmental motions, unlike the ε″ spectra which do not exhibit such a peak (Sengwa et al., 2008). This peak signifies the transition from ionic mobility over long distances to short-distance mobility, in which the carriers are constrained to budding wells and exhibit faster movement over shorter distances (Castillo et al., 2009). Additionally, it is imperative to note that the peak in the M′′ spectra will exhibit a Debye-like characteristic if the conductivity represented in the spectra originates from the movement of free ions within the polymer and does not result from dipolar relaxations and viscoelastic (Selva Kumar and Bhat, 2009). However, this characteristic cannot be shown in the sample used in our current work, which shows non-Debye type behavior. The expansive and irregular shape of the M′′ may be portrayed by the prolonged exponential decay of the electric field as stated in the following equation (Subba Reddy et al., 2006).
The full-width at half-maximum (FWHM), denoted by “w,” can be used to describe the Debye relaxation, which has a value of 1.14. The stretching factor β is defined as the ratio of 1.14 and w (β = 1.14/w).
3.5 Electrochemical studies
3.5.1 TNM analysis
The predominant type of ions present in the PEs is determined through the TNM method. The TNM measuring circuit configuration is displaced in Fig. 9. The TNM plot for the maximum conducive electrolyte is shown in Fig. 10. A steady current flow is established as a result of electrons once all ions have been completely reduced (Chai and Isa, 2016). The TNM of both the ions (tion) and electrons (te) in the MCKSG4 electrolyte is determined through the utilization of equations Eqs. (1) and (2).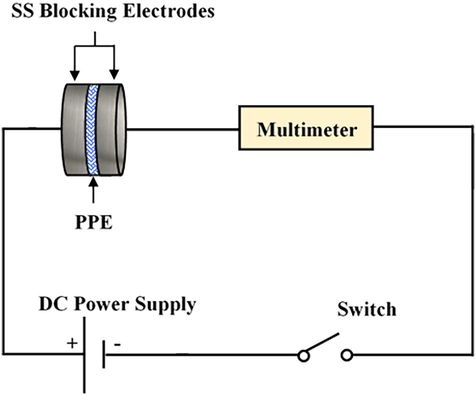
The circuit diagram for the transference number measurements.
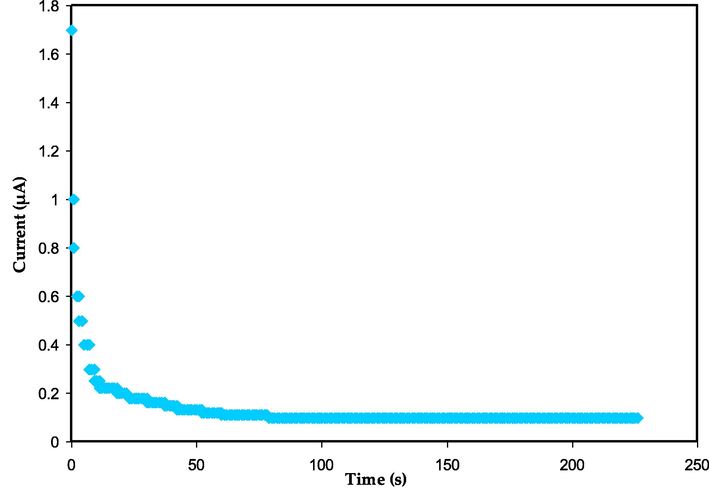
The TNM plot for the MCKSG4 electrolyte.
The MCKSG4 electrolyte attained a high tion value of 0.942, indicating that ions predominated in the system (Basha and Rao, 2018). Shukur and coworkers (Shukur et al., 2016) claim that ions have a noteworthy role in a system's carrying charge if the rate of tion is close to unity. The important magnitude of the early current is owing to the combined contributions of both charge carriers, electrons and ions, at the initial stage. Additionally, it should be observed that the current significantly declines before reaching a steady state. It's important to note that the stainless steel electrodes' induction of ionic blocking allows the electrons to pass (Rani et al., 2018). The results of the present study match the system of potato starch MC mix SPEs that include NH4NO3 and Gly as plasticizers (Hamsan et al., 2017). According to the current work, the tion is comparable to earlier reports (Polu and Kumar, 2013a; Polu and Kumar, 2013b; Wang et al., 2018). The tion value obtained in the current study at room temperature is higher than that obtained by Ghosh et al. (Ghosh et al., 2010). A different investigation by Guo et al. revealed that the tion value in the system of PEO-LLZTO-LiBOB based polymer electrolytes was 0.57 (Guo et al., 2019).
3.5.2 LSV
The stability of voltage in an electrolyte is an important aspect to be considered in evaluating its suitability for energy purposes. The breakdown voltage (VB) is an important measure of the voltage stability of an electrolyte and can be estimated using LSV (Arof et al., 2012). Fig. 11 shows the plot of the room temperature LSV of the most conductive electrolyte (MCKSG4) at a scan rate of 10 mV/s. It is evident that the current density remains unchanged until 2.55 V, demonstrating that the electrolyte system is electrochemically stable until a voltage of 2.6 V (Sampathkumar et al., 2019). Thus, the MCKSG4 electrolyte has a breakdown voltage of 2.6 V. Additionally, Liew et al. demonstrated that the use of low molecular weight plasticizers can improve the VB value of plasticized electrolyte systems, making them more efficient for use in energy devices (Liew et al., 2014). The decomposition voltage value obtained in this work is sufficient for practice in electrochemical instruments that typically operate at a working potential of 1.0 V (Shuhaimi et al., 2009). This shows that the MCKSG4 electrolyte holds potential for application in energy storage and conversion systems.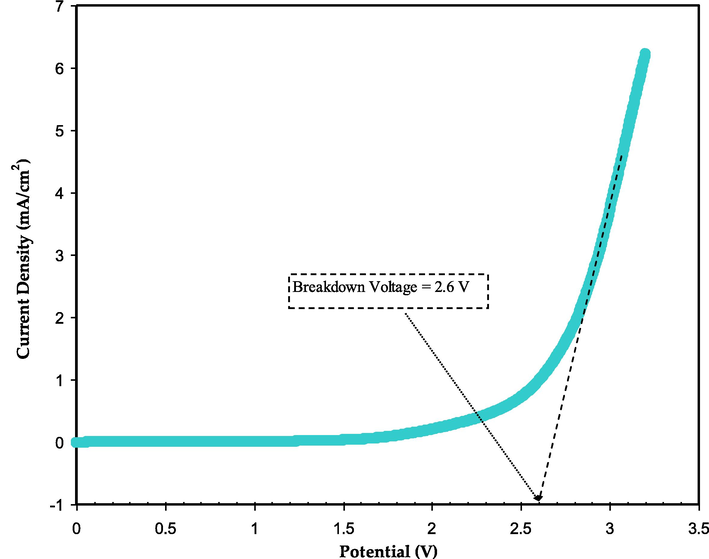
The LSV plot for the greatest conducting electrolyte.
3.5.3 CV analysis
The capacity of electrochemical devices can be measured through three techniques, including CV, EIS, and galvanostatic charge–discharge (Lewandowski and Świderska, 2003). These methods will be thoroughly examined and their results compared to appraise assess the capacitance of the EDLC cells that have been constructed. Contrarily, it has been established that the transfer of charge occurs in manufactured supercapacitors (SCs) when a redox peak is present, but is absent in the lack of a redox peak (Hashmi et al., 1997). The properties of the activated carbon, such as its internal resistance and porosity, play a role in this process (Wang et al., 2018). Fig. 12 displays the cyclic voltammetry for the fabricated EDLC.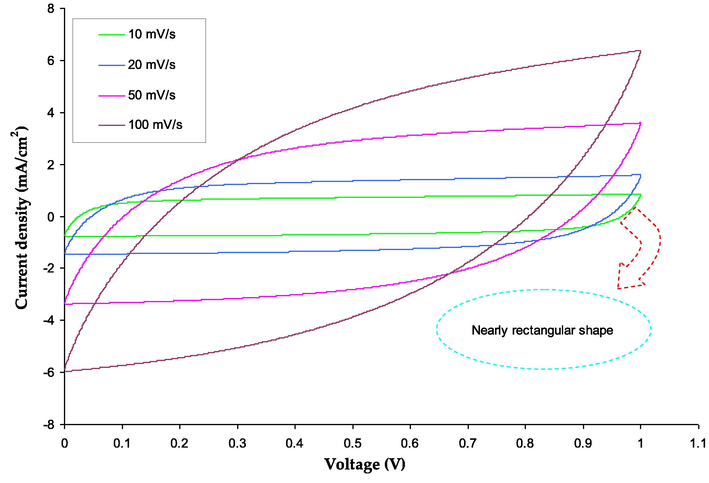
Cyclic voltammetry for the fabricated EDLC.
The Cspe of the EDLC device can be calculated using an equation derived from the cyclic voltammetry (CV) response, and the values are tabulated in Table 3, as described in various studies (Hadi et al., 2021; Hadi et al., 2022; Aziz et al., 2019a).
Scan rate
Capacitance F/g
0.1
24.18
0.05
36.45
0.02
47.70
0.01
53.30
The study uses the integration function from software (Origin 9.0) to calculate the area under the CV response, ∫I(V)dV. Vi and Vf demonstrate that the CV scan voltage range is between 0 and 0.9 V. The variables m and v denote the mass and sweep rate, respectively, of the active material employed. The fabricated EDLC has a Cspe of 53.3F/g, according to the study, which is comparable to the Cspe following 800 charge–discharge cycles. The CV response in the study strictly resembles earlier research on biopolymer-based EDLCs (Castillo et al., 2009; Chai and Isa, 2016; Varzi et al., 2014; Kasprzak et al., 2018). Additionally, it is noted that no redox peak pattern is present, indicating that the intercalation/deintercalation process is the only mechanism by which both the cations and anions of the KSCN salt are absorbed on the electrode’s surfaces (Hadi et al., 2021; Hadi et al., 2022; Aziz et al., 2019a). This indicates that the non-Faradaic mechanism occurs at the interfacial region, where ions build up (Sengwa et al., 2008). Fig. 13 schematically illustrates the production of an electric double layer in the newly created EDLC device.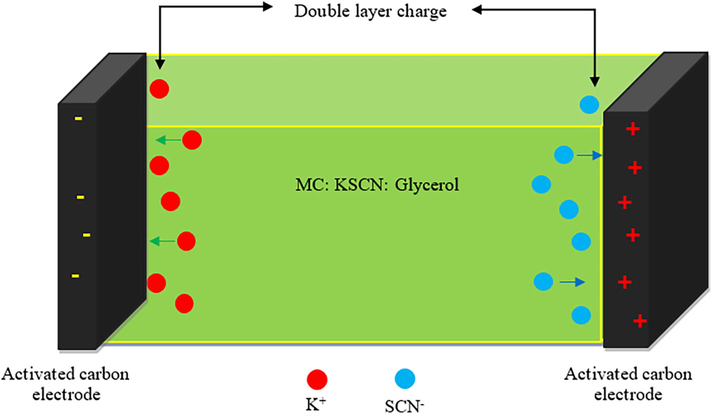
Double layer charge representation in EDLC.
This result is an improvement above previous work that has been published. In order to create EDLC, Pandey and his team employed multi-walled carbon nanotube electrodes and ionic liquid-based poly(ethylene oxide) polymer electrolytes in their research. The outcome (53.3F/g) is higher than our previous work (Pandey et al., 2011). The EDLC was created by (Aziz, 2016) employing composite carbon electrodes and a plasticized PVdF-co-HFP based polymer electrolyte. The specific capacitance determined by Gu et al. is barely less than the 13F g−1 found by our current work. The imperfect contact between the electrolyte and electrodes in type I cells leads to deviations from the ideal rectangular shape. As a result, the ion absorption at the electrode surface becomes extremely challenging due to limited interfacial contact. Additionally, the low conductivity of the polymer electrolyte negatively impacts the shape depicted in Fig. 12 (Choudhury et al., 2009).
A non-rectangular, leaf-like form is another significant aspect of the CV response. However, when internal resistance and electrode roughness are taken into account, it becomes persuasive (Aziz et al., 2021; Aziz et al., 2019b). The preferred approach for charge storage in EDLCs is through the accumulation of ions in the interface region by adsorbing them at the electrode surface (Kiamahalleh et al., 2012; Pazhamalai and Capiglia, n.d.; Lim et al., 2014). Table 4 compare the outcome of this study to some previously published works from the literature. It is worth noting that EDLCs exhibit superior characteristics compared to Faradaic capacitors or pseudo-capacitors, including high durability, power and energy densities, cost-effectiveness, safety, and ease of manufacturing (Frackowiak, 2007; Zhang et al., 2011; Pell and Conway, 2004).
System
C from CV (F/g)
Reference
PVA-LiClO4
10.9 (at 10 mV/s)
(Lim et al., 2014)
PMMA-Mg(CF3SO3)2)
27.0 (5 mV/s)
(Asmara et al., 2011)
Corn starch-LiOAc
33 (0.5 mV/s)
(Shukur et al., 2014)
MC:KSCN:Gly
53.3 (at 10 mV/s)
Present work
3.5.4 Charge–discharge study
In order to test the EDLC's rechargeability, 0.2 mA/cm2 was applied while recording 100 cycles, as exhibited in Fig. 14. When the current is first applied, the charged ions begin to move from the bulk of the electrolyte to the interface area, generating double layer charging, or capacitive characteristics (Pohlmann et al., 2015; Asnawi et al., 2020). Leakage in the double layer, which causes dissipation and loss of the stored energy, may be the cause of the drop in capacitance and energy at higher discharge rates. (Morita et al., 2004; Mitra et al., 2001; Shuhaimi et al., 2009).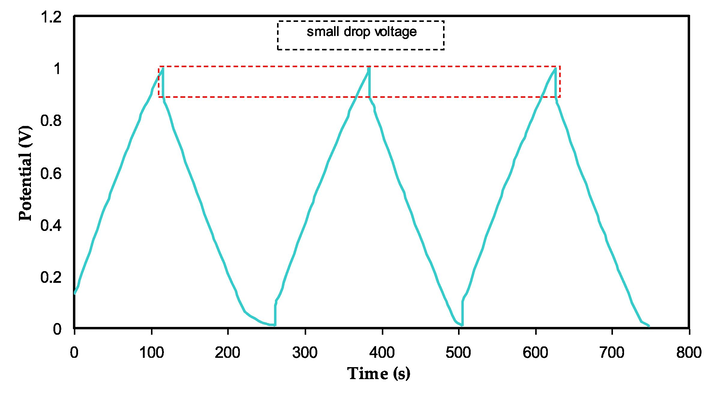
GCD plot for the assembled EDLC.
The linear discharge curve response in Fig. 14 confirms that the generated EDLC exhibits capacitive behavior. Eq. (3) may be used to get the specific capacitance (Cs) of the developed EDLC from the charge–discharge response. According to Fig. 15, the Cs maximum was 152.4 F/g on the first cycle and dropped to 79.138 F/g on the 300th cycle. Due to the inhomogeneity of the electrolyte–electrode area, the value of Cs has decreased (Acharya et al., 2017; Hamsan et al., 2020; Azli et al., 2020). A fascinating finding is that after 100 cycles, the value of Cs stabilizes into a state known as ion polarization stability. Table 5 lists the Cs values for several manufactured EDLC devices that use different polymer electrolytes.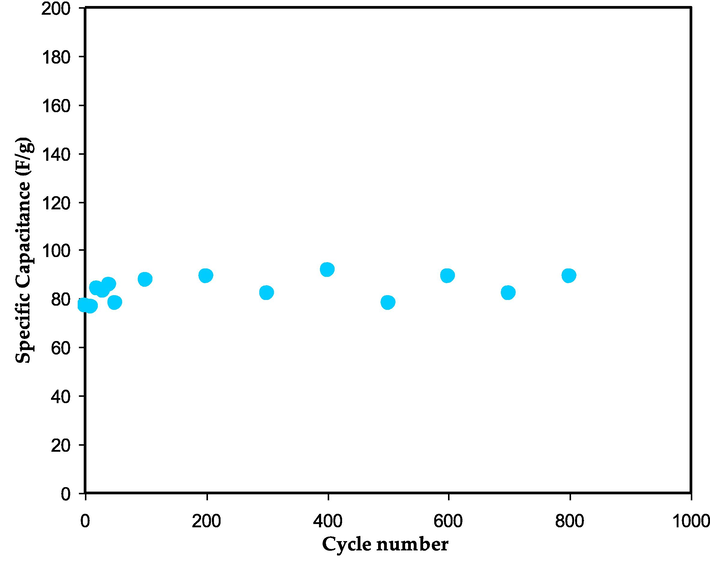
The Cs against cycle number for the assembled EDLC.
Polymer electrolytes
Cs (F. g−1)
Cycle no.
Reference
Chitosan-H3PO4-Al2SiO5
0.22
100
(Wall et al., n.d.)
Chitosan-H3PO4-NH4NO3-Al2SiO5
0.25
100
(Wall et al., n.d.)
PVA-NH4C2H3O2
0.14
-
(Liew et al., 2015)
MC-NH4NO3
1.67
100
(Shuhaimi et al., 2012)
PEO-LiTf-EMITf
1.70
-
(Aziz et al., 2019a)
MC-KSCN-Gly
88
800
This work
It should be noticed that the voltage decreases prior to the beginning of the discharging process, as displayed in Fig. 14. This reveals the constructed EDLC's internal resistance. According to Fig. 16, the value of the ESR is predicted to fall between 51 and 185 O. Due to the inclusion of PVdF in the electrode composition, this value is rather high. The insulating properties of this polymer prevent the carbonic electrons from migrating (Aziz et al., 2020b).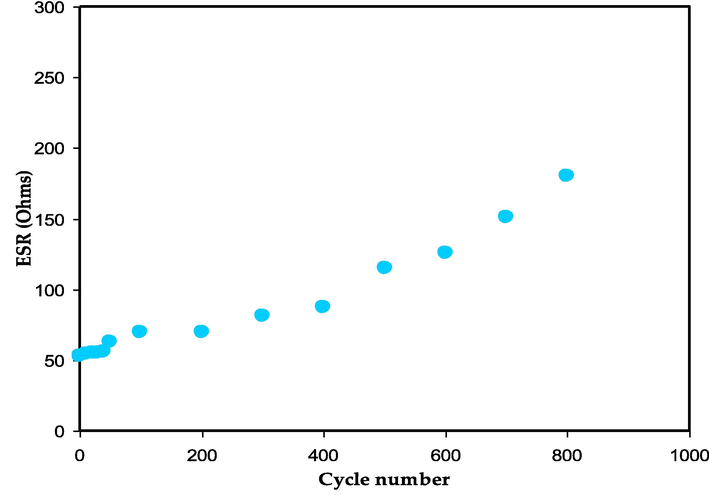
The ESR value against cycle number for the assembled EDLC.
The efficiency of the assembled EDLC is a significant aspect in determining the EDLC's performance. In the current work, the columbic efficiency of the assembled EDLC was calculated using eq. (5) for charging and discharging times, as shown in Fig. 17. It’s worth noting that the efficiency increases from first cycle (78 %) to the 20th cycles (98 %). A high efficiency in an electrochemical device indicates that the discharge time is equal to or greater than the charge time, which is in contrast to the conventional scenario where the charging process requires a longer time. When a current is applied, ions of both polarities migrate towards the electrode and become incorporated into the conductive network. Despite the prevailing trend of low efficiency, recent reports suggest that the efficiency values of electrochemical devices can vary between 78 and 98%. The current study found that the fabricated EDLC demonstrated exceptional cyclic stability and a low voltage drop over the course of 800 cycles.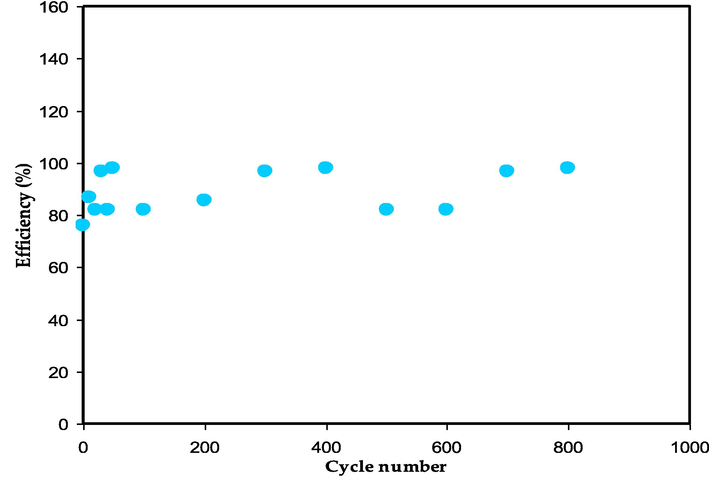
The efficiency trend for the assembled EDLC against cycle number.
An ultracapacitor or electrochemical capacitor, commonly known as a supercapacitor (SPC), is a power source that stores energy through an electrochemical process. The supercapacitor's capacity to store energy is due to the fast and reversible absorption and release of charge carriers at the interface between the active materials and electrolyte at the electrodes (Aziz et al., 2019b; Hamsan et al., 2017). SPCs are constructed with an electrolyte and one electrode pair. The conductive material used in electrolytes can come in various forms, such as liquid, solid, gel, or a combination of polymers, as long as it has the ability to conduct ions with high mobility. The capacitance of SPC is heavily influenced by the migration of ions from the electrolyte to the electrode SPC, an innovative form of electrochemical device, is replacing lithium ion batteries and conventional electrolytic capacitors. Compared to conventional dielectric capacitors, SPC have a greater energy density in addition to a higher power density than lithium-ion secondary batteries (Wu et al., 2013).
The values of E and P across 800 cycles are depicted in Fig. 18 and Fig. 19, respectively. It can be seen that both values fluctuate across a large range of cycles. The value of E is 11 Wh/kg in the first cycle and rises to 13 Wh/kg as the cycle number rises up to 200th cycle. The E becomes constant with a regular rate of 12 Wh/kg during the 100th and 800th charge–discharge cycles. This phenomena highlights the efficiency of anions (SCN−) and cations (K+) motions in the polymer chain of the MC toward the electrode surface at a nearly equal energy barrier (Karunagaran et al., 2003). The CS-based EDLC that Winie et al. (Winie et al., 2019) described has two energy densities of 0.57 and 2.8 Wh/kg for two current densities of 2 and 0.6 mA cm−2, respectively.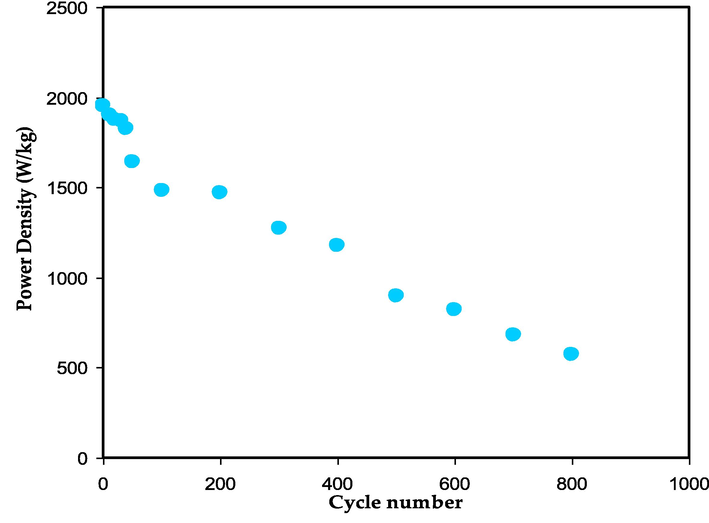
The power density value versus number of cycles.
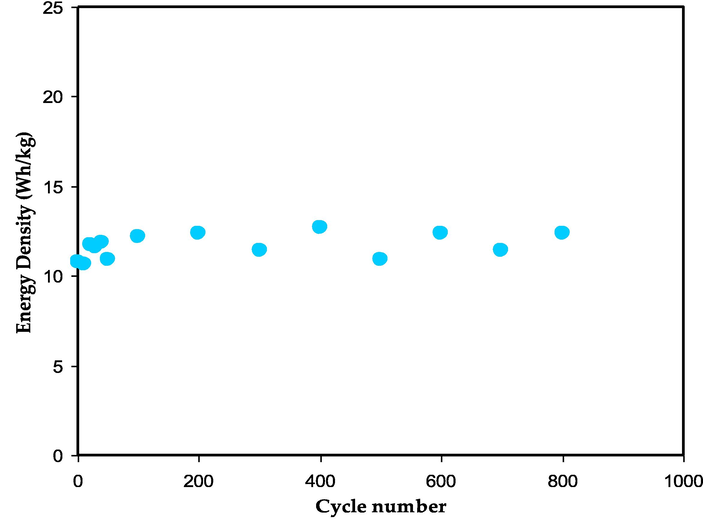
The energy density value versus number of cycles.
The slowness of the ion aggregation process can be explained by the constant values of energy density and capacitance throughout the 800 cycles. As a result, the EDLC assembly possesses a high power density compared to battery. The lack of intercalation/deintercalation development in the EDLC is another reasonable explanation for this superiority. In this process, ions must travel a greater distance and expend more energy before returning to the bulk electrolyte region. The power densities (P) for the first and 100th cycles are 1950 W/kg and 1470 W/kg, respectively. Yassine et al. (Yassine and Fabris, 2017), showed a connection between power density and internal resistance. Thus, the trends for P and ESR are going in opposite directions. As a result, the P value's declining is primarily due to the ESR's rising. Energy storage devices (ESD) must have a large energy capacity and power availability for loading during operation.
4 Conclusions
In this study, the solution casting method was utilized to create biopolymer electrolytes based on MC:KSCN and plasticized with glycerol plasticizer. The structural and electrochemical characteristics of the plasticized films were examined. An indication of interaction between the components of the electrolyte is seen in the broadening of FTIR bands and a decrease in their intensity. The evaluation of DC conductivity using the EIS method demonstrates the potential of the electrolyte films for device applications. The substantial accumulation of charge at the electrode/electrolyte interface is responsible for the high value of ε', indicating the presence of charge carriers at the electrode/electrolyte interface. There were different peaks in the tan δ and M“ spectra that are related to ion relaxation processes. The TNM trial confirmed that ions (tion = 0.942) contributed more than electron species. Using the LSV method, the film's stability was assessed across a variety of applied voltages. The function of the assembled EDLC was evaluated through CV and charge–discharge testing. Low scan rates of the manufactured device's CV pattern reveal a non-Faradaic procedure of charge storage with a virtually rectangular form. The prepared EDLC has initial values of specific capacitance 79 F/g, efficiency 87 %, power density 1950 W/kg, and energy density 12.1 Wh/kg.
Acknowledgments
The authors express their gratitude to the support of Princess Nourah bint Abdulrahman University Researchers Supporting Project number (PNURSP2023R58), Princess Nourah bint Abdulrahman University, Riyadh, Saudi Arabia. The authors gratefully acknowledge all supports for this study from the University of Sulaimani, Soran University, Sulaimani Polytechnic University, National Defence University of Malaysia, University of Malaya and University of Human Development.
Declaration of Competing Interest
The authors declare that they have no known competing financial interests or personal relationships that could have appeared to influence the work reported in this paper.
References
- Glycerol as an efficient plasticizer to increase the DC conductivity and improve the ion transport parameters in biopolymer based electrolytes: XRD, FTIR and EIS studies. Arab. J. Chem.. 2022;15(6):103791
- [CrossRef] [Google Scholar]
- Preparation and characterization of transparent cellulose films using an improved cellulose dissolution process. J. Appl. Polym. Sci.. 2017;134(21):1-12.
- [CrossRef] [Google Scholar]
- Dielectric relaxation studies on [PEO-SiO2]:NH4SCN nanocomposite polymer electrolyte films. J. Mater. Sci.. 2009;44(22):6060-6068.
- [CrossRef] [Google Scholar]
- Chitosan-based systems for molecular imaging. Adv. Drug Deliv. Rev.. 2010;62(1):42-58.
- [CrossRef] [Google Scholar]
- Electrical double layer capacitor using poly(methyl methacrylate)-C 4BO 8Li gel polymer electrolyte and carbonaceous material from shells of mata kucing (Dimocarpus longan) fruit. Electrochim. Acta. 2012;74:39-45.
- [CrossRef] [Google Scholar]
- Crystallinity and dielectric relaxations in semi-crystalline poly(ether ether ketone) J. Phys. Chem. Solids. 2007;68(7):1405-1414.
- [CrossRef] [Google Scholar]
- R. Article, “ScienceDirect Electrochemistry Electrochemical pressure impedance spectroscopy for investigation of mass transfer in polymer electrolyte membrane fuel cells,” no. May, pp. 1–6, 2020, doi: 10.1016/j.coelec.2020.04.017.
- Preparation and characterization of magnesium ion gel polymer electrolytes for application in electrical double layer capacitors. Electrochim. Acta. 2011;57(1):91-97.
- [CrossRef] [Google Scholar]
- Solid-state edlc device based on magnesium ion-conducting biopolymer composite membrane electrolytes: Impedance, circuit modeling, dielectric properties and electrochemical characteristics. Membranes (Basel). 2020;10(12):1-20.
- [CrossRef] [Google Scholar]
- Li+ ion conduction mechanism in poly (ε-caprolactone)-based polymer electrolyte. Iran. Polym. J. (English Ed.). 2013;22(12):877-883.
- [CrossRef] [Google Scholar]
- Study of electrical percolation phenomenon from the dielectric and electric modulus analysis. Bull. Mater. Sci.. 2015;38(6):1597-1602.
- [CrossRef] [Google Scholar]
- Occurrence of electrical percolation threshold and observation of phase transition in chitosan (1–x):AgI x (0.05 ≤ x ≤ 0.2)-based ion-conducting solid polymer composites. Appl. Phys. A Mater. Sci. Process.. 2016;122(7)
- [CrossRef] [Google Scholar]
- Proton conducting chitosan-based polymer blend electrolytes with high electrochemical stability. Molecules. 2019;24:1-15.
- [Google Scholar]
- Fabrication of energy storage EDLC device based on CS:PEO polymer blend electrolytes with high Li+ ion transference number. Results Phys.. 2019;15(July):102584
- [CrossRef] [Google Scholar]
- The study of plasticized amorphous biopolymer blend electrolytes based on polyvinyl alcohol (PVA): Chitosan with high ion conductivity for energy storage electrical double-layer capacitors (EDLC) device application. Polymers (Basel). 2020;12(9)
- [CrossRef] [Google Scholar]
- The study of structural, impedance and energy storage behavior of plasticized pva: Mc based proton conducting polymer blend electrolytes. Materials (Basel). 2020;13(21):1-20.
- [CrossRef] [Google Scholar]
- Structural and electrochemical studies of proton conducting biopolymer blend electrolytes based on MC: Dextran for EDLC device application with high energy density. Alexandria Eng. J. 2021
- [CrossRef] [Google Scholar]
- Characteristics of methyl cellulose based solid polymer electrolyte inserted with potassium thiocyanate as K + cation provider : Structural and electrical studies. Materials (Basel). 2022;15(16):5579.
- [Google Scholar]
- Electrical conduction mechanism in solid polymer electrolytes: New concepts to arrhenius equation. J. Soft Matter. 2013;2013:1-8.
- [CrossRef] [Google Scholar]
- Influence of silver ion reduction on electrical modulus parameters of solid polymer electrolyte based on chitosansilver triflate electrolyte membrane. Express Polym. Lett.. 2010;4(5):300-310.
- [CrossRef] [Google Scholar]
- Ion-transport study in nanocomposite solid polymer electrolytes based on chitosan: Electrical and dielectric analysis. J. Appl. Polym. Sci.. 2015;132(15):1-10.
- [CrossRef] [Google Scholar]
- Structural and electrical characteristics of PVA:NaTf based solid polymer electrolytes: role of lattice energy of salts on electrical DC conductivity. J. Mater. Sci. Mater. Electron.. 2017;28:12873-12884.
- [CrossRef] [Google Scholar]
- Structural, electrical and electrochemical properties of glycerolized biopolymers based on chitosan (Cs): Methylcellulose (mc) for energy storage application. Polymers (Basel). 2021;13:8.
- [CrossRef] [Google Scholar]
- Effect of glycerol on EDLC characteristics of chitosan:methylcellulose polymer blend electrolytes. J. Mater. Res. Technol.. 2020;9(4):8355-8366.
- [CrossRef] [Google Scholar]
- Design of potassium ion conducting PVA based polymer electrolyte with improved ion transport properties for EDLC device application. J. Mater. Res. Technol.. 2021;13:933-946.
- [CrossRef] [Google Scholar]
- Electrochemical characteristics of solid state double-layer capacitor constructed from proton conducting chitosan-based polymer blend electrolytes. Polym. Bull.. 2021;78(6):3149-3167.
- [CrossRef] [Google Scholar]
- An investigation into the PVA: MC: NH4Cl-based proton-conducting polymer-blend electrolytes for electrochemical double layer capacitor (EDLC) device application: the FTIR, circuit design and electrochemical studies. Molecules. 2022;27(3):1011.
- [Google Scholar]
- A. A. Azli, N. S. A. Manan, S. B. Aziz, and M. F. Z. Kadir, Structural, impedance and electrochemical double-layer capacitor characteristics of improved number density of charge carrier electrolytes employing potato starch blend polymers, vol. 26, no. 11. Ionics, 2020.
- Impact of purification on iota carrageenan as solid polymer electrolyte. Arab. J. Chem. 2018
- [CrossRef] [Google Scholar]
- Spectroscopic and electrochemical properties of (1–x) [PVA/PVP]: x [MgCl2 {6H2O}] blend polymer electrolyte films. Int. J. Polym. Sci.. 2018;2018
- [CrossRef] [Google Scholar]
- K. M. Batoo, S. Kumar, C. G. Lee, and Alimuddin, “Study of dielectric and ac impedance properties of Ti doped Mn ferrites,” Curr. Appl. Phys., vol. 9, no. 6, pp. 1397–1406, 2009, doi: 10.1016/j.cap.2009.03.012.
- Recent trends in electrolytes for supercapacitors. J. Energy Storage. 2022;50:104222
- [Google Scholar]
- and M. F. K. Brza, Mohamad A., Shujahadeen B. Aziz, Rebar T. Abdulwahid, Hawzhin B. Tahir, “‘Ion Transport and Electrochemical Properties of Proton Conducting SPE for EDLC with Constant Specific Capacitance and Energy Density.,’” J. Ind. Eng. Chem.
- Dielectric relaxation and dc conductivity on the PVOH-CF3COONH4 polymer system. Ionics (Kiel). 2009;15(5):537-544.
- [CrossRef] [Google Scholar]
- The oleic acid composition effect on the carboxymethyl cellulose based biopolymer electrolyte. J. Cryst. Process Technol.. 2013;03(01):1-4.
- [CrossRef] [Google Scholar]
- Novel proton conducting solid bio-polymer electrolytes based on carboxymethyl cellulose doped with oleic acid and plasticized with glycerol. Sci. Rep.. 2016;6(May):1-7.
- [CrossRef] [Google Scholar]
- Realizing an all-round hydrogel electrolyte toward environmentally adaptive dendrite-free aqueous Zn–MnO2 batteries. Adv. Mater.. 2021;33
- [CrossRef] [Google Scholar]
- Hydrogel-polymer electrolytes for electrochemical capacitors: An overview. Energy Environ. Sci.. 2009;2(1):55-67.
- [CrossRef] [Google Scholar]
- Substantial proton ion conduction in methylcellulose/pectin/ammonium chloride based solid nanocomposite polymer electrolytes: effect of ZnO nanofiller. Membranes. 2022;12(7):706.
- [Google Scholar]
- The dielectric properties of TeO 2-P 2 O 5 glasses. Mater. Chem. Phys.. 2000;65(February):192-196.
- [Google Scholar]
- Preparation of miscible PVA/PEG blends and effect of graphene concentration on thermal, crystallization, morphological, and mechanical properties of PVA/PEG (10wt%) blend. Int. J. Polym. Sci.. 2018;2018
- [CrossRef] [Google Scholar]
- Recent advances in micro-supercapacitors for AC line-filtering performance: From fundamental models to emerging applications. eScience. 2021;1:124-140.
- [CrossRef] [Google Scholar]
- Carbon materials for supercapacitor application. Phys. Chem. Chem. Phys.. 2007;9(15):1774-1785.
- [CrossRef] [Google Scholar]
- Block copolymer solid battery electrolyte with high li-ion transference number. J. Electrochem. Soc.. 2010;157(7):A846.
- [CrossRef] [Google Scholar]
- A Study of the dielectric properties of the polymer electrolyte PEO-LiClO4 over a composition range using time domain spectroscopy. J. Polym. Sci. Part B Polym. Phys.. 1989;27(10):2011-2022.
- [CrossRef] [Google Scholar]
- A new type of composite electrolyte with high performance for room-temperature solid-state lithium battery. J. Mater. Sci.. 2019;54(6):4874-4883.
- [CrossRef] [Google Scholar]
- Investigation of ion transport parameters and electrochemical performance of plasticized biocompatible chitosan-based proton conducting polymer composite electrolytes. Membranes (Basel). 2020;10(11):1-27.
- [CrossRef] [Google Scholar]
- Electrochemical impedance study of proton conducting polymer electrolytes based on PVC doped with thiocyanate and plasticized with glycerol. Int. J. Electrochem. Sci.. 2020;15(May):4671-4683.
- [CrossRef] [Google Scholar]
- Electrical, dielectric property and electrochemical performances of plasticized silver ion-conducting chitosan-based polymer nanocomposites. Membranes (Basel). 2020;10(7):1-22.
- [CrossRef] [Google Scholar]
- Role of nano-capacitor on dielectric constant enhancement in PEO:NH4SCN:xCeO2 polymer nano-composites: Electrical and electrochemical properties. J. Mater. Res. Technol.. 2020;9(4):9283-9294.
- [CrossRef] [Google Scholar]
- Design of plasticized proton conducting Chitosan: Dextran based biopolymer blend electrolytes for EDLC application: Structural, impedance and electrochemical studies. Arab. J. Chem.. 2021;14(11):103394
- [CrossRef] [Google Scholar]
- Structural and energy storage behavior of ion conducting biopolymer blend electrolytes based on methylcellulose: Dextran polymers. Alexandria Eng. J.. 2022;61(12):9273-9285.
- [CrossRef] [Google Scholar]
- Simulated EIS and Trukhan model to study the ion transport parameters associated with Li+ Ion dynamics in CS based polymer blends inserted with lithium nitrate salt. Results Phys. 2023
- [CrossRef] [Google Scholar]
- Characteristics of EDLC device fabricated from plasticized chitosan:MgCl2 based polymer electrolyte. J. Mater. Res. Technol.. 2020;9(5):10635-10646.
- [CrossRef] [Google Scholar]
- Influence of NH 4 Br as an ionic source on the structural/electrical properties of dextran-based biopolymer electrolytes and EDLC application. Bull. Mater. Sci.. 2020;43:1.
- [CrossRef] [Google Scholar]
- NH4NO3 as charge carrier contributor in glycerolized potato starch-methyl cellulose blend-based polymer electrolyte and the application in electrochemical double-layer capacitor. Ionics (Kiel). 2017;23(12):3429-3453.
- [CrossRef] [Google Scholar]
- Polymer electrolyte based solid state redox supercapacitors with poly (3-methyl thiophene) and polypyrrole conducting polymer electrodes. Ionics (Kiel). 1997;3(3–4):177-183.
- [CrossRef] [Google Scholar]
- Effect of incorporation of different plasticizers on structural and ion transport properties of PVA-LiClO4 based electrolytes. Heliyon. 2018;4(12)
- [CrossRef] [Google Scholar]
- Conductivity, thermal and morphology studies of PEO based salted polymer electrolytes. Solid State Sci.. 2012;14(8):1111-1116.
- [CrossRef] [Google Scholar]
- The relationship between chemical structure and dielectric properties of plasma-enhanced chemical vapor deposited polymer thin films. Thin Solid Films. 2007;515(7–8):3513-3520.
- [CrossRef] [Google Scholar]
- Effect of plasticizers (water and glycerol) on the diffusion of a small molecule in iota-carrageenan biopolymer films for edible coating application. Biomacromolecules. 2006;7(6):2011-2019.
- [CrossRef] [Google Scholar]
- B. Karunagaran, R. T. Rajendra Kumar, V. Senthil Kumar, D. Mangalaraj, S. K. Narayandass, and G. Mohan Rao, “Structural characterization of DC magnetron-sputtered TiO2 thin films using XRD and Raman scattering studies,” Mater. Sci. Semicond. Process., vol. 6, no. 5–6, pp. 547–550, Oct. 2003, doi: 10.1016/j.mssp.2003.05.012.
- Acetate- and lactate-based ionic liquids: Synthesis, characterisation and electrochemical properties. J. Mol. Liq.. 2018;264(2017):233-241.
- [CrossRef] [Google Scholar]
- Conductivity studies of a chitosan-based polymer electrolyte. Phys. B Condens. Matter. 2006;373(1):23-27.
- [CrossRef] [Google Scholar]
- Multiwalled carbon nanotubes based nanocomposites for supercapacitors: A review of electrode materials. Nano. 2012;7(2):1-27.
- [CrossRef] [Google Scholar]
- Effect of plasticizers on mechanical and barrier properties of rice starch film. Starch/Staerke. 2004;56(8):348-356.
- [CrossRef] [Google Scholar]
- S. Lau, A. W. M. Kahar, and M. D. Yusrina, “Effect of glycerol as plasticizer on the tensile properties of chitosan / microcrystalline cellulose films,” AIP Conf. Proc., vol. 2339, no. May, 2021, doi: 10.1063/5.0044825.
- Electrochemical capacitors with polymer electrolytes based on ionic liquids. Solid State Ionics. 2003;161(3–4):243-249.
- [CrossRef] [Google Scholar]
- Good prospect of ionic liquid based-poly(vinyl alcohol) polymer electrolytes for supercapacitors with excellent electrical, electrochemical and thermal properties. Int. J. Hydrogen Energy. 2014;39(6):2953-2963.
- [CrossRef] [Google Scholar]
- Characterization of ionic liquid added poly(vinyl alcohol)-based proton conducting polymer electrolytes and electrochemical studies on the supercapacitors. Int. J. Hydrogen Energy. 2015;40(1):852-862.
- [CrossRef] [Google Scholar]
- Capacitive behavior studies on electrical double layer capacitor using poly (vinyl alcohol)-lithium perchlorate based polymer electrolyte incorporated with TiO2. Mater. Chem. Phys.. 2014;143(2):661-667.
- [CrossRef] [Google Scholar]
- Degradation of covalently cross-linked carboxymethyl chitosan and its potential application for peripheral nerve regeneration. Eur. Polym. J.. 2007;43(9):3807-3818.
- [CrossRef] [Google Scholar]
- S. W. Lusiana, D. Putri, I. Z. Nurazizah, and Bahruddin, “Bioplastic Properties of Sago-PVA Starch with Glycerol and Sorbitol Plasticizers,” J. Phys. Conf. Ser., vol. 1351, no. 1, 2019, doi: 10.1088/1742-6596/1351/1/012102.
- N. F. Mazuki, A. P. P. Abdul Majeed, Y. Nagao, and A. S. Samsudin, “Studies on ionics conduction properties of modification CMC-PVA based polymer blend electrolytes via impedance approach,” Polym. Test., vol. 81, no. October 2019, p. 106234, 2020, doi: 10.1016/j.polymertesting.2019.106234.
- Progress in bio-based plastics and plasticizing modifications. J. Mater. Chem. A. 2013;1(43):13379-13398.
- [CrossRef] [Google Scholar]
- Electrochemical capacitors with plasticized gel-polymer electrolytes. J. Power Sources. 2001;101(2):213-218.
- [CrossRef] [Google Scholar]
- M. Morita, J. L. Qiao, N. Yoshimoto, and M. Ishikawa, “Application of proton conducting polymeric electrolytes to electrochemical capacitors,” Electrochim. Acta, vol. 50, no. 2-3 SPEC. ISS., pp. 837–841, 2004, doi: 10.1016/j.electacta.2004.02.053.
- Solid polymer electrolytes based on methylcellulose: FT-IR and ionic conductivity studies. Int. J. Polym. Anal. Charact.. 2010;15(5):319-327.
- [CrossRef] [Google Scholar]
- Synthesis of porous proton ion conducting solid polymer blend electrolytes based on PVA: CS polymers: Structural, morphological and electrochemical properties. Materials (Basel). 2020;13(21):1-21.
- [CrossRef] [Google Scholar]
- A study of methylcellulose based polymer electrolyte impregnated with potassium ion conducting carrier: Impedance, eec modeling, ftir, dielectric, and device characteristics. Materials (Basel). 2021;14(17)
- [CrossRef] [Google Scholar]
- β Dielectric relaxation mode in side-chain liquid crystalline polymer film. J. Non. Cryst. Solids. 2008;354(14):1526-1530.
- [CrossRef] [Google Scholar]
- Modulus studies of CdI2-Ag2O-V2O 5–B2O3 system. Mater. Sci. Eng. B Solid-State Mater. Adv. Technol.. 2005;122(1):24-28.
- [CrossRef] [Google Scholar]
- Recent progress and perspective on electrolytes for sodium/potassium-based devices. Energy Storage Mater.. 2020;31:328-343.
- [CrossRef] [Google Scholar]
- Ionic liquid incorporated PEO based polymer electrolyte for electrical double layer capacitors: A comparative study with lithium and magnesium systems. Solid State Ionics. 2011;190(1):93-98.
- [CrossRef] [Google Scholar]
- Synthesis and characterization of magnesium ion conductivity in PVDF based nanocomposite polymer electrolytes disperse with MgO. J. Alloys Compd. 2019
- [CrossRef] [Google Scholar]
- P. Pazhamalai and C. Capiglia, “Lithium based battery-type cathode material for hybrid supercapacitor Related papers.”.
- W. G. Pell and B. E. Conway, “Peculiarities and requirements of asymmetric capacitor devices based on combination of capacitor and battery-type electrodes,” J. Power Sources, vol. 136, no. 2 SPEC. ISS., pp. 334–345, 2004, doi: 10.1016/j.jpowsour.2004.03.021.
- Mixtures of azepanium based ionic liquids and propylene carbonate as high voltage electrolytes for supercapacitors. Electrochim. Acta. 2015;153:426-432.
- [CrossRef] [Google Scholar]
- Ionic conductivity and discharge characteristic studies of PVA-Mg(CH 3COO)2 solid polymer electrolytes. Int. J. Polym. Mater. Polym. Biomater.. 2013;62(2):76-80.
- [CrossRef] [Google Scholar]
- Preparation and characterization of pva based solid polymer electrolytes for electrochemical cell applications. Chinese J. Polym. Sci. (English Ed.. 2013;31(4):641-648.
- [CrossRef] [Google Scholar]
- Studies of dielectric relaxation and AC conductivity behavior of plasticized polymer nanocomposite electrolytes. Int. J. Electrochem. Sci.. 2008;3(5):597-608.
- [Google Scholar]
- Dielectric and modulus studies on LiFe1/2Co1/2VO4. J. Alloys Compd.. 2008;462(1–2):214-219.
- [CrossRef] [Google Scholar]
- Conductivity and FTIR studies on PEO-LiX [X: CF3SO3-, SO42-] polymer electrolytes. Spectrochim. Acta - Part A Mol. Biomol. Spectrosc.. 2008;69(2):670-675.
- [CrossRef] [Google Scholar]
- Influence of nano-sized fumed silica on physicochemical and electrochemical properties of cellulose derivatives-ionic liquid biopolymer electrolytes. Ionics (Kiel). 2018;24(3):807-814.
- [CrossRef] [Google Scholar]
- Preparation and characterization of PVP-based polymer electrolytes for solid-state battery applications. Iran. Polym. J. (English Ed.). 2012;21(8):531-536.
- [CrossRef] [Google Scholar]
- Development of flexible plasticized ion conducting polymer blend electrolytes based on polyvinyl alcohol (PVA): Chitosan (CS) with high ion transport parameters close to gel based electrolytes. Gels. 2022;8(3):1-23.
- [CrossRef] [Google Scholar]
- Synthesis and characterization of biopolymer electrolyte based on tamarind seed polysaccharide, lithium perchlorate and ethylene carbonate for electrochemical applications. Ionics (Kiel). 2019;25(3):1067-1082.
- [CrossRef] [Google Scholar]
- A. M. E. Sayed, A. M. Abdelghany, and A. Abou Elfadl, “Structural, Optical, Mechanical and Antibacterial Properties of MgO/Poly(Vinyl Acetate)/Poly(Vinyl Chloride) Nanocomposites,” Brazilian J. Phys., vol. 52, no. 5, 2022, doi: 10.1007/s13538-022-01156-x.
- Polyvinyl alcohol-polystyrene sulphonic acid blend electrolyte for supercapacitor application. Phys. B Condens. Matter. 2009;404(8–11):1143-1147.
- [CrossRef] [Google Scholar]
- Low frequency dielectric relaxation processes and ionic conductivity of montmorillonite clay nanoparticles colloidal suspension in poly(vinyl pyrrolidone)-ethylene glycol blends. Express Polym. Lett.. 2008;2(11):800-809.
- [CrossRef] [Google Scholar]
- C. Series, “Characterization of Solid Polymer Electrolyte Membrane made of Methylcellulose and Ammonium Nitrate Characterization of Solid Polymer Electrolyte Membrane made of Methylcellulose and Ammonium Nitrate,” 2020, doi: 10.1088/1742-6596/1532/1/012017.
- N. A. Shamsuri, S. N. A. Zaine, Y. M. Yusof, W. Z. N. Yahya, and M. F. Shukur, “Effect of ammonium thiocyanate on ionic conductivity and thermal properties of polyvinyl alcohol – methylcellulose – based polymer electrolytes,” no. 3, 2020.
- Electrical double layer capacitor with proton conducting Κ-Carrageenan–chitosan electrolytes. Funct. Mater. Lett.. 2009;01(03):195-201.
- [CrossRef] [Google Scholar]
- Transport studies of NH4NO3 doped methyl cellulose electrolyte. Synth. Met.. 2010;160(9–10):1040-1044.
- [CrossRef] [Google Scholar]
- Electrical double-layer capacitors with plasticized polymer electrolyte based on methyl cellulose. Polym. Bull.. 2012;69(7):807-826.
- [CrossRef] [Google Scholar]
- Electrical characterization of corn starch-LiOAc electrolytes and application in electrochemical double layer capacitor. Electrochim. Acta. 2014;136:204-216.
- [CrossRef] [Google Scholar]
- Ionic conductivity and dielectric properties of potato starch-magnesium acetate biopolymer electrolytes: the effect of glycerol and 1-butyl-3-methylimidazolium chloride. Ionics (Kiel). 2016;22(7):1113-1123.
- [CrossRef] [Google Scholar]
- Dielectric spectroscopy studies on (PVP + PVA) polyblend film. Microelectron. Eng.. 2006;83(2):281-285.
- [CrossRef] [Google Scholar]
- T. Takahashi, Recent Trends in High Conductivity Solid Electrolytes and Their Applications: an Overview, Second Edi. ACADEMIC PRESS, INC., 1989.
- Role of plasticizers in bioplastics. MOJ Food Process. Technol.. 2019;7(4):128-130.
- [CrossRef] [Google Scholar]
- A. Varzi, A. Balducci, and S. Passerini, “Natural cellulose : A green alternative binder for high voltage electrochemical double layer capacitors containing Ionic liquid-based electrolytes,” vol. 161, no. 3, pp. 368–375, 2014, doi: 10.1149/2.063403jes.
- M. Wall, D. Ph, and T. F. Scientific, “The raman spectroscopy of graphene and the determination of layer thickness”.
- High performance poly(vinyl alcohol)-based Li-ion conducting gel polymer electrolyte films for electric double-layer capacitors. Polymers (Basel). 2018;10(11)
- [CrossRef] [Google Scholar]
- Hexanoyl chitosan/ENR25 blend polymer electrolyte system for electrical double layer capacitor. Polym. Adv. Technol.. 2019;30(3):726-735.
- [CrossRef] [Google Scholar]
- Graphene-based in-plane micro-supercapacitors with high power and energy densities. Nat. Commun.. 2013;4
- [CrossRef] [Google Scholar]
- Performance of commercially available supercapacitors. Energies. 2017;10:9.
- [CrossRef] [Google Scholar]
- Geochemical applications of the simple salt approximation to the lattice energies of complex materials. Am. Mineral.. 2005;90(2–3):488-496.
- [CrossRef] [Google Scholar]
- Enhanced capacitance and rate capability of graphene/polypyrrole composite as electrode material for supercapacitors. J. Power Sources. 2011;196(14):5990-5996.
- [CrossRef] [Google Scholar]


