

Translate this page into:
Simulation study on inhibition performance of hydrate cellulose kinetic inhibitors for drilling in marine gas-bearing formations
⁎Corresponding author. wangjie@yangtzeu.edu.cn (Jie Wang)
-
Received: ,
Accepted: ,
This article was originally published by Elsevier and was migrated to Scientific Scholar after the change of Publisher.
Peer review under responsibility of King Saud University.
Abstract
In the marine high-pressure low-temperature environment, it is difficult to regulate the low-temperature rheology of the drilling fluid, and the spilled natural gas is easy to generate solid gas hydrate in the wellbore, causing problems such as wellbore blockage and increasing the risk of safe drilling operations. Although there are many researches on the invasion process of drilling fluid and the development of new hydrate inhibition, there is still a lack of research on the inhibition system suitable for drilling fluid. Therefore, this paper uses the self-developed hydrate formation evaluation experimental device to simulate and analyze the effect of inhibitors in reservoir environment and optimize the scheme of drilling fluid inhibition system. The results show that: (1) Through the improvement of the experimental device of water bath methane hydrate (MH) evaluation, the accuracy and parallel control of the equipment are enhanced, and the methane hydrate formed by sea water (SW) is less than that of distilled water (DW), and the structure of methane hydrate formed by distilled water is more compact. (2) Through the evaluation experiment of single inhibitor A3, PAC and CMC inhibition system, it was found that A3 had the best inhibition effect, and when the inhibitor concentration was 1.5 wt%, it had the best inhibition effect. (3) The influence of clay types on the formation of methane hydrate is also significantly different. Bentonite soil Red (BSR) has better inhibition performance than Bentonite soil Yellow (BSY), and its ' hut ' structure formed at low temperature is the reason for the formation of methane hydrate. (4) The inhibition ability of A3 inhibitor in BSY system and BSR system solution in general, the addition of KCl can play a strong synergistic inhibition ability with A3 in BSR system, and its electric field reduces the activation energy of water molecules as well as the consumption of free water is the reason to reduce the generation of methane hydrate.
Keywords
Methane hydrate
Inhibitor
Clay type
Performance optimization
Spatial structure

Nomenclature
- DW
-
Distilled water
- SW
-
Sea water
- BSY
-
Bentonite soil Yellow
- BSR
-
Bentonite soil Red
- PAC
-
Polyanionic cellulose sodium salt
- CMC
-
Carboxymethyl cellulose
- MH
-
Methane hydrate
- DDL
-
Diffuse double layer
1 Introduction
Natural gas hydrate is an ice-like caged solid crystal formed by van der Waals forces from smaller diameter guest molecules such as methane, propane, nitrogen, carbon dioxide, hydrogen sulfide, etc., with a density of about 0.8 ∼ 1.0 g/cm3(Ruan et al., 2021; Song et al., 2014; Ye et al., 2020). As the ore product discovered in the scientific investigation in the 20th century, the heat equivalent of the global resource reserves of natural gas hydrate is twice as much as the total heat of fossil fuels such as oil, coal and natural gas. It is an important strategic resource to replace coal, oil and natural gas in the future (as shown in Fig. 1) (Beauchamp B, 2004; Giavarini C et al., 2011; Collett, T. S. et al., 2010). In China, natural gas hydrates are mainly located in the waters of the South China Sea, the East China Sea and the permafrost strata of the Northeast Plain and Qinghai-Tibet Plateau, with abundant reserves of over 40 billion tons and 80 billion tons of oil equivalent onshore and offshore natural gas hydrate resources, respectively (Ye et al., 2018; Qin et al., 2020). However, there are many challenges in drilling marine gas hydrate formations, even gas-bearing formations. (1) The high pressure and low temperature environment of offshore drilling increases the viscosity of drilling fluid, resulting in increased difficulty in regulating the low temperature rheology of drilling fluid and making the drilling process difficult. (2) The drilling fluid invades the natural gas hydrate formation, breaking the original state of the stable existence of natural gas hydrate, and the decomposition of natural gas hydrate leads to wellbore instability. (3) Decomposition of natural gas hydrates in the vicinity of near wells, and blockage problems such as secondary hydrate formation in production pipelines and valves after decomposition of free natural gas (as shown in Fig. 2) (Maiti M et al., 2021; Sun et al., 2022; Wang et al.,2021).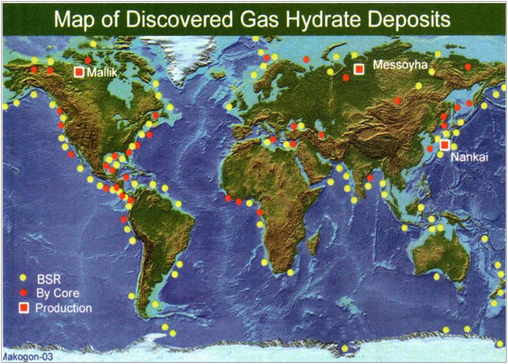
Map of gas hydrate deposits found worldwide (Wang et al., 2011; Temizel et al., 2016). Yellow: areas where gas hydrates have been found to be present. Red: areas where gas hydrates are potentially present but have not been sampled and verified.
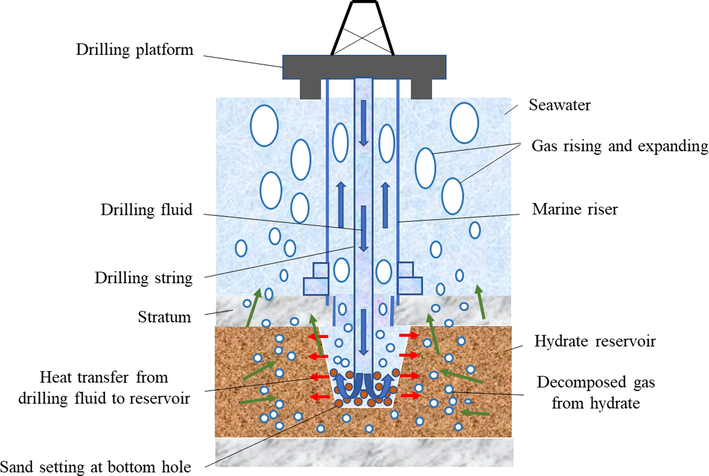
Schematic diagram of hydrate formation drilling risk.
In response to the above-mentioned problems of drilling fluid, hydrate decomposition, and well wall destabilization in marine gas-bearing and hydrate formations, a large number of scholars and researchers have explored the influence of the inhibition system on the processes of gas hydrate formation and decomposition on the change of gas–liquid phase state in the wellbore through experimental as well as numerical simulation schemes. To address the intrusion process and dynamic response of drilling fluids, Dong et al. constructed a three-dimensional coupled thermal-water-chemical model and found that the intrusion characteristics of drilling fluids depend on pressure and permeability, and temperature mainly affects the dissociation of gas hydrate, while the increase in permeability triggered by gas hydrate dissociation is the main reason for the sharp decrease in fluid loss rate at the initial stage of intrusion (Dong et al., 2022; Dong L et al., 2022). In order to reduce the secondary formation of gas hydrate after dissociation during drilling, Madhukar et al. tested the inhibition performance of drilling fluids and water content under dynamic/static conditions using a self-designed high-pressure reactor, and found that XG has good viscosity performance and CMC has good filtration loss performance, and its drilling fluids have good inhibition performance under static conditions, but with water content increases, the risk of gas hydrate formation also increases (Srungavarapu M et al., 2018). And He and Xing explained the reason of rapid gas hydrate from the deterioration of rheological properties of drilling fluid and the generation of gelling phenomenon, that is, the inability of water molecules in drilling fluid to penetrate between clay particles under low temperature conditions, and the increase of friction between clay particles and dynamic shear and static shear of drilling fluid (He and Xing, 2017). This inevitably leads to the reduction of the dispersion spacing of clay particles, which increases the contact probability between water molecules and clay particles and provides attachment points for the formation of natural gas hydrates, resulting in the formation of large amounts of natural gas hydrates. In addition, Hafiz and Ali used SEM-EDW to analyze the filter cake and the contact angle measurement results, indicating that the synergistic effect of ZnO in the polymer solution enhances the inhibition of MH, and also increases the hydrophobic properties of the shale surface in the drilling fluid formulation (Ahmad et al., 2021; Ali et al., 2022). And according to the study of PVP in deep-sea drilling fluids, it was found that PVP can effectively influence the three-phase equilibrium and formation kinetics of hydrate, and it can prolong the hydrate nucleation time when used in combination with ethanol (He et al., 2021; He et al., 2022). The kinetic effects of montmorillonite clay particles on MH generation and dissociation were investigated by Ren et al. In combination with the improvement and refinement of the experimental setup by Niu et al. The clay particle delamination and induced electric field increase the sites of hydrate nucleation, and the high viscosity of the suspension and the strongly polarized water layer caused by the clay hinder the mass transfer of the gas from the gas phase to the liquid phase and substantially delay the hydrate nucleation time (Ren et al., 2022; Niu et al., 2021; Ren et al., 2023).
Although a lot of research has been conducted on drilling fluid intrusion processes and gas hydrate inhibitor development, relatively little research has been conducted on cellulose-based inhibitors and systems suitable for gas hydrate inhibition in offshore drilling (Gong et al., 2022; Cendales et al., 2021). In order to reduce the risk of secondary gas hydrate formation and drilling fluid intrusion, and to increase the selectivity of hydrate formation inhibitors, it is necessary to optimize the design of offshore drilling fluid systems, develop cellulose-based inhibitor drilling fluid systems suitable for gas-bearing formations and gas hydrate formations, reduce the heat exchange rate to reduce secondary gas hydrate formation in the wellbore, pipeline and other components, and improve wellbore stability. The system is designed to reduce the heat exchange rate to reduce the secondary formation of gas hydrate in the wellbore, pipeline and other components, and improve wellbore stability. In this paper, the related simulation work of drilling fluid inhibition system is carried out through the self-designed marine hydrate formation and decomposition simulation device, and provided reference for the safe exploitation of marine gas-bearing strata and hydrate strata as well as the reasonable establishment of drilling fluid system, and established the inhibition system to meet the technical requirements of drilling for natural gas and natural gas hydrate exploitation in the sea.
2 Experiment
2.1 Experimental material
In the experimental simulation evaluation, the main solvent was seawater from the South China Sea, and the additives were mainly self-developed cellulose inhibitors A3(95.0 wt%), hydroxymethyl cellulose (CMC), polyanionic cellulose (PAC), which were produced by Shanghai Aladdin Biochemical Technology Co., Ltd.; potassium chloride (KCl analytical purity), produced by Guoyao Group Chemical Reagent Co., Ltd.; sodium bentonite (yellow, red), produced by Xilong Science Co., Ltd.; high purity methane gas (99.99 wt%) was produced by Wuhan Xinxing Industrial Gas Co., Ltd.
2.2 Experiment apparatus and procedure
Commonly used experimental equipment: electronic balance (model BSM-520.3), Shanghai Zhuojing Electronics Co., Ltd.; magnetic heating stirrer (Model 78–1), Changzhou Munters Instrument Manufacturing Co., Ltd.; variable frequency high speed stirrer (model GLS-B12K), Qingdao Hengtaida Electromechanical Equipment Co., Ltd.
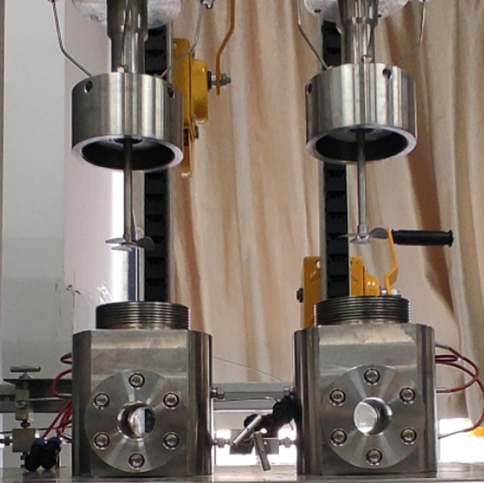
The equipment used for the experimental evaluation study is a self-developed hydrate evaluation simulation test device, which mainly includes ①gas cylinder safety cabinet; ②air compressor; ③gas pressurization system; ④water bath temperature control system; ⑤data acquisition and parameter control system; ⑥hydrate simulation reactor composition, as shown in the physical diagram of Fig. 3 hydrate simulation test device. Temperature control range −30℃∼100℃±0.1℃, visualization MH simulation system pressure tolerance range 0 ∼ 25 MPa ± 0.01 MPa, simulation device volume 500 mL ± 0.1 mL, magnetic stirrer speed 0 ∼ 1000 rpm (Kang et al., 2013; Li et al., 2007).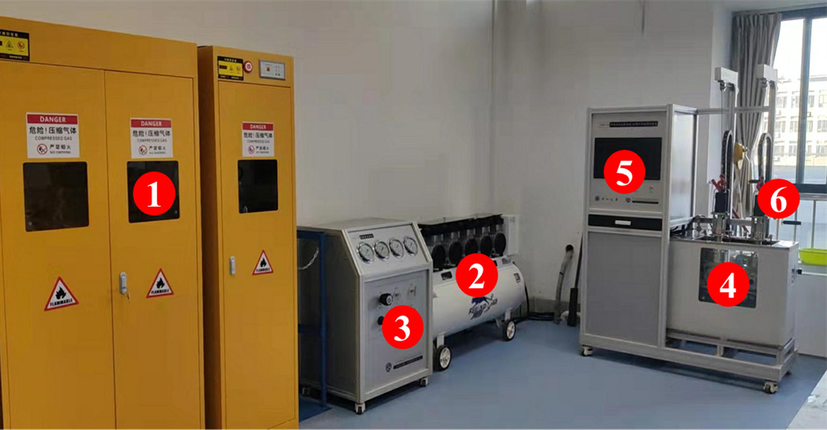
Hydrate simulation test device combination diagram.
Combining the simplified simulation diagram of the experimental device in Fig. 4 and the physical diagram of the MH simulation reactor in Fig. 5, the experimental steps of MH simulation evaluation in this study are as follows.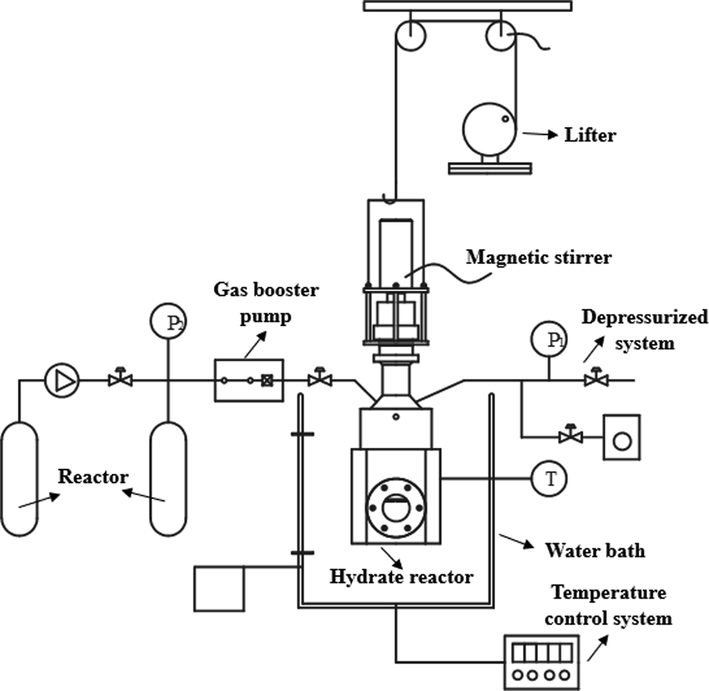
Simplified diagram of MH simulation test device.
MH simulated reactor physical diagram.
(1) Turn on the MH evaluation simulation test device and make the water bath temperature drop to the required temperature of 3℃ for the experiment through the water bath temperature control system.
(2) Use a precision electronic balance and stirrer to add drugs according to the experimental formula, and stir well to dissolve.
(3) Use distilled water to clean the reactor and use the rubber-tipped dropper to suck out the residual water inside the kettle.
(4) Add the configured solution to the reactor, install the reactor as shown in Fig. 5, and make the reactor completely submerged in the water bath temperature control system after installation, and connect the temperature and pressure sensors.
(5) Check that all switches are closed, pass in 2 ∼ 3 MPa methane gas, and after no change in pressure in the reactor, discharge the gas from the kettle until the pressure in the kettle is around 0.2 ∼ 0.3 MPa. The main purpose of this step is to: ① check the gas tightness of the experimental device; ② discharge the air inside the kettle.
(6) Passing methane gas at the required pressure for the experiment into the reactor through gas cylinders, air compressors, gas booster systems and inlet valves, etc.
(7) After the pressure and temperature inside the reactor are stabilized, the rotational speed is set to 300 rpm by the data acquisition and parameter control system, and the acquisition is set once every 5 min.
(8) After the experiment, turn off the stirrer through the control panel of the experimental device, slowly release the pressure through the pressure relief valve, and after the control panel shows that the pressure of the reactor drops to 0 MPa, remove and disassemble the reactor from the water bath control system to observe the MH form and the amount of production.
(9) Prepare different solutions and repeat the operation steps (1) ∼ (8) to simulate and evaluate MH.
2.3 Experiment scheme
Since the experimental device uses a double reactor to work, in order to ensure the accuracy of the experimental data, it is necessary to use a parallel control experiment to verify the fitting of the experimental data of the double reactor. Also, since three inhibitors were involved in the experimental process, clarifying the inhibitory effect of the inhibitor in a single system was the basis for system optimization and development before the optimal design of the marine inhibition system. In addition, within the system due to the variety of substances, the inhibitory effect of inhibitors will vary due to multiple factors, the study of the rheological properties of bentonite particles at low temperatures on hydrate formation is a prerequisite for the establishment of the system (Abdou et al., 2011; Abdou et al., 2013)。Therefore, in order to investigate the inhibition effect of the inhibitor and to construct the inhibition system for offshore drilling fluid on the basis, the gas–liquid ratio in the experiment of this study was 1.0 (250:250), and the experimental temperature and pressure were 3 °C and 15.0 MPa, respectively, and the specific experimental protocols are shown in Tables 1-5. Note:BSY Sys:2 wt% BSY Base Mud + 0.3 wt%KPAM + 1.2 wt%XC + 0.3 wt%BDV-110S. BSR Sys:2 wt% BSR Base Mud + 0.3 wt%KPAM + 1.2 wt%XC + 0.3 wt%BDV-110S.
Serial number
Experimental scheme
1
DW(The first 4 h without stirring, after 16 h stirring)
2
DW(The first 4 h without stirring, after 16 h stirring)
3
DW (Reactor 1)
4
DW (Reactor 2)
5
SW (Reactor 1)
6
SW (Reactor 2)
Serial number
Experimental scheme
1
1 wt%A3
2
1 wt%CMC
3
1 wt%PAC
5
2 wt%A3
6
2 wt%CMC
7
2 wt%PAC
Serial number
Experimental scheme
1
DW
2
SW
3
DW + 1.5 wt%A3
4
SW + 1.5 wt%A3
5
DW + 1 wt%A3
6
DW + 2 wt%A3
7
DW + 3 wt%A3
8
SW + 1 wt%A3
9
SW + 2 wt%A3
Serial number
Experimental scheme
1
DW
2
SW
3
2 wt%BSY Base Mud
4
2 wt% BSR Base Mud
Serial number
Experimental scheme
1
BSY Sys
2
BSR Sys
3
BSY Sys1 + 1%A3
4
BSY Sys + 1.5%A3
5
BSY Sys + 2%A3
6
BSR Sys + 1.5%A3
7
BSR Sys + 1.5%A3 + 5%KCl
8
BSY Sys + 1.5%A3
9
BSY Sys + 1.5%A3 + 5%KCl
3 Results and discussion
3.1 Accuracy and parallel controlled experiments
To ensure the credibility of the experimental data, this study first examined the accuracy of the experimental device for MH formation, decomposition and inhibition evaluation and the parallel control of reactors 1 and 2. Fig. 7 shows the No 1 and 2 test experiments in Table 1 before the improvement of the experimental device. The test results show that before the improvement of the experimental device, the reactor 1 and 2 have the same liquid type and reaction temperature / pressure and the same operation. Under the same operation, the change curve of the pressure in the reactor 1 and 2 with time is obviously different, indicating that the repeatability of the MH evaluation device is low. Therefore, the experimental device is improved as shown in Fig. 6.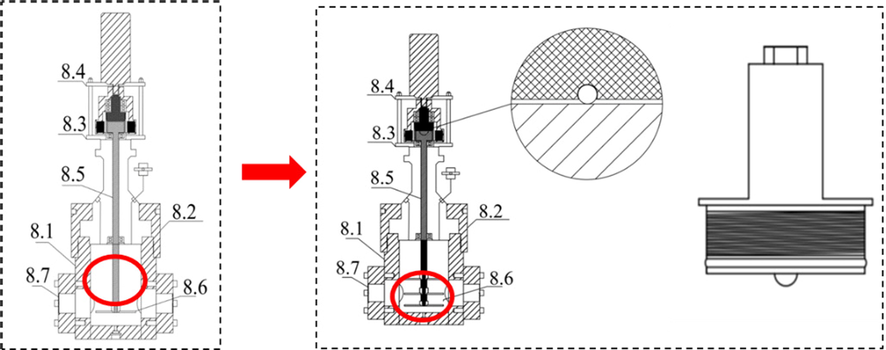
Schematic diagram of the experimental device before and after improvement.
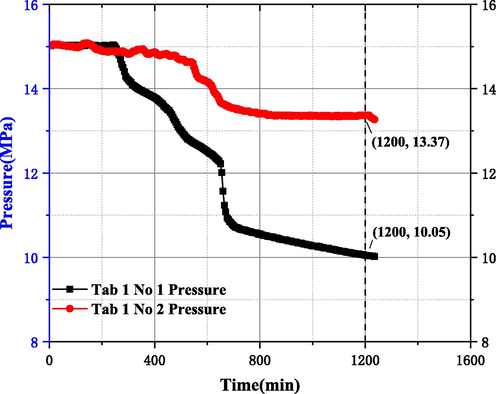
Experimental results of reactor 1/2 before improvement.
(1) Due to the simulation of marine high-pressure environment in the kettle, in the process of filling high-pressure gas, the gas promotes the end face of the stirrer rod and the component plug to produce a large friction resistance, resulting in the problem of stirrer stall. Therefore, a steel ball with a diameter of 3 mm was added to the end face of the component plug.
(2) During the MH reaction, MH is preferentially generated at the interface between the reaction solution and the gas and at the part with larger liquid flow velocity, with the large amount of MH generated at the gas–liquid interface, the problem of stirring device stalling will occur, therefore, by adding stirring blades, the blades can break the MH solid formed at the gas–liquid interface during the rapid formation of MH, ensuring good contact between the gas and the liquid surface and increasing the experimental device accuracy and parallel controlability.
After the above improvements, the experimental apparatus was subjected to No 3–6 test experiments within Table 1, and the test results for Reactor 1/2 in both DW and SW liquid types are shown in Fig. 8. The results show that the curve of pressure variation with time in Reactor 1/2 is well fitted when DW and SW solutions are used, which indicates that the improved experimental equipment has good accuracy and parallel control, and the confidence interval of the experimental data of Reactor 1/2 is high and can be used for simulation experiments under different liquid types and experimental conditions.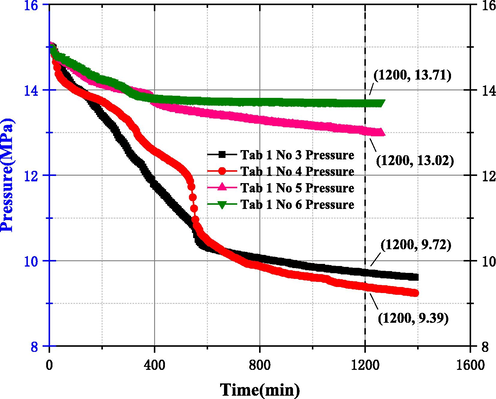
Experimental results of DW/SW in 1/2 of the improved reactor.
In addition, combining the graphs of DW/SW in Figs. 7 and 8 above and the MH morphology graphs shown in Figs. 9 and 10 below, it is clear that: (1) the salts in SW exhibit significant inhibition, with 3 wt% salts improving the inhibition performance by about 2.83 times. (2) There is no factor in DW that limits the formation of covalent bonds between water molecules and surrounding water molecules. Therefore, the density and hardness of the generated MH structure are higher, and the amount of bound methane in the formed ' ice-like structure ' is higher (Haynes et al., 2016). (3) Compared with the DW solution, the MH formed by SW has a wisps empty structure with lower strength and less MH, which is mainly because SW contains NaCl, KCl, CaCl2, etc., which increases the disorder of water and decreases the water activity, and the decrease of ordered water molecules leads to the decrease of water molecules forming “ice-like structure”. Therefore, under the same conditions, the MH formed by SW solution is less than that of DW.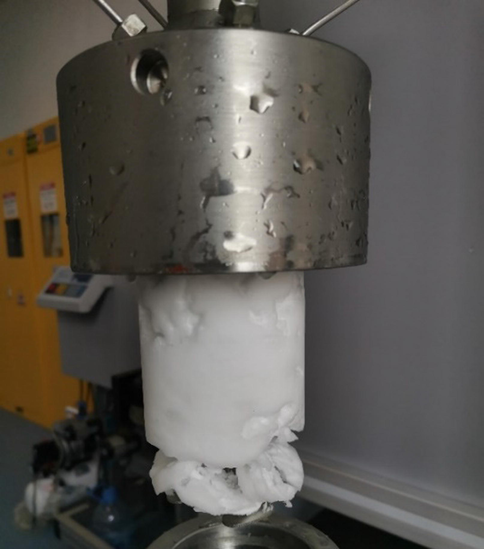
DW experimental results.
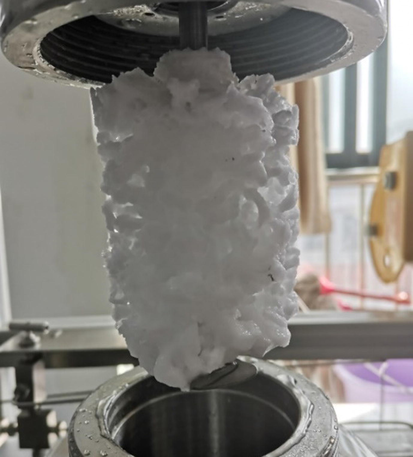
SW experimental results.
3.2 Single evaluation experiment of inhibitors
The improvement of the experimental device and the parallel control experiments in 3.1 demonstrated the good accuracy and parallel control of the experimental device, and the clarification of the inhibitor inhibition effect in a single system is a prerequisite for optimizing the inhibition system for offshore drilling. Therefore, it is crucial to investigate the experimental study of the type of inhibitor and the concentration used in a single system on the law of methane MH formation by this experimental device.
3.2.1 Inhibitor type evaluation experiment
In order to reduce the hazards of gas hydrate formation in the wellbore, throttle area, etc. during the drilling process, adding kinetic inhibitors to the drilling fluid can effectively reduce such hazards and increase operational efficiency. Unlike the thermodynamic inhibitors, which change the system's phase equilibrium conditions such as temperature and pressure to inhibit gas hydrate formation, the kinetic inhibitors do not change the system's formation conditions, but rather delay the formation time of gas hydrates during the formation process (Keshavarz et al., 2022; Kelland et al., 2006; Ke et al., 2016; Haghighi et al., 2009; Perrin et al., 2013). In order to prevent the impact of drilling fluid intrusion into hydrate formations during offshore drilling on gas hydrate stability, the effects of hydrate inhibitors A3, PAC, and CMC used in offshore gas hydrate formations and gas-bearing formations on MH formation behavior were investigated in this experiment, as shown in experimental protocols No.1 ∼ 7 within Table 2. Figs. 10 and 13 show the simulation results of MH formation after adding 1 wt% and 2 wt% of the three inhibitors A3, CMC, and PAC, respectively.
The results showed that the internal pressure of the reactor in 1 wt% A3, CMC, and PAC inhibitors decreased from the initial 15 MPa to 13.91 MPa, 12.44 MPa, and 10.21 MPa at 1200 mins, respectively, with pressure drop values of 1.09 MPa, 2.56 MPa, and 4.79 MPa, respectively. The pressure drop of A3 solution at 1 wt% for the three inhibitors was the smallest, while combined with Fig. 11 (from left to right, the MH formation diagram for 1 wt% A3, CMC and PAC inhibitors), it can be seen that the amount of MH formation was significantly less compared to DW and SW conditions, and the MH structure was relatively loose and less dense, which intuitively reflected that A3 inhibitor had better inhibition performance. This is due to the fact that during MH formation, hydroxyl and etheroxy active groups on cellulose-based inhibitor molecular chains can be adsorbed to the MH surface, forcing MH crystals to grow around the aggregates or polymer chains with a smaller radius of curvature, creating resistance to the MH cage structure and reducing the rate of MH formation.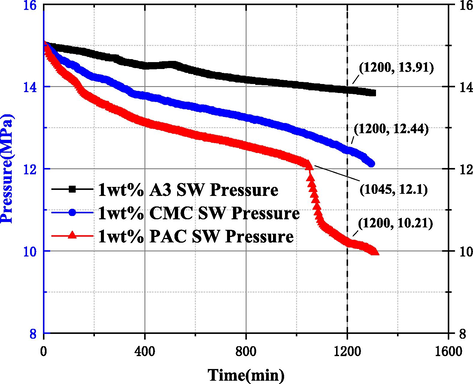
1 wt% A3, CMC, PAC inhibitor MH formation process evaluation study results.
In addition, the most methane gas is dissolved and absorbed in the PAC solution, more MH is generated, and the phenomenon of sudden pressure drop occurs at 1045 min. This is because with the increase of MH concentration in the solution, the PAC molecules will collide with MH particles, which increases the energy dissipation during the flow of the solution, resulting in the decrease of the solution flow rate (shear rate), the PAC molecules are not stretched by the fluid shear force for linear arrangement, and MH particles are not scattered by the high flow rate fluid and form MH (as in Fig. 12), which is the reason for the rapid pressure drop of PAC at 1045mins and the rapid formation of MH.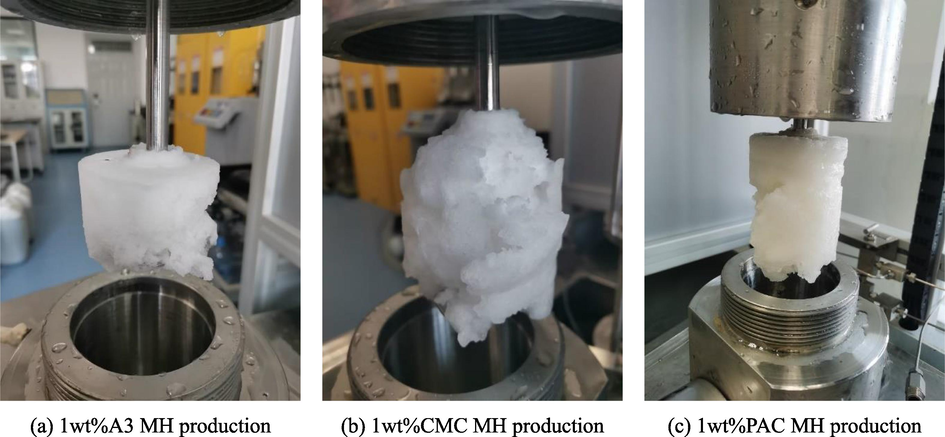
1 wt% A3, CMC, PAC inhibitor MH formation diagram.
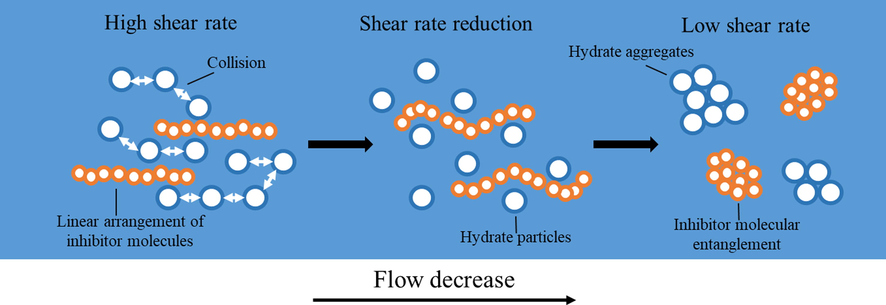
Mechanism of MH formation with inhibitor molecules decreasing with flow rate.
In the simulation results of MH formation after 2 wt% of the three inhibitors A3, PAC, and CMC shown in Fig. 13, the internal pressure of the reactor decreased from 15 MPa to 9.99 MPa, 12.28 MPa and 11.0 MPa at 20 h, with pressure drop values of 5.01 MPa, 2.72 MPa, and 4.0 MPa, respectively. Due to the presence of the polyanion effect of PAC, the higher the absolute value of the solution zeta potential, the higher the viscosity, the higher the repulsive force between MH particles and particles and between particles and polymers, therefore, an appropriate increase in the concentration of PAC use can improve the PAC MH inhibition ability (Mahmoud et al., 2021).
In addition, the pressure drop of A3 inhibitor was less than PAC and CMC inhibitors until 1045 min, but the pressure of A3 solution reactor decreased sharply from 1045 to 1200 min. After increasing the concentration of A3 and CMC used, the inhibition effect decreased, according to A.G. Iscan et al. study on cellulose-based inhibitors illustrated that the solution viscosity with the content of cellulose inhibitor increased with increasing cellulose inhibitor content in a non-linear manner (Iscan A G et al., 2007). When the concentration of the solution containing cellulose inhibitor is less than a certain concentration, the viscosity increases slowly, but when the concentration of cellulose inhibitor is greater than a certain concentration, the viscosity growth rate increases rapidly, which is similar to the reason for the formation of a large number of MH at 1 wt% of PAC, this phenomenon reflects that the use of A3 inhibitor concentration is not the greater the better.
3.2.2 Inhibitor concentrations optimization experiment
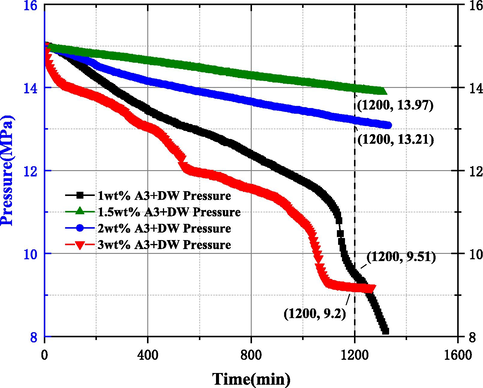
Combined with the data from the study of 3.2.1 showed that A3 inhibitor had better inhibitory ability compared with PAC and CMC, but the inhibitory ability did not increase with concentration, so it was necessary to study the study of MH formation pattern by using concentration of A3 inhibitor, and the results are shown in Figs. 14 and 15. According to Fig. 14, it can be seen that the pressure drop values were 5.49 MPa, 1.03 MPa, 1.79 MPa, and 5.8 MPa when using concentrations of 1 wt%, 1.5 wt%, 2 wt%, and 3 wt%, respectively, indicating that the A3 inhibitor in DW solution does not have a better inhibitory performance with the increase of the used concentration, and also combined with the slope of the pressure curve for different concentrations The best inhibition ability was found at the used concentration of 1.5 wt%, followed by 2 wt%, and when the used concentration increased to 3 wt%, the inhibition performance was lower than 1 wt%. The values of pressure drop in the reactor for SW, 1 wt%, 1.5 wt% and 2 wt% used in Fig. 15 are 1.37 MPa, 0.93 MPa, 0.44 MPa, and 5.01 MPa, respectively, indicating that A3 inhibitor has a similar inhibition pattern in SW and DW systems. When the concentration was 1.5 wt%, the pressure drop was only 0.44 MPa, and the dissolved methane gas in the SW system was less, so the amount of MH formation was significantly less. The pressure curve when the used concentration was increased to 2 wt% showed a good inhibition ability in the early part of the experiment start, but from 800 min to the end the pressure value started to be lower than the pure SW system, the slope of the curve increased and MH was generated rapidly.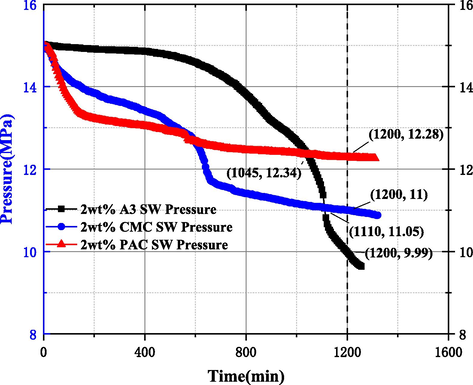
2 wt%A3, PAC, CMC inhibitor MH formation process evaluation study results.
Evaluation results of A3 concentration in DW system.
In addition, the number of gas moles consumed within the MH growth phase at different moments can directly reflect the fast and slow MH growth in the system. This experiment deals with the moles of gas consumed, which can visualize the relationship between gas dissolution and MH growth in the system. The moles number of methane gas consumed in the system,
, is calculated as shown below.
Assuming that all the dissolved methane gas is converted to MH, the number of water molecules consumed can be calculated based on the reaction equation (2) for MH formation.
The moles of gas dissolved in the DW and SW systems in Figs. 16 and 17 below also visually reflect that the higher concentration of A3 inhibitor is not better. In DW and SW systems, the molar number of gas consumption when the concentration is 1.5 wt% is 0.1455 mol and 0.0621 mol, respectively. Compared with other concentrations, the molar number of gas consumption is the smallest, indicating that the optimal concentration of A3 inhibitor is 1.5 wt% in both DW and SW systems.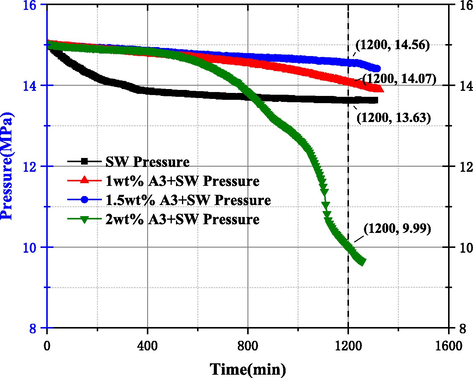
Evaluation results of A3 concentration in SW system.
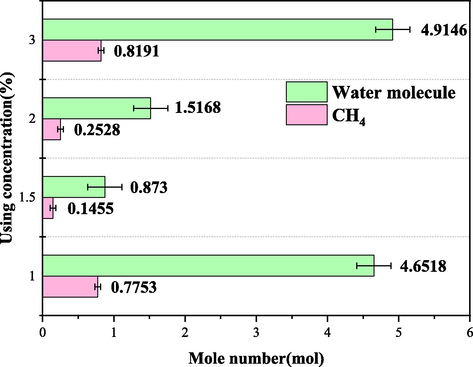
Gas consumption mole number of A3 in DW system.
3.3 Evaluation of inhibition system for drilling fluid
Through the above experimental studies on the type and concentration of inhibitor used in a single system, the best A3 inhibitor and concentration used to inhibit MH production were obtained, but the inhibition effect in clay and in the system is not yet known, so it is necessary to investigate the effect of the inhibitor in the system with clay particles and polymer.
3.3.1 Evaluation experiment of clay type
Bentonite in offshore drilling can reasonably reduce the water loss flow rate of mud, increase the viscosity value and and shear value of drilling mud, while effectively improving the drilling fluid characteristics. Compared with sodium bentonite (yellow), sodium bentonite (red) has higher FeO content and lower SiO2 content, so sodium bentonite (yellow) has better viscosity building and sediment carrying ability. In addition, the number of metal cations between the layer sheets of bentonite under the action of electric charge has some influence on gas hydrate formation, therefore, it is necessary to investigate the effect of suitable clay type on MH formation pattern (He et al., 2017; Liu et al., 2016). From the experimental curves of clay type in Fig. 18, it can be seen that from 0mins to 1200mins, the pressure drop in the reactor of SW, BSY and BSR is 1.37 MPa, 3.54 MPa and 2.06 MPa, respectively. Either in the addition of BSY or BSR, there is a significant pressure drop compared to the SW system, and the amount of MH formed is much more than the SW system (as shown in Figs. 10 and 19), which is due to the clay particles providing attachment points for MH formation, unlike the case of well-dispersed clay particles under high temperature conditions, the repulsion between clay particles is reduced in the low-temperature marine environment, while the weak Brownian motion at low temperatures also It helps to reduce the dispersion of the clay suspension, so that the clay particles become more closely in contact with each other and form a “hut” structure through the edge-edge and edge-face attraction bonds, as shown in Fig. 20, which is more favorable to the formation of MH solids (Zhao et al., 2017). In addition, the pressure drop value of BSR is much lower than that of BSY, indicating that under low temperature conditions, BSR has stronger Brownian motion and forms fewer “huts” compared to BSY, and then less MH is formed.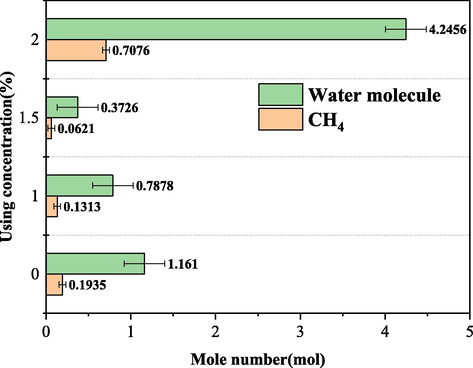
Gas consumption mole number of A3 in SW system.
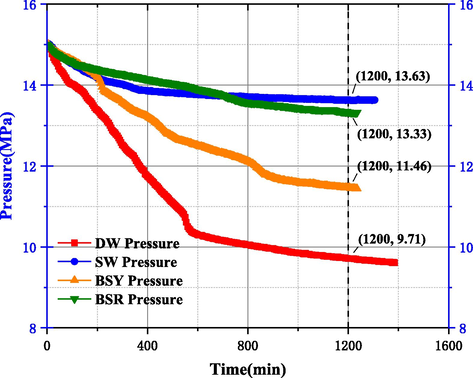
Experimental curve of clay type.
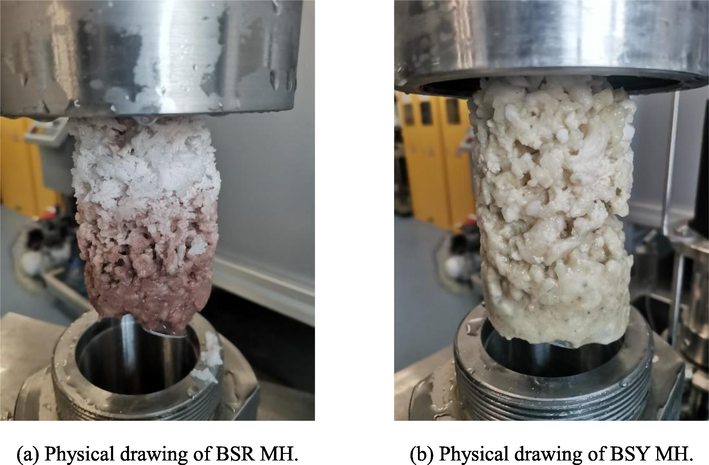
Physical diagram of MH formed by different clay types.
3.3.2 Inhibition system evaluation and optimization experiment
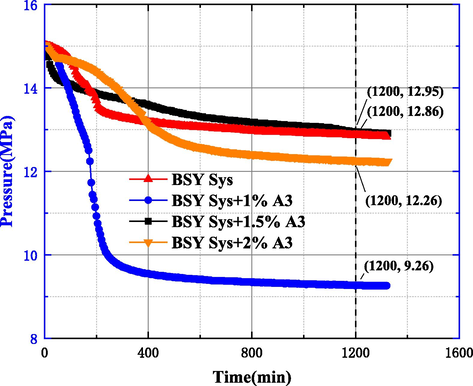
The effect of clay type on the MH formation was studied in 3.3.1, based on which No.1 BSY Sys and No.2 BSR Sys in Table 5 were constructed, and the effect of different used concentrations of A3 in the system to inhibit MH formation was investigated, as shown in Fig. 21. The results showed that the pressure drop at 1200mins was 2.14 MPa and 2.36 MPa for BSY Sys and BSR Sys, respectively, after the addition of other agents such as BDV-110S, a low-temperature flow pattern regulator. Meanwhile, after adding 1 wt%, 1.5 wt% and 2 wt% A3 to BSY Sys, the pressure drop values within the system are 5.74 MPa, 2.05 MPa and 2.74 MPa, respectively, and the pressure drop at 1 wt% is 2.8 times higher than that at 1.5 wt%, indicating that within the system, the low concentration of A3 can promote the rapid formation of MH, and the pressure drop at the optimum 1.5 wt% differs from that of BSY Sys differed by 0.09 MPa, indicating that A3 exhibited poor inhibition in the system at low temperature conditions.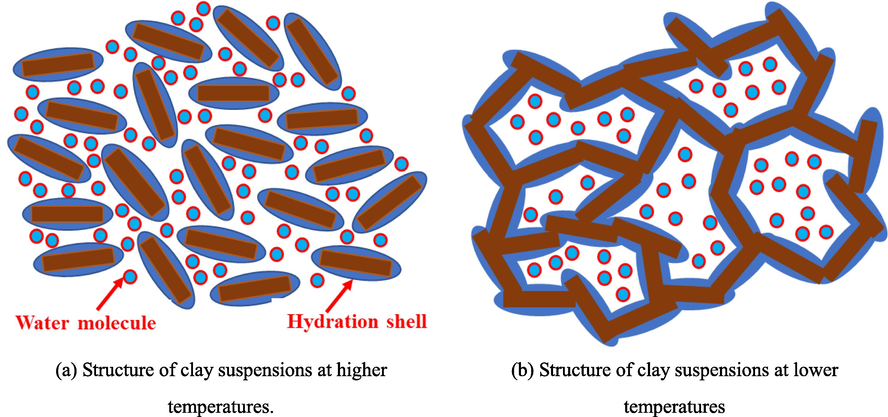
Change in structure of clay suspensions from high to low temperature.
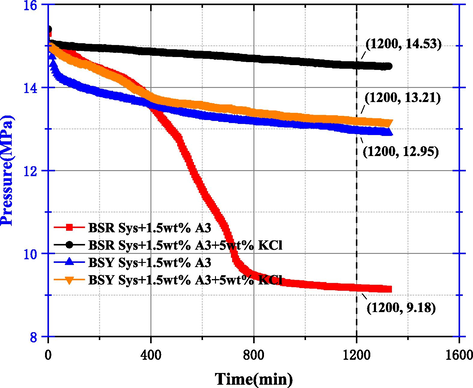
In order to optimize the system formulation, combined with the research of scholars and the use of SW slurry in the field, under the condition of ensuring the system density is not too high, taking into account the inhibitory effect of K+ on clay (Ren et al., 2022), 5 wt% KCl was added to the system, and the scheme is shown in No.6 ∼ 9 within Table 5. From the pressure curves after the addition of A3 and KCl in the system of Fig. 22, it can be seen that the pressure drop values were 2.05 MPa and 5.82 MPa for BSY Sys and BSR Sys, respectively, after the addition of 1.5 wt% A3, and combined with Fig. 24, it can be seen that A3 plays a facilitating role in BSR Sys. After the addition of KCl, the pressure drop values were 1.79 MPa and 0.47 MPa, respectively, indicating that the dissolved methane gas within the BSR Sys is less after the addition of KCl, and KCl can exert a drastic synergistic inhibition with A3 within the BSR Sys to reduce MH production, and this process can be explained based on Z. Yin et al. for the MH growth process using crystal dynamics (Yin et al., 2018). The effective electric field for the MH crystallization process is 105-106V/m (Orlowska M et al., 2009). The relationship between the surface potential Φ0 and the charge density σ0 can be calculated by Park et al. using a simulation study of the formation of gaseous MH by an external electric field and combined with Gouy-Chapman theory (Park et al., 2018).(See Fig. 25)
Pressure curve of base system and after adding A3.
Pressure curve after the addition of A3 and KCl to the system.
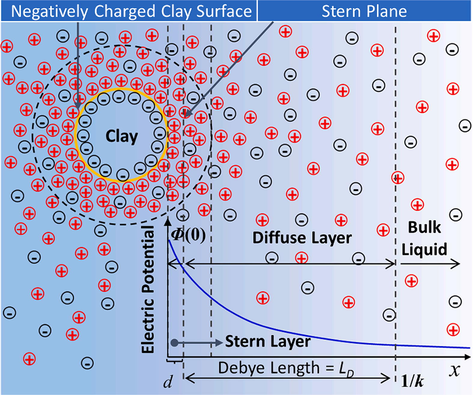
Schematic diagram of negatively charged clay surface and diffusion double layer (DDL) (Meegoda et al., 2019).
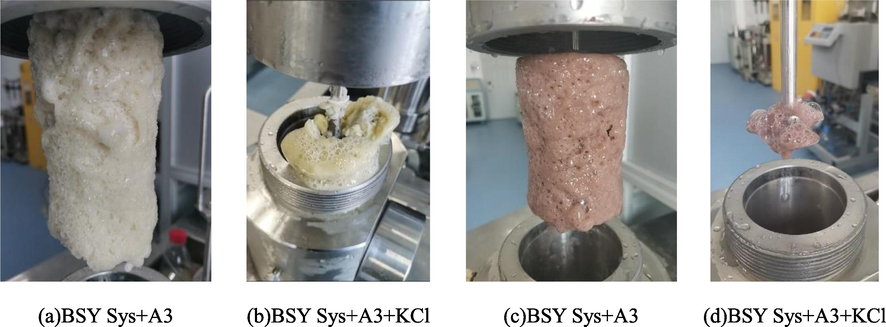
Physical diagram of MH after the addition of A3 and KCl to the system.
Where R is the general gas constant, 8.3145 J / mol · K; T is temperature, K; εr is the dielectric constant of water, which is 86.7 at 276.15 K; ε0 is the dielectric constant of free space, 8.854 × 10⁻¹²C2/J ∙ m; C0 is the electrolyte concentration, mol/m3; zi is the ion valence; F is the Faraday constant, 96485C / mol; Φ is the potential, which can be expressed by exponential decay at a given distance x.
Where, Φ0 is the surface potential, mV; x is the distance from the clay surface, m; k is the inverse Debye length, m−1; for within the system with 5 wt% KCl added, it can be defined as:
Combined with the above theoretical equation, the LD is 0.369 nm after adding 5 wt% KCl without considering the electrolyte carried by the bentonite in the system, as shown in Fig. 23 for the schematic diagram of the negatively charged clay surface and diffusion double layer (DDL). Due to the high electrolyte content within the bentonite, the LD with the addition of KCl was much greater than that without the addition of KCl after the addition of 5 wt% KCl. Combined with the study of MH nucleation process by Park et al. (Park et al., 2018), it was found that the electric field reduces the activation energy required for the nucleation of water molecules, while the nucleation of MH is promoted by the electric field and this process mainly occurs in solutions with extra DDL thickness, while the electrolyte concentration in the solution is significantly increased by the addition of KCl and the DDL thickness is compressed, leading to the weakening of the nucleation of water molecules. In addition, the nucleation process of MH is also affected by the free water in the solution (Mojid et al., 2006), and KCl also consumes the free water in the system, which shortens the nucleation process of MH, which is another important reason to reduce the production of MH. The physical picture of MH in Fig. 24 confirms this conclusion, and the MH formed in the system has a soft texture and shows a “pastry” structure.
4 Conclusions
In this paper, the evaluation study of inhibition system for drilling in marine gas-bearing and natural gas hydrate formations is carried out by a visual hydrate evaluation experimental device developed and designed independently. In order to ensure the accuracy of experimental data, the experimental device was firstly improved and tested, and different solution types and inhibitor types were evaluated and studied. On this basis, the influence of clay type on MH formation was clarified, and the best inhibitory system that can be applied in the field was determined, which provides theoretical guidance for offshore drilling, reducing operational risks and improving efficiency. The main conclusions and recommendations are as follows.
(1) The MH formation experiments of the DW solution before the improvement illustrated that the experimental device had certain defects. After the improvement of the components and stirring rod, the MH formation experiments of the DW and SW solutions illustrated that the improved experimental device could ensure the reproducibility of the experiments. Meanwhile, the MH formed by SW solution was less than that of DW solution, and the MH formed by its DW solution was dense and stronger, while the MH formed by SW solution showed wisps empty structure.
(2) Among the three inhibitors A3, CMC and PAC, A3 has the strongest ability to inhibit MH production, followed by CMC and finally PAC. hydroxyl and etheroxy active groups on the molecular chains of cellulose-based inhibitors can be adsorbed onto the MH surface, forcing MH crystals to grow around the aggregates or polymer chains with a smaller radius of curvature and reducing the MH growth rate.
(3) The inhibitory ability of A3 inhibitor does not increase with the increase of used concentration, and the study of MH formation pattern of different concentrations of A3 in DW and SW solutions found that A3 inhibitor has the best inhibitory ability at 1.5 wt%, and the moles of methane gas required to form MH in DW and SW solutions with different concentrations of A3 were calculated by combining the gas equation of state, and the moles of methane gas required to form MH in DW and SW solutions at 1.5 wt% for DW and SW consumed 0.1455 mol and 0.0621 mol of gas at 1.5 wt%, with the smallest moles of gas consumption, which intuitively reflects that A3 has the best inhibitory ability at 1.5 wt%.
(4) Through the study of the clay type on the MH formation regular revealed that the pressure drop values in the SW, BSY and BSR reactors were 1.37 MPa, 3.54 MPa and 2.06 MPa, respectively. The amount of MH formed is much more than that of the SW system when compared to the SW system with a significant pressure drop in either BSY or BSR addition. This is mainly due to the rapid formation of MH under low temperature conditions, which is accelerated by the “hut” structure of clay particles formed by edge-edge and edge-face attraction bonds.
(5) Through the study of the constructed BSY Sys and BSR Sys, after the addition of the inhibitor A3, it cannot well hinder the formation of MH, and has the ability to accelerate the formation of MH under low concentration conditions. However, after the addition of 5 % KCl, the pressure drop of BSR Sys is only 0.47 MPa.This is because the presence of the electric field reduces the activation energy of water molecules and the consumption of free water is the reason for reducing the formation of MH, indicating that A3 and KCl play a dramatic synergistic inhibitory effect in BSR Sys. The physical picture of MH confirms this conclusion, and the MH generated in the system has a fluffy texture and a “pastry” structure.
CRediT authorship contribution statement
Panyang Guo: Writing – original draft, Methodology, Investigation, Formal analysis. Jie Wang: Writing – review & editing, Conceptualization. Yunyan Tie: Investigation. Xu Luo: .
Acknowledgments
This work is financially supported by the National Natural Science Foundation of China(No: 52274028), State Key Laboratory of Petroleum Resources and Prospecting, China University of Petroleum (No: PRP/open-2205), Planned Project, Hubei Provincial Department of Science and Technology (Second Batch), (NO. 2021CFB249) & Project of Science and technology research, Education Department of Hubei Province (NO. Q20211303).
Declaration of Competing Interest
The authors declare that they have no known competing financial interests or personal relationships that could have appeared to influence the work reported in this paper.
References
- Evaluation of Egyptian bentonite and nano-bentonite as drilling mud. Egypt. J. Pet.. 2013;22(1):53-59.
- [CrossRef] [Google Scholar]
- Effect of particle size of bentonite on rheological behavior of the drilling mud. Pet. Sci. Technol.. 2011;29(21):2220-2233.
- [CrossRef] [Google Scholar]
- Synergistic effect of polymer and nanoparticles on shale hydration and swelling performance of drilling fluids. J. Pet. Sci. Eng.. 2021;205:108763
- [CrossRef] [Google Scholar]
- Synergistic effect of nanoinhibitive drilling fluid on the shale swelling performance at high temperature and high pressure. Energy Fuel. 2022;36(4):1996-2006.
- [CrossRef] [Google Scholar]
- Natural gas hydrates: myths, facts and issues. C. R. Geosci.. 2004;336(9):751-765.
- [CrossRef] [Google Scholar]
- Thermodynamics and kinetics of CO2 hydrate formation in the presence of cellulose nanocrystals with statistical treatment of data. Fluid Phase Equilib.. 2021;529:112863
- [CrossRef] [Google Scholar]
- Collett, T. S., Johnson, A., Knapp, C. C., et al., 2010. Natural gas hydrates: Energy resource potential and associated geologic hazards, AAPG Memoir 89 (Vol. 89). AAPG.
- 3D numerical simulation on drilling fluid invasion into natural gas hydrate reservoirs. Energy. 2022;241:122932
- [CrossRef] [Google Scholar]
- Numerical simulation of gas extraction performance from hydrate reservoirs using double-well systems. Energy 2022
- [CrossRef] [Google Scholar]
- Gas hydrates: Immense energy potential and environmental challenges. Springer Science & Business Media; 2011.
- Carriers for Methane Hydrate Production: Cellulose-Based Materials as a Case Study. ACS Sustain. Chem. Eng.. 2022;10(31):10119-10131.
- [CrossRef] [Google Scholar]
- Experimental and thermodynamic modelling of systems containing water and ethylene glycol: Application to flow assurance and gas processing. Fluid Phase Equilib.. 2009;276(1):24-30.
- [CrossRef] [Google Scholar]
- CRC handbook of chemistry and physics. CRC Press; 2016.
- He,S.,Xing,X.J.,2017.Analysis of deepwater drilling fluid system. Inner Mongolia Pet.Ind.6,63-64.
- Investigation on methane hydrate formation in water-based drilling fluid. Energy Fuel. 2021;35(6):5264-5270.
- [CrossRef] [Google Scholar]
- Study on the hydrate inhibition effect of nano-silica in drilling fluids. J. Nat. Gas Sci. Eng.. 2022;105:104688
- [CrossRef] [Google Scholar]
- Effects of polymers and CMC concentration on rheological and fluid loss parameters of water-based drilling fluids. Energy Sources, Part A. 2007;29(10):939-949.
- [CrossRef] [Google Scholar]
- Unusual synergy effect on methane hydrate inhibition when ionic liquid meets polymer. RSC Adv.. 2013;3(43):19920-19923.
- [CrossRef] [Google Scholar]
- Kinetic hydrate inhibitor studies for gas hydrate systems: a review of experimental equipment and test methods. Energy Fuel. 2016;30(12):10015-10028.
- [CrossRef] [Google Scholar]
- History of the development of low dosage hydrate inhibitors. Energy Fuel. 2006;20(3):825-847.
- [CrossRef] [Google Scholar]
- Thermodynamic evaluation of inhibitors for methane-hydrate formation. Fuel. 2022;324:124672
- [CrossRef] [Google Scholar]
- Experimental investigation of production behavior of methane hydrate under ethylene glycol injection in unconsolidated sediment. Energy Fuels. 2007;21(6):3388-3393.
- [CrossRef] [Google Scholar]
- An experimental study of rheological properties and stability characteristics of biochar-glycerol-water slurry fuels. Fuel Process. Technol.. 2016;153:37-42.
- [CrossRef] [Google Scholar]
- Settling behavior of fine cuttings in fiber-containing polyanionic fluids for drilling and hole cleaning application. J. Pet. Sci. Eng.. 2021;199:108337
- [CrossRef] [Google Scholar]
- Performance of water-based drilling fluids for deepwater and hydrate reservoirs: Designing and modelling studies. Pet. Sci.. 2021;18(6):1709-1728.
- [CrossRef] [Google Scholar]
- Application of the diffused double layer theory to nanobubbles. Langmuir. 2009;35(37):12100-12112.
- [CrossRef] [Google Scholar]
- Estimating the fully developed diffuse double layer thickness from the bulk electrical conductivity in clay. Appl. Clay Sci.. 2006;33(3–4):278-286.
- [CrossRef] [Google Scholar]
- Effectiveness of CO2-N2 injection for synergistic CH4 recovery and CO2 sequestration at marine gas hydrates condition. Chem. Eng. J.. 2021;420:129615
- [CrossRef] [Google Scholar]
- Controlled ice nucleation under high voltage DC electrostatic field conditions. Food Res. Int.. 2009;42(7):879-884.
- [CrossRef] [Google Scholar]
- Effect of electric field on gas hydrate nucleation kinetics: evidence for the enhanced kinetics of hydrate nucleation by negatively charged clay surfaces. Environ. Sci. Tech.. 2018;52(5):3267-3274.
- [CrossRef] [Google Scholar]
- The chemistry of low dosage clathrate hydrate inhibitors. Chem. Soc. Rev.. 2013;42(5):1996-2015.
- [CrossRef] [Google Scholar]
- Coexistence of natural gas hydrate, free gas and water in the gas hydrate system in the Shenhu Area, South China Sea. China Geology. 2020;3(2):210-220.
- [CrossRef] [Google Scholar]
- Effect of sodium montmorillonite clay on the kinetics of CH4 hydrate-implication for energy recovery. Chem. Eng. J.. 2022;437:135368
- [CrossRef] [Google Scholar]
- Roles of montmorillonite clay on the kinetics and morphology of CO2 hydrate in hydrate-based CO2 sequestration. Appl. Energy. 2023;340:120997
- [CrossRef] [Google Scholar]
- A review of numerical research on gas production from natural gas hydrates in China. J. Nat. Gas Sci. Eng. 2021
- [CrossRef] [Google Scholar]
- The status of natural gas hydrate research in China: A review. Renew. Sustain. Energy Rev.. 2014;31:778-791.
- [CrossRef] [Google Scholar]
- Performance studies of water-based drilling fluid for drilling through hydrate bearing sediments. Appl. Clay Sci.. 2018;152:211-220.
- [CrossRef] [Google Scholar]
- Imitating possible consequences of drilling through marine hydrate reservoir. Energy. 2022;239:121802
- [CrossRef] [Google Scholar]
- Temizel, C., Betancourt, D. J., Tiwari, A., et al., 2016, June. Optimization of Enhanced Coalbed Methane Recovery with CO2 Injection. In SPE Argentina Exploration and Production of Unconventional Resources Symposium. OnePetro. 10.2118/180973-MS.
- Effect of drilling fluid invasion on natural gas hydrate near-well reservoirs drilling in a horizontal well. Energies. 2021;14(21):7075.
- [CrossRef] [Google Scholar]
- Data report: Molecular and isotopic compositions of the extracted gas from China’s first offshore natural gas hydrate production test in South China Sea. Energies. 2018;11(10):2793.
- [CrossRef] [Google Scholar]
- The second natural gas hydrate production test in the South China Sea. China. Geology. 2020;3(2):197-209.
- [CrossRef] [Google Scholar]
- A review of gas hydrate growth kinetic models. Chem. Eng. J.. 2018;342:9-29.
- [CrossRef] [Google Scholar]
- Mechanism and method for controlling low-temperature rheology of water-based drilling fluids in deepwater drilling. J. Pet. Sci. Eng.. 2017;154:405-416.
- [CrossRef] [Google Scholar]


