

Translate this page into:
New method for effective identification of adulterated Camellia oil basing on Camellia oleifera-specific DNA
⁎Corresponding author at: College of Forestry, Henan Agricultural University, Zhengzhou 450002, China. zhangdangquan@163.com (Dangquan Zhang)
-
Received: ,
Accepted: ,
This article was originally published by Elsevier and was migrated to Scientific Scholar after the change of Publisher.
Abstract
Camellia oil obtained from Camellia oleifera seeds is rich in unsaturated fatty acids and unique flavors, and has become a rising high-quality edible vegetable oil in the world. However, honored as the “Oriental olive oil”, Camellia oil was widely adulterated for the situation of high price and short supply. At present, the identification of adulterated plant edible oil is mainly based on the composition and content of fatty acids. Here, the fatty acid composition and content of the main vegetable edible oils were determined. It is found that the fatty acid composition and content are susceptible to the change of the origin, variety and climate of the raw materials, and adulterated oils could even be made extremely similar to Camellia oil by the target combination of fatty acid content, therefore it is difficult to accurately identify the adulteration of Camellia oil through the composition and content determination of fatty acids. Camellia oleifera DNA was used as the breakthrough point for adulteration identification. Basing on the EST library and transcriptome data of Camellia oleifera, 116 candidate specific DNAs were screened out by bioinformatics, then the optimized methods of trace DNA extraction in Camellia oil were established. Further, three specific Camellia oleifera DNAs that could only be PCR amplified using Camellia oil- extracted DNA as template were finally screened out, which were confirmed by exclusive PCR amplifications using DNAs of other edible oils as templates. One of the specific DNAs was used to make the concentration regression curves of trace DNA by qPCR (Quantitative real-time PCR). The computational model was successively established between the adulteration ratio and the Ct value of the qPCR by adulteration imitation of different proportions of Camellia oil. Finally, a complete identification system of Camellia oil adulteration was firstly established basing on the specific DNA of Camellia oleifera, and it may provide a new idea and method for identification of adulterated Camellia oil.
Keywords
Camellia oil
Specific DNA
Adulteration identification
Camellia oleifera
Fatty acids

1 Introduction
Camellia oil is the vegetable oil obtained from Camellia oleifera seeds, and is a kind of edible tree-bearing oil with high quality originated from China. C. oleifera has been widely cultivated in more than 10 provinces in South China. Some Asian countries such as Vietnam have also started cultivating C. oleifera widely in recent years. The content of unsaturated fatty acids in Camellia oil is over 85% fromdata prepared by Yang et al. (2016) and Ma et al. (2011), Shamsudin et al. (2017), Rahman et al. (2017), Khan et al. (2017). Camellia oil is one of edible high-quality oils recommended by FAO. It’s known as oriental olive oil because its fatty acid composition is extremely similar to olive oil. Camellia oil also contains polyphenols, sasanquasaponin and other bioactive substances from data prepared by Ye et al. (2014), Sukor et al. (2017), Basheer et al. (2017), Razali and Said, (2017) . Long-term intake of Camellia oil can help to cure cardiovascular and cerebrovascular diseases from data prepared by Bumrungpert et al. (2016), reduce the level of cholesterol, and protect the liver from data prepared by Cheng et al. (2015), Ghafar et al. (2017), etc. In addition, through deep processing technology, Camellia oil can also be used as a base oil for advanced natural skin care cosmetics from data prepared by Liu et al. (2012), Hassan et al. (2017), Ismail and Hanafiah, (2017).
In recent years, with the improvement of people's living standard, more and more people pursue healthy diet. The increasing demand of Camellia oil results in rising price. At the same time, the adulteration of Camellia oil becomes more and more serious in China. Over the years, scholarsalways pursued the methods of detecting and identifying edible oil adulteration, such as chromatography was used by Ma et al. (2016), Zhang et al. (2014), Christopoulou et al. (2004), Zhang et al. (2016); Xu et al. (2014) used nuclear magnetic resonance spectroscopy; spectroscopy was used by Farley et al. (2017), Tan et al. (2017), Biswas et al. (2016), Souza et al. (2015), Yuan et al. (2013); Wu et al. (2004) used atomic mass spectrometry and Vietina et al. (2013) used dissolved conversion curve . All the above methods are based on the chemical constituents of edible vegetable oils, such as fatty acids and flavor compounds. However, the content and composition of these chemical constituents will change accompanied with the origin, variety and growth condition of the raw materials. Therefore, it’s very difficult to form the unique fatty acid characteristics of Camellia oil, resulting in inability to accurately identify whether it is adulterated and what percentage it is.
With the development of gene and genomics technology, the method basing on specific DNA is adopted to detect and identify the adulteration of edible vegetable oil according to Scollo, et al. (2016), Halim and Phang, (2017), Halim et al. (2017), Aziz and Hanafiah, (2017). Different oil plants contain different specific DNA with high genetic stability. This method can effectively avoid the fault of composition change of fatty acids and other components in edible vegetable oil due to changes of external factors in traditional detection methods.
However, there are some difficulties in the adulteration identification of Camellia oil basing on the specific DNA. Although there is a method of extracting DNA from olive oil according to Raieta et al. (2015), the preparation process of olive oil and Camellia oil is obviously different. Olive oil is extracted by pressing berries, with fewer steps and lower processing temperatures, which will result in less DNA damage during oil production. Camellia oil is a fat-soluble substance extracted from seeds. After the complex refining such decolorization, deodorization at high temperature, the content of C. oleifera DNA in Camellia oil is very low and easy to degrade. Therefore, it is more difficult to extract DNA from Camellia oil. Moreover, the genetic background of C. oleifera is complex and there is few genome data, which limits the search for specific DNA. Therefore, an effective method of extracting DNA from Camellia oil and an effective screening of C. oleifera specific DNAs are the basis of identifying adulterated Camellia oil basing on specific DNA. In this paper, according to EST Library and transcriptome of C. oleifera, the specific C. oleifera DNAs that could only be amplified using Camellia oil- extracted DNA as template were finally screened out, which were confirmed by exclusive PCR amplifications using DNAs of other edible oils as templates. Finally, a complete identification system of Camellia oil adulteration was established basing on C. oleifera-specific DNA by qPCR (Quantitative real-time PCR).
2 Materials and methods
2.1 Materials and pretreatment
Vegetable oil samples were provided by Hunan institute of food quality supervision and research, China, then kept at 4 °C (Table 1).
Vegetable oil
Number
Brand
Level
Origin
Camellia oil
DSX01
Dasanxiang
Pressing level I
China
XTY02
Xintaiyu
Pressing level I
China
F313
Oil in bulk
China
GC3171
Oil in bulk
China
WJ0079
Oil in bulk
China
ZZ003
Oil in bulk
Crude oil
China
2016061301
Jinhong
Pressing
China
2016061302
Jinhong
Pressing
China
2016061306
Taiyu
Pressing level I
China
2016061317
Jiajia
Pressing
China
20160305
Shengyuan
Pressing level II
China
Palm oil
2016061327
Oil in bulk
China
Rapeseed oil
20160301
Yingcheng
Pressing level I
China
20160302
Guitaitai
Pressing
China
20160410
Daodaoquan
Pressing level III
China
20160411
Yingcheng
Pressing level I
China
20160415
Oil in bulk
China
2016061308
Shengyuan
Pressing
China
2016061319
Xiyouduo
Pressing
China
Olive oil
20160017
AGRIC
Extra virgin
Greece
20160015
Olivoila
Blend
China
20160021
BELLINA
Extra virgin
Spain
Soybean oil
20160402
Jinlongyu
Leaching grade I
China
2016061322
Meishishang
Leaching grade I
China
20160306
Hongsui
Pressing
China
20160403
Wuhu
Leaching grade I
China
Peanut oil
20160412
Luhua
Pressing level I
China
20160303
Huoniao
Pressing level I
China
20160413
Jinlongyu
Pressing level I
China
20160416
Oil in bulk
China
Maize oil
20160408
Changshouhua
Pressing level I
China
20160409
Runzhijia
Pressing level I
China
2016061304
Panzhongcan
Pressing level I
China
2016061314
Xiwang
Pressing
China
Sunflower seed oil
20160405
Daodaoquan
Pressing level I
China
20160304
Beitaiyupin
Pressing
China
20160406
Duoli
Pressing level I
China
20160407
Runzhijia
Leaching grade I
China
Plant tissue samples: oil palm fruits, rape seeds, the seedlings of Olea europaea, soybeans, peanuts, maize, sunflower seeds and leaves of C. oleifera.
Leaves of C. oleifera were provided by C. oleifera resources garden in Central South University of Forestry and Technology and Hunan institute of food quality supervision and research, China. The other materials were purchased in the market. The plant tissue samples were washed in deionized water and stored in the ultra-low temperature refrigerator.
2.2 Methods
2.2.1 Bioinformatics analysis of characteristics of C. Oleifera DNA
A large number of new genes (more than 2000) were revealed by the C. oleifera EST library and transcriptome obtained from previous studies. These new genes were not homologous with the existing DNAs in GenBank.
NCBI CDD was used to analyze the conserved domains in the amino acid sequence, ClustalX was used for amino acid multi-sequence alignment, and MAGE5 was used to construct phylogenetic trees. Through the systematic bioinformatics analysis of the new genes, only single-copy genes without obvious hairpin structure were selected as candidates of C. oleifera specific DNAs.
2.2.2 Design of specific primers for C. oleifera-specific DNA
According to the DNA sequence characteristics of the new C. oleifera gene selected via bioinformatics analysis, the specific primers were designed according to the conserved DNA sequence. In order to avoid multiple sequences amplification caused by introns, the forward and reverse primers of these new genes were designed in the same exon. Primers were designed by Primer Premier 5.0. The target lengths of amplified fragment were about 200–500 bp.
2.2.3 DNA extraction of Camellia oil
Camellia oil is a fat-soluble sample with a low content of DNA. It is quite difficult to obtain enough DNA by a conventional DNA extraction. Thus, DNA in Camellia oil was extracted using the modified SDS, CTAB and 2× CTAB methods, and the concentration and purity of extracted DNA were determined by nucleic acid protein analyzer (BIO-RAD SmartSpec Plus Spectrophotometer). The extracting efficiency of three methods was compared to select a suitable method of extracting DNA from Camellia oil.
2.2.3.1 Enriching DNA in Camellia oil
The content of DNA in Camellia oil is extremely low, and it is very difficult to extract DNA directly, so DNA enrichment must be carried out firstly. After several optimization, the enriching method of DNA in Camellia oil was established as followed: 1 ml Camellia oil and 400 μl TE buffer (10 mM Tris-HCl (pH 8.0), 1 mM EDTA (pH 8.0)) were added in a 2 ml tube, centrifuged at 13,000 rpm for 3 min, and the supernatant oil was removed, then 1 ml Camellia oil was again added into the same tube. The above steps were repeated 20 times to enrich DNA of 20 ml Camellia oil into 300–400 μl aqueous phase. Each Camellia oil was enriched simultaneously in two tubes, then mixed to form the final DNA-enriched sample.
2.2.3.2 DNA extracting methods for DNA-enriched sample
-
Modified SDS method: 100 μl 20% SDS was added to the DNA-enriched sample of Camellia oil and mixed thoroughly. The mixture was heated at 65 °C for 30 min and mixed by inverting every 5 min. Then 200 μl 3 M NaAc was added and mixed, centrifuged at 15,000 rpm, 4 °C for 10 min. The supernatant was taken and added the same volume of chloroform/isoamyl alcohol (24: 1) to remove proteins once (it could be repeated again if obvious impurities existed.); Add isopropyl alcohol to precipitate DNA at -20 °C for 1 h. The precipitation was washed using 70% ethanol once or twice, after dried, then dissolved in 50 μl TE.
-
Modified CTAB method: 500 μl CTAB extraction buffer (2% CTAB, 0.1 M Tris-HCl (pH 8.0), 20 mM EDTA(pH 8.0), 1.4 M NaCl, 0.2% β-Mercaptoethanol) was added to the tube with the DNA-enriched sample, after mixed, kept in 65 °C water bath for 30–60 min, gently shaken every 10 min. Add the same volume of chloroform/isoamyl alcohol (24:1), mix by inverting, then centrifuge at 12,000 rpm for 10 min, which will be repeated once or twice depending on the impurity volume. Take the supernatant, add the double volume of anhydrous ethanol, then centrifuge at 12,000 rpm for 10 min after precipitated at −20 °C for 1 h. Add 350 μl TE to resuspend the precipitate, add 1/10 volume of 3 mol/L NaAc and the double volume of pre-cooled ethanol to precipitate DNA at −20 °C for 1 h. Remove the supernatant after centrifugation at 12,000 rpm for 10 min, and then the precipitate was washed with 200 μl 70% ethanol twice. After dried in ventilation cabinet at room temperature for about 40 min, the precipitate was dissolved in 50 μl TE.
-
Secondary CTAB method: 750 μl 65 °C-preheated 10 × CTAB buffer (10% CTAB, 75 mM Tris-HCl (pH 8.0), 15 mM EDTA (pH 8.0), 1 M NaCl, 1% β-Mercaptoethanol) was added to 600 μl DNA-enriched sample, then incubated at 65 °C for 30–60 min with inverting mixing every 10 min. Add 750 μl chloroform/isoamyl alcohol (24:1), then centrifuge at 14,000 g for 10 min after mixing by inverting for 5 min. Repeat this step once. Add 1.5 volumes of CTAB sedimentation buffer (1% CTAB, 50 mM Tris-HCl (pH 8.0), 10 mM EDTA (pH8.0)) to the supernatant, precipitate for 10 min after mixing, then centrifuge at 14,000 g for 20 min. After removing supernatant, the precipitate was dried in room temperature for 15–30 min, which followed by washing with 70% ethanol. The precipitate was dissolved in 50 μl TE finally.
2.2.4 Primers screening for specific PCR amplification
Basing on rules of stable and specific amplification, the candidate primers were screened by PCR using enriched DNAs of five Camellia oil as templates. Because the DNA content in Camellia oil is low, an optimized PCR system was developed.
PCR system (10 μl): 5 μl 2×EasyTaq PCR SuperMix (+dye) (purchased from Beijing Transgen Biotechnology Co., Ltd.), 0.5 μl positive primers (10 μM), 0.5 μl reverse primers (10 μM), 1 μl template DNA, 3 μl ultra-pure water.
PCR program (touch-down PCR): pre–degeneration (94 °C/3 min), followed by 35 cycles: denaturation (94 °C/30 s), annealing (initial 65 °C/30 s, temperature reduced by 2 °C per 5 cycles), extension (72 °C/45 s). Finally keep at 72 °C for 10 min.
The above PCR program was completed by the BIO-RAD S1000™ Thermal Cycler. Gel imaging system was BIO-RAD Gel Doc™ XR+ Gel Documentation System.
2.2.5 Exclusive screening of candidate Camellia oil DNA-specific primers
In order to ensure that these screened specific primers can only be PCR amplified specifically in Camellia oil DNA, it is necessary to perform exclusive PCR screening of these screened primers using DNAs from edible vegetable oils to avoid false positive amplification due to the possible gene similarity. First, basing on unique DNA sequence of other seven oil plants (rape, oil palm, olive, sunflower seed, peanut, soybean, maize), seven pairs of primers were designed correspondingly, which were used to verify if the DNAs were successfully extracted from these seven vegetable oils. This will avoid false negativity. The candidate Camellia oil DNA-specific primers were used for exclusive amplification, and only primers with no amplified bands in DNAs of other seven oil plants were screened out finally.
The PCR system refers to the PCR system in section “Primers screening for specific PCR amplification”. PCR program (touch-down PCR): pre–degeneration (94 °C/3 min), followed by 35 cycles: denaturation (94 °C/30 s), annealing (initial 66 °C/30 s, temperature reduced by 2 °C per 5 cycles), extension (72 °C/45 s), finally keep at 72 °C for 10 min.
2.2.6 Establishment of qPCR system and regression curve
Basing on the DNA sequence of PCR products by Camellia oil DNA-specific primers, the corresponding qPCR primers and probes (TaqMan method) were designed, which synthesized by Nanjing Genscript Biotechnology Co. Ltd. A stable and reliable qPCR system was established by optimizing the reaction system and cycling condition using gradient-diluted Camellia oil DNA as templates. On the basis of this, the regression curves of the qPCR results were established using Camellia oil DNA with certain gradient concentrations (100%, 10%, 1%, 0.1%, and 0.01%).
qPCR system (25 μl): 12.5 μl Premix Ex Taq (Probe qPCR) (purchased from Takara Biomedical Technology (Beijing) Co., Ltd.), 1 μl primers (10 μM) (positive and reverse primer were 0.5 μl, respectively), 1 μl probe (10 mM), 1 μl template DNA, 8.5 μl ultra-pure water.
qPCR program: pre–degeneration (95 °C/30 s), followed by 60 cycles: denaturation (95 °C/5 s), annealing (60 °C/30 s). Fluorescence detection is performed after each end of the annealing process.
The above qPCR program was performed by the BIO-RAD CFX96 Real-Time PCR Detection System.
2.2.7 Identification of simulated Camellia oil adulteration basing on specific DNA
In order to simulate the adulteration of Camellia oil, the DNA of crude oil from Camellia seeds was diluted according to the gradients of 20%, 40%, 60%, 80% and 100%. By above qPCR system and program, the gradient samples were amplified to make qPCR curve.
The qPCR system is same with the section “Establishment of qPCR system and regression curve”. The qPCR program is almost same with the section “Establishment of qPCR system and regression curve” except that the number of cycles was reduced to 45.
2.2.8 Fatty acid composition of edible oils by GC
The fatty acid composition of Camellia oil and other seven vegetable oils (palm oil, rapeseed oil, olive oil, soybean oil, peanut oil, maize oil, and sunflower seed oil) were determined by GC analysis. 0.5–1 g sample of each oil was add dissolved in 2 ml n-hexane, then was methyl-esterified by adding 2 mol/L potassium hydroxide methanol for 30 min. After centrifugation at 4500 r/min for 5 min, transfer the upper ester solution to a grinding glass bottle. The standards are 37 fatty acid methyl esters from NU-CHEK GLC37 (NU-CHEK PREP, Inc. USA).
GC methods: gas chromatograph was GC-2010 (SHIMADZU, Japan) and the detector was FID. The chromatographic column was CD-2560 (100 m × 0.25 mm × 0.20 μm). The temperature of inlet and detector were 250 °C. The column temperature started at 40 °C for 5 min, heated up to 175 °C at 10 °C/min, held at 175 °C for 10 min, heated up to 210 °C at 5 °C/min, kept for 20 min, heated up to 230 °C at 5 °C/min, and held for 15.5 min. Split ratio was 50:1. Carrier gas velocity: hydrogen: 40 ml/min, tail blowing: 30 ml/min, air: 400 ml/min.
3 Results
3.1 Fatty acid composition overlapping limits the accurate adulteration identification of Camellia oil
The Camellia oil and other seven vegetable oils were analyzed by GC (Fig. 1) and their fatty acid compositions were compared (Table 2). The content order of fatty acids in palm oil from high to low is palmitic acid (45.137%), oleic acid (39.734%) and linoleic acid (8.742%). The main fatty acids of rapeseed oil are oleic acid (65.283%), linoleic acid (19.531%) and linolenic acid (5.748%). Most of the fatty acids in olive oil are oleic acid (76.129%), palmitic acid (11.713%) and linoleic acid (6.950%). The fatty acid composition of soybean oil is linoleic acid (54.580%), oleic acid (23.471%), palmitic acid (10.673%) and other fatty acids. The rich fatty acids in peanut oil were oleic acid (43.526%), linoleic acid (36.749%) and palmitic acid (10.711%). The arachidic acid (1.257%) and behenic acid (2.210%) in peanut oil are higher than that of other vegetable oils. The main fatty acids in maize oil are linoleic acid (54.032%), oleic acid (30.332%) and palmitic acid (12.202%). Most of the fatty acids in sunflower seed oil are linoleic acid (57.545%), oleic acid (30.220%) and palmitic acid (6.134%). The fatty acid composition of Camellia oil is oleic acid (80.150%), palmitic acid (8.432%), linoleic acid (8.391%) and other fatty acids. Note: ND represents that content is less than 0.05%.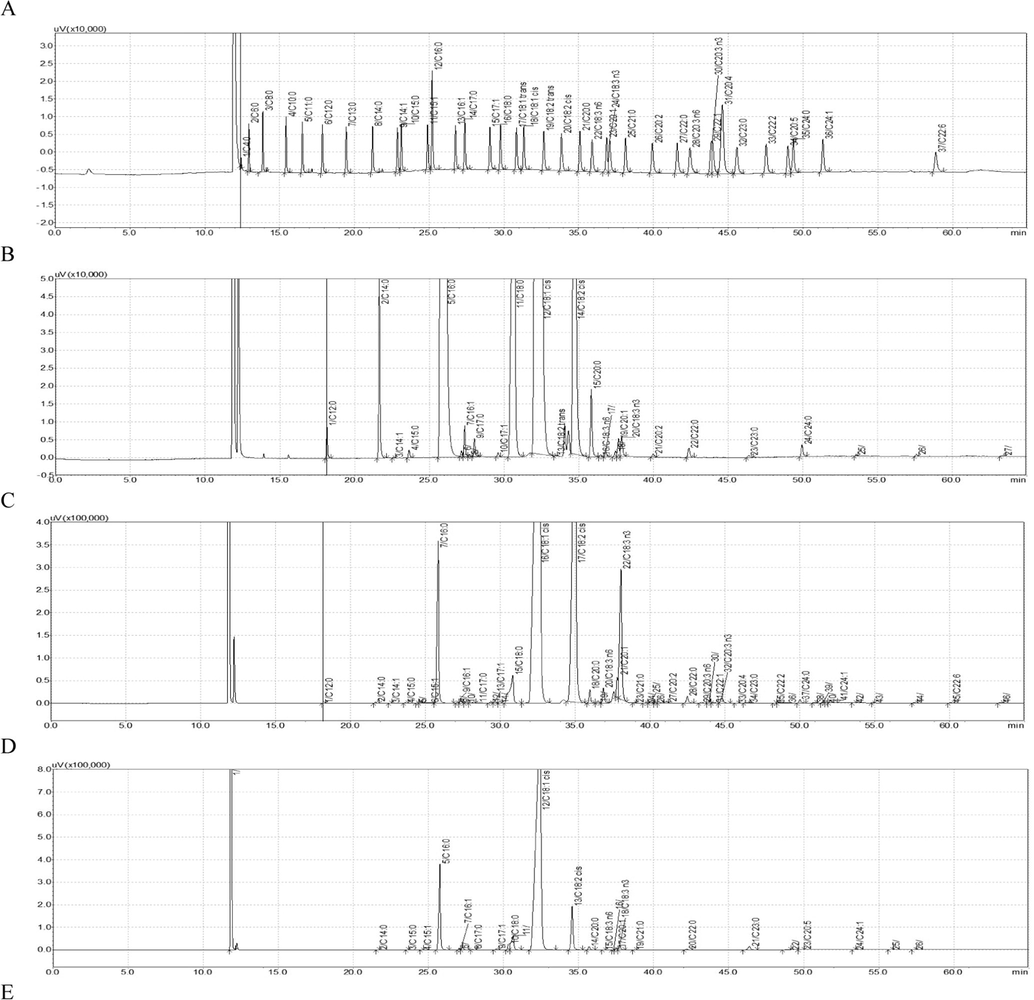
GC diagram of fatty acid composition of eight edible vegetable oils (A: standard, B: palm oil, C: rapeseed oil, D: olive oil, E: soybean oil, F: peanut oil, G: maize oil, H: sunflower seed oil, I: Camellia oil).
GC diagram of fatty acid composition of eight edible vegetable oils (A: standard, B: palm oil, C: rapeseed oil, D: olive oil, E: soybean oil, F: peanut oil, G: maize oil, H: sunflower seed oil, I: Camellia oil).
Vegetable oil
Palmitic acid
Stearic acid
Oleic acid
Linoleic acid
Linolenic acid
Arachidonic acid
Behenic acid
Palm oil
45.137
4.395
39.734
8.742
0.148
0.338
0.056
Rapeseed oil
4.995 ± 1.534
1.964 ± 0.192
65.283 ± 8.539
19.531 ± 6.506
5.748 ± 3.405
0.490 ± 0.099
0.282 ± 0.035
Olive oil
11.713 ± 1.075
2.165 ± 0.486
76.129 ± 3.664
6.950 ± 2.829
0.636 ± 0.061
0.367 ± 0.020
0.101 ± 0.008
Soybean oil
10.673 ± 0.323
3.799 ± 0.389
23.471 ± 0.793
54.580 ± 0.973
5.873 ± 0.686
0.302 ± 0.013
0.346 ± 0.006
Peanut oil
10.711 ± 0.671
3.261 ± 0.501
43.526 ± 3.072
36.749 ± 2.590
0.904 ± 0.554
1.257 ± 0.164
2.120 ± 0.153
Maize oil
12.202 ± 0.654
1.590 ± 0.118
30.332 ± 2.379
54.032 ± 3.203
0.849 ± 0.681
0.332 ± 0.044
0.104 ± 0.026
Sunflower Seed oil
6.134 ± 0.330
2.915 ± 0.118
30.220 ± 7.508
57.545 ± 10.704
1.720 ± 2.905
0.222 ± 0.084
0.503 ± 0.100
Camellia oil
8.432 ± 0.393
1.895 ± 0.134
80.150 ± 0.316
8.391 ± 0.391
0.272 ± 0.195
ND
ND
From the composition point of view, there is not significant different between the fatty acid of Camellia oil and other vegetable oil, especially the oleic acid of Camellia oil is close to that of olive oil, and the content of palmitic acid of Camellia oil is as low as that of rapeseed oil and sunflower seed oil. Therefore, several kinds of oils can be mixed in a certain proportion to achieve similar fatty acid composition as Camellia oil. In the same way, flavor substances can be added to mixed oil so that the flavor is similar with Camellia oil. Hence, it is unable to accurately identify whether Camellia oil is adulterated depending only on the composition of fatty acids and flavor substances to determine.
3.2 Extraction of trace DNA from Camellia oil
DNA samples (10 μl) extracted by three methods were added into 1990 μl TE, and their concentrations and purities were determined by the nucleic acid protein analyzer.
It was observed that the modified SDS method has better effect extracting DNA from Camellia oil than other methods (Table 3). Moreover, the modified SDS method also has the advantages of short extraction time, small reagent toxicity and simple operation. Therefore, the modified SDS method is more suitable to extract Camellia oil DNA.
Methods
Samples
Average value OD260
Average value OD280
Purity of DNA
Concentration of DNA (ng/µl)
Modified SDS
F313
0.014
0.009
1.56
0.70
GC3171
0.009
0.006
1.50
0.45
QW1546
0.010
0.006
1.67
0.50
Modified CTAB
F313
0.005
0.005
1
0.25
GC3171
0.004
0.004
1
0.20
QW1546
0.014
0.014
1
0.70
Secondary CTAB
F313
0.021
0.018
1.17
1.05
GC3171
0.027
0.025
1.08
1.35
QW1546
0.013
0.011
1.18
0.65
3.3 Screening of specific primers for Camellia oleifera-specific DNA
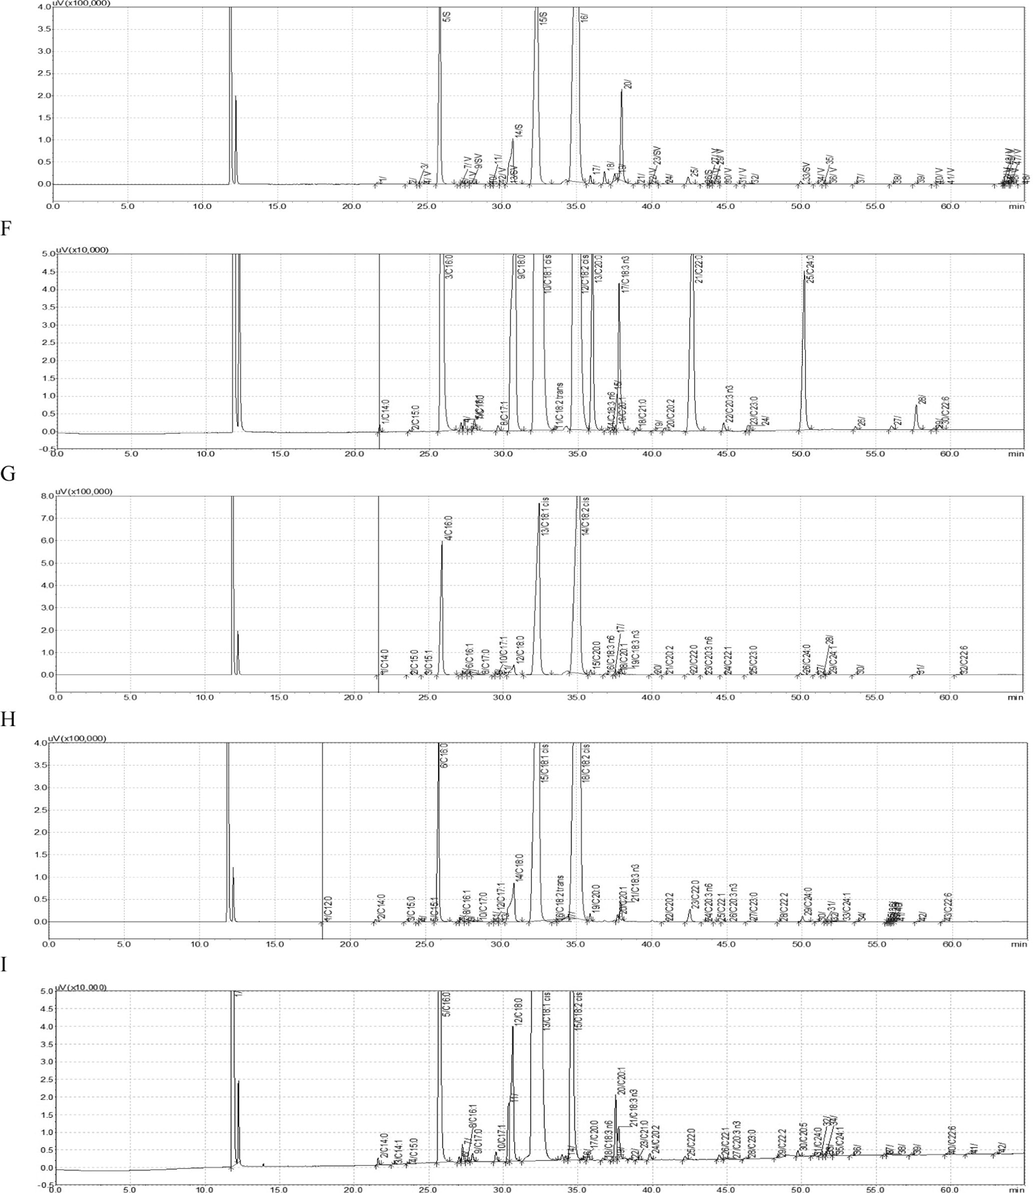
According to the C. oleifera EST library, 121 target genes without homology with the existing DNAs in GenBank were screened, and only 116 pairs of primers were successfully designed, which were synthesized by Beijing Genomics Institute. Each pair of primers was determined by 5 DNAs from different Camellia oil, which was positively controlled by DNA from C. oleifera leaf. Finally, only 12 pairs of primers were successfully screened out (Table 4) (Fig. 2).
Primer name
Sequence
124
124F (TCCTAGCACTAGCCCTATTTG), 124R (CTCCTCTTCCCTCATCTCTC)
142
142F (AATCCTACCACTAGCCCTCT), 142R (CTTCTCCTCTTCCCTCATCT)
413
413F (TAGCCCTCTTTGCCCTGATC), 413R (CATTTTCTCCAACTTGTCGC)
420
420F (GCACTAGCCCTCTTTGCCC), 420R (TCCTCTTCCCTCATCTCTCCC)
435
435F (TCAGCCAAACCTCCGCCTT), 435R (TCTCCCCTCTTCTCTCCCTCCT)
494
494F (TCAGCCAAACCTCCGCCTT), 494R (TCCCCTCTTCTCTCCCTCCTG)
908
908F (AATCCTAGCACTAGCCCTCT), 908R (CTCCTGTTCCCTCATCTCTC)
948
948F (AATCCTAGCACTAGCCCTCT), 948R (CTCCTCTTCCCTCATCTCTC)
954
954F (TCCTAGCACTAGCCCTCTTTG), 954R (GGCAGTCCTGGTCCATTTTC)
989
989F (GTACTAGCCCTCTTTGCCCT), 989R (CCTCTTCCCTCATCTCTCCC)
1201
1201F (TCCTAGCACTAGCCCTCTTTG), 1201R (GTCCTGGTCCATTTTCTCCA)
1214
1214F (AATCCTAGCACTAGCCCTCT), 1214R (CTCCTCTTCCCTCATCTCTC)
PCR results by 12 pairs of specific primers (A: primer 124, B: primer 142, C: primer 413, D: primer 420, E: primer 435, F: primer 494, G: primer 908, H: primer 948, I: primer 954, J: primer 989, K: primer 1201, L: primer 1214). Note: In each electrophoretic pattern, 1 to 5 are DNA from 5 different Camellia oil (DSX01, XTY02, WJ0079, F313, GC3171), respectively. 6 is DNA from C. oleifera leaf. M represents DNA Marker.
3.4 Exclusive screening of candidate Camellia oil DNA-specific primers
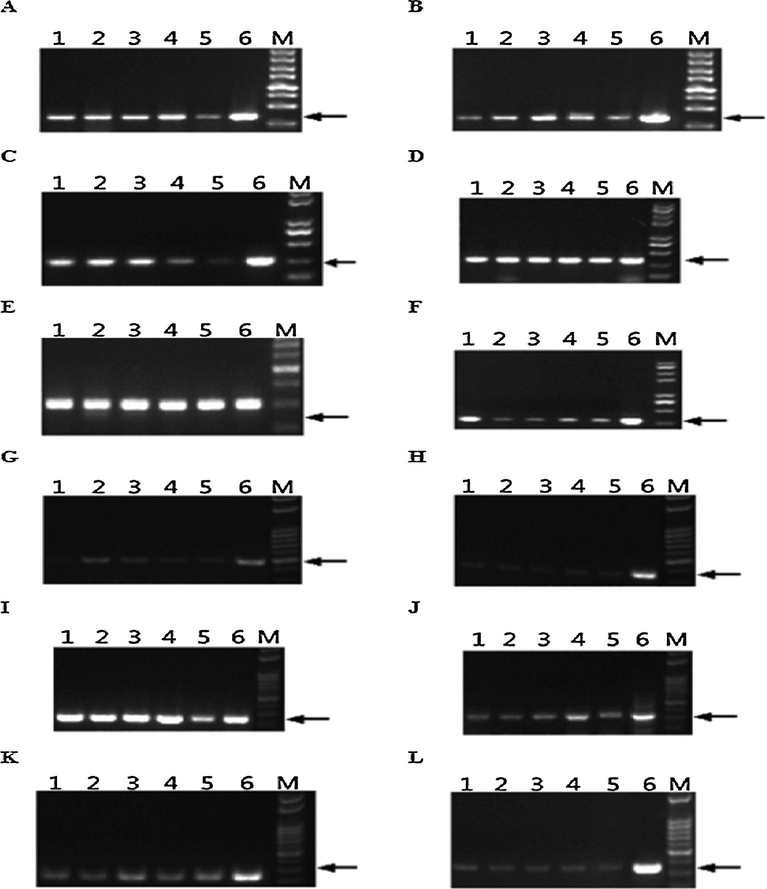
DNAs of seven oil plants (oil palm, rape, olive, soybean, peanut, maize, sunflower) were extracted by the modified SDS method. Seven pairs of primers were designed according to unique CDS sequences of these seven oil plants to verify if their DNAs were successfully extracted (Table 5). It was observed that DNA of each oil plant was extracted successfully (Fig. 3), avoiding false negativity during primer exclusive screening. It was showed that only 3 pairs of primers can bring specific DNA fragments by using Camellia oil DNA as template, but cannot bring any fragment by using DNAs of seven vegetable oils as templates (Fig. 4). Therefore, only 3 pairs of Camellia oil DNA-specific primers were selected by exclusive screening.
Plant/tissue used
Primer
Sequence
Oil palm/fruit
YZ-F
AATGCAAGGAGTACGAGTCA
YZ-R
TTTAGAAGGGTAGCAGGTCA
Rape/seed
YZ-F
GATGACGCTGCTTTTTTCTC
YZ-R
TTCTCACGCCTCTGTAATGC
Olive/leaf
YGL-F
CATTGGACGGTTCTTTGGCG
YGL-R
TTTGGAGGTCTTGGGTGGGG
Soybean/seed
DD-F
CAAAACACAGGGCAGATTA
DD-R
AGGTGCTTAGTTGGTAGGA
Peanut/seed
HS-F
GAAAACGAAAAATGAGGACG
HS-R
ATGCAGAGAGGGAAGAAACA
Maize/seed
YM-F
GTTCTACACAAAACCCTCT
YM-R
TTAAACTCTATGACCCTCC
Sunflower/seed
KHZ-F
GGATTATGGGAGTGTGTGA
KHZ-R
GACCTTAGGATTGGTGTTG
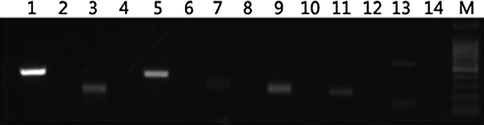
Verification results of DNA extraction from seven oil plants. Note: 1, 3, 5, 7, 9, 11, 13 are the DNAs of sunflower, soybean, peanut, maize, rape, palm, olive, respectively. 2, 4, 6, 8, 10, 12, 14 are the negative control of each primer. M is DNA Marker.
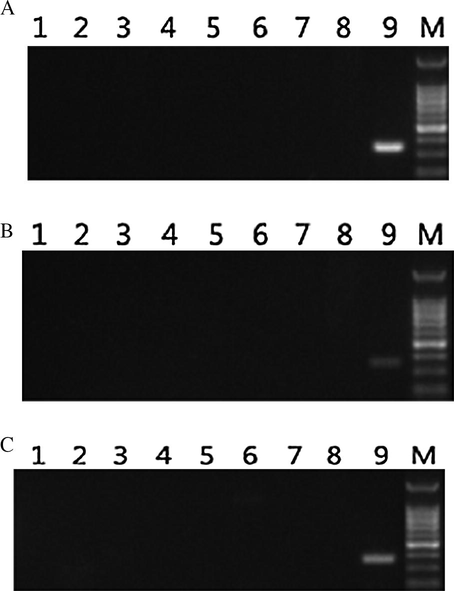
PCR results of Camellia oil DNA-specific primers by exclusion screening (A: primer 124, B: primer142, C: primer 1214). Note: In this figure 1 is negative control of each primer. 2 to 8 are the DNAs of oil palm, rape, olive, soybean, peanut, maize and sunflower, respectively. 9 is the DNA of C. oleifera leaf. M is DNA Marker.
3.5 Concentration regression curve of Camellia oil DNA
3.5.1 Design of specific qPCR primer and probe
According to above results, the primer 1214 was selected as final specific primer for the PCR, and then the corresponding primers and probe for qPCR were designed (Table 6). The target fragments brought by qPCR primer and probe were included in the fragments brought by the PCR primer 1214.
Primer name
Sequence
Primers
Q1214-F
GAGGAAACAGCAGCGGCAAA
Q1214-R
GGTCGCAGCATTCGTCAAGG
Probe
P1214
TCGCTGTGCCTGCTGCGCCATGT
3.5.2 Concentration regression curve of Camellia oil DNA basing on qPCR
2.0 μl, 1.0 μl and 0.5 μl DNAs of C. oleifera leaf were mixed with 10×DNA Buffer to 5 μl, respectively, which were checked by 1.5% agarose gel for DNA quantitation (Fig. 5).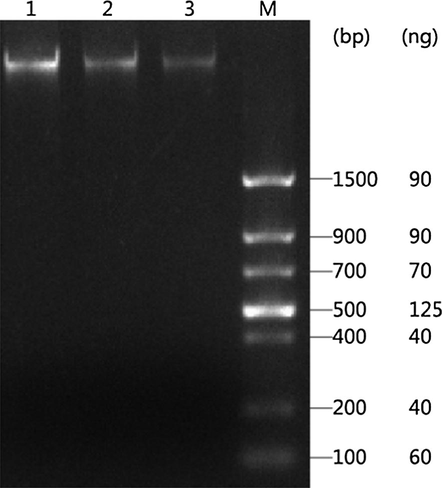
Concentration quantitation of DNA from C. oleifera leaf. Note: 1 to 3 are 2.0 μl DNA, 1.0 μl DNA, 0.5 μl DNA, respectively. M is DNA Marker.
Quantitative analysis of DNA was performed by the Volume Analysis component in the Quantity one software (Bio-Rad, USA), and showed that the concentration of target DNA from C. oleifera leaf was 47.05 ng/μl.
The target DNA was performed a gradient-dilution (100%, 10%, 1%, 0.1%, and 0.01%), which was used for qPCR accompanied with negative contrast (Fig. 6).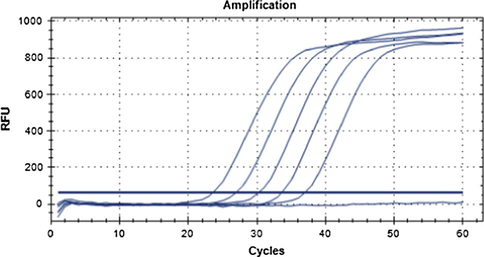
qPCR result of gradient concentration of C. oleifera leaf DNA. Note: Curves from left to right are 100%, 10%, 1%, 0.1%, 0.01% concentration of target DNA from C. oleifera leaf. The curve below the threshold line is negative control.
According to the principle of qPCR, the Ct value was linearly related to the DNA concentration, and the regression curve was achieved as: y = −3.347x + 29.136, R2 = 0.9999 (Fig. 7).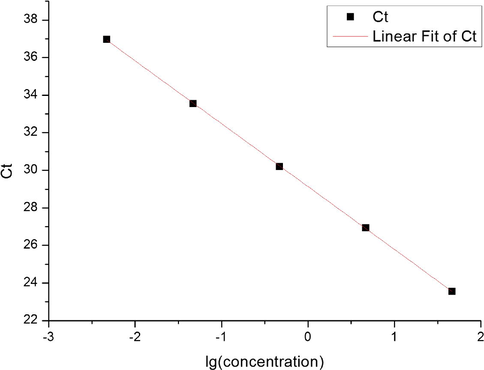
Concentration regression curve of DNA from C. oleifera leaf.
3.6 Identification model of simulated Camellia oil adulteration
In order to simulate the adulteration of Camellia oil, the DNA of Camellia oil from sample ZZ003 was mixed with maize oil making Camellia oil ratio into 20%, 40%, 60%, 80% and 100%, which were determined by qPCR accompanied with negative contrast (Fig. 8). The linear regression curve between Ct value and Camellia oil content was achieved as: y = −1.895x + 33.895, R2 = 0.8948 (Fig. 9).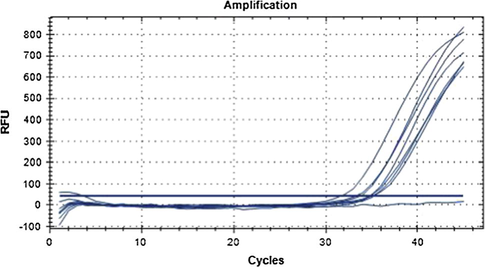
qPCR result of DNA from different contents of Camellia oil. Note: Curves from left to right are 100%, 80%, 60%, 40%, 20% DNA concentration of ZZ003. The curve below the threshold line is negative control.
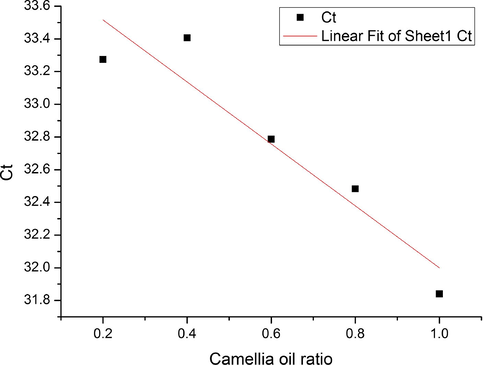
Regression curve between Ct value and Camellia oil ratio.
By simulating, two adulterated oils with 65% and 35% Camellia oil ratio were used to verify the regression curve by qPCR. The Ct value of adulterated oil with 65% Camellia oil ratio was 32.93, and the difference value was only 0.27 compared with the calculated result 32.66 in the fitting curve. The Ct value of adulterated oil with 35% Camellia oil ratio was 33.02, and the difference value was 0.21 compared with the calculated result 33.23 in the fitting curve. It was showed that the curve has high accuracy for little difference between detected value and theoretical calculated value, suggesting that this regression curve between Ct value and Camellia oil ratio could be efficient in identifying the adulterated Camellia oil basing on C. oleifera-specific DNA.
4 Discussion
Through determination of fatty acids in edible vegetable oil by GC, oleic acid and linoleic acid are the main fatty acid components of Camellia oil. However, the composition of fatty acids in Camellia oil is not special, and a mixed oil by a certain proportion of edible oils can also form a fatty acid composition close to that of Camellia oil. Therefore, adulteration identification of Camellia oil by fatty acids and flavor substances is still not accurate.
Identification of adulterated Camellia oil basing on C. oleifera-specific DNA can avoid the interference of homologous substances, and can accurately reflect whether the target Camellia oil is mixed with other edible oils, meanwhile, the Camellia oil ratio in the possible adulterated oil can be also confirmed. The current method only via fatty acid composition cannot determine the ratio of Camellia oil in target oil.
However, the new method of identifying adulterated Camellia oil basing on C. oleifera-specific DNA cannot reveal the type and ratio of the adulterated oils in target oil. So in the posterior researches, the efficient determination of heterologous DNA from other oils in target oil should be addressed firstly, then identification of the kinds and types of possible adulterated oils should be developed.
5 Conclusions
Generally, a new approach was developed to identify Camellia oil adulteration basing on C. oleifera-specific DNA. First of all, primers 1214 (F/R) had high efficiency and specificity, and was successfully used in identification of adulterated Camellia oil. Fluorescence qPCR primers Q1214 (F/R) and TaqMan probe P1214 were successfully used to measure DNA concentration and Camellia oil ratio by qPCR. Finally, the mathematical model between DNA ratio and Ct value was established to identify Camellia oil adulteration.
Acknowledgement
The authors acknowledge the financial support from the key science and technology project of Hunan Food and Drug Administration, China (R201514), the science and technology project of Hunan Province, China (2016NK2154), and the National Natural Science Foundation of China (31172257).
References
- The potential of palm oil mill effluent (POME) as a renewable energy source. Acta Sci. Malaysia. 2017;1(2):09-11.
- [Google Scholar]
- A study on water quality from langat river, Selangor. Acta Sci. Malaysia. 2017;1(2):01-04.
- [Google Scholar]
- Application of strongly overcoupled resonant modes of long-period fiber gratings to measure the adulteration of olive oil. Appl. Opt.. 2016;55(19):5118-5126.
- [Google Scholar]
- Camellia oil-enriched diet attenuates oxidative stress and inflammatory markers in hypercholesterolemic subjects. J. Med. Food. 2016;19(9):895-898.
- [Google Scholar]
- Beneficial effects of Camellia oil (Camellia oleifera Abel.) on hepatoprotective and gastroprotective activities. J. Nutr. Sci. Vitaminol. (Tokyo). 2015;61:S100-S102.
- [Google Scholar]
- Effectiveness of determinations of fatty acids and triglycerides for the detection of adulteration of olive oils with vegetable oils. Food Chem.. 2004;84(3):463-474.
- [Google Scholar]
- Total phenolic content and total flavonoid content in moringa oleifera seed. Sci. Heritage J.. 2017;1(1):23-25.
- [Google Scholar]
- Salicylic acid mitigates pb stress in nicotiana tabacum. Sci. Heritage J.. 2017;1(1):16-19.
- [Google Scholar]
- Comparison between measured traffic noise in klang valley, malaysia and existing prediction models. Eng. Heritage J.. 2017;1(2):10-14.
- [Google Scholar]
- Influence of seed loads on start up of modified anaerobic hybrid baffled (MAHB) reactor treating recycled paper wastewater. Eng. Heritage J.. 2017;1(2):05-09.
- [Google Scholar]
- Management of end-of-life electrical and electronic products: the challenges and the potential solutions for management enhancement in developing countries context. Acta Sci. Malaysia. 2017;1(2):05-08.
- [Google Scholar]
- Khan, I.U., Sajid, S., Javed, A., Sajid, S., Shah, S.U., Khan, S.N., Ullah, K., 2017. Comparative diagnosis of typhoid fever by polymerase chain reaction and widal test in southern districts (Bannu, Lakki Marwat And D.I.Khan) of khyber pakhtunkhwa, Pakistan. Acta Sci. Malaysia, 1(2), 12–15.
- Enzymatic synthesis of an isopropyl ester by alcoholysis of Camellia oil. J. Am. Oil Chem. Soc.. 2012;89(7):1277-1285.
- [Google Scholar]
- Fatty acid composition of Camellia oleifera oil. J. Für Verbraucherschutz Und Lebensmittelsicherheit. 2011;6(1):9-12.
- [Google Scholar]
- Simultaneous determination of capsaicin and dihydrocapsaicin for vegetable oil adulteration by immunoaffinity chromatography cleanup coupled with LC–MS/MS. J. Chromatogr. B Anal. Technol. Biomed. Life Sci.. 2016;1021:137-144.
- [Google Scholar]
- A novel reliable method of DNA extraction from olive oil suitable for molecular traceability. Food Chem.. 2015;172:596-602.
- [Google Scholar]
- Validation of microscopic dynamics of grouping pedestrians behavior: from observation to modeling and simulation. Eng. Heritage J.. 2017;1(2):15-18.
- [Google Scholar]
- Red pigment production by monascus purpureus in stirred-drum bioreactor. Sci. Heritage J.. 2017;1(1):13-15.
- [Google Scholar]
- Short distance standoff raman detection of extra virgin olive oil adulterated with canola and grapeseed oils. Appl. Spectrosc.. 2017;71(6):1340-1347.
- [Google Scholar]
- Absolute quantification of olive oil DNA by droplet digital-PCR (ddPCR): comparison of isolation and amplification methodologies. Food Chem.. 2016;213:388-394.
- [Google Scholar]
- Tight repression of elastase strain K overexpression by Pt7 (A1/O4/O3) shuttle expression system. Sci. Heritage J.. 2017;1(1):20-22.
- [Google Scholar]
- Quantification of adulterations in extra virgin flaxseed oil using MIR and PLS. Food Chem.. 2015;182:35-40.
- [Google Scholar]
- Analysis of passengers’ access and egress characteristics to the train station. Eng. Heritage J.. 2017;1(2):01-04.
- [Google Scholar]
- Synchronous front-face fluorescence spectroscopy for authentication of the adulteration of edible vegetable oil with refined used frying oil. Food Chem.. 2017;217:274-280.
- [Google Scholar]
- Detection of plant oil DNA using high resolution melting (HRM) post PCR analysis: a tool for disclosure of olive oil adulteration. Food Chem.. 2013;141(4):3820-3826.
- [Google Scholar]
- Characterization of vegetable oils detailed compositional fingerprints derived from electrospray ionization fourier transform ion cyclotron resonance mass spectrometry. J. Agric. Food Chem.. 2004;52(17):5322-5328.
- [Google Scholar]
- Detection of virgin olive oil adulteration using low field unilateral NMR. Sensors. 2014;14(2):2028-2035.
- [Google Scholar]
- Comparison of oil content and fatty acid profile of ten New Camellia oleifera cultivars. J. Lipids. 2016;2016:3982486.
- [Google Scholar]
- Nanoencapsulation of the sasanquasaponin from Camellia oleifera, its photo responsiveness and neuroprotective effects. Int. J. Nanomed.. 2014;9:4475-4484.
- [Google Scholar]
- Prediction of fatty acid composition in Camellia oleifera oil by near infrared transmittance spectroscopy (NITS) Food Chem.. 2013;138(2–3):1657-1662.
- [Google Scholar]
- Classification and adulteration detection of vegetable oils based on fatty acid profiles. J. Agric. Food Chem.. 2014;62(34):8745-8751.
- [Google Scholar]
- Ion mobility spectrometry fingerprints: a rapid detection technology for adulteration of sesame oil. Food Chem.. 2016;192:60-66.
- [Google Scholar]


