

Translate this page into:
Facile preparation of micro-porous biochar from Bangladeshi sprouted agricultural waste (corncob) via in-house built heating chamber for cationic dye removal
⁎Corresponding author. mashrafibinmobarak@gmail.com (Mashrafi Bin Mobarak)
-
Received: ,
Accepted: ,
This article was originally published by Elsevier and was migrated to Scientific Scholar after the change of Publisher.
Peer review under responsibility of King Saud University.
Abstract
Abstract
Herein, in-house built heating chamber aided facile preparation of biochar was carried out using Bangladeshi sprouted corncob as the precursor for removing methylene blue (MB). The corncob biomass (CCB) was pyrolyzed at 700 °C for 2hrs (heating rate: 10 °C/min) using the in-house built heating chamber in a muffle furnace, eliminating the necessity of pyrolytic chamber. The prepared corncob biochar (CCBC) was characterized for elemental composition, crystallinity (XRD), functional groups (ATR-FTIR), surface morphology-elemental composition (SEM-EDX), surface area (BET), surface charge (point of zero charge), particle size-stability (DLS-zeta potential) and thermal stability (STA). Adsorption efficacy of CCBC was investigated in batch experiment with MB dye as well as effect of various factors such as contact time (5–120 min), initial MB concentration (7–15 mg/L), pH (2–10) and adsorbent dosage (10–35 mg). Without any chemical treatment for activation, CCBC produced maximum adsorption capacity (Qmax) of 20.42mgg−1 at 25 °C. The adsorption behavior of MB by CCBC could be better understood by Langmuir isotherm and Pseudo-second order kinetic model as they were the best fitted isotherm and kinetic models. Thus, waste to treat waste, meaning agricultural wastes like corncob can easily be converted into effective adsorbent for treating dye bearing wastewater.
Keywords
Biochar
Corncob
Methylene blue
Dye removal
Adsorption

1 Introduction
Dearth of water along with water pollution have been posing an alarming scenario to the scientific community (Hasan et al., 2019; Quispe et al., 2022; Yaseen et al., 2019). “Clean Water and Sanitation”, the 6th goal of United Nations Sustainable Development Goals (SDGs), is anticipated to be accomplished by the year 2030. The vexatious unbridled contamination of water sources by anthropogenic sources and growing population are mounting concerns to researchers across the world (Issaka et al., 2022; Palansooriya et al., 2020). One of the most crucial contaminants responsible for polluting water is the dye bearing wastewater (Mishra et al., 2010; Sobhani, 2022). Several industries such as textile, food, furniture and paint etc. use dye as a prime chemical. Textile industries contribute to 20% (approximately) of the total discharged wastewater according to World Bank Report (Keskin et al., 2021; Tavangar et al., 2019). With trivial biodegradability, dyes are carcinogenic and under sunlight its half-life is higher than 2000 hrs (Bessy et al., 2022). However, researchers are struggling worldwide to find the best possible solution that leads to the effective treatment of dye contaminated water (Chan et al., 2011).
According to our literature survey, a number of techniques are in operation for remediation; for instance, adsorption, membrane filtration, coagulation, ion exchange which are attributed to physical treatment whereas photocatalytic degradation, ozonation, fenton reagents, hypochlorite treatment, electrodialysis, chemical precipitation, electrochemical treatments are considered as chemical treatment. The biological treatment method comprises aerobic/anaerobic digestion of dye bearing effluents (Bessy et al., 2022; Keskin et al., 2021; Mobarak et al., 2022; Moosavi et al., 2020; Shakoor et al., 2020; Tavangar et al., 2019). Above mentioned methods have their particular advantages and disadvantages according to their way of interaction. Generally, methods categorized as physical are quite simple, cost effective but some drawbacks of this method are sludge production, low volume of treatment, need further steps like flocculation etc. (Keskin et al., 2021; Moosavi et al., 2020; Ong et al., 2014; Shahmirzadi and Kargari, 2018). On the contrary, chemical methods exhibit effective decolorization, use low cost reagents in treatment, but show agglomeration, low permeability, poor mass transfer and yield unnecessary sludge including toxic substances are some of the drawbacks (Keskin et al., 2021; Ong et al., 2014). In addition, biological processes are slow, complex to manage and require large footmark but this method cannot satisfactorily meet the discharge criteria (Keskin et al., 2021; Moosavi et al., 2020).
Adsorption technique outweighs the above mentioned effluent treatment methods based on economic perspective, raw materials accessibility, operating flexibility, versatility in design, applicability without prior treatment, no generation of unwanted byproducts, abundancy in variety of sources, and adsorbent recovery probability (Barquilha and Braga, 2021; Bonilla-Petriciolet et al., 2017, 2017; Dotto and McKay, 2020; Helfferich, 1985). Such emoluments made materials like activated carbon, silica gel, activated alumina, zeolites etc. to be the most widely used adsorbents even though the rummage for cheapest as well as effective adsorbents are still underway (Foo and Hameed, 2011). Clays, agricultural, industrial and municipal waste derived adsorbents, also conversant as bio-sorbents, are getting much attention due to lower cost as well as exalted efficacy (Bhatnagar and Sillanpää, 2010; P. S. Kumar et al., 2021; Varsha et al., 2022). Based on the ease of availability and sustainability of the bio-sorbents, biochar has the supremacy according to a myriad number of studies, which also depicted biochar as an ecological adsorbent. In addition to that, biochar also contributes to waste utilization and/or recycling, thus countenancing the zero waste strategy, particularly for countries with sturdy agriculture (De Bhowmick et al., 2019; Gupta et al., 2009; Inyang et al., 2016; Kong et al., 2014; Oluk et al., 2021). With not much surprises, biochar can be prepared from numerous cost-effective biomasses, i.e., rice straw, pine, palm shell, saw dust, sorghum, coca, coconut, seed, weeds, animal manure etc. (Kwapinski et al., 2010; Lonappan et al., 2016; Nanda et al., 2016). Pyrolysis, hydrothermal carbonization, gasification, flash carbonization and torrefaction are some of the most widely known thermochemical preparation procedures of biochar (Bridgwater, 2012; Ng et al., 2017). Among all the aforementioned procedures, pyrolysis which involves thermal decomposition of plant-derived biomass under low oxic or anoxic conditions to produce biochar has become the most used technique (Cha et al., 2016; Kloss et al., 2012; Sohi et al., 2009).
Biochar is known for its carbon rich porous structure that can be produced by conjunction of thermal treatment and limiting oxygen (Saini et al., 2020; Yang et al., 2015). Physico-chemical properties of biochar such as large surface area and high porosity are said to be exclusive since biochar’s adsorption efficacy is directly proportional to these properties (Gayathri et al., 2021; Hemavathy et al., 2020; Yaashikaa et al., 2020). Therefore, fine-tuning of raw materials composition and pyrolysis condition (temperature, rate of reaction, heating time etc.) not only influences the dye removal efficiency but also imparts versatility to biochar for treating a wide range of pollutants (Rafiq et al., 2016). Moreover, treatment with acid, alkali or oxidizing agents significantly improves the properties of biochar (Jothirani et al., 2016; Kumar et al., 2011; Suganya et al., 2017).
Agricultural waste, i.e., corncob biomass becomes a burden when agriculture dependent developing countries like Bangladesh produces 5,400 Kilotons of maize in the fiscal year 2019–2020. Heterogenous micropore structure, high carbon content as well as hemicellulose content etc. are the perquisite of corncob derived biochar which eases the adsorptive removal of azo dyes, MB for instance (Mullen et al., 2010; Suwunwong et al., 2020).
This study of ours utilized locally available corncob waste for preparing biochar using a simplistic inhouse built pyrolysis chamber. The efficacy of the CCBC for adsorptive removal of MB was also evaluated and the kinetic and isotherm data were exploited for finding the best fitted mechanism of adsorption.
2 Materials and methods
2.1 Materials
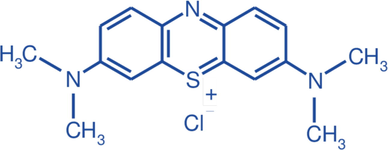
The precursor biomass (corncob) for biochar preparation was procured from a local market in Dhaka, Bangladesh (Mohammadpur krishi market; 23°45′57.2″N 90°21′33.5″E). Hydrochloric acid (HCl) and ethanol (C2H5OH) were procured from Sigma-Aldrich, UK. Methylene blue, the model dye for the adsorption study was purchased from Merck, Germany with the properties listed in Table 1. Mili-Q water was used at all stages of sample preparation.
Name of the dye
Methylene Blue
IUPAC name
3,7-bis(dimethylamino)-phenothiazin-5-ium chloride
Chemical formula
C16H18ClN3S
Type
Cationic
Molecular weight
373.9 gmol−1
Maximum Adsorption Wavelength (λmax)
664 nm
Solubility in water
40 g/L
CAS number
61–73-4
Color Index
51
Chemical structure
2.2 Methods
2.2.1 Preparation of biochar
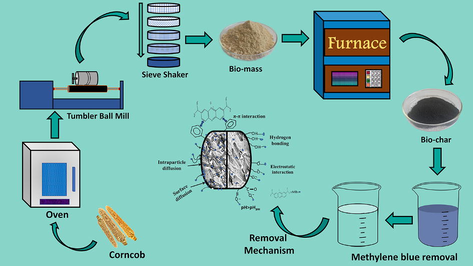
The preparation of CCBC from CCB has been visualized in Fig. 1a. Briefly, the collected corncobs were washed to remove dirt and loose particles, followed by drying under sunlight for 2–3 days and oven drying for few hours. The dried corncobs were chopped into smaller pieces, grinded in a tumbler ball mill (Pascall Engineering, UK) at 50 rpm and then screened in a 50-mesh sieve to get uniform size. The sieved corncob powder was oven dried at 105 °C and stored in an airtight container. Requisite amount of CCB powder was first taken in a ceramic crucible with a lid, placed in an in-house built stainless-steel chamber (Fig. 1b) of length × width × height: 12′′ × 12′′ × 7′′ (Fig. 1c) and subjected to pyrolysis at 700 °C for 2 h in a Muffle furnace (Nabertherm L3/11/C6, Germany). The rate of heating was maintained at 10 °C per min. After completion of pyrolysis, the prepared biochar was washed with distilled water in order to neutralize the pH. Washing with HCl (1molL-1) and absolute ethanol were also done to remove residual ash and organic impurities. After washing, the biochar powder was oven dried and stored in airtight conditions.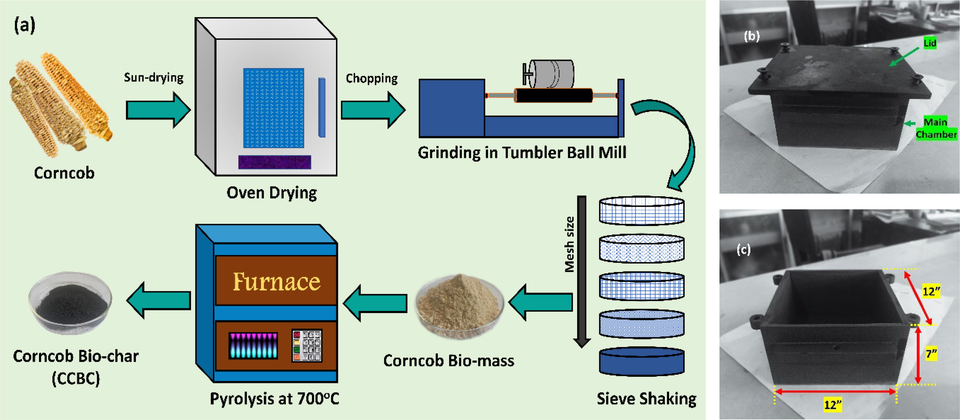
(a) Preparation scheme of bio-char from corncob; (b and c) in-house built heating chamber.
2.2.2 Adsorption experiments
The adsorption experiment involved taking 30 ml of MB dye in 100 ml Erlenmeyer flasks, placing it in an orbital shaker and shaking at 150 rpm under ambient conditions. Different concentrations of MB solution were prepared by diluting the stock solution (1000 ppm MB) as required. Effect of different factors, i.e., pH (2–10), contact time (5–120 min), initial dye concentration (7–15 mg/L) and adsorbent dosage (0.010–0.035g) were also studied. pH adjustments were done with HCl and NaOH solutions (0.1 M each). The adsorbent was separated by centrifugation at 6000 rpm shortly after completion of orbital shaking. Absorbance of the separated solution was recorded using a UV–Vis spectrophotometer (Shimadzu UV-1800) at 664 nm. The kinetics and isothermal study of the MB adsorption onto CCBC were also done varying the contact time and initial MB concentration respectively. The adsorption of MB onto CCBC at time t, qt (mg/g), at equilibrium qe (mg/g) and removal percentage was calculated by the following equations (1) to (3) (Ganguly et al., 2020),
3 Characterization
The elements of CCBC; more specifically C, H, N, S and O were quantified by an elemental analyzer (Vario EL Cube, Elementar, Germany). Phase analysis was carried out by X-ray powder diffractometer (Rigaku Smart Lab). The XRD analysis was done within the 2θ range of 10° to 80° and the X-Rays were generated using ceramic made Cu tube (CuKα radiation with λ = 1.54060 Å). Other operating conditions were: fixing step = 0.01°, scanning rate = 30°/min, voltage = 40 kV and current = 50 mA).
The presence of functional groups in CCBC were identified with ATR-FTIR (Attenuated Total Reflectance-Fourier Transform Infrared Spectroscopy) instrument (Shimadzu IR Prestige-21 with MIRacle-10 ATR accessory). Surface structure of CCBC was explored by Scanning Electron Microscope (Phenom Pro-Desktop 1481). The elemental analysis of CCBC was carried out with Energy Dispersive X-ray spectroscopy (TEAM EDS; EDAX, USA).
Particle size as well as zeta potential were determined by a DLS instrument (Malvern Panalytical Zetasizer Ultra). The power and wavelength of the equipped laser were 10mW and 632.8 nm respectively. The CCBC sample was finely dispersed in Mili-Q water and sonicated for 15 min before DLS analysis. The nitrogen adsorption–desorption isotherm was measured using Brunauer-Emmett-Teller (BET) sorptometer (BET-201-A, PMI, Tampa, FL, USA). Prior to the BET analysis, the sample was degassed at 120 °C for 9 h.
TGA (thermogravimetric analysis) and DSC (differential scanning calorimetry) analysis were carried out for thermal stability profiling of the prepared CCBC adsorbent by the aid of a simultaneous thermal analyzer (STA) (NETZSCH STA 449F5). The point of zero charge (pHPZC) of CCBC was determined adapting the pH drift method with little alteration which is also reported by other literatures (Barquilha et al., 2019; Giri et al., 2020; Pohanish, 2017). In 100 ml conical flasks, 0.02 g CCBC and 50 ml 0.1 M NaCl solution was added and placed for orbital shaking at 150 rpm for 12 h at 25 °C. The pH of NaCl solution was maintained 3–12 by using NaOH and HCl solution. The initial and final value of pH is measured using pH meter. pHPZC was calculated by plotting the change in pH (ΔpH) against the initial pH of the samples (Sumalinog et al., 2018). The equation (4) for ΔpH is as follows:
4 Results and discussion
4.1 Elemental analysis
Elemental composition (C, H, N, S and O) together with different molecular ratios H/C, O/C and (O + N)/C of native sprouted CCB and CCBC were analyzed and represented in Tables 2 and 3respectively. The obtained values of elemental composition of CCB were compared with CCB from different regions of the world. CCB used in our study showed difference in percentage of carbon and oxygen compared to the consistent values from other regions.
Elemental analysis of CCB gives insight of several characteristics such as polarity index, hydrophilicity and aromaticity. This helps to assess the potentiality of biochar for intended application. According to Table 2, the CCB used in all the studies contain low percentage of nitrogen and sulfur which signifies environment friendly feedstock with low rates of nitrogen oxide and sulphur oxide emission during pyrolysis (Mohamed Noor et al., 2012). *Oxygen value = 100 - (% carbon + % hydrogen + % nitrogen + % sulfur) (Ro et al., 2010).
Elements
Bangladeshi sprouted (wt%)
Middle eastern part of China (wt%)
Serbian (wt%)
Hawaiian (wt%)
Turkish Marmara regional (wt%)
Turkish East Black Sea regional (wt%)
C
41.01
48.12
47.6
47.0
49.32
49.0
H
6.66
6.48
6.3
6.4
5.35
5.6
N
1.71
1.89
0.6
0.5
0.63
0.5
S
–
–
0.2
0.1
–
–
O*
50.62
43.51
43.9
43.4
44.70
43.8
H/C
0.16
0.13
0.13
0.13
1.52
0.11
O/C
1.23
0.90
0.92
0.92
0.9
0.89
(O + N)/C
1.27
0.94
0.93
0.93
0.91
0.90
Ref.
This study
(Liu et al., 2014)
(Trninić et al., 2012)
(Demiral et al., 2012)
(Demirbas, 2004)
The elemental compositions (C, H, O, N; O/C, H/C and (O + N)/C ratio) of CCB (Table 2) have decreased after pyrolysis at high temperature (Table 3) which is due to their elimination as H2O, CO2, and CO molecules during pyrolysis (Worasuwannarak et al., 2007). Percentage of carbon in CCBC rose substantially from 41.01% to 78.05% where possible reason could be the removal of –OH groups during dehydration (Gupta et al., 2018). In addition, Cracking of nitrile group, NOx, NH3 during high temperature pyrolysis attributed for the decrease of N content (Tian et al., 2013). The decrease in H/C, O/C and (O + N)/C ratios in CCBC depicts complete carbonation, good aromatization, better aromaticity and stability, lower hydrophilicity and polar functional groups on the biochar surface (Dieguez-Alonso et al., 2018; Hao et al., 2013; Stefaniuk and Oleszczuk, 2015). Life span of biochar is also a crucial parameter to predict based on O/C ratio. According to Spokas K.A., when the O/C ratio is between the value of 0.2 to 0.6, it is predicted to have a life span of 100 years (Anupam et al., 2015; Spokas, 2010). Our prepared CCBC has O/C ratio of 0.23, which depicts its 100 years life span.
Elements
Percentage (%)
C
78.05
H
2.21
N
1.26
S
–
O
18.48
H/C
0.028
O/C
0.23
(O + N)/C
0.25
4.2 X-ray powder diffraction study
The XRD diffractogram of CCBC sample pyrolyzed at 700 °C is shown in the Fig. 2. The pattern shows two broad humps like diffraction peaks within the 2θ angle of 17.42°∼27.72° and 38.12°∼46.71°.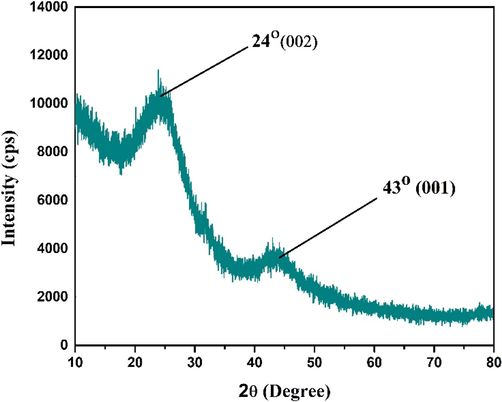
XRD pattern of the prepared CCBC.
This substantify the formation of amorphous phase of the biochar which begets due to the disorderly stacked up carbon rings. These two broad peaks correspond to (0 0 2) and (0 0 1) plane of amorphous form of carbon (Gonzalez-Canche et al., 2021; Saremi et al., 2020; Villagómez-Salas et al., 2018; Yeboah et al., 2020). According to Mreohan et. al. (Mohan et al., 2018), the existence of (0 0 2) plane might be due to the parallel and azimuthal orientation of the aromatic, partially carbonized lamellae (Zhang et al., 2019) whereas the (0 0 1) plane might be due to the condensed aromatic carbonized planes (Wang et al., 2022). Nevertheless, absence of any sharp peaks alluded no crystallinity which might have happened due to the presence of silica or relevant other inorganic metal oxide impurities (Mohan et al., 2018; Petronijević et al., 2021).
4.3 ATR-FTIR study
Fig. 3 exhibits the ATR-FTIR spectra of CCB, CCBC and MB dye loaded CCBC for characterization based on functional groups. For the CCB (Fig. 3a), the –OH stretching vibration was observed at the broad absorption peak of 3334 cm−1 (Chakraborty et al., 2018; Zhao et al., 2021). The C–H stretching vibrational peak at 2883 cm−1 might be from the hemicellulose and cellulose structure (N. S. Kumar et al., 2021; Wang et al., 2019). The band at 1637 cm−1 can be assigned to the aromatic C = C bond while band at 1382 cm−1 can assigned to the N-O symmetric nitro group (Chen et al., 2012; N. S. Kumar et al., 2021). In addition, a series of peaks at 1000 ∼ 1305 cm−1 can be assigned to assorted functional groups with oxygen (Chen et al., 2012).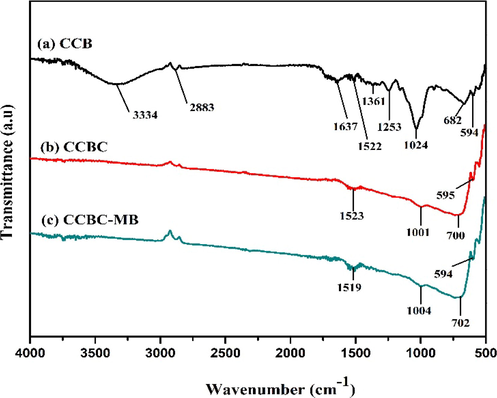
ATR-FTIR spectra of (a) CCB, (b) CCBC and (c) CCBC-MB.
At elevated pyrolysis temperature (700 °C), most major bands of CCB disappeared while converting into CCBC due to the degree of carbonization. In case of CCBC, aromatic C–H deformation at 700 cm−1 with increased intensities is also observed compared to pristine biomass (Wang et al., 2018). The bands at around 1520 cm−1 (Fig. 3 a, b and c) represent aromatic ring vibrations from lignin structure. The intensity of the band at 1024 cm−1 got decreased after pyrolysis which corresponds to the C–O–C stretching vibration (Fig. 3 a and b). The bands below 1000 cm−1 are related to hydroxyl and cellulose groups (Wang et al., 2019). The MB dye loaded CCBC shows almost identical spectrum as CCBC, except for few changes in peak positions. This predicts higher cycles of reusability from the prepared CCBC.
4.4 SEM and EDX study
The surface morphology and micro-structure of biochar was investigated by SEM analysis (Fig. 4). From Fig. 4a, the presence of varied size of granules and pores distribution throughout the entire surface was quite visible and this provided more active sites to bind with dye molecules at various magnitudes (Ma et al., 2021).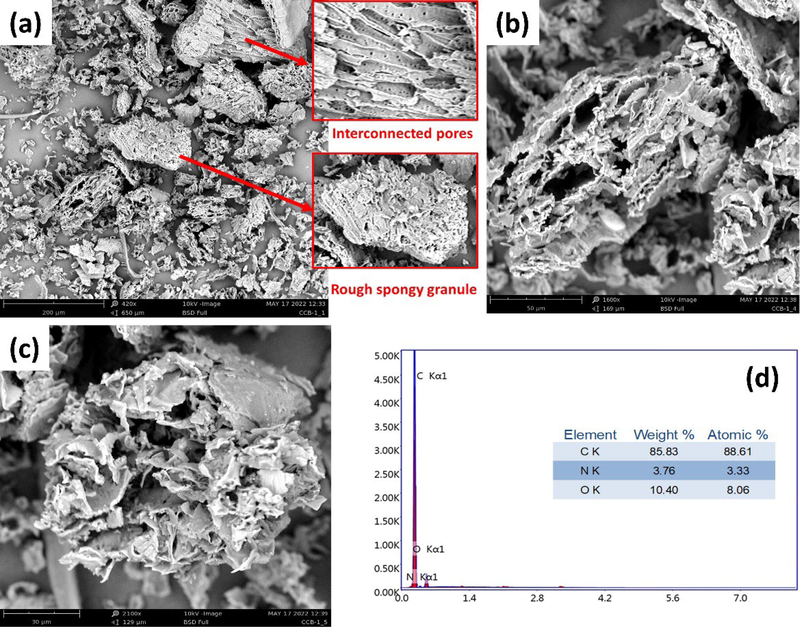
(a-c) SEM images and (d) EDX spectrum with elemental composition of CCBC.
The existence of rough spongy surface was also confirmed by SEM analysis. This structural phenomena is the result of formation of porous channel due to the elimination of volatile organic materials as well as demolition of fiber structure at elevated temperature while pyrolysis was carried out (N. S. Kumar et al., 2021; Wu et al., 2020). The EDX spectrum of CCBC is shown in Fig. 4d. Three main constituents, i.e., C, N and O were detected through the EDX analysis where C, N and O were 85.83%, 3.76% and 10.40% respectively. Higher carbon content as well as low oxygen content substantify the effectiveness of the in-house built pyrolytic chamber (Adesemuyi et al., 2020).
4.5 Point of zero charge
The surface charge of the adsorbent becomes zero at a specific pH value and this value is termed as point of zero charge (pHpzc) (Nath et al., 2021). This parameter is important for understanding the mechanism and optimum conditions for adsorptive removal of pollutants like dyes or heavy metals. Fig. 5 shows the pHpzc of the prepared CCBC adsorbent.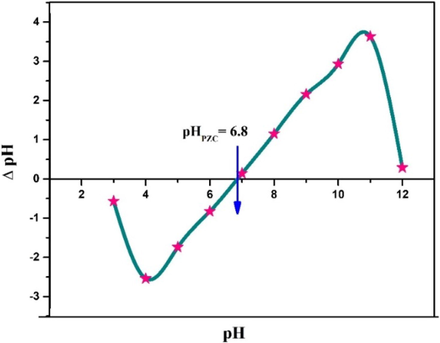
Plot of pHPZC determination of CCBC.
From the plot of ΔpH vs the initial pH, the intersection point along the x-axis represents the pHPZC (Gatabi et al., 2016). According to such, the pHPZC of CCBC was 6.8 which means the net surface charge of CCBC becomes zero at pH 6.8 (Cruz et al., 2020). When the value of pH < pHpzc, it indicates the surface of CCBC is positive and can easily interact with anionic dyes whereas pH > pHpzc denotes the negatively charged surface of CCBC and its preferable reaction with cationic dyes (El Haddad et al., 2012). Thus, maintaining pH of solution above 6.8 will favor the removal of cationic dyes like MB. Effect of pH in batch experiment also supports the statement as highest MB removal was seen at pH 8, which is higher than the pHPZC (6.8).
4.6 BET analysis
The BET analysis was carried out to determine the surface area (SBET) and pore size distribution of CCBC based on N2 adsorption/desorption isotherms at − 196 °C which is presented in Fig. 6 (a and b). SBET of CCBC adsorbent was found to be 435.15 m2/g. Such a large surface area might be due to the fact that, at elevated pyrolytic temperature, the volatile components present in the adsorbent get eliminated creating tiniest of interconnecting pores (Vyavahare et al., 2021). Then again, the micropore surface area was found 394.73 m2/g (t plot) which is 90% of total surface area. In addition, the shape and a substantial increase in the adsorption volume at the first measurement point of CCBC isotherm also indicates that CCBC is strongly microporous (Maziarka et al., 2021).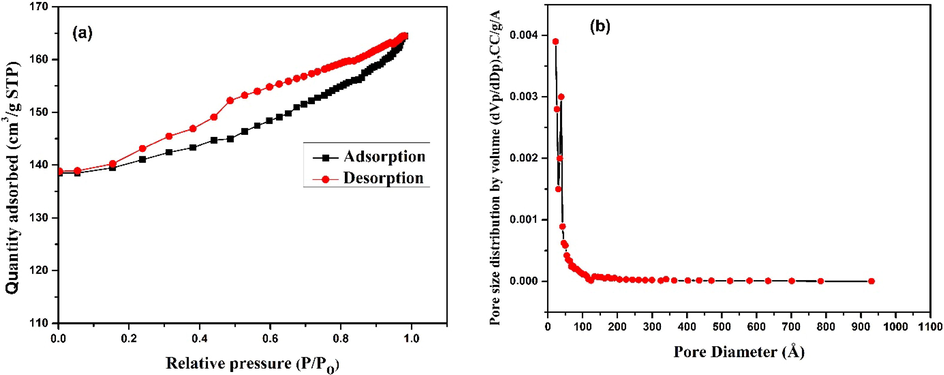
BET analysis of CCBC (a) N2 adsorption–desorption isotherm, (b) BJH adsorption pore size distribution curve.
According to IUPAC classification, CCBC demonstrates type-I adsorption isotherm curve which depicts the microporous structure of the adsorbent. The H4 type hysteresis loop is also present since non-limiting adsorption is observed at higher relative pressure. This also implies the uniform narrow slit-shaped porosity of CCBC. In addition, the pore diameter is 25.33 Å along with 0.2533 cm3/g total pore volume of the prepared CCBC (N. S. Kumar et al., 2021).
4.7 Particle size and zeta potential analysis
Multi Angle-DLS (MADLS) aided particle size analysis technique was employed for determining the particle size of CCBC. An average particle size of 432 nm was found and this distribution is shown in Fig. 7a. The consolidated effect of ball milling and sieving of the CCB contributed to such minute sized CCBC particles. The stability of CCBC was measured in terms of zeta potential analysis (Fig. 7b). According to the data obtained, multiple peaks were obtained which corresponded to the values −34.80, –22.12 and −12.43 mV at solution pH. The apex at –22.12 mV as well as the sharp peak at −34.80 mV depict the moderate to good stability of the CCBC particles. The occurrence of such multiple peaks might be due to the significant distribution of particle size of the prepared CCBC adsorbent (Hossain et al., 2020; Wang et al., 2021).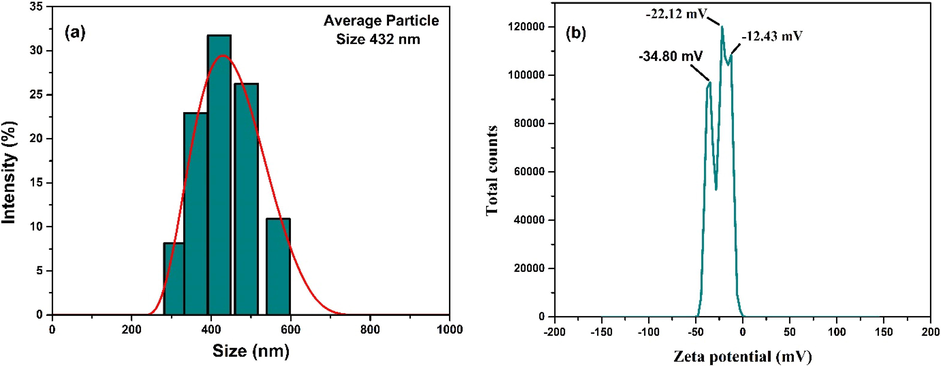
(a) DLS particle size and (b) zeta potential (at solution pH) analysis of CCBC.
4.8 Thermal analysis
The TGA and DTG (derivative thermogravimetry) profiles of the CCBC (Fig. 8a) show evidences of minute mass change of the prepared CCBC adsorbent which was 4.51% within room temperature to 800 °C. A huge residual mass, quantitatively more than 95% depicts the strong thermal stability of the CCBC particles compared to the CCB (raw material) without compromising its porosity (Zhao et al., 2017).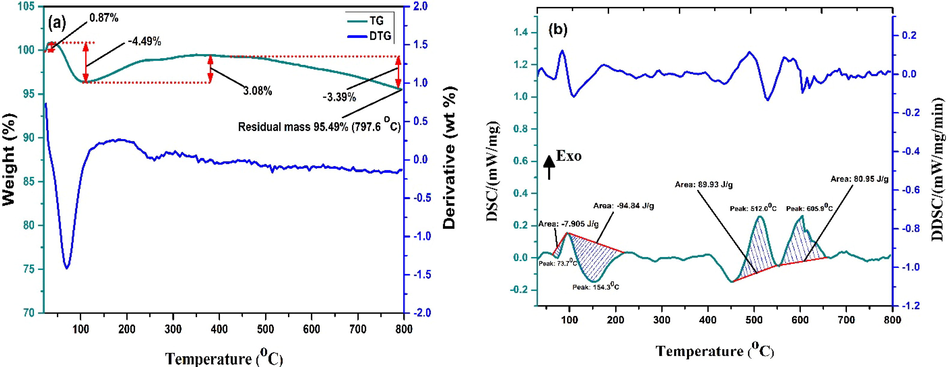
(a)TGA -DTG and (b) DSC-DDSC curve of prepared CCBC sample pyrolyzed at 700 °C.
The TGA curve reveals a dual mass loss step where the first step accounts for 4.49% of mass loss up to 130 °C that is due to the elimination of moisture and volatile organic compounds (Ghodke et al., 2021). The second mass loss was observed after 510 °C up to 800 °C which is attributed to 3.97% weight loss probably due to the elimination of large complex molecules along with inorganic compounds during heat treatment. DTG curve supports the two step wight loss of CCBC. Thus, the amount of residual biochar at 800 °C is 95.49% which depicts strong thermal stability of CCBC (Subratti et al., 2021). The DSC and DDSC (derivative differential scanning calorimetry) curve of CCBC is shown in Fig. 8b. According to the thermogram, two endothermic as well as two exothermic processes were recorded. Peak temperature and the area of the two endothermic processes were 512 °C, +89.93 J/g and 605.9 °C, +80.95 J/g respectively whereas peak temperature and area of 73.7 °C, −7.905 J/g and 154.3 °C, −94.84 J/g respectively were observed for the two exothermic processes.
4.9 Adsorption studies
4.9.1 Effect of contact time and initial MB concentration
Cost effectiveness as well as economic benefits are greatly influenced by the contact time during any treatment process. Herein, the effect of contact time and initial MB concentration on removal percentage was experimented with various shaking durations ranging from 5 to 120 min and MB concentration from 7 to 15 ppm. The results have been shown in Fig. 9a and 9b, from which it is clearly understandable that adsorption efficacy of CCBC is dependent on contact time and initial MB concentration. Within 15 min of shaking, around 94% MB removal was attained. Such high percentage of removal within shortest time period was possible because of higher availability of active sites. Only 3% removal was attained in the next 15 min and steady removal was observed for further contact time until equilibrium was achieved after 120 min. Saturation of CCBC surface with MB caused such phenomena since it becomes hard for MB molecules to further find more available sites for adsorption (Adeogun et al., 2018).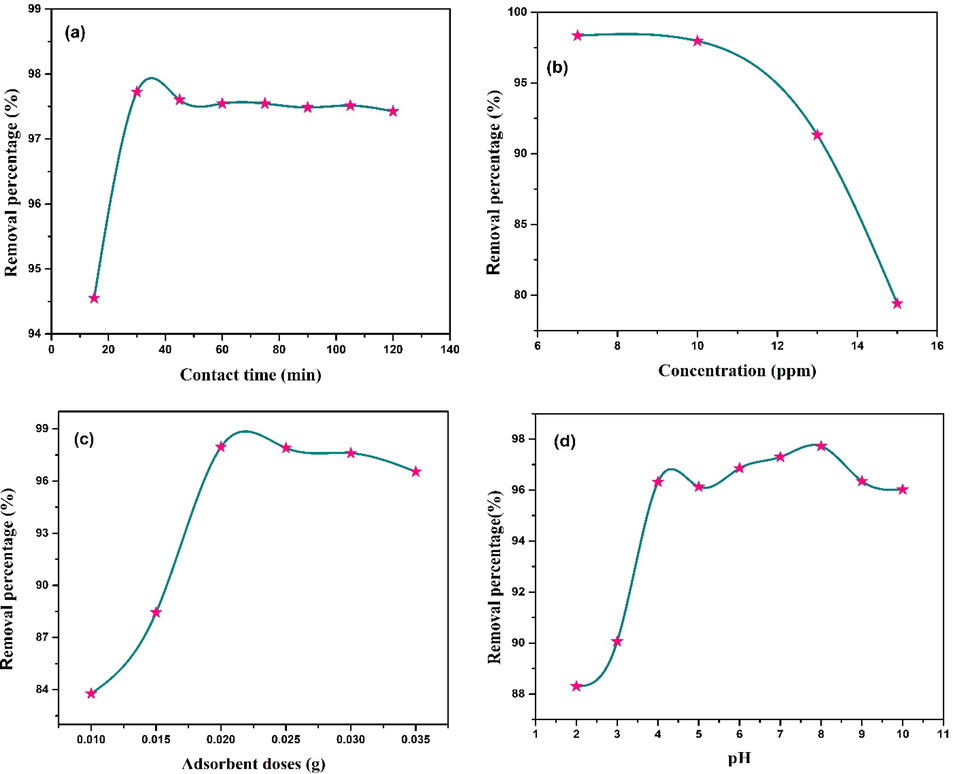
(a) Effect of contact time (Co = 10 ppm, CCBC dose = 0.02 g, pH = 8, shaking speed = 100 rpm); (b) Effect of initial MB concentration (CCBC dose = 0.02 g, pH = natural, shaking speed and time = 100 rpm and 30 min); (c) Effect of adsorbent dose (Co = 10 ppm, pH = natural, shaking speed and time = 100 rpm and 30 min) and (d) Effect of pH for MB adsorption on CCBC (Co = 10 ppm, CCBC dose = 0.02 g, shaking speed and time = 100 rpm and 30 min); all the experiments were carried out at 25 °C.
4.9.2 Effect of adsorbent dose
The effect of adsorbent dosage on the removal % of MB is shown in Fig. 9c. With the increase of adsorbent dosage from 0.01 g to 0.02 g, the % removal also increases from 83% to 97%. Further increase of CCBC dose doesn’t quite increase the removal efficacy and ultimately reached equilibrium for 0.02 g with removal efficiency of 97.72%. This is due to the fact that, at first there were more available active sites for MB to get adsorbed onto CCBC surface. But after equilibrium is achieved, lesser number of active sites are present which caused lower removal rate. In addition, if doses are given in excess amount, there is a chance of adsorbent particle aggregation which will lead to limited binding sites (Shirmardi et al., 2016; Zhu et al., 2018).
4.9.3 Effect of pH
Generally, interaction between adsorbent and adsorbate greatly depends on the solution pH (Abd El-Rahim et al., 2009). Fig. 9d represents the relation between % removal and pH of the MB solution (pH ranging from 2 to 10). With the increase of pH from 2 to further, removal percentage also rose sharply till pH 4 and then remained almost steady up to pH 6. Maximum removal percentage was attained at pH 8 (97.7%) and further increase in pH led the removal percentage drop to 96% (pH 10). Nath et. al. also reported similar results where maximum MB was adsorbed at pH 8 on okra (Abelmoschus esculentus L.) mucilage modified biochar (Nath et al., 2021). At lower pH, the concentration of H+ ions are high as well as various surface-active sites become protonated which renders biochar surface with positive ions. This leads to the electric repulsion between cationic MB and CCBC. On the contrary, at increased pH, deprotonation of active sites made the CCBC surface negatively charged which facilitated the electrostatic attraction between CCBC surface and MB molecules. The saturation of adsorbent with cationic MB molecules can be clearly observed by steady portion of the fig at pH 5–6 (Nath et al., 2021).
4.10 Adsorption isotherms
In adsorption processes at equilibrium, isotherm models play significant role in providing information about the adsorption efficiency, favorability, mechanism and affinity between adsorbate and adsorbent (Kyzas and Matis, 2015; Wang et al., 2018). For the adsorption of MB onto CCBC surface, different isothermal models such as Langmuir, Freundlich, Temkin and Dubinin–Radushkevich (D–R) were employed for analyzing the equilibrium data. The linear forms of Langmuir and Freundlich isotherm models are presented by the equation (5) and (6) whereas their non-linear forms are represented in equation (7) and (8) respectively. The Temkin and D-R isotherm models are represented in equation (9) and (10) respectively (Dubinin, 1947; Freundlich, 1906; Langmuir, 1918; Padmavathy et al., 2016; Temkin, 1940).
Here, Ce = MB concentration at equilibrium (mgL-1); qe = amount adsorbed at equilibrium (mgg−1), qm = maximum adsorption capacity of CCBC (mgg−1); KL = Langmuir constant (Lmg−1); KF = Freundlich constant, ((mg/g)(Lg−1) n); n = constant (relates adsorption intensity); R = universal gas constant (JK-1mol−1); T = temperature (K); KT = equilibrium binding constant (Lg−1); b = constant (relates heat of adsorption) (Jmol−1); KE = constant (relates mean adsorption energy E from equation (11)) (mol2kJ−2); εp = polanyi potential (kJmol−1) defined by equation (12), (Liu et al., 2019).
From Langmuir isotherm, the favorability of adsorption process was calculated based on the constant RL by using Eq. (13) (Medhat et al., 2021; Malik, 2004)
Here, Co = highest initial dye concentration. The RL value helps in predicting the favorability of the adsorption process (favorable when RL is greater than zero but <1) (Medhat et al., 2021). The value of adsorption energy E from D-R isothermal model can be used to predict whether an adsorption process is physisorption (E < 8kJmol−1) or chemisorption (8 < E < 16kJmol−1) (Bering et al., 1972).
Fig. 10 shows the corresponding plots of Langmuir (Fig. 10a and 10b), Freundlich (Fig. 10c and 10d), Temkin (Fig. 10e) and Dubinin–Radushkevich (Fig. 10f) isotherms. Table 4 lists all the important parameters extrapolated from the fitted plots of isothermal models. Best fitted isothermal model for MB adsorption onto CCBC was determined based on the correlation coefficient (R2) values of the fitted plots. The Linear fitting of Langmuir isotherm exhibited best fitting (R2 = 0.9995) which also suggests the occurrence of monolayer adsorption process and when an adsorbed particle enters an active site, no further adsorption is carried out (Langmuir, 1918). The maximum adsorption capacity (Qmax) was 20.416mgg−1 and the RL value was 0.01, suggesting a favorable adsorption of MB by CCBC.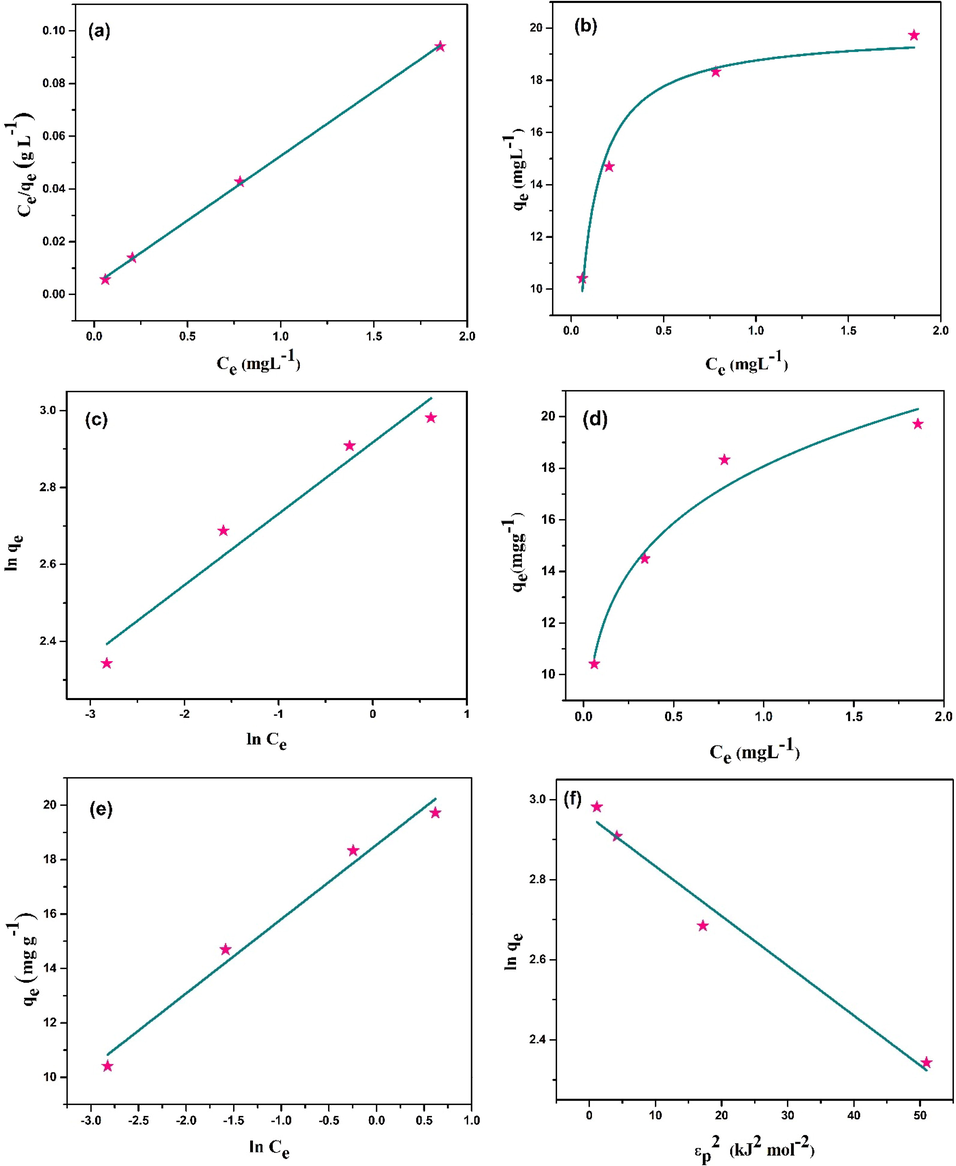
(a and b) Linear and non-linear form of Langmuir isotherm model; (c and d) linear and non-linear form of Freundlich isotherm model; (e) Temkin isotherm model, (f) Dubinin–Radushkevich (D-R) isotherm model (conditions: pH = natural, CCBC = 0.02 g, t = 30 min, shaking = 100 rpm, temperature = 25 °C).
Model
Fitting type
Parameters
values
Langmuir
Linear
Non-linearQmax (mgg−1)
KL (Lmg−1)
RL
R2
20.42
13.68
0.01
0.9995
Qmax (mgg−1)
KL (Lmg−1)
RL
R2
19.87
16.84
0.007
0.97193
Freundlich
Linear
Non-linearKF (mg1-1/nL-1/ng−1)
n
RL
R2
18.49
5.39
0.006
0.9358
KF (mg1-1/nL-1/ng−1)
n
RL
R2
18.07
5.34
0.005
0.95431
Temkin
Linear
KT (Lmg−1)b
(Jmol−1)
R2
890.63
907.49
0.97473
Dubinin-Radushkevich
Linear
Qmax (mgg−1)
KE (mol2kJ−2)E
(kJmol−1)
R2
19.25
0.012
6.34
0.96757
The adsorption intensity value greater than unity (n greater than 1) in Freundlich adsorption isotherm model also depicts the favorability of the adsorption process. Temkin isotherm model gave equilibrium binding constant value (KT) and heat of adsorption (b) of 890.63Lmg−1 and 907.49Jmol−1 respectively. The energy of adsorption (E = 6.34 kJ/mol) from D-R model suggests the physisorption of MB onto CCBC surface.
4.11 Adsorption kinetics
Kinetic models of adsorption give information regarding the rate of reaction, rate controlling step and mechanism of adsorption (Anastopoulos and Kyzas, 2014). In our adsorptive experiment of CCBC and MB, pseudo first and second order, Elovich and intraparticle diffusion kinetic models were exploited. The linear and non-linear expressions of pseudo first and second order kinetic models are given by the equations (14) - (17) and linear form of Elovich and intraparticle diffusion kinetic model is presented in equation (18) and (19) (Yan et al., 2020).
Here, qe = amount adsorbed at equilibrium (mgg−1); qt = amount adsorbed at time t (mg g−1); k1 and k2 = rate constant of pseudo first and second order kinetic model (gmg-1min- 1); = initial adsorption rate (mgg-1min−1); be = degree of surface coverage (gmg−1); ki = rate constant of intraparticle diffusion model (mgg-1min−0.5) and Ci = constant related to thickness of boundary layer (mgg−1).
Pseudo first order kinetic model makes assumption about the adsorption mechanism which is related to the membrane diffusion theory. According to this theory, the rate of adsorption is related to the variation between the adsorption capacity at equilibrium and quantity of adsorbate with time. In this process, reaction rate depends on the concentration of the adsorbate for a mono adsorbate system and this kinetics is known to be governed by physisorption. Conversely, according to the pseudo second order model, the rate of sorption is reciprocal to the rate of adsorption. It includes membrane diffusion, surface adsorption and particle diffusion where chemical reaction among the adsorbent and the adsorbate is termed as a rate-determining step, hence describe the chemisorption mechanism of the process (Ho and McKay, 1999). Elovich kinetic model was also employed to assist second order kinetics assuming the heterogeneous-based chemisorption process. Mechanism regarding adsorbate-adsorbent interaction is not portrait by this model (Mezenner and Bensmaili, 2009). The intraparticle diffusion model was also exploited for the kinetics calculation. If this intra-particle diffusion is determined to be the rate controlling step, then a linear plot passing through the origin will be originated. If opposite phenomena occurs, then some extend of boundary layer or other kinetic models might be more appropriate (Arami et al., 2008; Weber Jr and Morris, 1963).
Fig. 11 (a and b) represents the linear fitting of pseudo-first order and pseudo-second order kinetic model whereas Fig. 11 (c) represents their non-linear fitting. The Elovich and Intraparticle diffusion model have been shown in Fig. 11 (d and e) respectively.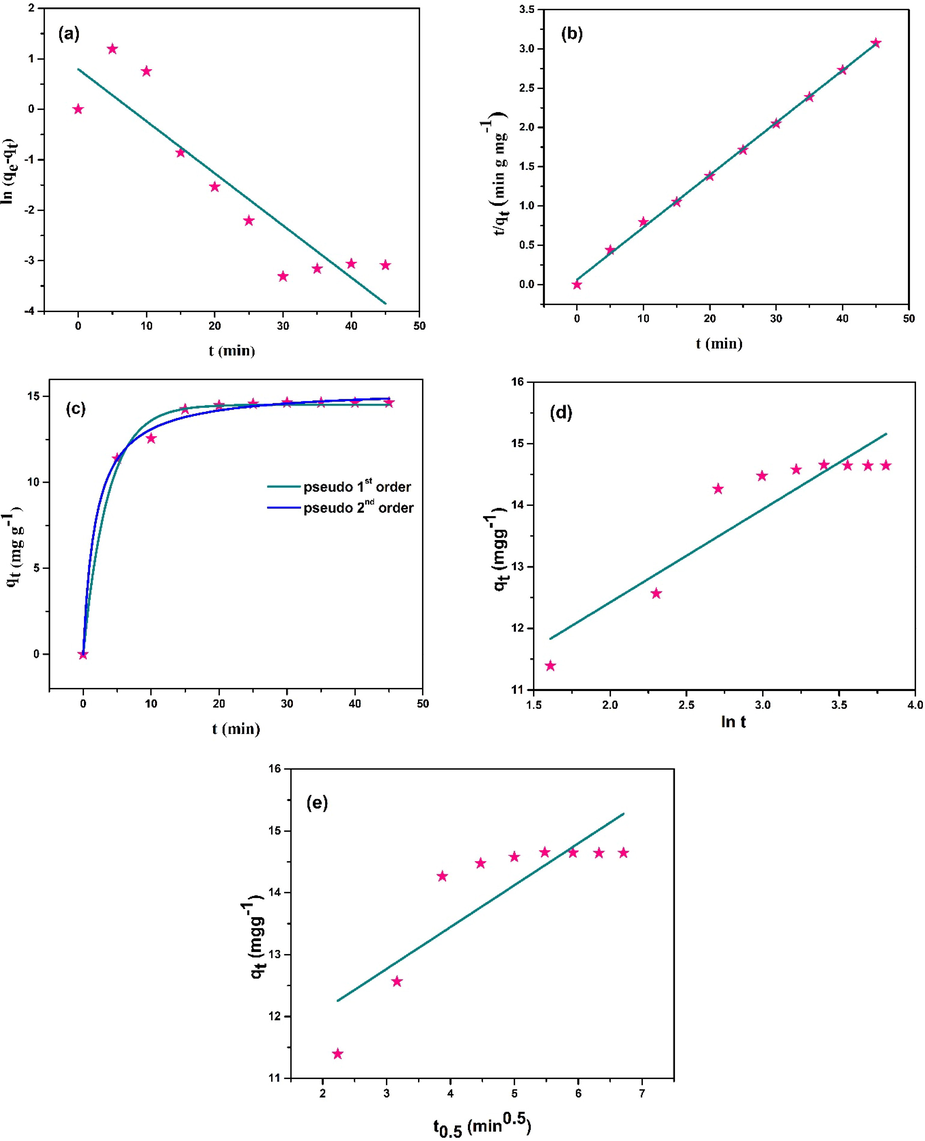
(a and b) linear and (c) non-linear fitting of pseudo-first and pseudo-second order; (d) Elovich; (e) Intraparticle diffusion kinetic model (Conditions: Co = 10 ppm, pH = natural, CCBC = 0.02 g, t = 30 min, shaking = 100 rpm, temperature = 25 °C).
The extrapolated values of different parameters from the fitted plots of kinetic models are listed in Table 5. Maximum value of co-relation co-efficient (R2 = 0.998) was obtained from the linear fitting of pseudo second-order kinetic model. The value of Ci in intraparticle diffusion is greater than zero, which means the fitted plot doesn’t pass through the origin and hence intraparticle diffusion is not the rate controlling step (Anastopoulos and Kyzas, 2014).
Kinetic model
Curve fitting
Parameters
values
Pseudo-first order
Linear
Non-linearqe (mgg−1)
k1 (gmg-1min−1)
R2
2.22
0.103
0.8089
qe
k1
R2
14.52
0.276
0.99146
Pseudo-second order
Linear
Non-linearqe (mgg−1)
k2 (gmg-1min−1)
R2
15.00
0.071
0.99864
qe (mgg−1)
k2 (gmg-1min−1)
R2
15.48
0.035
0.99586
Elovich
Linear
ae (mgg-1min−1)
be (gmg−1)
R2
753.23
0.661
0.82744
Intraparticle diffusion
Linear
k1 (mgg-1min−0.5)
Ci (mgg−1)
R2
0.68
10.74
0.69643
4.12 Thermodynamics
Gibbs free energy (ΔG0) can be exploited for approximating the viability of an adsorption process. The spontaneity of a process is depicted by the negative ΔG0 whereas positive ΔG0 value represents the opposite. Following equation (20) shows the expression of Gibbs free energy (ΔG0), (Kim et al., 2004).
Here, T = temperature of the experiment (298 K in all of our experiments), R = universal gas constant (8.314 Jmol−1K−1) and K = equilibrium constant which has been obtained from Langmuir, Freundlich, Temkin and Dubinin-Radushkevich isotherm models (Nawi et al., 2018). The values obtained are listed in Table 6.
isotherm
Fitting
constant
temperature (T), K
Universal gas constant (R), Jmol−1K−1
Gibbs free energy (ΔG0), KJ/mol
Langmuir
Linear
13.68
298
8.314
−6.48
Non– linear
16.84
−6.99
Freundlich
Linear
18.49
−7.23
Non-linear
18.07
−7.17
Temkin
Linear
890.63
−16.83
Dubinin-Radushkevich
Linear
0.012
+10.96
All the values of ΔG0 are negative except for Dubinin-Radushkevich model which has the value of + 10.96KJ/mol. The negative as well as smaller values of ΔG0 produced by Langmuir, Freundlich and Temkin models can be termed as indication of feasibility as well as and spontaneity of the adsorption process (Abdulraheem et al., 2015; Yağmur and Kaya, 2021).
4.13 Regeneration and reusability study
Regeneration of used adsorbent is imperative to ensure the economic feasibility as well as to prevent pollution which may occur if this used adsorbent is discharged into environment. In order to perform the desorption study, five adsorption–desorption cycles were carried out with 0.5 M HCl as a regenerating agent.
For this investigation, orbital shaking of 30 ml 10 ppm MB solution was done at 100 rpm for 90 min. The amount of CCBC was 0.02 g. Removal % of MB found to be 96.67% in first cycle, remained almost stable in next two cycle and then fall to 88.28% after the fifth cycle (Fig. 12).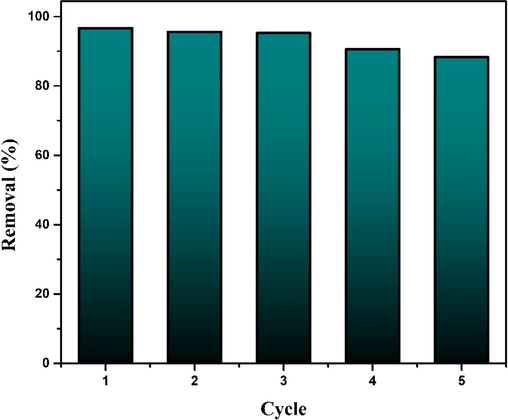
Regeneration study of CCBC.
4.14 Adsorption mechanism and comparative study
Biochar is a widely recognized eco-friendly absorbent for removing a wide variety of pollutants because of having a large surface area and charged surface (Ambaye et al., 2021). Although the mechanism that governs the adsorption process involves many complex interactions, researchers opine the adsorption process to be comprised of multiple mechanisms, i.e. pore filling, Van Der Waals forces, electrostatic interactions, precipitation and surface sorption, π – π interactions, cation - π interactions etc. (Srivatsav et al., 2020). Fig. 13 summarizes the possible mechanism that might be governing the adsorptive interaction between MB and CCBC adsorbent.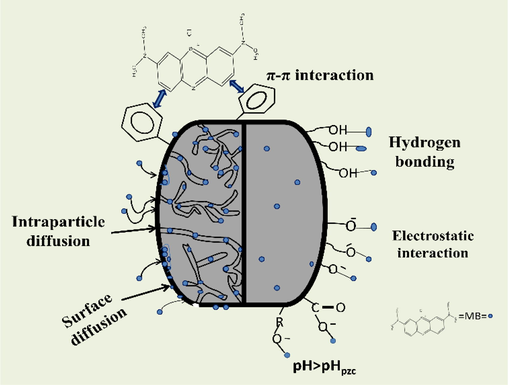
Mechanism of MB adsorption onto CCBC.
Table 7 lists a comparison of adsorptive removal of assorted dyes by CCBC prepared through various techniques.
CCBC preparation technique
Chemical treatment
removed dye
removal % and time
maximum adsorption capacity (mg/g)
Ref.
Pyrolysis at 450–550 °C
sulfuric acid
real textile dye wastewater
98% at 45 min
6.02
(Sonu et al., 2020)
Pyrolysis at 850 °C
potassium hydroxide
MB
99.05% at 180 min
2249
(Yu et al., 2019)
Burning in a chamber at 370–400 °C
–
MB
64% at 15 min
7.58
(Tsamo et al., 2019)
Carbonized at 400 °C
epichlorohydrin mediated composite with chitosan
MB
99.96%
499.8
(Liu et al., 2022)
Hydrothermal carbonization at 160 °C
Phosphoric acid
MB
80% at 120 min
140.25
(Wang et al., 2020)
Pyrolysis at 400 °C
triethylenetetramine
Tartrazine
sunset yellow90.02–90.42%
90.37–92.44%85.47
74.07(Mahmoud et al., 2020)
Pyrolysis at 500 °C
–
Brilliant green
91.7 % in 5 days
16.53
(Giri et al., 2020)
Pyrolysis at 700 °C
–
MB
97.72% at 30 min
20.41
This study*
5 Conclusion
A facile preparation technique using in-house built chamber and the potential of CCBC derived from Bangladeshi originated corncob in remediation of MB dye has been studied. Elemental analysis showed variation in wt% of the major elements (C, H, N, O) compared with other regional corncobs. Batch experiment governed the optimum conditions of the adsorption process in terms of dye concentration, adsorbent dose, time interval and pH of the medium. In addition, spontaneity of the process is also confirmed by thermodynamic study. Efficient extermination of MB by CCBC involved a number of mechanisms including surface diffusion, intra-particle diffusion, hydrogen bond interaction, π -π interaction and electrostatic interaction. Therefore, good removal efficacy of MB using CCBC proved that it can be utilized as an adsorbent for eradication of cationic dye from textile waste water.
CRediT authorship contribution statement
Nigar Sultana Pinky: Conceptualization, Methodology, Formal analysis, Investigation, Writing – original draft. Mashrafi Bin Mobarak: Writing – original draft, Writing – review & editing, Supervision. Sonjida Mustafi: Resources. Mohammad Zesanur Rahman: Formal analysis, Investigation. Aynun Nahar: Formal analysis, Investigation. Trissa Saha: Formal analysis, Investigation. Newaz Mohammed Bahadur: Resources.
Acknowledgement
The authors are gratefully acknowledging the support from BCSIR (R&D approval reference no.
39.02.0000.011.14.140.2021/1314; Date: 04/07/2022), We also appreciate all the supports from Dr. Shirin Akter Jahan through SIGCRT project. Special thanks to Dr. Samina Ahmed, Muhammad Shahriar Bashar, Dr. Sabina Yasmin and Md. Saiful Quddus for helping out with the lab facilities, EDX, elemental and BET analysis respectively.
Declaration of Competing Interest
The authors declare that they have no known competing financial interests or personal relationships that could have appeared to influence the work reported in this paper.
References
- The effect of pH on bioremediation potential for the removal of direct violet textile dye by Aspergillus niger. Desalination. 2009;249:1206-1211.
- [Google Scholar]
- Kinetics, equilibrium and thermodynamics studies of CI Reactive Blue 19 dye adsorption on coconut shell based activated carbon. Int. Biodeterior. Biodegrad.. 2015;102:265-273.
- [Google Scholar]
- Biowaste-derived hydroxyapatite for effective removal of reactive yellow 4 dye: equilibrium, kinetic, and thermodynamic studies. ACS Omega. 2018;3:1991-2000.
- [Google Scholar]
- Preparation and characterisation of biochars from elephant grass and their utilisation for aqueous nitrate removal: Effect of pyrolysis temperature. J. Environ. Chem. Eng.. 2020;8:104507
- [Google Scholar]
- Adsorption of methylene blue by acid and heat treated diatomaceous silica. Desalination. 2007;217:212-224.
- [Google Scholar]
- Mechanisms and adsorption capacities of biochar for the removal of organic and inorganic pollutants from industrial wastewater. Int. J. Environ. Sci. Technol.. 2021;18:3273-3294.
- [Google Scholar]
- Agricultural peels for dye adsorption: a review of recent literature. J. Mol. Liq.. 2014;200:381-389.
- [Google Scholar]
- Turning Leucaena leucocephala bark to biochar for soil application via statistical modelling and optimization technique. Ecol. Eng.. 2015;82:26-39.
- [Google Scholar]
- Evaluation of the adsorption kinetics and equilibrium for the potential removal of acid dyes using a biosorbent. Chem. Eng. J.. 2008;139:2-10.
- [Google Scholar]
- Adsorption of organic and inorganic pollutants onto biochars: challenges, operating conditions, and mechanisms. Bioresour. Technol. Rep.. 2021;15:100728
- [Google Scholar]
- Biosorption of nickel (II) and copper (II) ions by Sargassum sp. in nature and alginate extraction products. Bioresour. Technol. Rep.. 2019;5:43-50.
- [Google Scholar]
- On thermodynamics of adsorption in micropores. J. Colloid Interface Sci.. 1972;38:185-194.
- [Google Scholar]
- UV light assisted photocatalytic degradation of textile waste water by Mg0. 8-xZnxFe2O4 synthesized by combustion method and in-vitro antimicrobial activities. Environ. Res.. 2022;204:111917
- [Google Scholar]
- Utilization of agro-industrial and municipal waste materials as potential adsorbents for water treatment—a review. Chem. Eng. J.. 2010;157:277-296.
- [Google Scholar]
- Adsorption processes for water treatment and purification. Springer; 2017.
- Review of fast pyrolysis of biomass and product upgrading. Biomass Bioenergy. 2012;38:68-94.
- [Google Scholar]
- Elucidation of ibuprofen uptake capability of raw and steam activated biochar of Aegle marmelos shell: isotherm, kinetics, thermodynamics and cost estimation. Process Saf. Environ. Prot.. 2018;118:10-23.
- [Google Scholar]
- Chan, S.H.S., Yeong Wu, T., Juan, J.C., Teh, C.Y., 2011. Recent developments of metal oxide semiconductors as photocatalysts in advanced oxidation processes (AOPs) for treatment of dye waste-water. J. Chem. Technol. Biotechnol. 86, 1130–1158.
- Biomass-based pyrolytic polygeneration system on cotton stalk pyrolysis: influence of temperature. Bioresour. Technol.. 2012;107:411-418.
- [Google Scholar]
- Agrowaste derived biochars impregnated with ZnO for removal of arsenic and lead in water. J. Environ. Chem. Eng.. 2020;8:103800
- [Google Scholar]
- Zero-waste algal biorefinery for bioenergy and biochar: a green leap towards achieving energy and environmental sustainability. Sci. Total Environ.. 2019;650:2467-2482.
- [Google Scholar]
- Bio-oil production from pyrolysis of corncob (Zea mays L.) Biomass Bioenergy. 2012;36:43-49.
- [Google Scholar]
- Effects of temperature and particle size on bio-char yield from pyrolysis of agricultural residues. J. Anal. Appl. Pyrolysis. 2004;72:243-248.
- [Google Scholar]
- Towards biochar and hydrochar engineering—Influence of process conditions on surface physical and chemical properties, thermal stability, nutrient availability, toxicity and wettability. Energies. 2018;11:496.
- [Google Scholar]
- Current scenario and challenges in adsorption for water treatment. J. Environ. Chem. Eng.. 2020;8:103988
- [Google Scholar]
- Dubinin, M.M., 1947. The equation of the characteristic curve of activated charcoal, in: Dokl. Akad. Nauk. SSSR. pp. 327–329.
- Removal of a cationic dye–Basic Red 12–from aqueous solution by adsorption onto animal bone meal. J. Assoc. Arab Univ. Basic Appl. Sci.. 2012;12:48-54.
- [Google Scholar]
- The environmental applications of activated carbon/zeolite composite materials. Adv. Colloid Interface Sci.. 2011;162:22-28.
- [Google Scholar]
- Synthesis of pyrolyzed biochar and its application for dye removal: Batch, kinetic and isotherm with linear and non-linear mathematical analysis. Surf. Interfaces. 2020;20:100616
- [Google Scholar]
- Point of zero charge of maghemite decorated multiwalled carbon nanotubes fabricated by chemical precipitation method. J. Mol. Liq.. 2016;216:117-125.
- [Google Scholar]
- Adsorptive separation of toxic metals from aquatic environment using agro waste biochar: application in electroplating industrial wastewater. Chemosphere. 2021;262:128031
- [Google Scholar]
- Pyrolysis of sewage sludge for sustainable biofuels and value-added biochar production. J. Environ. Manage.. 2021;298:113450
- [Google Scholar]
- Reusability of brilliant green dye contaminated wastewater using corncob biochar and Brevibacillus parabrevis: hybrid treatment and kinetic studies. Bioengineered. 2020;11:743-758.
- [Google Scholar]
- Physicochemical and optical characterization of citrus aurantium derived biochar for solar absorber applications. Materials. 2021;14:4756.
- [Google Scholar]
- Gupta, V.K., Carrott, P.J.M., Ribeiro Carrott, M.M.L., Suhas, 2009. Low-cost adsorbents: growing approach to wastewater treatment—a review. Crit. Rev. Environ. Sci. Technol. 39, 783–842.
- Pyrolysis of chemically treated corncob for biochar production and its application in Cr (VI) removal. Environ. Prog. Sustain. Energy. 2018;37:1606-1617.
- [Google Scholar]
- Molecular structure of corncob-derived biochars and the mechanism of atrazine sorption. Agron. J.. 2013;105:773-782.
- [Google Scholar]
- Assessment of physical water scarcity in Africa using GRACE and TRMM satellite data. Remote Sens.. 2019;11:904.
- [Google Scholar]
- Helfferich, F.G., 1985. Principles of adsorption & adsorption processes, by DM Ruthven, John Wiley & Sons, 1984, xxiv+ 433 pp.
- Adsorptive separation of Cu (II) ions from aqueous medium using thermally/chemically treated Cassia fistula based biochar. J. Clean. Prod.. 2020;249:119390
- [Google Scholar]
- Pseudo-second order model for sorption processes. Process Biochem.. 1999;34:451-465.
- [Google Scholar]
- Synthesis and characterization of rice husk biochar via hydrothermal carbonization for wastewater treatment and biofuel production. Sci. Rep.. 2020;10:1-15.
- [Google Scholar]
- A review of biochar as a low-cost adsorbent for aqueous heavy metal removal. Crit. Rev. Environ. Sci. Technol.. 2016;46:406-433.
- [Google Scholar]
- Biochar-based composites for remediation of polluted wastewater and soil environments: Challenges and prospects. Chemosphere. 2022;297:134163
- [Google Scholar]
- Ultrasonic modified corn pith for the sequestration of dye from aqueous solution. J. Ind. Eng. Chem.. 2016;39:162-175.
- [Google Scholar]
- Pilot and full-scale applications of membrane processes for textile wastewater treatment: A critical review. J. Water Process Eng.. 2021;42:102172
- [Google Scholar]
- Arsenic removal using mesoporous alumina prepared via a templating method. Environ. Sci. Technol.. 2004;38:924-931.
- [Google Scholar]
- Characterization of slow pyrolysis biochars: effects of feedstocks and pyrolysis temperature on biochar properties. J. Environ. Qual.. 2012;41:990-1000.
- [Google Scholar]
- Biochar from oil palm biomass: A review of its potential and challenges. Renew. Sustain. Energy Rev.. 2014;39:729-739.
- [Google Scholar]
- Lead (II) adsorption onto sulphuric acid treated cashew nut shell. Sep. Sci. Technol.. 2011;46:2436-2449.
- [Google Scholar]
- A review on adsorptive separation of toxic metals from aquatic system using biochar produced from agro-waste. Chemosphere. 2021;285:131438
- [Google Scholar]
- Engineered biochar from wood apple shell waste for high-efficient removal of toxic phenolic compounds in wastewater. Sci. Rep.. 2021;11:1-17.
- [Google Scholar]
- The adsorption of gases on plane surfaces of glass, mica and platinum. J. Am. Chem. Soc.. 1918;40:1361-1403.
- [Google Scholar]
- Liu, L., Luo, X.-B., Ding, L., Luo, S.-L., 2019. Application of nanotechnology in the removal of heavy metal from water, in: Nanomaterials for the Removal of Pollutants and Resource Reutilization. Elsevier, pp. 83–147.
- Chitosan crosslinked composite based on corncob lignin biochar to adsorb methylene blue: Kinetics, isotherm, and thermodynamics. Colloids Surf. Physicochem. Eng. Asp.. 2022;642:128621
- [Google Scholar]
- Characterization of corncob-derived biochar and pyrolysis kinetics in comparison with corn stalk and sawdust. Bioresour. Technol.. 2014;170:76-82.
- [Google Scholar]
- Adsorption of methylene blue on biochar microparticles derived from different waste materials. Waste Manag.. 2016;49:537-544.
- [Google Scholar]
- Adsorptive removal of imidacloprid by potassium hydroxide activated magnetic sugarcane bagasse biochar: Adsorption efficiency, mechanism and regeneration. J. Clean. Prod.. 2021;292:126005
- [Google Scholar]
- Adsorption of negatively charged food tartrazine and sunset yellow dyes onto positively charged triethylenetetramine biochar: Optimization, kinetics and thermodynamic study. J. Mol. Liq.. 2020;318:114297
- [Google Scholar]
- Do you BET on routine? The reliability of N2 physisorption for the quantitative assessment of biochar’s surface area. Chem. Eng. J.. 2021;418:129234
- [Google Scholar]
- Efficiently activated carbons from corn cob for methylene blue adsorption. Appl. Surf. Sci. Adv.. 2021;3:100037
- [Google Scholar]
- Kinetics and thermodynamic study of phosphate adsorption on iron hydroxide-eggshell waste. Chem. Eng. J.. 2009;147:87-96.
- [Google Scholar]
- Study of removal of azo dye by functionalized multi walled carbon nanotubes. Chem. Eng. J.. 2010;162:1026-1034.
- [Google Scholar]
- Probing the photocatalytic competency of hydroxyapatite synthesized by solid state and wet chemical precipitation method. J. Mol. Struct.. 2022;1252:132142
- [Google Scholar]
- Slow pyrolysis of cassava wastes for biochar production and characterization. Iran. Iran. J. Energy Environ.. 2012;3
- [Google Scholar]
- Biochar production and applications in soil fertility and carbon sequestration–a sustainable solution to crop-residue burning in India. RSC Adv.. 2018;8:508-520.
- [Google Scholar]
- Application of efficient magnetic particles and activated carbon for dye removal from wastewater. ACS Omega. 2020;5:20684-20697.
- [Google Scholar]
- Bio-oil and bio-char production from corn cobs and stover by fast pyrolysis. Biomass Bioenergy. 2010;34:67-74.
- [Google Scholar]
- Biochar as an exceptional bioresource for energy, agronomy, carbon sequestration, activated carbon and specialty materials. Waste Biomass Valorization. 2016;7:201-235.
- [Google Scholar]
- Removal of methylene blue from water using okra (Abelmoschus esculentus L.) mucilage modified biochar. Bioresour. Technol. Rep.. 2021;14:100689
- [Google Scholar]
- Preparation of immobilized activated carbon-polyvinyl alcohol composite for the adsorptive removal of 2, 4-dichlorophenoxyacetic acid. J. Water Process Eng.. 2018;25:269-277.
- [Google Scholar]
- Co-gasification of woody biomass and chicken manure: Syngas production, biochar reutilization, and cost-benefit analysis. Energy. 2017;139:732-742.
- [Google Scholar]
- Development of maize cob-based biochar filter for water purification. Water Environ. J.. 2021;35:349-358.
- [Google Scholar]
- Nanofiltration hollow fiber membranes for textile wastewater treatment: Lab-scale and pilot-scale studies. Chem. Eng. Sci.. 2014;114:51-57.
- [Google Scholar]
- A study on effects of pH, adsorbent dosage, time, initial concentration and adsorption isotherm study for the removal of hexavalent chromium (Cr (VI)) from wastewater by magnetite nanoparticles. Procedia Technol.. 2016;24:585-594.
- [Google Scholar]
- Occurrence of contaminants in drinking water sources and the potential of biochar for water quality improvement: A review. Crit. Rev. Environ. Sci. Technol.. 2020;50:549-611.
- [Google Scholar]
- Petronijević, M., Panić, S., Savić, S., Agbaba, J., Jazić, J.M., Milanović, M., \DJurišić-Mladenović, N., 2021. Characterization and application of biochar-immobilized crude horseradish peroxidase for removal of phenol from water. Colloids Surf. B Biointerfaces 208, 112038.
- Pohanish, R.P., 2017. Sittig’s handbook of toxic and hazardous chemicals and carcinogens. William Andrew.
- Use of biochar-based column filtration systems for greywater treatment: A systematic literature review. J. Water Process Eng.. 2022;48:102908
- [Google Scholar]
- Influence of pyrolysis temperature on physico-chemical properties of corn stover (Zea mays L.) biochar and feasibility for carbon capture and energy balance. PloS One. 2016;11:e0156894.
- [Google Scholar]
- High-temperature pyrolysis of blended animal manures for producing renewable energy and value-added biochar. Ind. Eng. Chem. Res.. 2010;49:10125-10131.
- [Google Scholar]
- Processing of rice straw to derive carbon with efficient de-fluoridation properties for drinking water treatment. J. Water Process Eng.. 2020;34:101136
- [Google Scholar]
- Adsorption of tetracycline antibiotic from aqueous solutions onto vitamin B6-upgraded biochar derived from date palm leaves. J. Mol. Liq.. 2020;318:114126
- [Google Scholar]
- Shahmirzadi, M.A.A., Kargari, A., 2018. Nanocomposite membranes, in: Emerging Technologies for Sustainable Desalination Handbook. Elsevier, pp. 285–330.
- A review of biochar-based sorbents for separation of heavy metals from water. Int. J. Phytoremed.. 2020;22:111-126.
- [Google Scholar]
- Removal of atrazine as an organic micro-pollutant from aqueous solutions: a comparative study. Process Saf. Environ. Prot.. 2016;103:23-35.
- [Google Scholar]
- Hydrothermal synthesis of CuMn2O4/CuO nanocomposite without capping agent and study its photocatalytic activity for elimination of dye pollution. Int. J. Hydrog. Energy 2022
- [Google Scholar]
- Biochar, climate change and soil: A review to guide future research. CSIRO Land Water Sci. Rep.. 2009;5:17-31.
- [Google Scholar]
- Enhanced decolorization and treatment of textile dye wastewater through adsorption on acid modified corncob derived biochar. ChemistrySelect. 2020;5:12287-12297.
- [Google Scholar]
- Review of the stability of biochar in soils: predictability of O: C molar ratios. Carbon Manag.. 2010;1:289-303.
- [Google Scholar]
- Biochar as an eco-friendly and economical adsorbent for the removal of colorants (dyes) from aqueous environment: A review. Water. 2020;12:3561.
- [Google Scholar]
- Characterization of biochars produced from residues from biogas production. J. Anal. Appl. Pyrolysis. 2015;115:157-165.
- [Google Scholar]
- Preparation and characterization of biochar derived from the fruit seed of Cedrela odorata L and evaluation of its adsorption capacity with methylene blue. Sustain. Chem. Pharm.. 2021;21:100421
- [Google Scholar]
- Computation of adsorption parameters for the removal of dye from wastewater by microwave assisted sawdust: theoretical and experimental analysis. Environ. Toxicol. Pharmacol.. 2017;50:45-57.
- [Google Scholar]
- Evaluation of the effectiveness and mechanisms of acetaminophen and methylene blue dye adsorption on activated biochar derived from municipal solid wastes. J. Environ. Manage.. 2018;210:255-262.
- [Google Scholar]
- Facile synthesis of corncob biochar via in-house modified pyrolysis for removal of methylene blue in wastewater. Mater. Res. Express. 2020;7:015518
- [Google Scholar]
- Toward real textile wastewater treatment: Membrane fouling control and effective fractionation of dyes/inorganic salts using a hybrid electrocoagulation–Nanofiltration process. Sep. Purif. Technol.. 2019;216:115-125.
- [Google Scholar]
- Kinetics of ammonia synthesis on promoted iron catalysts. Acta Physiochim. URSS. 1940;12:327-356.
- [Google Scholar]
- Nitrogen conversion in relation to NH3 and HCN during microwave pyrolysis of sewage sludge. Environ. Sci. Technol.. 2013;47:3498-3505.
- [Google Scholar]
- Discoloration of methylene blue and slaughter house wastewater using maize cob biochar produced using a constructed burning chamber: a comparative study. Sci. Afr.. 2019;3:e00078.
- [Google Scholar]
- A review on recent trends in the removal of emerging contaminants from aquatic environment using low-cost adsorbents. Chemosphere. 2022;287:132270
- [Google Scholar]
- Amorphous carbon chips li-ion battery anodes produced through polyethylene waste upcycling. ACS Omega. 2018;3:17520-17527.
- [Google Scholar]
- Sorption of brilliant green dye using soybean straw-derived biochar: characterization, kinetics, thermodynamics and toxicity studies. Environ. Geochem. Health. 2021;43:2913-2926.
- [Google Scholar]
- Adsorption and competition investigation of phenolic compounds on the solid-liquid interface of three-dimensional foam-like graphene oxide. Chem. Eng. J.. 2019;378:122085
- [Google Scholar]
- Carbon composite lignin-based adsorbents for the adsorption of dyes. Chemosphere. 2018;206:587-596.
- [Google Scholar]
- Sorption and recovery of phenolic compounds from aqueous phase of sewage sludge hydrothermal liquefaction using bio-char. Chemosphere. 2022;287:131934
- [Google Scholar]
- Synthesis of Cordyceps fumosorosea-biochar nanoparticles and their effects on growth and survival of Bemisia tabaci (Gennadius) Front. Microbiol.. 2021;12:630220
- [Google Scholar]
- One-step fabrication of carbonaceous adsorbent from corncob for enhancing adsorption capability of methylene blue removal. Sci. Rep.. 2020;10:1-9.
- [Google Scholar]
- Kinetics of adsorption on carbon from solution. J. Sanit. Eng. Div.. 1963;89:31-59.
- [Google Scholar]
- Pyrolysis behaviors of rice straw, rice husk, and corncob by TG-MS technique. J. Anal. Appl. Pyrolysis. 2007;78:265-271.
- [Google Scholar]
- High-efficiency removal of dyes from wastewater by fully recycling litchi peel biochar. Chemosphere. 2020;246:125734
- [Google Scholar]
- A critical review on the biochar production techniques, characterization, stability and applications for circular bioeconomy. Biotechnol. Rep.. 2020;28:e00570.
- [Google Scholar]
- Synthesis and characterization of magnetic ZnCl2-activated carbon produced from coconut shell for the adsorption of methylene blue. J. Mol. Struct.. 2021;1232:130071
- [Google Scholar]
- ZnCl2 modified biochar derived from aerobic granular sludge for developed microporosity and enhanced adsorption to tetracycline. Bioresour. Technol.. 2020;297:122381
- [Google Scholar]
- Adsorption of hexavalent chromium from aqueous solution by activated carbon prepared from longan seed: Kinetics, equilibrium and thermodynamics. J. Ind. Eng. Chem.. 2015;21:414-422.
- [Google Scholar]
- Laundry wastewater treatment using a combination of sand filter, bio-char and teff straw media. Sci. Rep.. 2019;9:1-11.
- [Google Scholar]
- Facile fabrication of biochar from palm kernel shell waste and its novel application to magnesium-based materials for hydrogen storage. Materials. 2020;13:625.
- [Google Scholar]
- Corncob-to-xylose residue (CCXR) derived porous biochar as an excellent adsorbent to remove organic dyes from wastewater. Surf. Interface Anal.. 2019;51:234-245.
- [Google Scholar]
- Synthesis of CaWO4-biochar nanocomposites for organic dye removal. Mater. Res. Bull.. 2019;110:169-173.
- [Google Scholar]
- New use for biochar derived from bovine manure for tetracycline removal. J. Environ. Chem. Eng.. 2021;9:105585
- [Google Scholar]
- Effect of temperature on the structural and physicochemical properties of biochar with apple tree branches as feedstock material. Energies. 2017;10:1293.
- [Google Scholar]
- Removal of methylene blue from aqueous solution by cattle manure-derived low temperature biochar. RSC Adv.. 2018;8:19917-19929.
- [Google Scholar]
- P.K. Malik, Dye removal from wastewater using activated carbon developed from sawdust: adsorption equilibrium and kinetics, Journal of Hazardous Materials, Volume 113, Issues 1–3, 2004, Pages 81-88, ISSN 0304-3894,


