

Translate this page into:
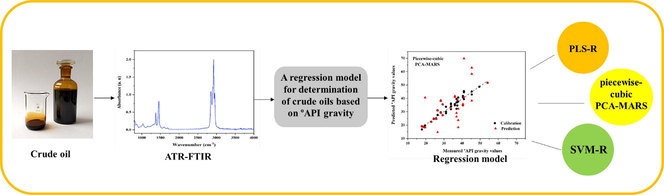
Application of robust principal component analysis–multivariate adaptive regression splines for the determination of °API gravity in crude oil samples using ATR-FTIR spectroscopy
⁎Corresponding authors. m.mohammadi70.ac@gmail.com (Mahsa Mohammadi), m.khanmohammadi@SCI.ikiu.ac.ir (Mohammadreza Khanmohammadi Khorrami)
-
Received: ,
Accepted: ,
This article was originally published by Elsevier and was migrated to Scientific Scholar after the change of Publisher.
Peer review under responsibility of King Saud University.
Abstract
Abstract
The robust principal component analysis-multivariate adaptive regression splines (r-PCA-MARS) has been applied and verified for analysis of the quantitative determination of American Petroleum Institute (°API) gravity values in crude oils. Seven principal component (PC) scores using 95.00% variance by principal component analysis (PCA) were applied as inputs in the MARS model. The calibration and prediction sets were obtained using duplex algorithm for the construction of the model and the then for the validation of the model. The calibration set (67*7) was used for the r-PCA-MARS model. The partial least squares regression (PLS-R), and support vector machine regression (SVM-R) models were utilized for comparison the quantitative value of the °API gravity in crude oils. In this paper, we also conducted a comparison study of Kennard-stone (KS) and duplex splitting methods on PLS-R and SVM-R models. The efficiency of the r-PCA-MARS model was evaluated using coefficient of determination (R2), R2 estimated by generalized cross-validation (R2GCV), root mean square error of calibration (RMSEC), root mean square error of prediction (RMSEP), and mean absolute error (MAE). The optimal r-PCA-MARS model uses 32 basis functions to characterize the °API gravity values in crude oils. The correlation coefficients value for calibration and prediction sets were 0.997 and 0.926, respectively. The RMSEC, RMSEP, MAE, and R2GCV in the piecewise-cubic r-PCA-MARS model was 6.726*10-13, 0.538, 0.290 and 0.988, respectively. According to the results, the r-PCA-MARS model provided high efficiency than commonly used regression models for prediction of °API gravity values in crude oils. The result of this study confirmed that the r-PCA-MARS model is the best model with more successful than the PLS-R and SVM-R models. It can be concluded that the r-PCA-MARS model is an appropriate model for describing the physicochemical properties of crude oil samples in the oil industry.
Keywords
ATR-FTIR
°API gravity
Crude oil
r-PCA-MARS

1 Introduction
Crude oil is a fossil fuel and nonrenewable source of energy in the world. Crude oils are complex compound of saturated and aromatic hydrocarbons and heteroatoms (Nitrogen, Sulfur, Oxygen). This make considerable variation in physicochemical properties of crude oil samples. Investigation different physicochemical properties of crude oils such as SARA analysis, viscosity, pour point and °API gravity is important in oil industries. The °API gravity and viscosity as physical properties of crude oil samples have an important role in determining the economic value and consumption of crude oil samples (Speight and Wiley, 2015; Hydrocarbons and Hydrocarbons, 2018; Panda et al., 2009; Carbognani et al., 2003; Cristina et al., 2018; Ram and Potosí, 2016; Santos et al., 2014; Rodrigues et al., 2018). The importance of determining the physicochemical properties of crude oil is very fundamental in the oil industry (Fan and Buckley, 2002; Ver et al., 2019; Ahmed et al., 2010; Riley et al., 2016).
One of the types of crude oil classification is based on °API gravity. The classification of heavy and light crude oil is based on the °API gravity value, which is measured as density of the crude oil relative to water. Classification of crude oils based on °API gravity is shown as light, medium and heavy. Heavy crude oil has an °API gravity less than 22.3, the °API gravity value of medium and light crude oils are in the range of 22.3 and 31.1 and equal to or > 31.1, respectively. Heavy oils have a high density and light oils have a lower density. In general, samples with higher °API gravity show an abundance of light hydrocarbons in their composition, whereas those with lower °API values present higher levels of asphaltenes and resins. °API gravity is also a criterion for estimating the price of the crude oil and the derivatives that may be obtained from the material. Although classification of crude oils based °API gravity values are acceptable, but in this situation, some crude oils with same value of °API gravity show different physical properties. This indicates different chemical properties in the structure of crude oil. Therefore, it is necessary to provide a high accuracy method for analysis of crude oil samples. Most of the standard methods for crude oil analysis have been reported according to the American Society for Testing and Materials (ASTM), American Petroleum Institute (API) and Energy Institute (EI). However, the standard methods are expensive and not environmentally friendly. Therefore, it is necessary to provide novel analytical methods to evaluate the properties of crude oil samples. In recent years, there have been successful applications of spectroscopy associated to chemometrics methods for determination of the properties of crude oil samples.
In this study, the robust-principle component analysis (r-PCA) in combination with the multivariate adaptive regression splines (MARS) method is introduced as an advanced modeling for the determination of °API gravity in crude oil samples using attenuated total reflection –Fourier transform infrared (ATR-FTIR) spectroscopy. While special attention is given to environmental considerations when choosing standard methods, the proposed method provides a fast and simple technique. Due to the lack of the need to use toxic solvents and the very limited need for sample preparation, the proposed method is introduced as a complementary method to the conventional standard and reference analysis for determining the °API gravity in crude oil samples.
Although analytical methods (such as mass spectrometry, NMR spectroscopy) are efficient tool for the structure analysis of crude oils but them have some disadvantage such as take a long time for analysis, expensive and not eco-friendly (Borisov et al., 2019; Rakhmatullin et al., 2018; Filgueiras et al., 2016; Iravani, 2018; Bagheri Garmarudi et al., 2019; Talpur et al., 2015; Elvira et al., 2019; Brown and Lynch, 2007). Previously an approach has been reported for determination and classification of crude oils using partial least square regression (PLS-R) and support vector machine regression (SVM-R) (Mohammadi et al., 2020). The present work proposed a quantitative method for determination of °API gravity in crude oil samples using ATR-FTIR spectroscopy. The r-PCA in combination with the MARS method is as an advanced modeling for the determination of °API gravity in crude oil samples using ATR-FTIR spectroscopy due to reduce the number of redundant input variables (Friedman and Roosen, 1995; Samui, 2013; Jekabsons, 2011; Wang et al., 2020; Mukkamala et al., 2006; Vyas et al., 2021; Pitmann and McCulloch, 2002; Kisi and Parmar, 2016, Friedman, 1991). Although MARS method has been successfully applied as one of the most outstanding method for regression in highly nonlinear systems, limited works have been reported in the field of crude oil samples prediction.
For comparison the result of regression models for determination of °API gravity value of crude oil samples, we compared the efficiency of three methods: piecewise-cubic rPCA-MARS, PLS-R and SVM-R (Rodrigues et al., 2018; Sadrara and Khanmohammadi, 2023; Samui, 2013; Santos et al., 2014; Smola and Schölkopf, 2004; Speight and Wiley, 2015, Chen et al., 2007, Devrim et al., 2014, Geladi and Kowalski, 1986, Olivieri, 2018, Parhizkar et al., 2017). The combination of ATR-FTIR spectroscopy with chemometrics has shown the ability to analyze crude oil samples. The rPCA-MARS method was proposed to determine the quantitative value of °API gravities of crude oil samples to find the best correlation between the chemical structure of ATR-FTIR spectra of crude oil samples and the °API gravities of these samples.
2 Material and method
2.1 Chemometrics procedures
Principal component analysis-multivariate adaptive regression splines (PCA-MARS).
The MARS model as a multivariate regression method, proposed by Jerome Friedman, is a flexible model in spline fitting that can be used for high dimensional data. The data in the MARS model are divided into several parts, which are proportional to the spline functions in each part.
The Eq. (1) and Eq. (2) are truncated functions, which are separated from each other by a so-called knot location.
The spline functions describing are
and
. In the first step, the splines and the knot location are selected in MARS model that the best describe the response variable. In a second step, the base functions are assembled into a multidimensional model, that describe the response. The MARS model equation is given as follow Eq. (3)
Where
as a complexity criteria in the model as follows Eq. (5):
In equation, is the non constant basis function and defined as cost for each basis function. Finally, the selection optimum MARS model is based on evaluation the predicted parameters such as cross validation or new test set data. The details about MARS model are given in literature (Stevens, 1991; Talpur et al., 2015; Taylan et al., 2010; Thomas and Haaland, 1990; Ahmed et al., 2010; Massart et al., 1998).
2.2 Sample preparation and ATR-FTIR spectroscopy measurement
In this study, for construction of regression models 20 different crude oils samples were used. The °API gravity of the samples was measured using the ISO 12185–96 standard. The °API gravity is computed according to the Eq. (6). In °API gravity measurement, specific gravity is density of crude oil into the density of water at 15.6 °C (60 °F), and 1 atm. (Density was measured using a digital automatic densimeter).
The spectral data were accumulated in the range of 800 – 4000 cm−1 by FTIR spectrometer (Nicolet, Madison, WI, USA), that is equipped with a horizontal zinc-selenide attenuated reflector. The data were acquired using 16 scans and resolution 4 cm−1. Fig. 1. shows the ATR-FTIR spectra of crude oil sample in the range of 800–4000 cm−1. The crude oil samples were replicated 5 times to achieve enough spectral data for statistical analysis. In chemometrics methods, when the number of data is small an approach is to repeat the number of spectra to obtain enough the number of data for analysis (Ver et al., 2019). In this work, our aim is to investigate the relationship between chemical structure of crude oil samples and °API gravity of these samples. The procedure was based on the °API gravity determination of ATR-FTIR spectra of crude oil samples.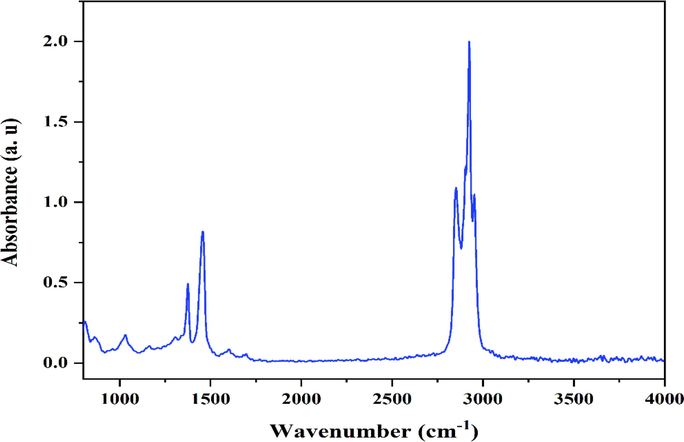
The ATR-FTIR of crude oil sample.
2.3 Data analysis
At first, all ATR-FTIR spectroscopy measurements were digitalized using an Omnic software. Then, data were preprocessed by baseline correction and standard normal variate (SNV) methods. A main step in construct the calibration model is to all spectral data divided into two sets. A set of 100 samples were applied. 67 samples were used as the calibration set and for evaluation of calibration model, 33 independent samples were used as the prediction set. The all spectral data divided by the duplex algorithm. Three different regression models were performed for determination of °API gravity value in crude oil samples. The PLS-R and SVM-R as traditional models were applied using the Unscrambler V-10.5 (CAMO software AS, Oslo, Norway). The rPCA-MARS as robust model was obtained in MATLAB software. Piecewise-cubic MARS method regression were performed in Matlab using the Matlab-file was written by M. Khanmohammadi Khorrami. The flowchart of the data analysis shown in Fig. 2.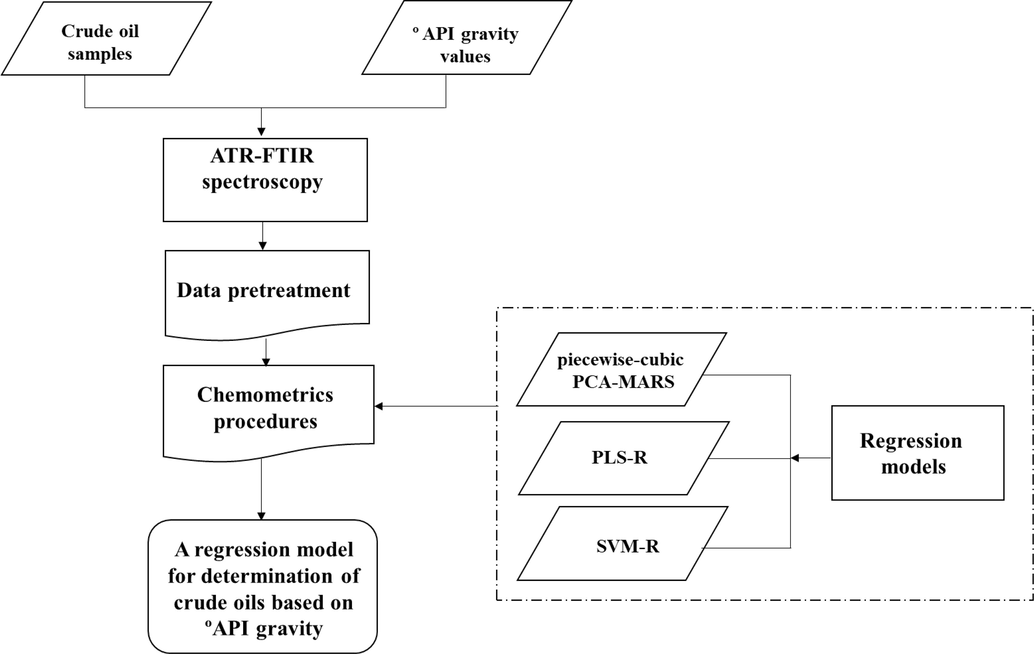
Flowchart of the chemometrics analysis.
3 Result and discussion
3.1 A comparative study of different splitting methods with PLS-R and SVM-R models
Data segmentation is an important step for building a calibration model. This approach consists of dividing the samples into the calibration and prediction data sets. The calibration set is used for construction of model and the prediction set applied for model validation. Splitting the data into calibration and prediction data sets is technique commonly used in data analysis. In order to construction calibration model based train data set and estimate the model efficiency using test data set. Commonly used methods are the random selection (RS), Kennard-Stone (KS) and duplex algorithms. The RS works randomly and the KS works based on Euclidian distance calculation between the samples (Vyas et al., 2021; Wang et al., 2020; Kennard and Stone, 1969; Reitermanov, 2010). The duplex algorithm is similar to the KS algorithm but allows to select both calibration and validation points that are independent. The duplex algorithm for calibration model, choosing the pair of points that are the most distant from each other. Then, for validation of model, selecting the pair of points which are farthest apart. Two kind of splitting method were used in order to comparison the effect of the algorithm used for training/test splitting on the result of regression models. The KS and duplex algorithms were applied for comparative the result of PLS-R and SVM-R models. The result of regression models for each calibration model PLS-R and SVM-R based on splitting method as shown in Table. 1. The root mean square error for calibration (RMSEC) and the correlation coefficient (R2) of regression models were calculated. The RMSE was calculated according to Eq.7. where, Y^i is the predicted value by the calibration model and yi is the reference value of the ith observation. In the mentioned equation, n is the number of samples in calibration or prediction set.
Model
Splitting method
R2 cal.
RMSEC
PLS-R
K-S
0.937
2.208
Duplex
0.944
2.310
SVM-R
K-S
0.958
2.006
Duplex
0.988
1.088
In this study, the results of SVM-R as a non-linear model were acceptable for prediction of °API gravity values of crude oil samples. The RMSEC values using duplex algorithm for PLS-R and SVM-R were 1.088 and 2.310 respectively. According to the result that obtained using different splitting methods, it was found that the result of regression model in duplex algorithm for calibration set is better than the result of KS algorithm.
3.2 Analyses using rPCA-MARS
An important step in the MARS model is that the number of observations is greater than the number of variables. In order to reduce the number of variables and reduce the size of raw data, the rPCA model was used. The data were preprocessed using baseline correction and standard normal variate SNV method before using for decomposed to obtain PC scores and rPCA-MARS model. The seven PCs with total explained variance close to 95% were extracted using rPCA model from the 100 *1661 data matrix. Therefore, the raw data matrix from the dimensions of 100*1661 reach to 100*7. The all data set splitted using duplex algorithm into calibration and prediction sets due to 67*7 and 33*7 dimensions, respectively.
3.2.1 Analysis of variance (ANOVA)
The r-PCA-MARS model was executed based on piecewise-cubic algorithm. The BFs in rPCA-MARS model are applied to obtain the best prediction responses. In order to combine the different (BFs) to reach the prediction responses and for avoiding overfitting of model, the infeasible BFs are removed by backward stepwise in the final rPCA-MARS model. Fig. 3. show the Plot of coefficient of determination R2, R2 estimated by generalized cross-validation (R2GCV), mean square error (MSE) and generalized cross-validation (GCV) versus number of basis functions for piecewise-cubic MARS models. The optimized model is created in conditions that the lowest GCV and the highest R2 GCV were achieved. The final optimum model was selected using 32 BFs. The list of basis functions for piecewise-cubic algorithm is presented in Table. 2. The equation of the optimum piecewise-cubic MARS model due to interaction between basis functions is given by the following Eq. (8).
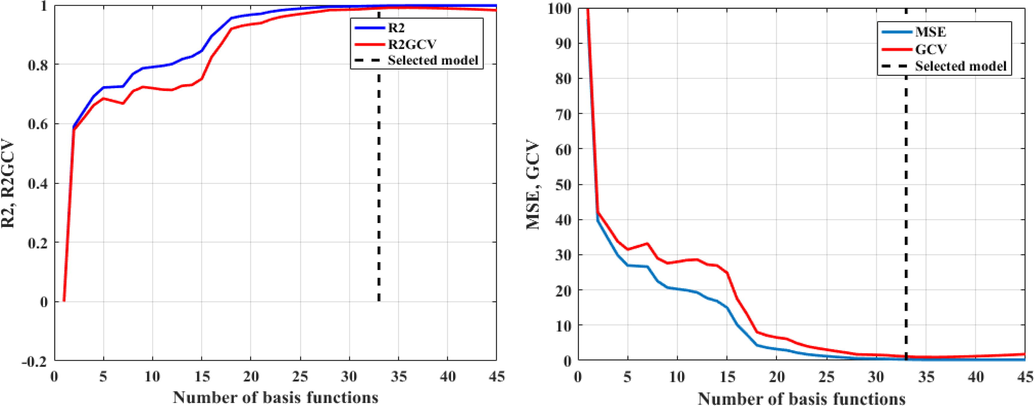
Plot of coefficient of determination (R2), R2 estimated by generalized cross-validation (R2GCV), mean square error (MSE) and generalized cross-validation (GCV) versus number of basis functions for piecewise-cubic MARS model.
Number
Basis function (piecewise-cubic model)
BF1
BF1 = C (x1|-1, −0.93853, −0.88592,0.40593)
BF2
BF2 = C (x3|+1,0.054162,0.37963,0.6841)
BF3
BF3 = C (x3|-1,0.054162,0.37963,0.6841)
BF4
BF4 = BF1 * C(x2|+1,0.54797,0.73285,1.6174)
BF5
BF5 = BF1 * C(x2|-1,0.54797,0.73285,1.6174)
BF6
BF6 = C(x1|-1,0.40593,1.6978,1.7022) * C(x2|+1,0.22966,0.36309,0.54797)
BF7
BF7 = C (x1|-1,0.40593,1.6978,1.7022) * C(x2|-1,0.22966,0.36309,0.54797)
BF8
BF8 = BF3 * C(x4|+10.041262,0.14639,0.46804)
BF9
BF9 = BF3 * C(x4|-10.041262,0.14639,0.46804)
BF10
BF10 = C(x1|+1,1.7614,1.8163,2.6276)
BF11
BF11 = C(x1|-1,1.7614,1.8163,2.6276)
BF12
BF12 = C (x4| +1, −0.25131, −0.22891, −0.041262)
BF13
BF13 = C(x4|-1,-0.25131,-0.22891,-0.041262)
BF14
BF14 = BF12 * C(x3|+1,0.6841,0.98857,1.1534)
BF15
BF15 = BF12 * C(x3|-1,0.6841,0.98857,1.1534)
BF16
BF16 = C(x5|+1,0.29471,0.39079,0.75408)
BF17
BF17 = C(x5|-1,0.29471,0.39079,0.75408)
BF18
BF18 = BF3 * C (x1|+1, −1.3762, −1.299, −1.1451)
BF19
BF19 = BF1 *C (x5|+1, −0.29047,0.19862,0.29471)
BF20
BF20 = BF1 * C (x5|-1, −0.29047,0.19862,0.29471)
BF21
BF21 = BF16 * C(x1|+1,1.7022,1.7065,1.7614)
BF22
BF22 = BF16 * C(x1|-1,1.7022,1.7065,1.7614)
BF23
BF23 = BF13*C (x2|+1, 0.97157,0.096233,0.22966)
BF24
BF24 = BF13 * C(x2|-1,-0.97157,0.096233,0.22966)
BF25
BF25 = BF16 * C (x1|+1, −1.1451, −0.99114,-0.93853)
BF26
BF26 = BF3 * C (x1|+1, −2.0329,-1.4533,-1.3762)
BF27
BF27 = BF3 * C (x1|-1, −2.0329, −1.4533,-1.3762)
BF28
BF28 = BF11 * C(x3|-1, −1.0176,-0.27131,0.054162)
BF29
BF29 = C(x7|-1, −0.40658,-0.079666,0.30303)
BF30
BF30 = C(x4|-1,-0.84129,-0.27371,-0.25131)
BF31
BF31 = C(x2|+1, −0.97157,0.096233,0.22966)
BF32
BF32 = C(x2|-1, −0.97157,0.096233,0.22966)
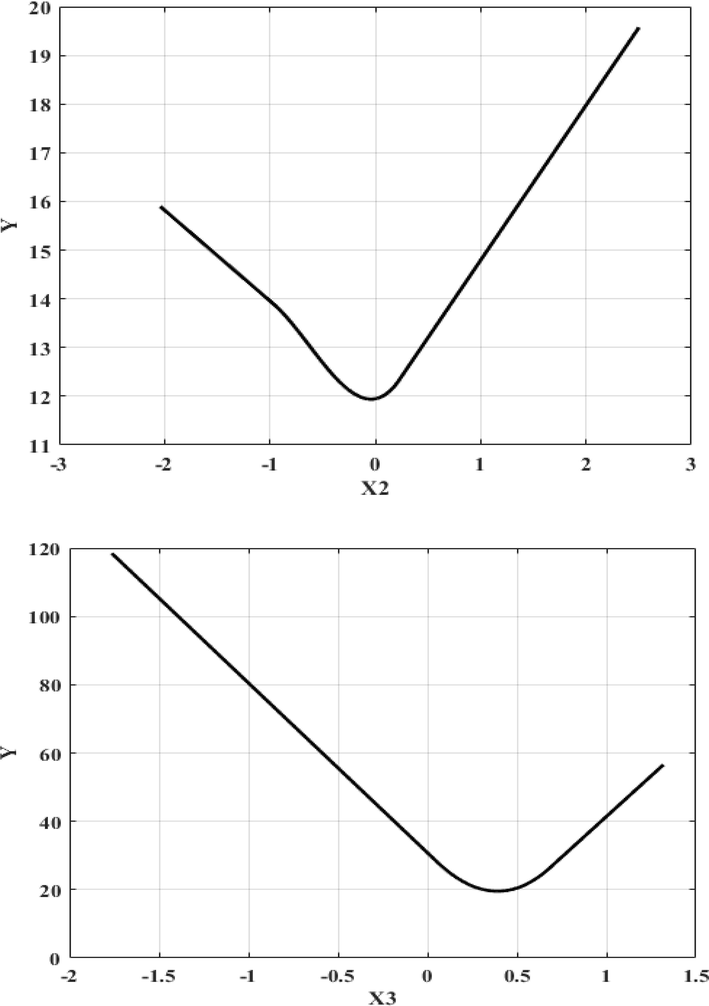
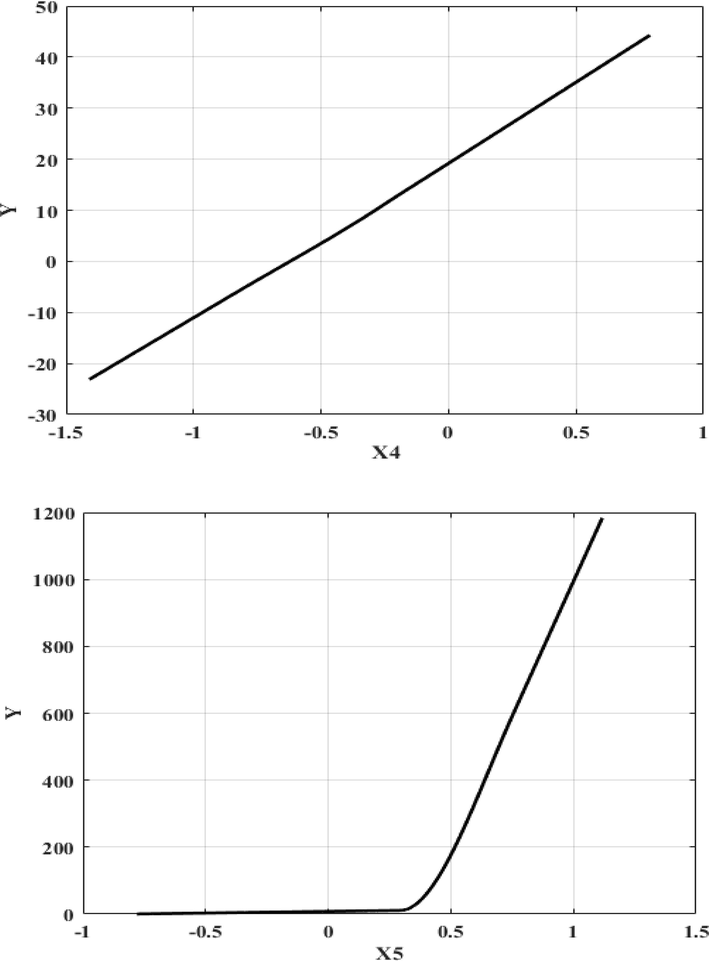
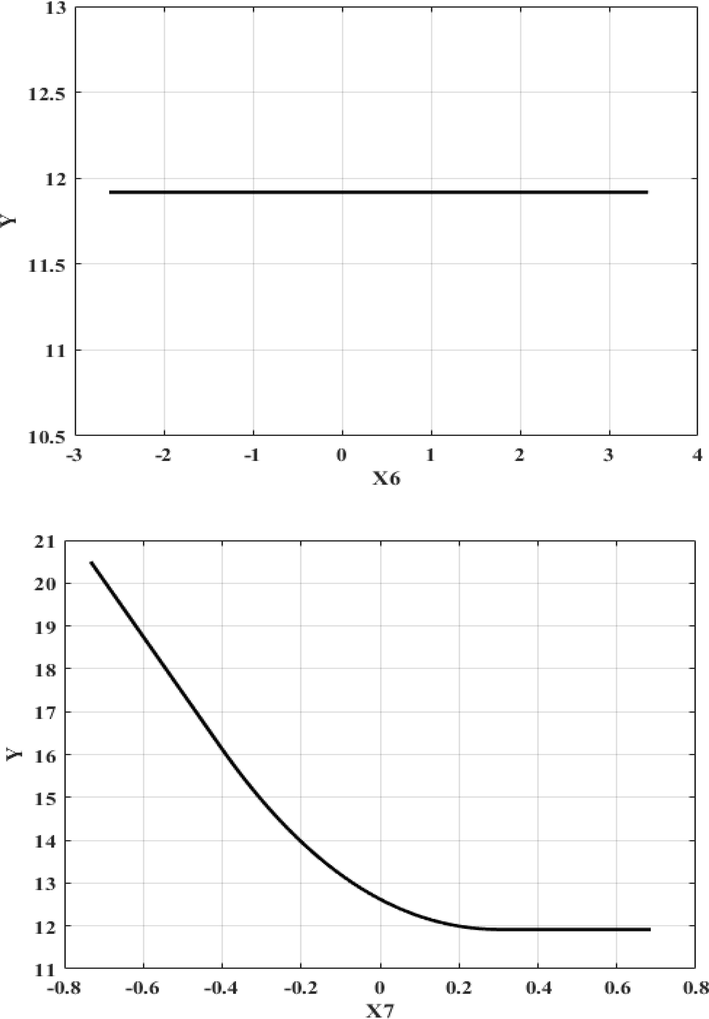
In ANOVA results of rPCA-MARS model, the value of the standard deviation of the function (STD) and the function number showed the efficiency of the model. The number of BFs, R2 GCV and the predictor variables of the ANOVA result were listed in the Table. 3. Based on ANOVA decomposition, 11 basis factions are presented. In the Table. 4. estimated input variable importance of piecewise-cubic MARS model for °API gravity determination in crude oil samples are presented. The delGCV value indicated the relative importance of a variable. The result showed the input variables of x1 and x4 including maximum of features importance. Using the delGCV values, the best variable takes the highest value of GCV equal to 100 and the variable with less important take a 0 value that it is not used by the MARS model. The nSubsets value indicates the number of subsets that each variable included. The variable with more subsets is more important in model. The value of subsGCV is similar to the value of subsRSS. However, in subsGCV the GCV and in subsRSS the residual sum of squares (RSS) were used. The subsRSS measures the amount of reduction in the RSS for each subset compared to the previous subset. The variables with larger reduction value in RSS are more important in construction of model. The main and interaction effects of independent variables on response variable can be determined using the MARS model. Figs. 4 and 5. which provide graphical representation of MARS model, are considered. Fig. 4. show the singular effect of independent variables (x1, x2, x3, x4, x5, x6 and x7) on response variable of piecewise-cubic MARS model and Fig. 5. illustrate 3D graph of piecewise-cubic MARS modeling of °API gravity determination in crude oil samples. In Fig. 4. the knot locations for (x1, x2, x3, x4, x5, and x7) are presented.
Function
STD
GCV
R2 GCV
#Basis
#Params
Variables
1
11.228
20.471
0.794
3
3.00
1
2
1.970
15.940
0.840
2
2.00
2
3
23.929
27.324
0.725
2
2.00
3
4
16.190
36.817
0.630
3
3.00
4
5
199.182
26.104
0.738
2
2.00
5
6
1.948
17.311
0.826
1
1.00
7
7
8.821
31.664
0.682
4
4.00
1 2
8
13.370
26.300
0.736
4
4.00
1 3
9
196.929
30.860
0.690
5
5.00
1 5
10
4.781
26.995
0.729
2
2.00
2 4
11
18.797
44.511
0.553
4
4.00
3 4
Variable
delGCV
nSubsets
subsRSS
subsGCV
1
100.000
31
100.000
100.000
2
36.910
29
35.625
37.337
3
44.685
24
22.972
28.180
4
49.899
24
22.972
28.180
5
31.561
30
40.716
41.454
6
0.000
0
0.000
0.00
unused
7
2.464
14
4.100
6.879
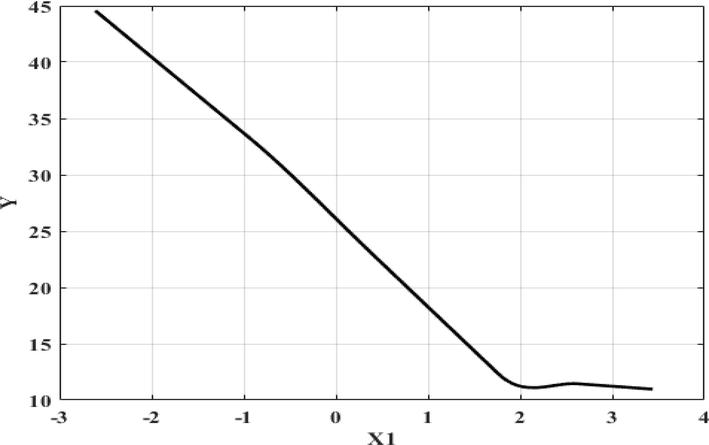
Plot of main factor effect of independent variables (x1, x2, x3, x4, x5, x6 and x7) against responses variable of piecewise-cubic MARS model for determination of °API gravity in crude oil samples.
Plot of main factor effect of independent variables (x1, x2, x3, x4, x5, x6 and x7) against responses variable of piecewise-cubic MARS model for determination of °API gravity in crude oil samples.
Plot of main factor effect of independent variables (x1, x2, x3, x4, x5, x6 and x7) against responses variable of piecewise-cubic MARS model for determination of °API gravity in crude oil samples.
Plot of main factor effect of independent variables (x1, x2, x3, x4, x5, x6 and x7) against responses variable of piecewise-cubic MARS model for determination of °API gravity in crude oil samples.
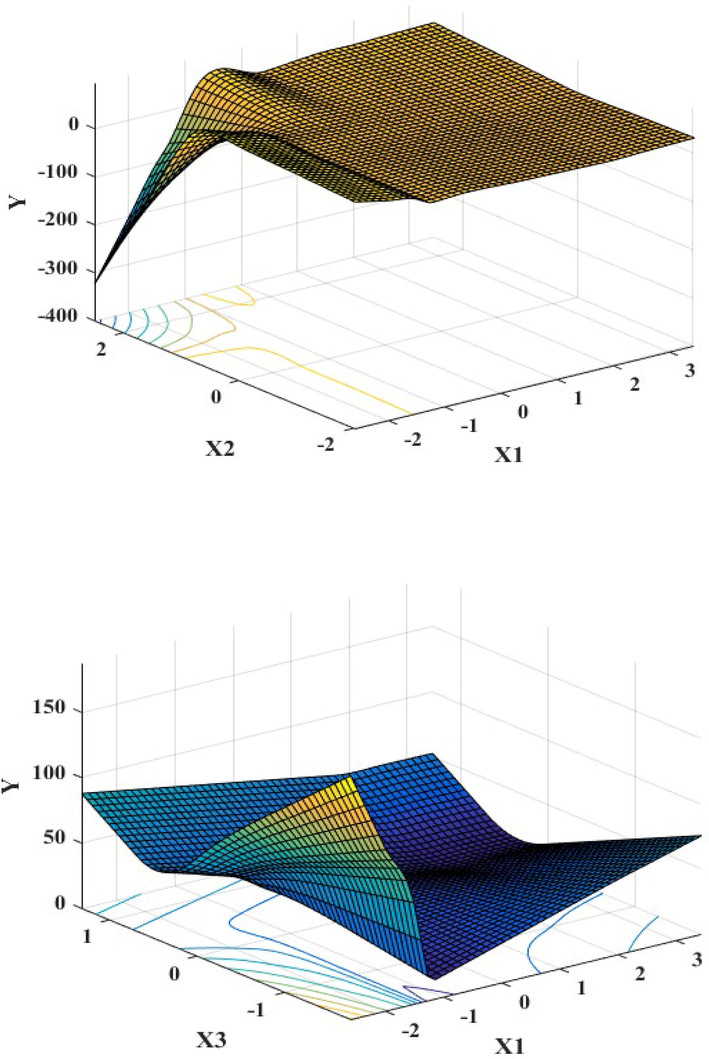
Three-dimensional graph of interaction effect of variables in piecewise-cubic MARS modeling to determine °API gravity in crude oil samples.
Three-dimensional graph of interaction effect of variables in piecewise-cubic MARS modeling to determine °API gravity in crude oil samples.
3.3 The °API gravity determination and comparison the results of calibration models
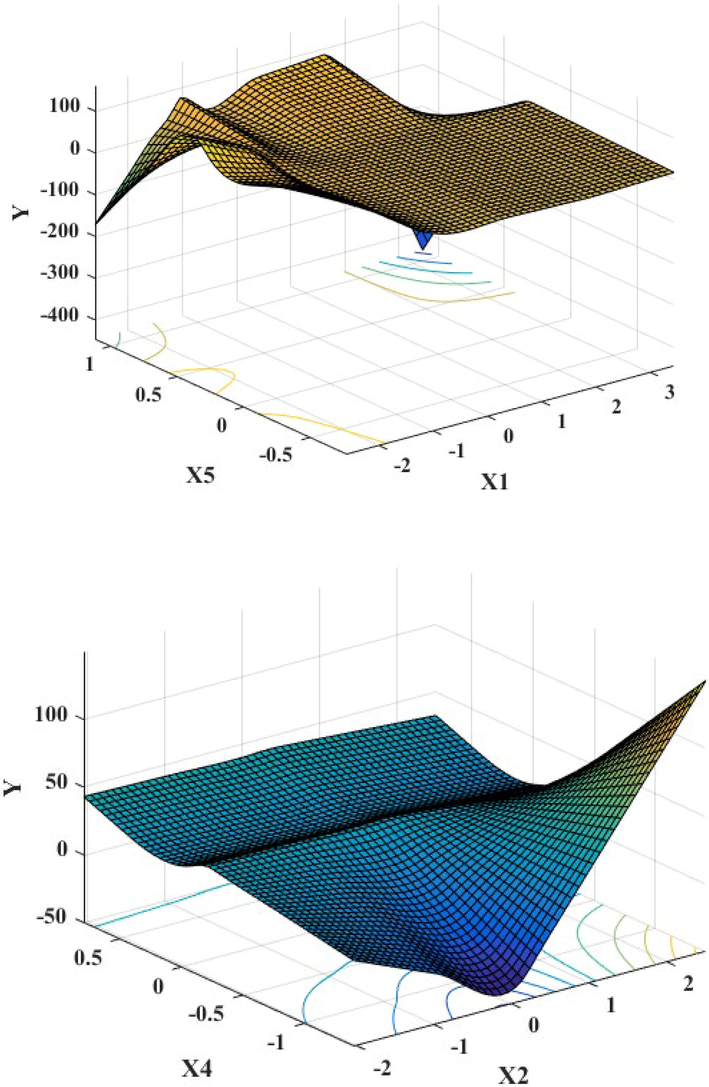
PLS-R, SVM-R and piecewise-cubic rPCA-MARS models were applied to investigate the efficiency of the model in crude oil samples. These models were used to determine °API gravity values of crude oil samples. The all ATR-FTIR spectra were divided in two sets calibration and prediction by duplex algorithm in regression models. The calibration models and prediction sets for each calibration model consisted of 67 and 33 crude oil samples, respectively. The °API gravity value, were used as reference data for each model. Construction calibration models, provide a correlation between the ATR-FTIR spectra as X matrix and the °API gravity as Y. Fig. 6. display the scatter plot of PLS-R and SVM-R models versus predicted values of °API gravity in crude oil samples for calibration and prediction sets, respectively. The calculated values of R2Cal., R2pred, RMSEC and RMSEP for PLS-R and SVM-R calibration models are shown in Table. 5. According to the results that obtained using the PLS-R (R2Cal. = 0.944, RMSEC = 2.310, RMSEP = 4.117) and SVM-R (R2Cal. = 0.988, RMSEC = 1.088, RMSEP = 2.591) models showed relatively poor accuracy in estimation of °API gravity values of crude oil samples in comparison with the piecewise-cubic rPCA-MARS model. MARS model as a non-parametric regression method uses two piecewise linear or cubic splines as basis functions to investigate relationship between the input variables and the set of responses. The MARS model, a flexible estimation is performed to approximate the nonlinear relationship between the input variables and the response variable using piecewise linear or cubic basis functions. In this study, according to the results, the final model was selected based on the piecewise-cubic rPCA-MARS model. Table. 5. presents statistics parameters for investigation the efficiency of calibration models PLS-R, SVM-R and piecewise-cubic rPCA-MARS. The R2, RMSEC, RMSEP, MAE, and R2 GCV in the piecewise-cubic rPCA-MARS model were 0.997, 6.726*10-13, 0.538, 0.290, and 0.988, respectively. The piecewise-cubic rPCA-MARS model include better predictive performance in this study. Fig. 7. display the scatter plot of piecewise-cubic rPCA-MARS model versus predicted values of ° API gravity in crude oil samples. As can be seen in Table. 5. based on the result that obtained using PLS-R as a linear calibration model and SVM-R as a non-linear regression model, the results of SVM-R model were slightly better than PLS-R model for °API gravity determination, however the robust model is required. Although MARS method has been successfully applied as one of the most outstanding method for regression in highly nonlinear systems, limited works have been reported in the field of crude oil samples prediction. The first advantage of applied method is transferability of proposed method. This method can be applied to study the other properties in crude oil samples and validated using conventional reference analysis. As another advantage of this work, we have written a comprehensive and intelligent algorithm in M−file/MATLAB which allows to provide details of the MARS operation. The two parameters importance evaluation in the MARS model are denoted as ANOVA decomposition and delGCV, which are used for interpreting the influence of input variables to the outputs and description the importance of relative variables, respectively. We reported the MARS algorithm parameters including delGCV, nSubset, subsRSS and subsGCV in detail which estimate input variable importance. In this study, after rPCA where the eigenvectors of a correlation matrix are orthogonal, the MARS algorithm pruned the less important component using introduced parameters. As a result, only the useful input parameters were appeared in the final expression of the MARS model after the forward and backward pass (Xu et al., 2006; Yang et al., 2005, Khanmohammadi and Sadrara, 2022).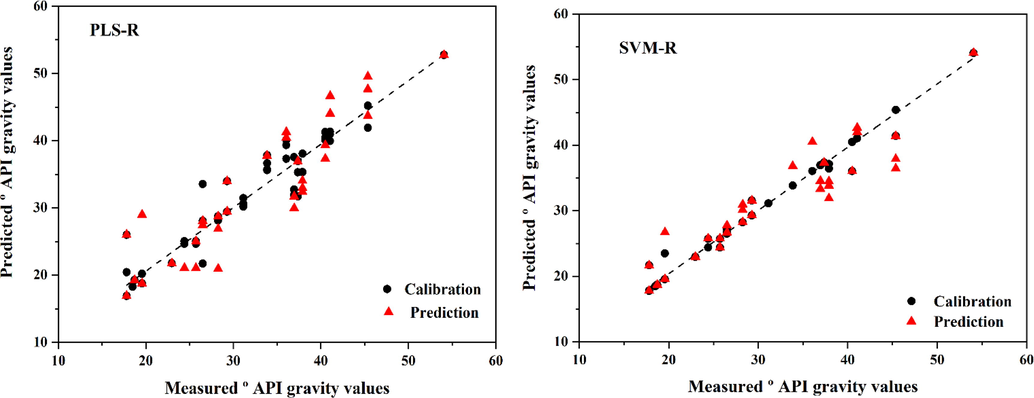
The scatter plot of PLS-R and SVM-R models versus predicted values of ° API gravity in crude oil samples.
Model
R2cal.
R2GCV
R2pred
RMSEC
RMSEP
MSE
Number of LVs/scores
PLS-R
0.944
–
0.816
2.310
4.117
–
5 (LVs)
SVM-R
0.988
–
0.860
1.088
2.591
–
–
piecewise-cubic rPCA-MARS
0.997
0.988
0.926
6.726*10-13
0.538
0.290
7 (scores)
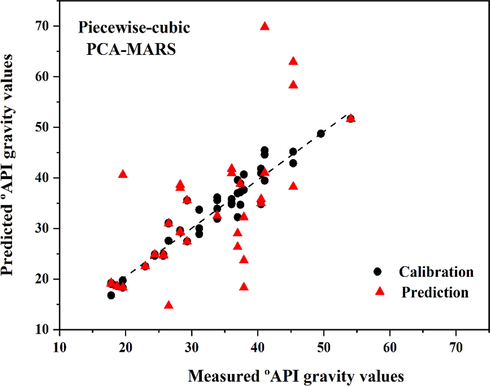
The scatter plot of piecewise-cubic rPCA-MARS model versus predicted values of ° API gravity in crude oil samples.
4 Conclusion
In this study, the determination of °API gravity in crude oil samples using robust principal component analysis–multivariate adaptive regression splines rPCA–MARS was proposed as an analysis method. According to the results obtained using MARS model based on robust PAC, it showed that this model is suitable for determining °API gravity in crude oil samples. Also, the result of this study showed that the rPCA–MARS model performs better than PLS-R and SVM-R models. In MARS model, the interaction between variables and non-linearity of data modeled without any restrictions, automatically. The efficiency of the MARS model is determined by the basis factors. The RMSEC, RMSEP, MAE, and R2GCV in the piecewise-cubic rPCA-MARS model were 6.726*10-13, 0.538, 0.290 and 0.988, respectively. Generally, the results showed that rPCA-MARS model provide powerful result for prediction of °API gravity values in crude oils. The result of this verification was that the rPCA-MARS model is the best model with more successful than the PLS-R and SVM-R models. The agreement between experimental data and the result that obtained using regression models confirms that the piecewise-cubic rPCA-MARS model can applied to estimate the °API gravity values of crude oil samples based on the IR spectroscopic data.
Declaration of Competing Interest
The authors declare that they have no known competing financial interests or personal relationships that could have appeared to influence the work reported in this paper.
References
- M.H.M. Ahmed, S.M.E.L. Sayed, J.S. Basta, E.K. Attia, Characterization of some local petroleum residues by spectroscopic techniques, 2010, 430–444, https://doi.org/10.1080/10916460902744554.
- Origin based classification of crude oils by infrared spectrometry and chemometrics. Fuel. 2019;236:1093-1099.
- [CrossRef] [Google Scholar]
- Mass spectrometry in petroleum chemistry. Petroleomics. 2019;59:1055-1076.
- [CrossRef] [Google Scholar]
- C.W. Brown, P.F. Lynch, Applications of infrared spectroscopy in petroleum analysis and oil Spill identification, 2007 223–248, https://doi.org/10.1080/05704927508081491.
- L. Carbognani, J. Espidel, S. Colaiocco, Characterization of heavy oils and heavy ends, Anal. Adv. Hydrocarb. Res. (2003) 337–368, https://doi.org/10.1007/978-1- 4419-9212-3-14.
- Feasibility study on identification of green, black and Oolong teas using near-infrared reflectance spectroscopy based on support vector machine (SVM) Spectrochim. Acta - Part A Mol. Biomol. Spectrosc.. 2007;66:568-574.
- [CrossRef] [Google Scholar]
- M. Cristina, K.D. Oliveira, L.R.O. Miranda, A.B.M. De Carvalho, D.F.S. Miranda, Viscosity of water-in-oil emulsions from different API gravity brazilian crude-oils, 2018. https://doi.org/10.1021/acs.energyfuels.7b02808.
- Fast determination of diphenhydramine hydrochloride in reconstitutable syrups by CWT, PLS and PCR methods. Acta Pol. Pharm.-Drug Res.. 2014;71(5):721-729.
- [Google Scholar]
- Crude oil spectral signatures and empirical models to derive API gravity. Fuel. 2019;237:1119-1131.
- [CrossRef] [Google Scholar]
- Rapid and accurate SARA analysis of medium gravity crude oils. Energy Fuel. 2002;47:1571-1575.
- [CrossRef] [Google Scholar]
- Determination of saturates, aromatics, and Polars in crude oil by 13C NMR and support vector regression with variable selection by genetic algorithm. Energy Fuel 2016
- [CrossRef] [Google Scholar]
- Friedman JH, Roosen CB. An introduction to multivariate adaptive regression splines. Vol. 4. Thousand Oaks, CA: Sage Publications Sage CA; 1995:197-217. doi:10.1177/096228029500400303.
- Partial least-squares regression: A tutorial. Anal. Chim. Acta. 1986;185:1-17.
- [CrossRef] [Google Scholar]
- U. Hydrocarbons, A. Hydrocarbons, Hydrocarbons in fuel, (2018) 1–2.
- S. Iravani, NMR spectroscopic analysis in characterization of crude oil and related products H NMR and 13C NMR spectroscopy analysis, 2018 125–140, https:// doi.org/10.1002/9781119286325.ch5.
- Jekabsons, G. (2011). ARESLab: Adaptive regression splines toolbox for matlab/Octave. http://www.cs.rtu.lv/jekabsons/.
- R.W. Kennard, L.A. Stone, Computer {aided} {design} of {experiments}, J. Technometrics. 11 (1969) 137–148.
- M, Khanmohammadi, M, Sadrara, Application of principal component analysis‐multivariate adaptive regression splines for the determination of surface area in zeolites, Journal of Chemometrics. 300 (2022) 3431.
- Application of least square support vector machine and multivariate adaptive regression spline models in long term prediction of river water pollution. J. Hydrol.. 2016;534:104-112.
- [CrossRef] [Google Scholar]
- Handbook of Chemometrics and Qualimetrics. Amsterdam: Elsevier; 1998.
- Rapid determination and classification of crude oils by ATR-FTIR spectroscopy and chemometric methods. Spectrochim. Acta Part A Mol. Biomol. Spectrosc.. 2020;232:118157
- [CrossRef] [Google Scholar]
- Mukkamala, S., Sung, A. H., Abraham, A., & Ramos, V. (2006). Intrusion detection systems using adaptive regression spines. Enterprise information systems VI (pp. 211–218). Berlin: Springer.
- Olivieri AC. Introduction to Multivariate Calibration: A Practical Approach. Springer; 2018. doi:10.1007/978-3-319-97097-4.
- Characterization of supercomplex crude oil mixtures. Angew. Chem.. 2009;121:1820-1823.
- [CrossRef] [Google Scholar]
- PLS-LS-SVM based modeling of ATR-IR as a robust method in detection and qualification of alprazolam. Spectrochim. Acta - Part A Mol. Biomol. Spectrosc.. 2017;173:87-92.
- [CrossRef] [Google Scholar]
- Adaptive splines and genetic algorithms. J. Comput. Graph. Statist.. 2002;11(3):615-638.
- [Google Scholar]
- Application of high resolution NMR (1H and 13C) and FTIR spectroscopy for characterization of light and heavy crude oils. J. Petrol. Sci. Eng.. 2018;168:256-262.
- [CrossRef] [Google Scholar]
- P.V. Ram, S.L. Potosí, Rheological behavior from light to heavy oils: Construction of master curves, 2016 2–7. https://doi.org/10.1021/acs.energyfuels.6b01340.
- Z. Reitermanov, Data Splitting, (2010) 31–36.
- An FTIR method for the analysis of crude and heavy fuel oil asphaltenes to assist in oil fingerprinting. Forensic Sci. Int.. 2016;266:555-564.
- [CrossRef] [Google Scholar]
- Determination of crude oil physicochemical properties by high-temperature gas chromatography associated with multivariate calibration. Fuel. 2018;220:389-395.
- [CrossRef] [Google Scholar]
- Principal component analysis–multivariate adaptive regression splines (PCA-MARS) and back propagation-artificial neural network (BP-ANN) methods for predicting the efficiency of oxidative desulfurization systems using ATR-FTIR spectroscopy. Spectrochim. Acta Part A: Mol. Biomol. Spectrosc. 2023
- [Google Scholar]
- Multivariate adaptive regression spline (Mars) for prediction of elastic modulus of jointed rock mass. Geotech. Geol. Eng.. 2013;31(1):249-253.
- [CrossRef] [Google Scholar]
- An overview of heavy oil properties and its recovery and transportation methods. Braz. J. Chem. Eng.. 2014;31:571-590.
- [CrossRef] [Google Scholar]
- A tutorial on support vector regression. Stat. Comput.. 2004;14(3):199-222.
- [CrossRef] [Google Scholar]
- J.G. Speight, A.J. Wiley, Handbook of petroleum product analysis, 2015.
- An investigation of multivariate adaptive regression splines for modeling and analysis of univariate and semi-multivariate time series systems. Naval Postgraduate School; 1991. Ph.D. thesis
- A simplified FTIR chemometric method for simultaneous determination of four oxidation parameters of frying canola oil. Spectrochim. Acta Part A Mol. Biomol. Spectrosc.. 2015;149:656-661.
- [CrossRef] [Google Scholar]
- A new approach to multivariate adaptive regression splines by using tikhonov regularization and continuous optimization. TOP. 2010;18(2):377-395.
- [Google Scholar]
- 24. Thomas EV, Haaland DM. Comparison of multivariate calibration methods for quantitative spectral analysis. Anal Chem. 1990;62(10):1091-1099. doi:10.1021/ac00209a024.
- Determination of SARA fractions of crude oils by NMR technique. J. Pet. Sci. Eng.. 2019;179:1-6.
- [Google Scholar]
- State-of-charge prediction of lithium ion battery through multivariate adaptive recursive spline and principal component analysis. Energy Storage.. 2021;3(2):147.
- [CrossRef] [Google Scholar]
- Wang L, Wu C, Gu X, Liu H, Mei G, Zhang W. Probabilistic stability analysis of earth dam slope under transient seepage using multivariate adaptive regression splines. Bull Eng Geol Environ. 2020;79(6):2763-2775. doi:10.1007/s10064-020-01730-0.
- Chem. Int. Lab. Syst.. 2006;82:24-30.
- H. Yang, J. Irudayaraj, M.M. Paradkar, Food Chemistry Discriminant Analysis of Edible Oils and Fats by, 93, 2005 25–32, https://doi.org/10.1016/j.foodchem.2004.08.039.


