

Translate this page into:
Recycling preparative isolation of six bicyclol active metabolites from SD rat urine using macroporous resin, offline 2D LPLC/HPLC, and prep-HPLC combined with pharmacodynamic evaluation of two active metabolites
⁎Corresponding authors at: School of Pharmacy, Chongqing Medical University, Chongqing 400016, PR China (G. Fan). jiangxinhui@cqmu.edu.cn (Xinhui Jiang), louyuefen@sina.cn (Yuefen Lou), guorfan@163.com (Guorong Fan)
-
Received: ,
Accepted: ,
This article was originally published by Elsevier and was migrated to Scientific Scholar after the change of Publisher.
Abstract
Six active metabolites were prepared from SD rat urine. An offline 2D LPLC/HPLC system was constructed for segmentation. Recycling prep-HPLC system was used to improve efficiency in active metabolites preparation. M7 possessed higher pharmacodynamics than BIC.
Abstract
In our previous study, several bicyclol (BIC) metabolites were found to possess higher solubility, security, and efficacy than the parent drug. However, further research can’t be conducted without monomeric metabolites. In the current study, a highly efficient preparative approach for six BIC-active metabolites from Sprague-Dawley (SD) rat urine was developed. First, 1000 mL of urine was purified and concentrated to 50 mL using microporous resin. Second, middle chromatogram isolated (MCI) GEL®CHP20P adsorbent was used to create a low-pressure liquid chromatography (LPLC) column, which was combined with high-performance liquid chromatography (HPLC) to build an offline 2D system to visualize the separation process. Samples were segmented into 25 tubes and merged into three fractions. Then, recycling preparative HPLC was applied to the monomeric preparation to improve the efficiency. The prepared metabolites possessed high purity (greater than98%), and were verified by nuclear magnetic resonance (NMR). Finally, an isoniazid (INH)-induced liver injury zebrafish model was established to evaluate the efficiency of the BIC, M7, and M8 metabolites. The M7 metabolite exhibited a higher efficiency than BIC in histopathology, gene expression, and aminotransferase levels. Consequently, this study provided a strategy that integrating modern analytical techniques to prepare metabolites for discovering high value candidate compounds from biological metabolism.
Keywords
Bicyclol
Metabolites
Offline 2D LPLC/HPLC
Recycling prep-HPLC
Liver injury zebrafish model

1 Introduction
Almost all drugs are metabolised when they enter an organism (Yang et al., 2016). Most drugs may lose some of their essential pharmacological effects, due to their high water solubility resulted in a fast renal excretion. However, the metabolites of drugs often have superior safety, pharmacological, and pharmacokinetic profiles compared to their respective parent molecules, and are generally defined as active metabolites (Wang et al., 2015). Consequently, numerous active metabolites have been evaluated and found to have better profiles than their parent molecules. These include cetirizine, acetaminophen, oxyphenbutazone, oxazepam, fexofenadine, and desloratadine (Fura 2006).
Bicyclol (BIC) has been widely used to treat drug-induced liver injury (DILI); however, it has low bioavailability and solubility (Tan et al., 2008). Previous studies from our laboratory identified 11 metabolites in rat plasma, urine, and faeces (Huang et al., 2022). Interestingly, we found that the concentration of the dealkylation metabolite was higher than that of other metabolites in rat plasma, suggesting that it may possess considerable metabolic stability and a low clearance rate. In addition, the studies showed that several metabolites were superior to BIC in terms of efficacy and safety by molecular docking and ACD/percepta analysis. Thus, this study aimed to develop a simple and efficient process for the preparation of BIC metabolites from Sprague-Dawley (SD) rat urine to further verify their effects on treating DILI.
Preparative high-performance liquid chromatography (prep-HPLC) is one of the most efficient separation techniques with high efficiency, high resolution, and good reproducibility for the preparation of target compounds (Szliszka et al., 2009, Ma et al., 2016, Angelis et al., 2021). Furthermore, the same chromatograms can be acquired from the analysis to the preparative separation stage using linear magnifying technology (Wang et al., 2017, Yang et al., 2019, Dou et al., 2021). Recently, prep-HPLC has been widely used for the preparation of effective compounds from traditional Chinese medicines (TCMs) (Yu et al., 2017, Liu et al., 2019, de Mello et al., 2021) and secondary metabolites from fungi (Cota et al., 2018, Lambert et al., 2021). There are also several reports on the preparation of drug metabolites by prep-HPLC. Wang et al. separated four metabolites of grosvenorine after the incubation of the parent drug with human faecal microflora (Wang et al., 2015). Chen et al. separated seven metabolites of furanodiene from rat urine (Chen et al., 2013). Zhang et al. isolated two galangin metabolites from rat urine (Zhang et al., 2016).
Since rat urine is abundant and easy to collect, it is a popular choice for preparing drug metabolites. However, it is difficult to obtain monomeric compounds using only prep-HPLC because of the low content of drug metabolites, complex components of biological samples, and large amounts of endogenous impurities (Ma et al., 2016, Jallali et al., 2020). Therefore, additional separation techniques are needed to remove non-target ingredients and enrich target compounds before the purity preparation (Sturm et al., 2021, Li et al., 2022). A useful pre-treatment technique is low-pressure liquid chromatography (LPLC) with different gel column packings. Meanwhile, middle chromatogram isolated (MCI) GEL®CHP20P adsorbent, which has excellent reproducibility and separating capacity (Li et al., 2013, Dawa et al., 2021, Fang et al., 2022), is commonly used in LPLC to separate bioactive compounds from various natural products and was chosen for pre-treatment in our study.
In the current study, we developed an efficient approach for preparing BIC-active metabolites from SD rat urine using microporous resin (MAR) and offline 2D LPLC/HPLC combined with recycling prep-HPLC. These metabolites were verified by ultra-high PLC-quadrupole-time-of-flight-tandem mass spectrometry (UPLC-Q-TOF-MS/MS) and nuclear magnetic resonance (NMR) spectroscopy. To provide more valuable information on the structure–function relationship, we further verified the anti-hepatic injury activity of two metabolites compared with BIC in an isoniazid (INH)-induced liver injury zebrafish model.
2 Materials and methods
2.1 Materials and reagents
The MCI GEL®CHP20P (120 μm) separation packing was purchased from Mitsubishi Chemical Corporation (Japan). Three macroporous resins (MARs), including D101, HPD-300 and HPD-400 were obtained from Zhengzhou Hecheng New Material Technology Co. Ltd. (Zhengzhou, Henan, China).
BIC was purchased from the Beijing Concorde pharmaceutical factory (batch no. 170657, purity 98.0%). Ammonium acetate and formic acid were acquired from ANPEL Lab Tech. (Shanghai, China). The pure water (18.2 MΩ/cm) was deionized by a Milli-Q system (Millipore, Bedford, MA, USA). Methanol and acetonitrile (LC/MS grade) were purchased from Thermo Fisher Scientific China Co., Ltd. Methanol (LC grade) was acquired from Merck (Darmstadt, Germany).
2.2 Animals and drug administration
12 Pathogen free male SD rats (180–200 g, 4–5 weeks) were provided by Shanghai Jiao Tong University. Rats were adaptively grown in the laboratory for a week before the experiment. The blank urine was collected before orally administrating BIC. To collect more metabolites, BIC (suspended in 0.5% carboxymethyl cellulose, 20 mg/mL) was orally administrated to rats at the dose of 100 mg/kg, three times a day and lasting seven days, total1000 mL urine were collected.
Animal studies were performed following the recommendations in the Guidelines for the Care and Use of Laboratory Animals and relevant Chinese laws and regulations, which were approved by the Institutional Animal Care and the Use Committee of Shanghai Jiao Tong University (approval number A2018075).
2.3 Preliminary purification and concentration by MAR
The optimum resin was selected by static adsorption and desorption experiment among D101 (non-polar), HPD-300 (low-polar) and HPD-400 (middle-polar) resins. Firstly, 5 mL urine was added into activated resins (5 mL wet resin each) in 100 mL conical flasks and shaken (80 rpm/min) for 0.5 h at room temperature. Secondly, the 5 mL sample was removed, and 10% ethanol (10 mL) was added and shaken for 0.5 h at the same condition. Finally, 10% ethanol was removed, and 95% ethanol was added and shaken for 0.5 h at the same condition.
A glass column was packed with actived D101 resin (1 BV = 100 mL) to remove endogenous impurities in the rat urine. 200 mL urine was loaded onto the top of the D101 resin column (L 20 cm × 2.5 cm) at a speed of 2 BV/h. After the adsorption equilibrium reached, 300 mL 10% ethanol (1% FA), 150 mL 70% ethanol and 95% ethanol (3 BV/h) were removed impurities and eluted metabolites successively. 70% and 95% ethanol part were finally mixed. The incorporative elution finally was concentrated to 10 mL under reduced pressure and 50 °C with a rotary evaporator. 5 times repeated.
2.4 Identification of BIC metabolites by UPLC-Q-TOF-MS
Each sample was analysed on an Agilent 1290 Infinity UPLC system (Milford, MA, USA) equipped with an Agilent UPLC column (Poroshell 120 EC-C18 2.1 × 150 mm, 1.9 μm). The mobile phases consisted of (A) 0.1% formic acid aqueous solution and (B) acetonitrile. The gradient elution was optimized as follows: 0–12 min, 10%–30% B;12–15 min, 30%–60% B; 15–16 min, 60%–90% B; 16–17 min, 90% B; 17–18 min, 90%–10% B, post time 2 min. The flow rate was 0.3 mL/min. The column temperature was 45 °C. The injection volume was 2 μL.
Mass spectrometric data were obtained by Agilent 6545 Q-TOF MS/MS equipped with a Dual Agilent Jet Stream electrospray ionization (ESI) source. The ESI source was set in positive ionization mode. The parameters in the source were set as follows: scan range, 100–1000 m/z (MS) and 50–800 m/z (MS/MS); fragmentor voltage, 175 V; gas temperature, 320 °C; sheath gas temperature, 350 °C; sheath gas flow, 11 L/min; and drawing gas flow, 8 L/min; nebulizer gas pressure, 35 psig. the collision energy was operated at alternative voltages of 10–30 eV.
2.5 The comparison of separated capacity in MCI GEL®CHP20P and MAR D101
A glass column was packed with active D101 resin (1 BV = 100 mL) to segment the sample. The loaded urine volume was 10 mL. After the adsorption equilibrium reached, 300 mL 10%, 30%, 40% and 50% ethanol (3 BV/h) were eluted metabolites successively. 30%, 40% and 50% ethanol parts were concentrated to 10 mL under reduced pressure and 50 °C with a rotary evaporator.
A glass column was packed with active MCI GEL®CHP20P/P120 (1 BV = 50 mL) to segment the sample. The loaded urine volume was 10 mL. After the adsorption equilibrium reached, 150 mL 30%, 50%, 60% and 70% ethanol (3 BV/h) were eluted metabolites successively. 50%, 60 and 70% ethanol parts were concentrated to 10 mL under reduced pressure and 50 °C with a rotary evaporator.
2.6 Preliminary segmentation based on offline 2D LPLC/HPLC
The urine was further preliminary separated into three frictions by MCI GEL®CHP20P/P120 LPLC (padding size 1.5 × 14 cm) equipped with an automatic collector (Shanghai Jiapeng Technology Co., LTD) and peristaltic pump (Baoding River Fluid Technology Co., LTD). The gradient elution was optimized as follows: 0–33 min, 40% ethanol; 34–66 min, 50% ethanol; 67–99 min 55% ethanol; 100–132 min 60% ethanol; 133–165 min, 70% ethanol; 166–198 min 95% ethanol. The loaded sample volume was 10 mL. The flow rate was 3 mL/min, and the section was collected at 20 mL per tube. Fractions have the same compounds were merged and evaporated to 5 mL (total three sections). 5 times repeated.
The HPLC analysis was conducted on an ultra-high performance liquid chromatograph (Thermo Fisher Scientific, USA.) equipped with YMC-Pack ODS-A column (4.6 × 250 mm, 5 m). The mobile phases were consisted of 0.1% formic acid (FA) deionized water (A) and ACN (B). The gradient elution was optimized as follows: 0–15 min, 20%–25% B;15–25 min, 25%–30% B; 25–28 min, 30% B; 28–32 min, 30%–20% B; 32–34 min, 30% B. The flow rate was 1 mL/min. The injection volume and column temperature were set at 10 and 30 °C, respectively. The chromatogram was recorded at 228 nm.
2.7 Preparation of BIC metabolites by prep-HPLC
The HPLC analysis was conducted on a U3000 UHPLC system (Thermo Fisher Scientific, USA.) equipped with YMC-Pack ODS-A C18 column 4.6 × 250 mm, 5 m. The flow rate was 1 mL/min. The mobile phases were consisted of H2O (0.1%FA) and ACN (0.1%FA) at different ratios (13:87 for fraction I, total 65 min; 23:7 for fraction III, total of 35 min). The gradient elution of fraction II was optimized as follows: 0–25 min: 19% B; 25–30 min: 19%–21% B; 30–36 min: 21%–24% B; 36–50 min: 24% B; 50–58 min: 24%—19% B; 58–60 min: 19% B. The injection volume was 10 and the column temperature was 30 °C. The chromatogram was recorded at 228 nm.
The prep-HPLC analysis, linear enlarged from HPLC analysis, was conducted on a Waters Prep 150 LC system (Water world Technology Co., LTD) equipped with YMC-Pack ODS-A C18 column 20 × 250 mm, 5 μm. The flow rate was 19 mL/min. The column temperature was set at 30 °C. The injection volume was set at 3 mL for Fr1 and Fr2 and 4 mL for Fr3. Additional injections were conducted at 16 min and 41 min for Fr1 and 10 min, 17 min and 26 min for Fr.3 after the first injection.
The NMR analyse were conducted on Bruker Avance NEO 700 MHz (Bruker, Karlsruhe, Germany) spectrometer. Tetramethylsilane (TMS) was chosen as the internal standard. BIC and six metabolites were dissolved in dimethylsulfoxide (DMSO) after freeze-drying.
2.8 The anti-liver injury effect of BIC, M7 and M8
2.8.1 Zebrafish maintenance and embryo handling
Wild-type AB line zebrafish were raised under standard conditions (5 mM NaCl, 0.17 mM KCl, 0.4 mM CaCl2, and 0.16 mM MgSO4). Adult zebrafish were cultivated at 28 °C in a 14-hour light/10-hour dark cycle, with a pH of 7.2–7.5 in the culture water. The zebrafish experiments were performed with the approval of the Institutional Animal Care Committee of Shanghai Jiao Tong University.
2.8.2 Isoniazide induced liver injury and drug treatment in zebrafish larvae
After 3 days post-fertilization (dpf), zebrafish larvae were randomly divided into eleven groups and placed in three 24-wells plates (15 larvae each well). The control group was only added nutrient solution. The model group was added 4 mM INH(Jia et al., 2019, Zhang et al., 2020, Wang et al., 2022). The treatment group were added BIC, M7 or M8 at different concentrations (low-15 μg/mL, middle-30 μg/mL, high-45 μg/mL) combined with 4 mM INH once a day, lasting 3 days. All groups were placed in an incubator at 28 °C.
2.8.3 Determination of ALT and AST in zebrafish
After 6 dpfs, 20 fish were collected from each group for tissue homogenization. The supernatant was collected to determine the protein concentration by the Nanodrop One ultra-microspectrophotometer (Thermo). The activity of ALT and AST were determined by the manufacturer's instructions (Nanjing Jiancheng Bioengineering Institute, China).
2.8.4 Real-time quantitative PCR (qRT-PCR) analysis
A sum of 30 larvae of each group was extracted total RNA by Trizol reagent (Thermo Fisher Scientific, USA). qPCR analysis was performed using Hifair® qPCR SYBR Green Master Mix (11203ES03 Yeasen, Shanghai, China). 2− Δ Δ CT method was chosen to calculate target gene. The primers of target genes are listed in Table 1.
Gene
Forward primer (5′to 3′)
Reverse primer (3′to 5′)
Pparα
CTGCGGGACATCTCTCAGTC
ACCGTAAACACCTGACGACG
Pparγ
CTGCCGCATACACAAGAAGA
TCACGTCACTGGAGAACTCG
IL-6
AGACCGCTGCCTGTCTAAAA
TTTGATGTCGTTCACCAGGA
Tnf-α
GCTTATGAGCCATGCAGTGA
TGCCCAGTCTGTCTCCTTCT
2.8.5 H&E staining
After 6 dpfs, ten zebrafish larvae were randomly selected. The processing step were as follows: firstly, all fish were fixed with 4% paraformaldehyde and subsequently dehydrated with graded ethanol. Then, they were cleared and paraffin to embed by xylene; Next, paraffin blocks were sectioned and stained by haematoxylin and eosin (HE), respectively; Finally, tissue were observed and photographed by microscope (Olympus FSX100, Tokyo, Japan).
3 Result and discussion
3.1 Preliminary purification and concentration by MARs and identification of BIC metabolites in urine
MARs have been extensively used to separate and purify active natural products due to their high adsorption capacity, environmental friendliness, and easy regeneration properties. In this study, MARs were used to concentrate sample and remove endogenous impurities from the urine. Three different polarities of MARs, D101 (non-polar), HPD-300 (low-polar), and HPD-400 (middle-polar), were adopted for static adsorption. Few metabolites were eluted in the 10% ethanol fraction; however, the relative content (from the peak area, Fig. S1) of metabolites in D101 was lower than that in other resins, which suggested that the D101 resin possessed higher absorbability to metabolites and therefore was chosen for this study.
The pH value influences the extent of ionisation of carboxyl or hydroxy groups in metabolites to affect their adsorption affinity in MAR (Zeng et al., 2016). Different formic acid (FA) contents, including 0.1%, 0.5%, and 1% (v/v), were also explored in dynamic desorption. The addition of 1% FA to 30% ethanol observably increased the retention of metabolites compared with the addition of 0.1%, or 0.5% FA (Fig. S2). Excessive FA may damage MAR; therefore, 10% ethanol containing 1% FA was chosen to eluate endogenous impurities. Comparing Fig. 1B with Fig. 1C, most endogenous impurities in urine were removed after treatment with D101 resin without metabolite loss, and 1000 mL of urine was concentrated to 50 mL.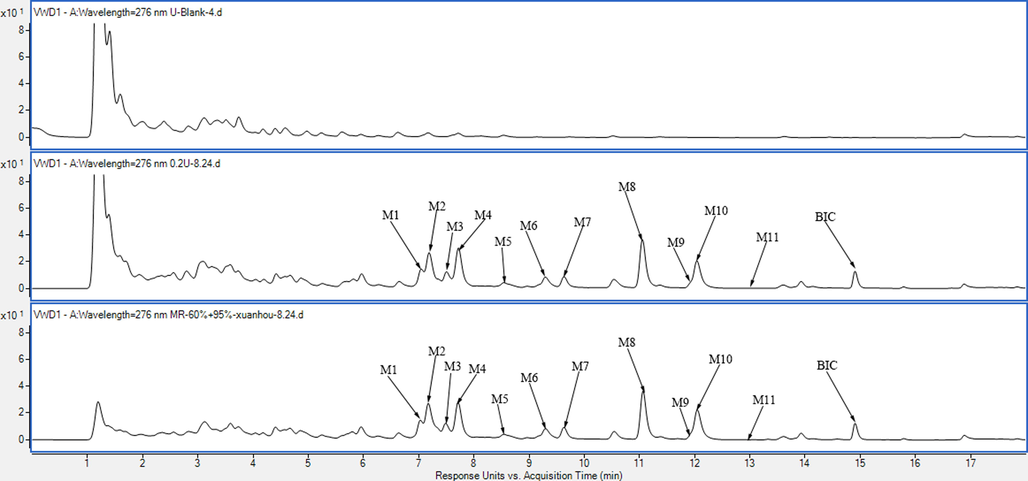
A, the UV chromatogram of blank rat urine; B, the UV chromatogram of original urine after oral administration BIC; C, the UV chromatogram of urine after treatment with D101 resin.
As shown in Fig. 2, 11 BCI metabolites in rat urine were isolated. The retention times and MS/MS data are presented in Table 2. Compared with our previous study (Huang et al., 2022), M3, M4, M6, and M10 are potential metabolites of BIC. In addition, the M7 and M8 metabolites may possess higher solubility and efficacy compared to that of BIC. The M2, M3, M4, M7, M8, and M10 metabolites were prepared to further identify their structures and evaluate their potential effects on treating DILI. (Fig. 3).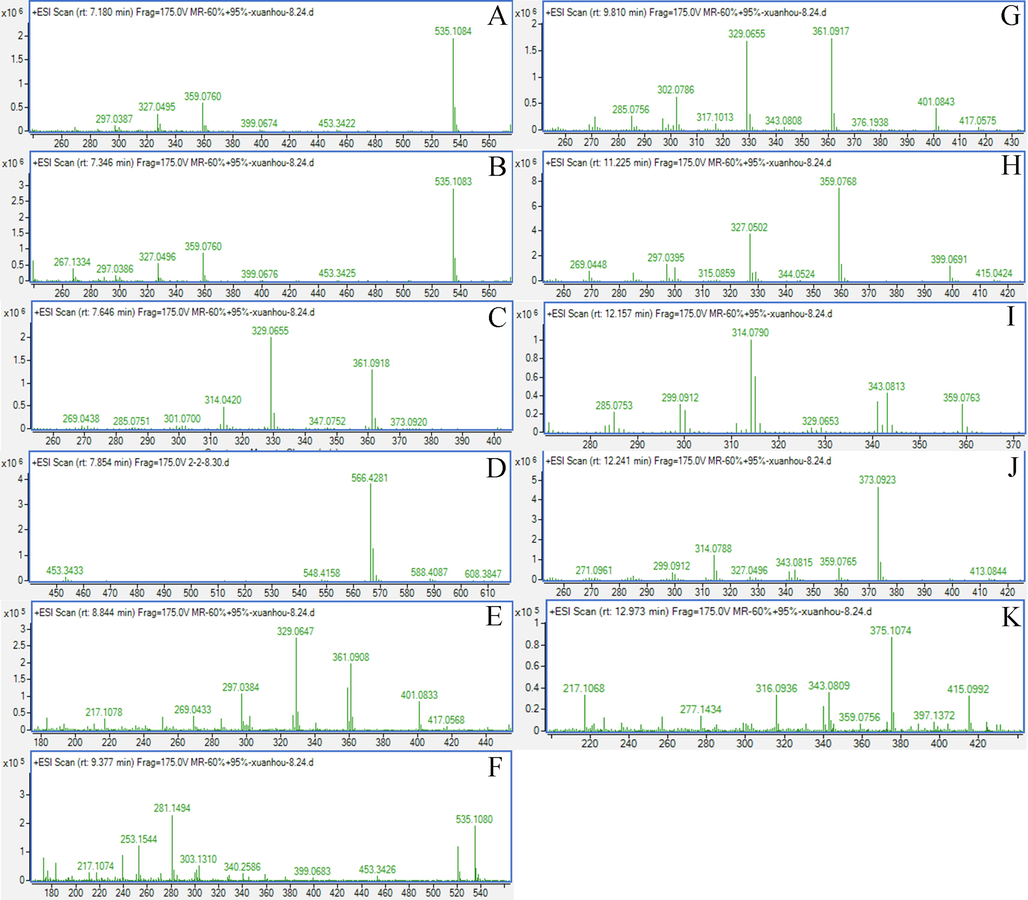
The MS data of 11 metabolites; A, M1; B, M2; C, M3; D, M4; E, M5; F, M6; G, M7; H, M8; I, M9; J, M10; K, M11.
NO.
Formular
RT(min)
[M + H-H2O]+
Fragment ions
m/z
Calc m/z
Diff(ppm)
M1
C24H24O15
7.18
535.1084
535.1088
−0.75
359.0759, 327.0497, 297.0394
M2
C24H24O15
7.34
535.1083
535.1088
−0.93
359.0757, 327.0492, 297.0389
M4
C25H26O15
7.85
566.4281
566.4295
−2.47
390.0849, 358.0637, 328.0519
M5
C18H18O9
8.84
361.0908
361.0923
−4.15
329.0646, 297.0386, 269.0435
M6
C24H24O15
9.37
535.108
535.1088
−1.50
359.0751, 327.0483, 297.0385
M7
C18H18O9
9.81
361.0917
361.0923
−1.66
320.0646, 297.0386, 269.0435
M8
C18H16O9
11.23
359.0768
359.0766
0.56
327.0500, 297.0394, 269.0442
M9
C18H16O9
12.15
359.0763
359.0766
−0.84
329.0650, 327.0496, 300.0623
M10
C19H18O9
12.19
373.0923
373.0920
0.80
343.0802, 341.0650, 314.0774
M11
C19H20O9
12.97
375.1074
375.1080
−1.60
343.0784, 331.1288, 313.1154
[M + H]+
m/z
Calc m/z
M3
C17H14O9
7.64
361.0918
361.0923
−0.83
329.0655, 314.0418, 301.0695
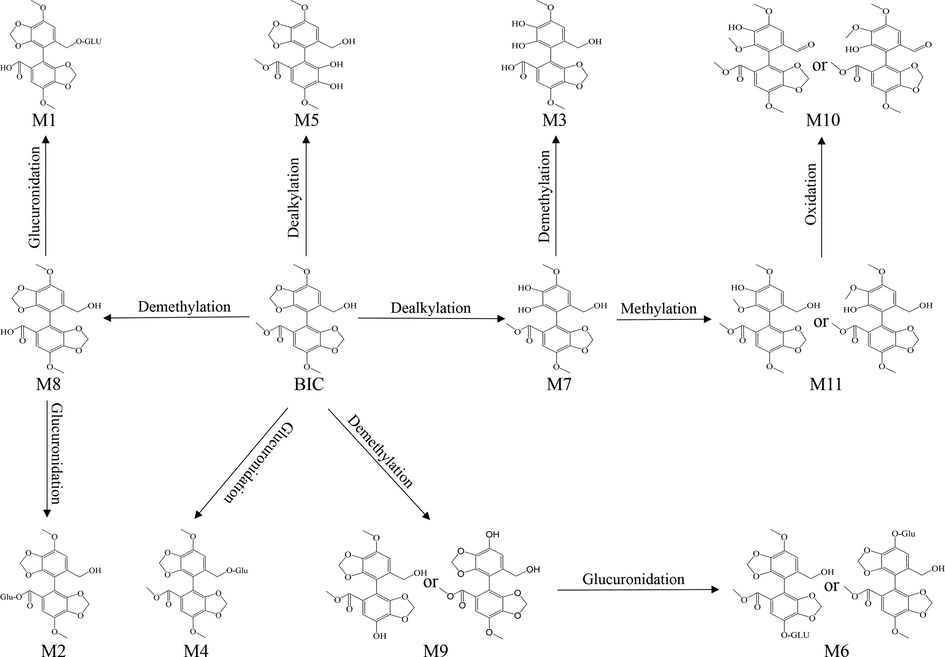
The metabolic pathway of BIC in rat urine.
3.2 The comparison of separated capacity in MCI GEL®CHP20P and MAR
Because the polar difference is large among BIC metabolites, preliminary segmentation must be conducted before monomeric compound preparation. The stationary phase of MCI GEL®CHP20P is a polystyrene matrix bound to acrylate, which can separate compounds with large-scale polarities (Dang et al., 2020, Wang et al., 2020). In addition, it exhibits excellent stability and repeatability during purification of target compounds (Dang et al., 2021). Consequently, the separation capacities between MAR and MCI GEL®CHP20P was compared. The elution gradient in MAR and MCI GEL®CHP20P was determined from static desorption. The elution volume in each segmentation was three column volumes. As shown in Fig. S3, the M2 and M3 metabolites were segmented at fraction (Fr)1 and the M4, M7, and M10 metabolites were segmented at Fr2 by MCI GEL®CHP20P. However, the six metabolites cannot be separated well in MAR. Consequently, MCI GEL®CHP20P was chosen to prepare the LPLC column for further segmentation.
3.3 Preliminary segmentation of urine based on offline 2D LPLC/HPLC
As shown in Fig. 4, an offline 2D LPLC/HPLC system was constructed to visualize the separation process. In the preliminary experiment, 100 mL gradients of 30%, 50%, 60%, 70%, 80%, and 95% EtOH, respectively, were adopted to elute metabolites. As there were no metabolites at the 30% EtOH part and the M2 metabolite was not detected until the latter part of 50% EtOH, the first gradient was changed to 40%. In addition, a gradient of 55% EtOH was added for the further separation of the M3 and M4 metabolites, and the gradient of 80% EtOH was removed. Consequently, the gradient succession was optimized to 100 mL each at 40%, 50%, 55%, 60%, 70%, and 95% EtOH.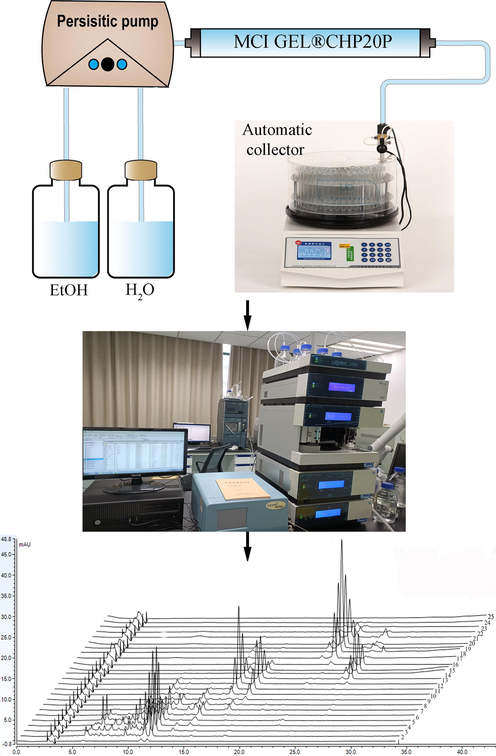
Schematic diagram of the offline 2D LPLC/HPLC system.
The flow rate was another important factor in the separation by LPLC. Four flow rates (1, 2, 3, 4 mL/min) were investigated to further separate the M8 and M10 metabolites. The obtained three fractions were analysed using UPLC-Q-TOF. The purity and recovery of six metabolites are shown in Table 3. When the flow rate was 4 mL/min, the recovery of the M8 and M10 metabolites was low, which may be attributed to their low penetration into the tiny gel pores at a higher flow rate (Liu et al., 2022, Yu et al., 2023). When the flow rate was reduced to 3 mL/min, the degree of separation of the M8 and M10 metabolites was high, and all recoveries were over 85%. However, if the flow rate was reduced to 2 mL/min, the separation was poor due to diffusion (Zong et al., 2014). Consequently, the flow rate of 3 mL/min was finally chosen for the separation of LPLC.
Compound
1 mL/min
2 mL/min
3 mL/min
4 mL/min
Tube
Purity
Recovery
Tube
Purity
Recovery
Tube
Purity
Recovery
Tube
Purity
Recovery
M2
2–8
15.8
86.3
2–7
16.8
85.1
2–7
16.4
88.4
2–6
16.0
87.5
M3
2–8
26.7
92.6
2–7
26.1
93.1
2–7
27.5
94.6
2–6
28.4
93.5
M4
9–15
34.1
91.3
8–16
32.4
88.2
8–15
34.9
90.5
7–16
33.8
91.2
M7
9–15
11.4
89.2
8–16
10.8
89.7
8–15
11.2
88.5
7–16
10.6
87.5
M10
9–15
33.1
83.1
8–16
33.5
86.1
8–15
34.9
85.6
7–16
33.6
84.3
M8
16–23
49.2
83.6
17–22
48.2
83.1
16–22
50.9
85.7
17–22
50.3
84.1
Using the offline 2D LPLC/HPLC system, the samples were segmented into 25 tubes and merged into three fractions (Fig. 5). In addition, the M10 metabolite was eluted before the M8 metabolite, which may have resulted from the different separation properties between MCI GEL®CHP20P and the reversed phase C18 column.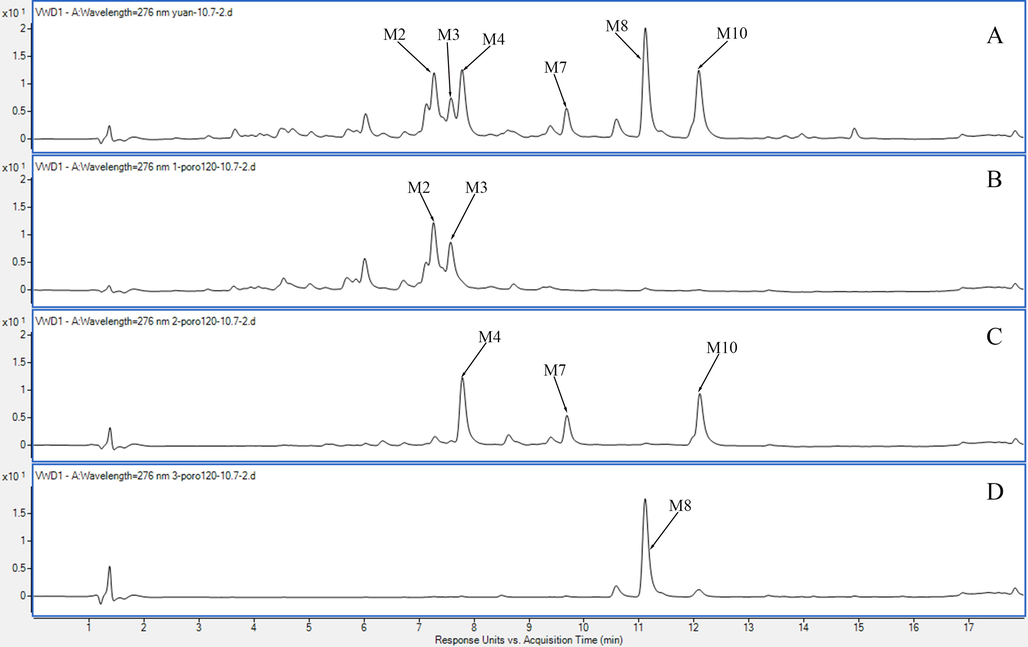
Typical UV chromatogram. A. After treatment by D101 resin; B. Fr1, tube 2–7; C. Fr2, tube 8–15; D. Fr3, tube 16–22.
3.4 Preparation of six active metabolites by prep-HPLC
As the mobile phase was one of the important factors affecting the separation of the target compounds, we first compared the separating effect of methanol and acetonitrile. The separation of Fr1 between the M2 and M3 metabolites in acetonitrile was higher than that in methanol (Fig. S4). In addition, to decrease the equilibration time at each injection, isocratic elution was prioritised to separate the three fractions. However, the polarities of the M4, M7, and M10 metabolites in Fr2 were different, and we finally chose a gradient elution for Fr2. A typical chromatogram of the analytical levels of the three fractions is shown in Fig. 6.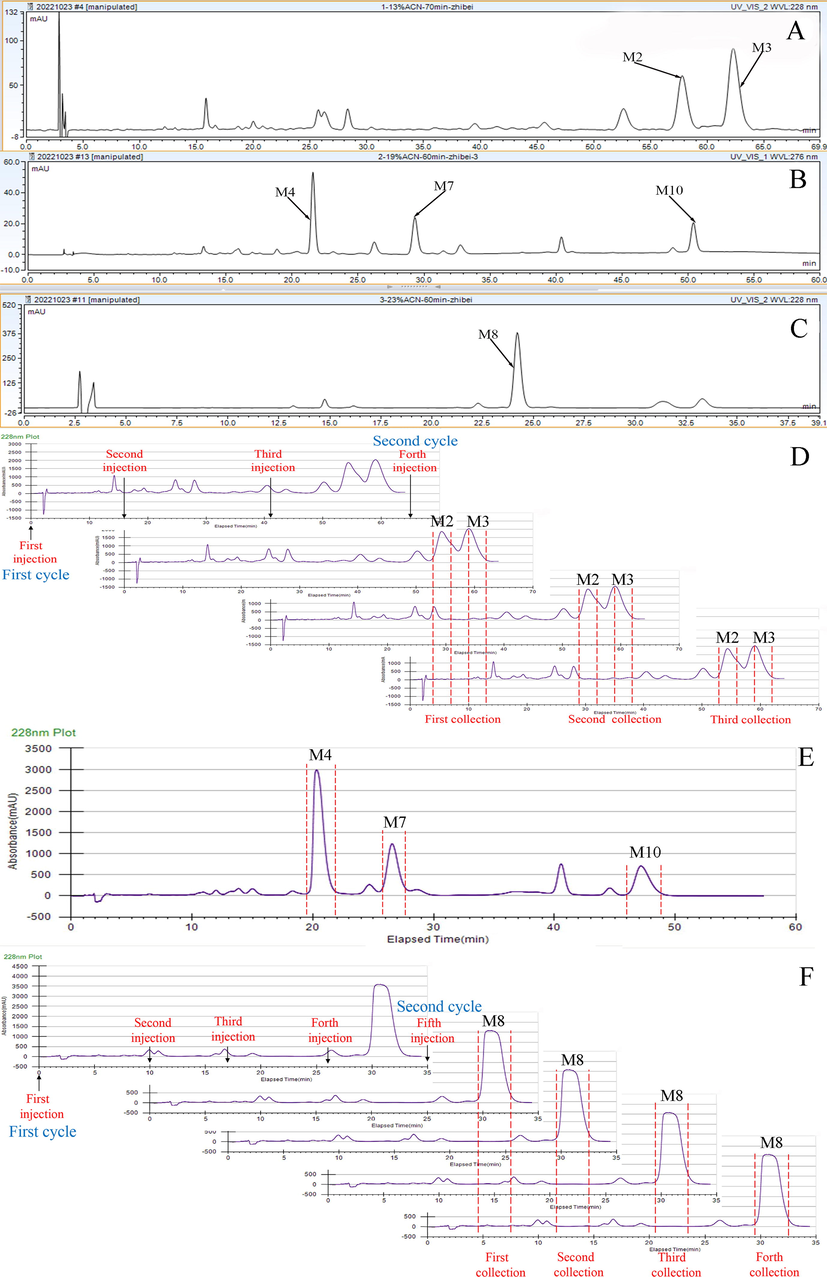
Analytical chromatograms of fractions I (A), II (B), and III (C) on a YMC-Pack ODS-A C18 analytical column and preparative chromatograms of fractions I (D), II (E), and III (F) on a YMC-Pack ODS-A C18 preparative column.
To obtain chromatograms that similar to the analytical levels, the stationary phases of the preparation were the same as the analytical level. The elution conditions of the three fractions were linearly magnified from the analytical levels using the following equation:
where RA and RP represent the diameters of the analytical (4.6 mm) and preparative (20 mm) columns, respectively, and FA and FP represent the flow rates of the analytical and preparative columns, respectively. Consequently, the flow rate at the preparative levels was set at 19 mL/min.
To enhance the preparative efficiency, recycling prep-HPLC was used for the preparation of Fr1 and Fr3. As shown in Fig. 6, two additional injections were conducted at 16 min and 41 min for Fr1, and three additional injections were conducted at 10 min, 17 min, and 26 min for Fr3 after the first injection. The efficiency of preparing Fr1 and Fr3 was enhanced by three and four times in the second cycle, respectively. As gradient elution was optimised to prepare Fr2, recycling prep-HPLC could not be used.
The purities of the six isolated metabolites were determined by HPLC on a YMC-Pack ODS-A C18 column (4.6 × 250 mm, 5 μm). The results are shown in Fig. 7; the purity of six compounds was greater than 98% (99.5% for M2, 98.8% for M3, 98.7% for M4, 99.5% for M7, 99.5% for M8, and 99.5% for M10).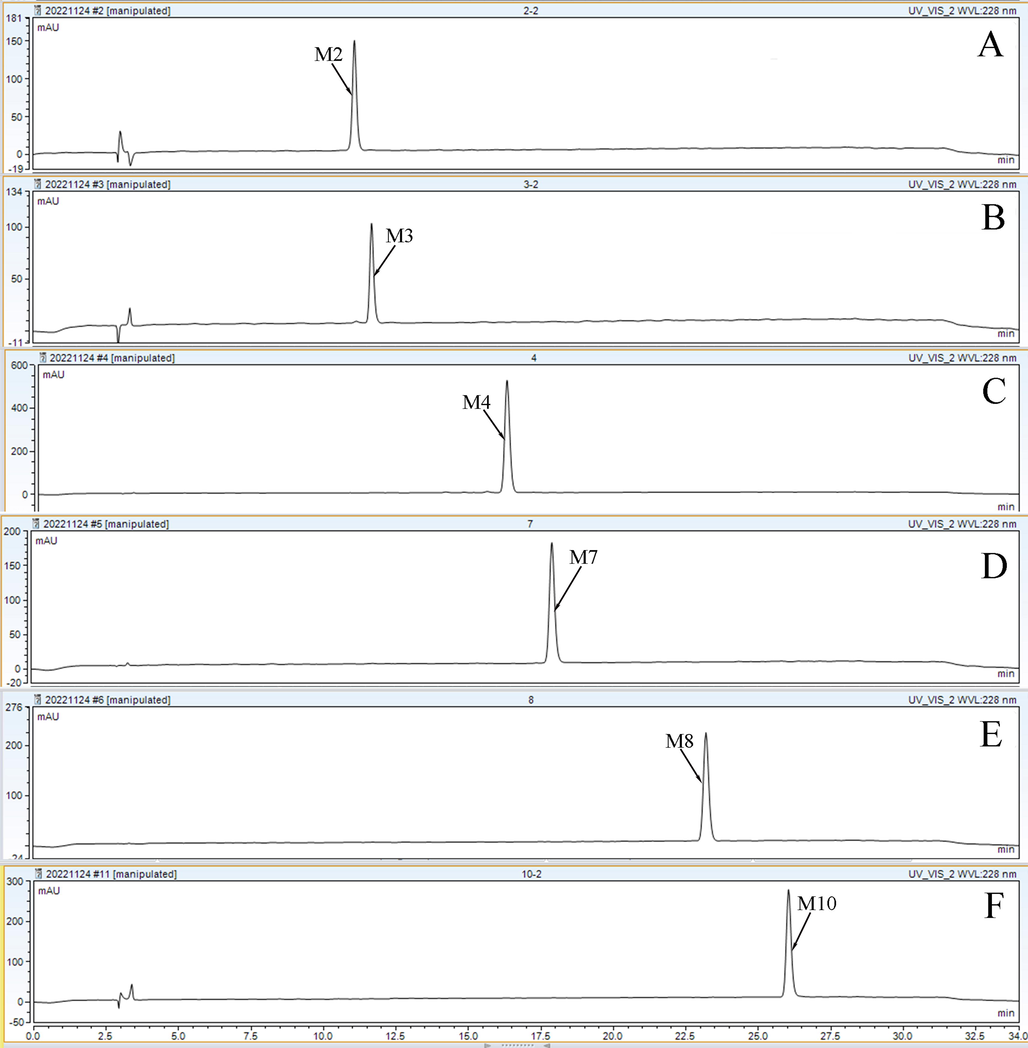
Purity analysis chromatograms (A–F) of the isolated compounds on a YMC-Pack ODS-A C18 analytical column. The mobile phases consisted of: (A) 0.1% formic acid ultra-pure water and (B) acetonitrile. The gradient elution was optimized as follows: 0–15 min, 20%–25% B;15–25 min, 25%–30% B; 25–28 min, 30% B; 28–32 min, 30%–20% B; 32–34 min, 30% B. The flow rate was 1 mL/min. The injection volume and column temperature were set at 10 μL and 30 °C, respectively. The chromatogram was recorded at 228 nm.
3.5 NMR studies on BIC and six active metabolites
1H and 13C NMR studies were performed on BIC in DMSO‑d6 and the data were compared with the NMR data of six metabolites. All NMR spectra of BIC and its metabolites are displayed in Fig. S4 and Fig. S5. The 1H and 13C spectra of the parent drug BIC and its metabolites were highly similar to those of biphenyl, dioxolane, methoxy, methylene, and methyl acetate (Table 4).
BIC
M2
M3
M4
M7
M8
M10
Position
1H (δ ppm)
13C (δ ppm)
1H (δ ppm)
13C (δ ppm)
1H (δ ppm)
13C (δ ppm)
1H (δ ppm)
13C (δ ppm)
1H (δ ppm)
13C (δ ppm)
1H (δ ppm)
13C (δ ppm)
1H (δ ppm)
13C (δ ppm)
1
3.90(s)
56.88
5.25(d)
115.34
—
167.37
3.85(s)
56.59
3.97(s)
56.60
—
—
3.85(s)
56.86
2
—
166.14
—
167.13
—
125.24
—
166.04
—
167.34
—
167.09
—
166.00
3
—
124.62
—
125.43
7.15(s)
108.56
—
124.62
—
122.14
—
124.70
—
124.53
4
7.26(s)
107.94
7.15(s)
106.58
—
145.35
7.36(s)
107.83
7.26(s)
110.25
7.26(s)
115.26
6.98(s)
108.68
5
—
146.57
—
145.21
3.73(s)
57.18
—
146.51
—
146.76
—
147.56
—
146.48
6
3.86(s)
56.60
3.56(s)
55.62
—
134.47
3.81(s)
56.54
3.96(s)
56.43
3.94(s)
56.41
3.82(s)
56.57
7
—
135.56
—
134.29
6.01(d)
102.16
—
135.51
—
133.34
—
133.38
—
133.56
8
6.07(d)
101.45
6.23(d)
102.37
—
142.46
6.08(d)
101.46
5.90(d)
101.75
6.03(d)
101.73
3.55(s)
72.06
9
—
142.57
—
141.83
—
110.28
—
142.91
—
141.90
—
137.21
—
142.66
10
—
110.48
—
110.43
—
110.56
—
111.16
—
108.77
—
108.39
—
110.12
11
—
111.16
—
113.58
—
134.01
—
114.68
—
110.25
—
109.09
—
111.34
12
—
133.08
—
134.17
6.56(s)
104.72
—
133.07
—
133.34
—
134.44
—
131.06
13
4.09–4.27(dd)
60.76
4.15–4.37(dd)
61.53
—
147.67
4.09–4.26(dd)
60.77
4.33–4.38(dd)
63.96
4.35–4.45(dd)
63.71
4.72(d)
67.38
14
6.79(s)
105.70
6.64(s)
104.38
—
52.31
6.78(s)
105.79
6.76(s)
106.41
6.76(s)
109.77
6.75(s)
106.84
15
—
147.74
—
149.31
3.36(s)
137.69
—
148.00
—
146.23
—
146.59
—
147.63
16
3.58(s)
52.29
3.35(s)
53.25
—
101.46
3.56(s)
52.28
3.69(s)
52.21
3.58(s)
52.33
3.51(s)
52.29
17
—
138.25
—
138.21
—
143.13
—
139.02
—
134.73
—
138.70
—
138.35
18
5.88(d)
102.73
5.69(d)
101.56
—
—
5.87(d)
102.78
—
—
5.91(d)
102.42
5.86(d)
101.53
19
—
142.89
—
138.23
—
—
—
139.80
—
143.37
—
143.41
—
143.04
20
—
—
5.02(d)
76.32
—
—
6.75(s)
116.34
—
—
—
—
—
—
21
—
—
4.13(d)
115.28
—
—
6.97(s)
101.08
—
—
—
—
—
—
22
—
—
6.75(s)
102.37
—
—
—
166.97
—
—
—
—
—
—
23
—
—
—
167.54
—
—
4.20(d)
72.06
—
—
—
—
—
—
24
—
—
6.46(s)
71.58
—
—
4.04(t)
73.43
—
—
—
—
—
—
25
—
—
—
—
—
—
5.15(d)
76.54
—
—
—
—
—
—
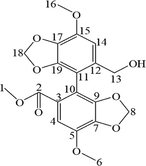
Chemically, the BIC structure contains total 18 protons, but only 17 protons were observed in the 1H NMR spectrum (Fig. S5). The signals observed as follows: From high magnetic field, the three singlets at δ 3.90, δ 3.86, and δ 3.58 ppm were the three methyl groups. The formation of hydrogen moves to a low magnetic field when the carbon atom to which the hydrogen is attached connects a highly electronegative group. H-1, H6, and H-16 were successfully identified because of the presence of ester bonds in the BIC structure. In addition, the hydrogen at the H-13 position was chemical inequivalent, and each hydrogen was coupled with the hydrogen in the same carbon (2J = 14.22 Hz) and the hydrogen in the vicinal carbon (3J = 5.46 Hz). Consequently, two quadruples were observed at δ 4.09–δ 4.27 ppm. Two doublets at δ 5.84 and δ 5.88, and δ 6.05 and δ 6.07 ppm, corresponded to the two methylene groups of H-8a and H-8b, and H-18a and H-18b, respectively. Two singlets at δ 7.62 and δ 6.79 ppm corresponded to the two hydrogens of H-4 and H-14. Because of the ester bond in the BIC structure, the singlet at δ 7.62 was the hydrogen of H-4. The 13C NMR spectra (Fig. S6) showed that BIC contains 19 carbons (Table 4). The singlet at δ 166.14 ppm corresponded to the ester bond of C-2. The singlets at δ 60.26, δ 101.45, and δ 102.73 ppm corresponded to the three methylene groups of C-13, C-8, and C-18, respectively. The singlets at δ 56.88, δ 56.60, and δ 52.9 ppm corresponded to three methylene groups at C-2, C-6, and C-16, respectively. The remaining carbon was located on the benzene ring. These can be preliminarily identified by substituting the different groups (Table 4).
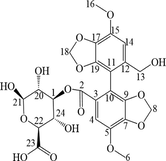
The M2 metabolite was a white powder. The precise m/z was 535.1083 [M + H-H2O]+, indicating that M2 was a demethylation and glucuronidation metabolite of BIC. Chemically, the M2 structure contains extra 8 protons compared to BIC, but an additional four protons were observed in the 1H NMR spectrum (Fig. S5). As the hydrogens at the H-20 and H-21 positions were coupled by one hydrogen at the vicinal carbon (3J = 4.85 Hz), two doublets were observed at δ 5.02 and δ 4.13 ppm, respectively. Two singlets at δ 6.75 and δ 6.46 ppm corresponded to two methylene groups at H-22 and H-24. The 13C NMR spectra (Fig. S6) showed that M4 contained extra 5 carbons compared to BIC (Table 4).
The M3 metabolite was white powder. The precise m/z was 361.0918 [M + H]+, indicating that M3 was the dealkylated and demethylated metabolite of BIC. The 1H NMR spectra (Fig. S5) showed that M3 lacked a hydrogen at H- 18, and lacked three hydrogens at H-1 compared to BIC (Table 4). The 13C NMR spectra (Fig. S6) showed that M3 lacked a carbon at C-1 and C-18 compared to BIC (Table 4).
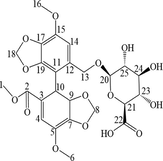
The M4 metabolite was a faint yellow powder. The precise m/z was 566.4286 [M + H-H2O]+, indicating that M4 was the glucuronidated metabolite of BIC. Chemically, the M4 structure contains extra 8 protons compared to BIC, but an additional five protons are observed in the 1H NMR spectrum (Fig. S5). As the hydrogen at the H-23 and H-25 positions were coupled by one hydrogen at the vicinal carbon (3J = 4.35 Hz), two doublets were observed at δ 4.20 and δ 5.15 ppm, respectively. The hydrogen at H-24 was coupled by two hydrogens in the vicinal carbon (3J = 4.75 Hz); consequently, a triplet was observed at δ 4.01– δ 4.12 ppm. Two singlets at δ 6.75 and δ 6.97 ppm corresponded to two methylene groups at H-20 and H-21. The 13C NMR spectra (Fig. S6) showed that M4 contained extra 6 carbons compared to BIC (Table 4).
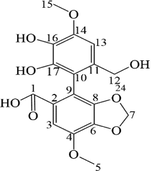
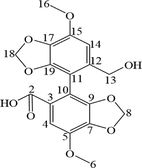
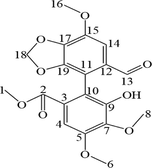
The M7 metabolite was a brown powder. The precise m/z was 361.0920 [M + H-H2O]+, indicating that M7 was a dealkylated metabolite of BIC. The 1H NMR spectra (Fig. S5) showed that M7 lacked a hydrogen at H-18 compared with BIC. The 13C NMR spectra (Fig. S6) showed that M7 lacked a carbon at C-18 compared with BIC (Table 4).
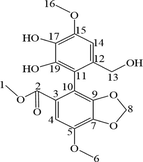
The M8 metabolite had the appearance of coffee powder. The precise m/z was 359.0763 [M + H-H2O]+, indicating that M8 was a demethylated metabolite of BIC. The 1H NMR spectra (Fig. S5) showed that M8 lacked three hydrogens at H-1 compared with BIC. The 13C NMR spectra (Fig. S6) showed that M8 lacked a carbon at C-1 compared with BIC (Table 4).
The M10 metabolite was a brown powder. The precise m/z was 373.0908 [M + H-H2O]+, indicating that M10 was a dealkylated, oxidised, and methylated metabolite of BIC. The 1H NMR spectra (Fig. S5) showed that M10 lacked a hydrogen at H-13 and had an extra hydrogen at H-8 compared with BIC. The 13C NMR spectra (Fig. S6) indicated that the methylene group at C-8 was transformed into a methyl group (Table 4).
3.6 Anti-liver injury effect of BIC, M7 and M8 metabolites in liver injury zebrafish model of INH
3.6.1 Effects of BIC, M7 and M8 metabolites on the expression of liver injury-related genes
Compared with the control group (Fig. 9), the expression levels of IL-6 and TNF-α were significantly increased, and the expression levels of PPARα and PPARγ were markedly decreased in the model group. All expressions were strongly associated with the INH-induced liver injury mechanism in the zebrafish model (Jia et al., 2019, Zhang et al., 2019, Zhang et al., 2020, Wang et al., 2022). In the treatment group, both BIC and the M7 metabolite markedly downregulated the expression levels of IL-6 and TNF-α and significantly upregulated the expression levels of PPARα and PPARγ at medium and high concentrations (p < 0.01). In addition, the influence of the M7 metabolite on IL-6, PPARα, and PPARγ was stronger than that of BIC, which suggested it may have a higher therapeutic effect on liver injury than BIC. The M8 metabolite only downregulated the expression of IL-6 and TNF-α at medium and high concentrations (p < 0.01).
3.6.2 Effects of BIC, M7 and M8 metabolites on the activities of ALT and AST in zebrafish livers
Compared to the control group, the activities of ALT and AST were significantly increased at 72 post-exposure (hpe) (Fig. 8). In the treatment group, BIC and the M7 metabolite significantly reduced the activities of ALT and AST at high concentrations (p < 0.01). The activity of AST was lower in the M7 metabolite treatment group compared to that in the BIC group. The M8 metabolite only slightly reduced ALT activity at the middle concentration (p < 0.05).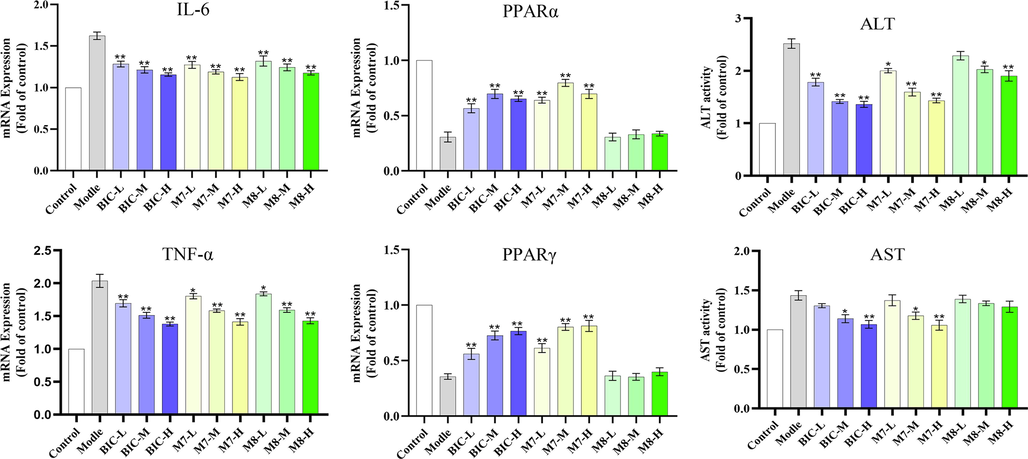
Effects of BIC, M7, and M8 metabolites on the expression levels of liver injury-related genes in zebrafish and the activities of ALT and AST (n = 30). * p < 0.05 vs model group; ** p < 0.01 vs model group.
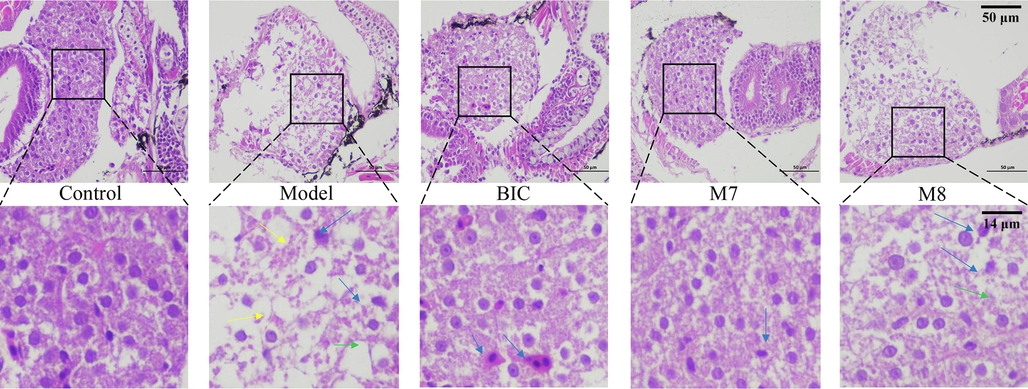
Effects of BIC, M7, and M8 metabolites on zebrafish liver tissue at 72 hpe. Loose cell-to-cell contact is indicated by yellow arrowheads; Macrovacuoles are indicated by green arrowheads; Nuclear atrophy is indicated by blue arrowheads; The first row of photographs was taken under a 400-power microscope and the second row of photographs was magnified 10 times.
3.6.3 Effects of BIC, M7 and M8 metabolites on the pathological changes in zebrafish liver tissues
Because the middle concentration of BIC and the M7 metabolite had an influence on the expression of related genes, the activity of transaminase, and the highest survival rate among the three concentrations, histologic sections were prepared for the middle concentration treatment and control groups (Fig. 9). In the control group, hepatocytes were aligned equably, the cytoplasm was evenly distributed, and the nuclei appeared as regular circles in the centre of the cells. Compared with the control group, pathological features of sparse cytoplasm, nuclear atrophy, and vacuolisation were observed in the model group. However, the pathological features of sparse cytoplasm and vacuolisation were alleviated in BIC and the M7 metabolite treatment groups. In addition, the M8 metabolite effectively alleviated intercellular vacuolisation.
4 Conclusion
In conclusion, we provide an economical and highly efficient method for preparing monomeric compounds from complex samples. First, MAR was chosen to remove endogenous impurities and enrich sample for the strong adsorption. Second, the sample was segmented into three fractions for the next monomeric preparation, which was visualized by offline 2D LPLC/HPLC system. Then, the preparative chromatographic conditions were linearly enlarged from an analytical to prepare the six metabolites. To improve the preparative efficiency, recycling prep-HPLC was used to prepare Fr1 and Fr3, and the efficiency of preparing Fr1 and Fr3 was increased to three and four times, respectively. Furthermore, the purity of all prepared metabolites was greater than 98%, and the structure was verified by 1H and 13C spectra. Finally, in the INH-induced liver injury zebrafish model, the M7 metabolite was superior to BIC in the upregulation of PPARα and PPARγ, and in reducing the activity of AST, suggesting that the M7 metabolite is a candidate compound for the treatment of liver injury. As the metabolic activities in rat and human cab be completely different (Videau et al., 2012), the study of the metabolism of BIC in human will be conducted to verify the M7 active metabolites in the future.
Funding sources
This work was supported by grants from the National Natural Science Foundation of China (81793289); Shanghai Key Clinical Discipline Construction Project (02. DY11.03.19.03); Shanghai Songjiang District Science and technology research project (2020SJ277); Special fund for clinical research of Wu Jieping Medical Foundation (320.6750.2021-2-75). 2022 Bethune Quest - Pharmaceutical research capacity Building Program(Z04JKM202100); Shanghai Sailing Program (21YF1436300).
CRediT authorship contribution statement
Xucong Huang: Data curation, Conceptualization, Methodology, Formal analysis, Writing – original draft. Zhenghua Wu: Data curation, Conceptualization, Formal analysis. Xijier Qiaolongbatu: Data curation, Conceptualization. Han Qu: Data curation, Conceptualization. Cui Ma: Data curation, Conceptualization. Yujie Xiang: Data curation, Conceptualization. Mengqi Jia: Data curation, Conceptualization. Yanchao Liu: Data curation, Conceptualization. Shuowen Wang: Data curation, Conceptualization. Lili Jing: Data curation, Conceptualization. Xinhui Jiang: Writing – review & editing. Yuefen Lou: Writing – review & editing. Guorong Fan: Project administration, Writing – review & editing.
Declaration of Competing Interest
The authors declare that they have no known competing financial interests or personal relationships that could have appeared to influence the work reported in this paper.
References
- Pilot continuous centrifugal liquid-liquid extraction of extra virgin olive oil biophenols and gram-scale recovery of pure oleocanthal, oleacein, MFOA, MFLA and hydroxytyrosol. Sep. Purif. Technol.. 2021;255
- [CrossRef] [Google Scholar]
- Characterization of in vivo and in vitro metabolites of furanodiene in rats by high performance liquid chromatography-electrospray ionization mass spectrometry and nuclear magnetic resonance spectra. J. Pharm. Biomed. Anal.. 2013;86:161-168.
- [CrossRef] [Google Scholar]
- Leishmanicidal compounds of Nectria pseudotrichia, an endophytic fungus isolated from the plant Caesalpinia echinata (Brazilwood) Mem Inst. Oswaldo Cruz.. 2018;113:102-110.
- [CrossRef] [Google Scholar]
- Preparative isolation of arylbutanoid-type phenol [(-)-rhododendrin] with peak tailing on conventional C18 column using middle chromatogram isolated gel column coupled with reversed-phase liquid chromatography. J. Sep. Sci.. 2020;43:3233-3241.
- [CrossRef] [Google Scholar]
- Large-scale preparative isolation of bergenin standard substance from Saxifraga atrata using polyamide coupled with MCI GEL(R) CHP20P as stationary phases in medium pressure chromatography. J. Chromatogr. B Anal. Technol. Biomed. Life Sci.. 2021;1170:122617
- [CrossRef] [Google Scholar]
- Targeted isolation of 1,1-diphenyl-2-picrylhydrazyl inhibitors from Saxifraga atrata using medium- and high- pressure liquid chromatography combined with online high performance liquid chromatography-1,1-diphenyl-2- picrylhydrazyl detection. J. Chromatogr. A. 2021;1635:461690
- [CrossRef] [Google Scholar]
- A fast and efficient preparative method for separation and purification of main bioactive xanthones from the waste of Garcinia mangostana L. by high-speed countercurrent chromatography. Arab. J. Chem.. 2021;14
- [CrossRef] [Google Scholar]
- Chromatographic recovery and purification of natural phytochemicals from underappreciated willow bark water extracts. Sep. Purif. Technol.. 2021;261
- [CrossRef] [Google Scholar]
- Targeted isolation of 1,1-diphenyl-2-picrylhydrazyl inhibitors from Saxifraga atrata and their antioxidant activities. J. Sep. Sci.. 2022;45:2435-2445.
- [CrossRef] [Google Scholar]
- Role of pharmacologically active metabolites in drug discovery and development. Drug Discov. Today. 2006;11:133-142.
- [CrossRef] [Google Scholar]
- Identification of bicyclol metabolites in rat plasma, urine and feces by UPLC-Q-TOF-MS/MS and evaluation of the efficacy and safety of these metabolites based on network pharmacology and molecular docking combined with toxicity prediction. J. Pharm. Biomed. Anal.. 2022;220:114947
- [CrossRef] [Google Scholar]
- Bio-guided fractionation and characterization of powerful antioxidant compounds from the halophyte Inula crithmoїdes. Arab. J. Chem.. 2020;13:2680-2688.
- [CrossRef] [Google Scholar]
- Mechanism of isoniazid-induced hepatotoxicity in zebrafish larvae: Activation of ROS-mediated ERS, apoptosis and the Nrf2 pathway. Chemosphere. 2019;227:541-550.
- [CrossRef] [Google Scholar]
- Resolution of the Hypoxylon fuscum Complex (Hypoxylaceae, Xylariales) and Discovery and Biological Characterization of Two of Its Prominent Secondary Metabolites. J Fungi (Basel).. 2021;7
- [CrossRef] [Google Scholar]
- Preparation of inulin-type fructooligosaccharides using fast protein liquid chromatography coupled with refractive index detection. J. Chromatogr. A. 2013;1308:52-57.
- [CrossRef] [Google Scholar]
- Peruranolides A-D, four new withanolides with potential antibacterial and cytotoxic activity from Physalis peruviana L. Front. Biosci. (Landmark Ed).. 2022;27:98.
- [CrossRef] [Google Scholar]
- A simple and efficient method for the extraction and purification of tuberostemonine from Stemonae Radix using an amide group-based monolithic cartridge. Sep. Purif. Technol.. 2022;300
- [CrossRef] [Google Scholar]
- Preparative separation of minor saponins from Panax notoginseng leaves using biotransformation, macroporous resins, and preparative high-performance liquid chromatography. J. Ginseng Res.. 2019;43:105-115.
- [CrossRef] [Google Scholar]
- Preparation and structural determination of four metabolites of senkyunolide I in rats using ultra performance liquid chromatography/quadrupole-time-of-flight tandem mass and nuclear magnetic resonance spectra. BMC Complement. Altern. Med.. 2016;16:504.
- [CrossRef] [Google Scholar]
- Combining HPLC-DAD-QTOF-MS and HPLC-SPE-NMR to Monitor In Vitro Vitetrifolin D Phase I and II Metabolism. Metabolites. 2021;11
- [CrossRef] [Google Scholar]
- Ethanolic extract of propolis (EEP) enhances the apoptosis- inducing potential of TRAIL in cancer cells. Molecules. 2009;14:738-754.
- [CrossRef] [Google Scholar]
- A study of intestinal absorption of bicyclol in rats: Active efflux transport and metabolism as causes of its poor bioavailability. J. Pharm. Pharm. Sci.. 2008;11:97-105.
- [CrossRef] [Google Scholar]
- Can a cocktail designed for phenotyping pharmacokinetics and metabolism enzymes in human be used efficiently in rat? Xenobiotica. 2012;42:349-354.
- [CrossRef] [Google Scholar]
- Preparative separation of isoquinoline alkaloids from Corydalis impatiens using middle chromatogram isolated gel column coupled with positively charged reversed-phase liquid chromatography. J. Sep. Sci.. 2020;43:2521-2528.
- [CrossRef] [Google Scholar]
- Efficient separation of high-purity compounds from Oxytropis falcata using two-dimensional preparative chromatography. J. Sep. Sci.. 2017;40:3593-3601.
- [CrossRef] [Google Scholar]
- The Gastrointestinal Tract Metabolism and Pharmacological Activities of Grosvenorine, a Major and Characteristic Flavonoid in the Fruits of Siraitia grosvenorii. Chem. Biodivers.. 2015;12:1652-1664.
- [CrossRef] [Google Scholar]
- Protective effect of Hedyotis diffusa willd. Ethanol extract on isoniazid-induced liver injury in the Zebrafish Model. Drug Des. Devel. Ther.. 2022;16:1995-2015.
- [CrossRef] [Google Scholar]
- Drug activity screening based on microsomes-hydrogel system in predicting metabolism induced antitumor effect of oroxylin A. Sci. Rep.. 2016;6:21604.
- [CrossRef] [Google Scholar]
- Separation and Enrichment of Three Coumarins from Angelicae Pubescentis Radix by Macroporous Resin with Preparative HPLC and Evaluation of Their Anti-Inflammatory Activity. Molecules. 2019;24
- [CrossRef] [Google Scholar]
- Efficient preparation of extremely high-purity surfactin from fermentation broth by ethanol extraction. Sep. Purif. Technol.. 2023;304
- [CrossRef] [Google Scholar]
- Purification of high-purity glycyrrhizin from licorice using hydrophilic interaction solid phase extraction coupled with preparative reversed-phase liquid chromatography. J. Chromatogr. B Anal. Technol. Biomed. Life Sci.. 2017;1040:47-52.
- [CrossRef] [Google Scholar]
- Preparation and quantification of the total phenolic products in Citrus fruit using solid-phase extraction coupled with high-performance liquid chromatography with diode array and UV detection. J. Sep. Sci.. 2016;39:3806-3817.
- [CrossRef] [Google Scholar]
- Hepatotoxicity Induced by Isoniazid-Lipopolysaccharide through Endoplasmic Reticulum Stress, Autophagy, and Apoptosis Pathways in Zebrafish. Antimicrob. Agents Chemother.. 2019;63
- [CrossRef] [Google Scholar]
- Isolation and identification of two galangin metabolites from rat urine and determination of their in vitro hypolipidemic activity. Trop. J. Pharm. Res.. 2016;15
- [CrossRef] [Google Scholar]
- Isoniazid promotes the anti-inflammatory response in zebrafish associated with regulation of the PPARgamma/NF-kappaB/AP-1 pathway. Chem. Biol. Interact.. 2020;316:108928
- [CrossRef] [Google Scholar]
- Preparation and purification of raffinose family oligosaccharides from Rehmannia glutinosa Libosch. by fast protein liquid chromatography coupled with refractive index detection. Sep. Purif. Technol.. 2014;138:98-103.
- [CrossRef] [Google Scholar]
Appendix A
Supplementary material
Supplementary data to this article can be found online at https://doi.org/10.1016/j.arabjc.2023.105107.
Appendix A
Supplementary material
The following are the Supplementary data to this article: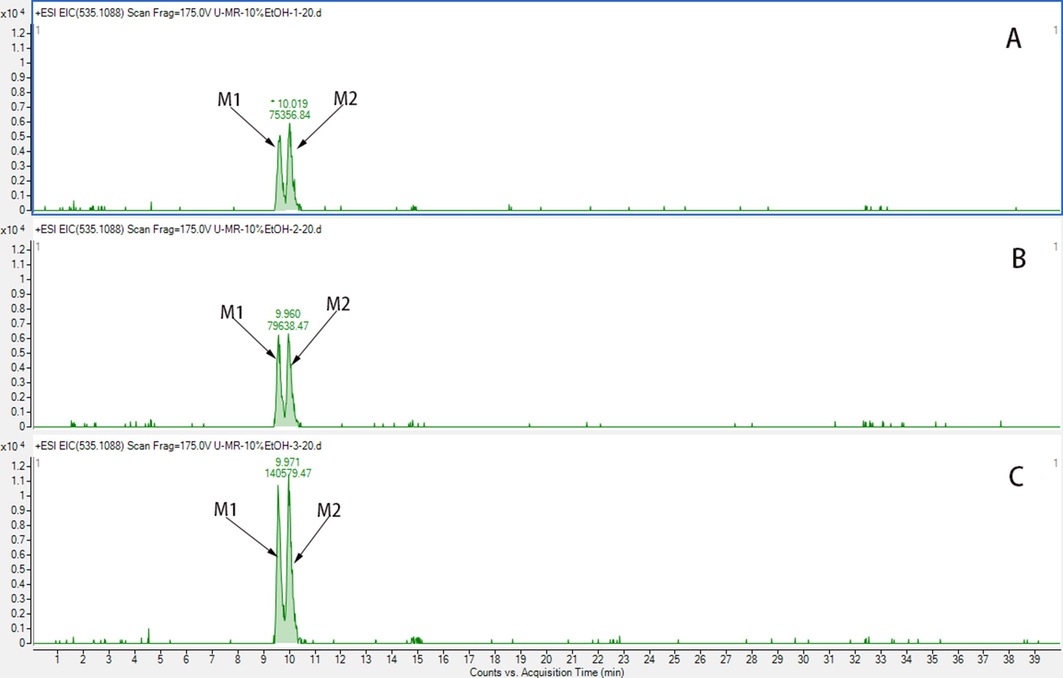
The EIC of M1 and M2 of 10% EtOH on different resins; A, Pretreatment with D101 resin; B, Pretreatment with HPD-300 resin; C, Pretreatment with HPD-400 resin.
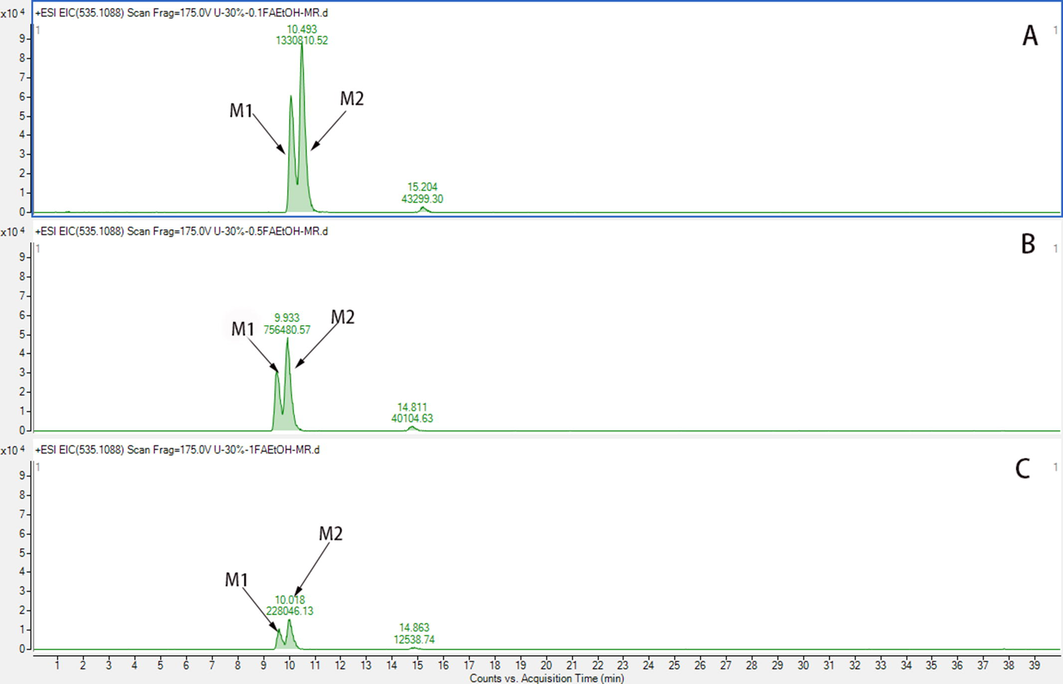
The EIC of M1 and M2 of 30% EtOH on different FA; A, 0.1% FA; B, 0.5% FA; C, 1% FA.
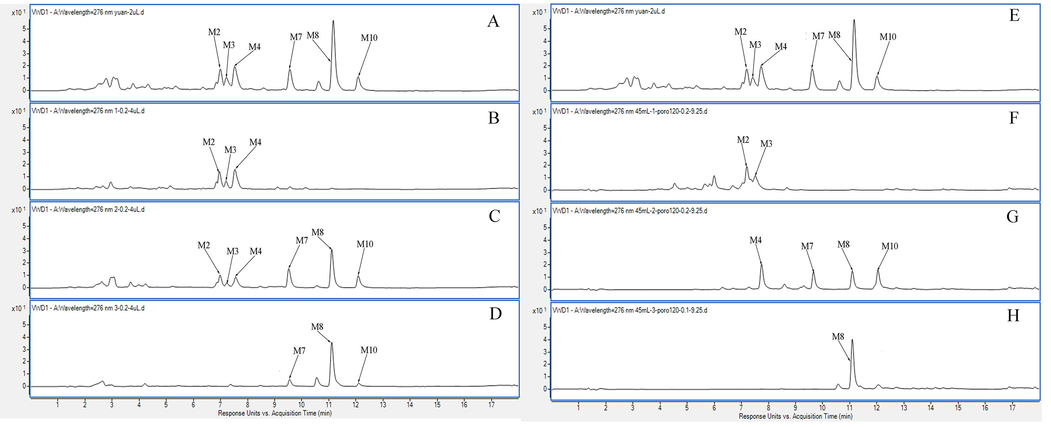
Typical UV chromatogram. A. After treatment with D101 resin; B. 30% EtOH of D101 resin; C. 40% EtOH of D101 resin; D. 50% EtOH of D101 resin; E. After treatment with MCI GEL®CHP20P; F. 50% EtOH of MCI; G. 60% EtOH of MCI; H. 70% EtOH of MCI.
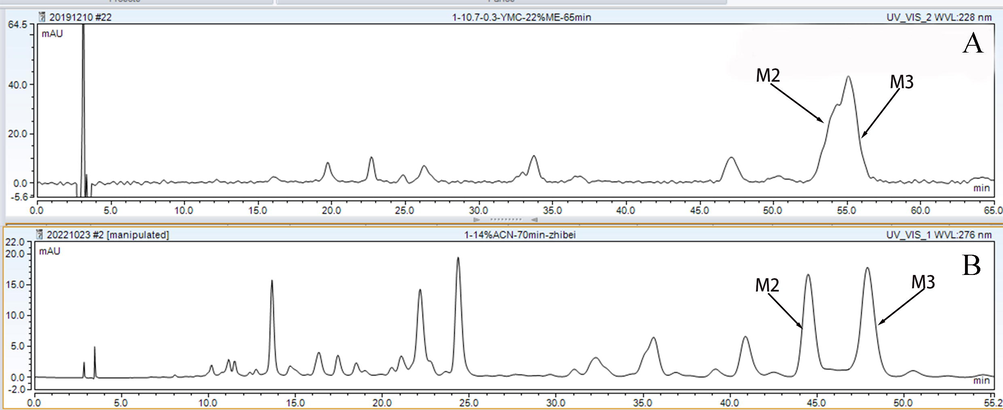
The analytical chromatogram of Fr1 on different mobile phases; A, 22% ME; B, 14%ACN.
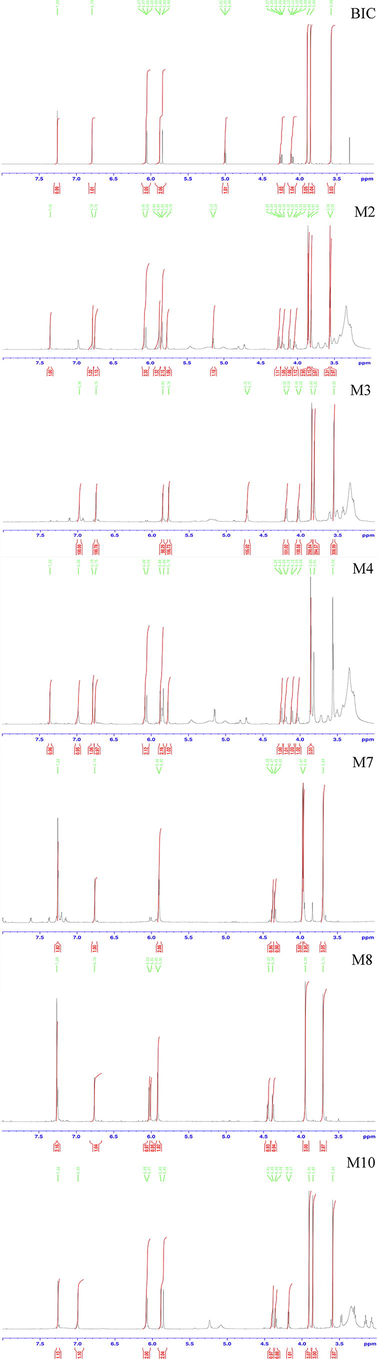
The 1H spectrum of BIC and six metabolites.
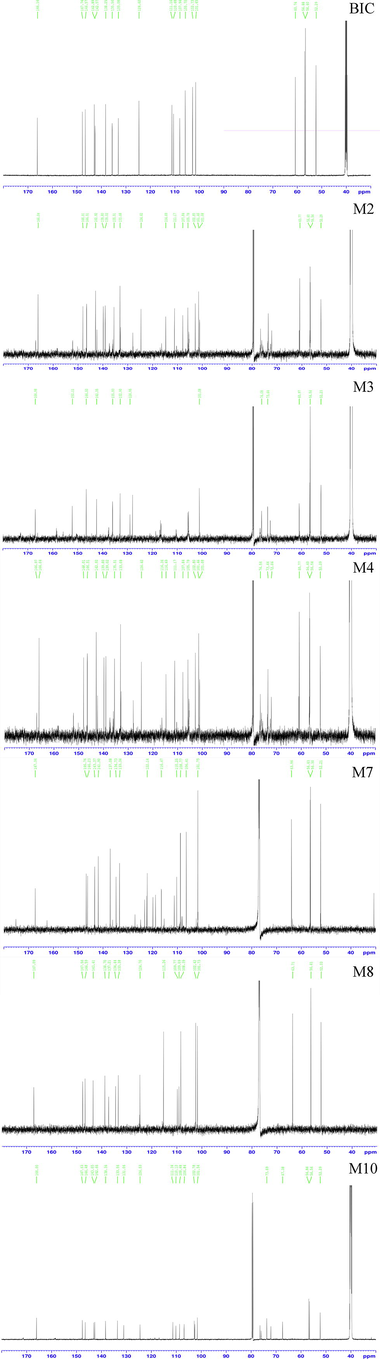
The 13C spectrum of BIC and six metabolites.


