

Translate this page into:
Simulation research on Jamin effect and oil displacement mechanism of CO2 foam under microscale
⁎Corresponding author. wangfeiupc@163.com (Fei Wang)
-
Received: ,
Accepted: ,
This article was originally published by Elsevier and was migrated to Scientific Scholar after the change of Publisher.
Peer review under responsibility of King Saud University.
Abstract
Abstract
CO2 foam can solve the problems of serious water invasion in the later stage of water injection development of conventional reservoirs, fracture channeling in unconventional reservoirs and low production rate of medium and low permeability reservoirs caused by reservoir heterogeneity, and the Jamin effect is the key to its role. In order to investigate the influence of injection rate, liquid phase viscosity, surface tension, pore structure on the resistance of CO2 foam through the pore throat and the influence of CO2 foam Jamin effect on enhancing oil recovery, the micro-scale pore throat models were established, and the interface changes were traced by using the level set and phase field methods. The results show that the greater the injection rate or liquid phase viscosity, the greater the pressure and the foam film strength, the greater the Jamin effect resistance; Jamin effect resistance is positively related to surface tension, the greater the surface tension, the greater the driving force required for difficult deformation; Jamin effect resistance is negatively related to radius of pore throat, the greater the radius of pore throat (the smaller the pore-throat ratio), the smaller the Jamin effect resistance; CO2 foam plays an important role in the oil displacement, and it can displace the oil trapped on the wall, and the oil recovery of CO2 foam flooding is 9% higher than that of water flooding. The smaller the oil–water interfacial tension is, the more CO2 foam displacement is. These research results have certain theoretical significance for the effective use of CO2 foam in oilfield development.
Keywords
CO2 foam
Jamin effect
Level set
Micro-scale
Influence factors
Oil recovery

1 Introduction
The most important issue in the development of oil and gas fields is to enhance oil recovery. In recent years, the technology of gas injection to enhance oil recovery has developed rapidly, especially the technology of CO2 injection to enhance oil recovery (Li et al., 2021; Ma et al., 2015; Zeng et al., 2020; Yu et al., 2015; Janna and Le-Hussain, 2020). CO2 flooding can not only protect the environment and reduce greenhouse gases (Janna and Le-Hussain, 2020), but also has very good oil displacement effect. It has unique technical advantages in improving oil recovery and controlling water and oil production, which has both economic and environmental benefits. However, due to the low gas viscosity and heterogeneity of oil layers, especially some unconventional reservoirs, natural fractures are developed and most of them are put into production by fracturing in the process of CO2 injection development, it is prone to viscous fingering and channeling, which seriously affects the recovery factor of CO2 flooding. Prevention and control of channeling (Shen et al., 2021; Zhang et al., 2019) has always been an important research direction to improve the effect of CO2 recovery. Because of its unique advantages, foam fluid can improve the apparent viscosity of gas, expand the swept volume, and effectively reduce the relative permeability of gas (Lang et al., 2020; Clark et al., 2018), so as to control the mobility of gas during CO2 injection (Sumaiti et al., 2017), solve the problem of fingering and channeling, and enhance the effect of CO2 production increase. CO2 foam produces Jamin effect during the migration of porous media, and increases the pore flow resistance (Sumaiti et al., 2017), which is the key factor to control the gas mobility. Because foam transport in porous media, especially oil displacement process, involves multiphase interface changes and many topological structure changes, foam flow in porous media is very complex.
At present, most of the research is based on physical experiments, and some results with practical value have also been obtained. Physical experiments mainly include core displacement experiments (Li et al., 2021) (including sand-packs, artificial and natural cores) and microscopic mechanism analysis by using visual equipment (Lv et al., 2018), and mainly discuss three aspects: first, the unique physical properties of foam, including the high viscosity of foam, the selectivity of foam to oil and water layers and permeability; Second, the mechanism of foam enhanced oil recovery, including increasing swept volume and oil washing efficiency; The third is the analysis of the influencing factors of foam displacement process, including permeability, oil saturation and entrance effects. Most of the core experiments are conducted by adding some solid particles, polymers, etc. to improve the stability of CO2 foam (Wei et al., 2019; Bai et al., 2018; Wang et al., 2020; Wei et al., 2020; Yao et al., 2020; Ibrahim and Nasr-El-Din, 2019; Sakthivel et al., 2019; Lv et al., 2020). The increase in stability has indeed improved the oil displacement effect of CO2 foam. In recent years, the application of CT (Shah et al., 2020) and NMR (Shi et al., 2021) technology has also enriched the results of physical experiments. Du Dongxing et al. (Dongxing et al., 2019)used CT technology to visualize the transient CO2 foam displacement process, and conducted dual energy CT measurement. Through obtaining dynamic three-phase saturation distribution, they found that foam can promote most of the liquid phase to the second half of the porous medium, while the first half is less displaced, showing an obvious entrance effect in the foam displacement process. Li Songyan et al. (Li et al., 2020) used NMR to conduct an experimental study on the oil displacement and oil control effect of CO2 oil-based foam in fractured low-permeability cores, indicating that CO2 oil-based foam reduces the mobility of CO2, making the oil displacement of the whole core relatively increase. The visualization equipment used in the microscopic mechanism analysis experiment includes: glass etching (or photolithography) micromodel (Mingming Lv et al., 2018), microfluidic chip (Li and Prigiobbe, 2020), 3D printing medium (Shojaei et al., 2018), high-precision microscope, etc. It mainly analyzes and evaluates the flow characteristics of CO2 foam in the micro model.
Because the formation environment is complex and changeable, physical experiments often differ greatly from the actual situation of the formation, we still need to carry out reasonable numerical simulation to grasp more rules and qualitatively describe the process of CO2 foam flooding. At present, there are also sufficient models (Jian et al., 2019; Kahrobaei and Farajzadeh, 2019; Almajid et al., 2019; Mingming Lv et al., 2018) and simulation results on CO2 and foam displacement, such as the population balance model for simulating foam, but these models lack intuitive understanding of the CO2 foam displacement process, and the action mechanism of the fine parts of the pore throat is usually fuzzy, which can become a key part of the description of foam displacement.
In this work, the micro-scale pore throat models were established, and the interface changes were traced by using the level set and phase field methods. The influence of injection rate, liquid phase viscosity, surface tension, pore structure on the resistance of CO2 foam through the pore throat and the influence of CO2 foam Jamin effect on enhancing oil recovery were investigated. These research results have certain theoretical significance for the effective use of CO2 foam in oilfield development.
2 Establishment of models
2.1 Mathematic model
The mathematical model is mainly based on the level set model to track the changes of the interface, implicitly express the interface as the zero-level set of the high one-dimensional level set function, and reflect any signals about the structure topology and the structure boundary into the zero-level set to meet the needs of optimization conditions and drive the movement of the zero-level set. Then the level set equation can be obtained by topology optimization of the structure. The evolution process of the level set (Wang et al., 2019) is described as follows:
The Navier-Stokes equation with surface tension is:
Where, the quantity is the level set function; t is the time; interface movement speed; reinitialize parameters for the interface; is the interface thickness control parameter; is the interface normal vector; is the fluid density; is the power viscosity; where the subscripts l and g denote the liquid and gas phases, respectively, for the gas phase, > 0.5, and the liquid phase < 0.5; is the continuity equation; is the volumetric surface tension formed by equating the surface tension to a finite thickness fluid range at the gas–liquid interface; is the surface tension coefficient; is the Dirac function;I is unit matrix, p is pressure field.
Besides, In the comparison of water flooding and CO2 foam flooding, the model builds comprehensive level set and phase field method.
2.2 Geometric model
In this paper, two geometric models are established. One is used to study the Jamin effect and influencing factors of CO2 foam; The other is to analyze the displacement effect of CO2 foam;
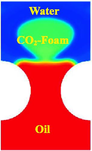
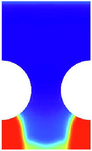
As shown in Fig. 1, the diameter of the pore throat at the left end is 200 μm, the diameter of the narrow pore throat at the right end is 50 μm, and the bubble diameter is 160 μm. In exploring the influencing factors of the Jamin effect, this paper mainly selects a base point (yellow) of the model for the study, obtains the pressure value at this point, and continuously changes the magnitude of the flow rate, liquid phase viscosity, surface tension and pore throat ratio to study the relationship between the pressure and factors at this base point. Fig. 2 shows two models, a and b. A is used to simulate CO2 foam flooding, and b is used to simulate water flooding. Both models are three-dimensional models generated by rotating in a two-dimensional plane. It can be seen from the figure that the two models are almost the same, except that a CO2 foam with a radius of 9 mm is added in b.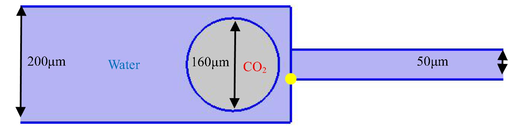
Geometric model of Jamin effect.
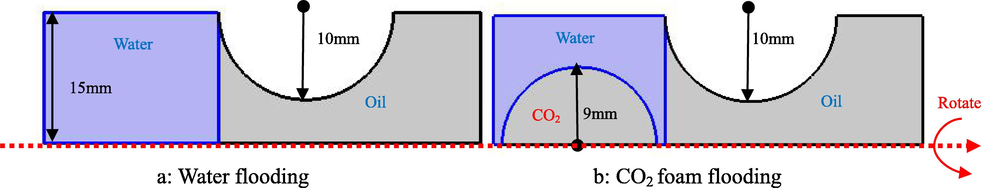
Geometric model of oil displacement effect.
2.3 Simulation process
2.3.1 Flow pattern selection
The simulation of Jamin effect is based on gas–liquid two-phase laminar flow [24], and the N-S equation with surface tension term is used to further modify the gas–liquid surface tension, so as to achieve the effect of simulating foam.
In the analysis of CO2 flooding process, the three-phase flow mode is selected, and the coupling calculation is carried out by using the phase field method and the separated multiphase flow model.
2.3.2 Conditions setting
For model 1 (Fig. 1), the initial pressure velocity is 0 Pa, the wall boundary condition is no slip, the gas is CO2, and the liquid is water. The preset conditions: the surface tension is 0.005 N/m, the inlet is filled with water, the velocity is 0.001 m/s, the outlet pressure is 0 Pa, and the wall contact angle is π/6. In the analysis of influencing factors, change one of the parameters, and refer to this preset parameter for other parameters. The total simulation time is 0.2 s.
For model 2 (Fig. 2), the initial pressure velocity is 0 Pa, the wall boundary condition is no slip, the gas is CO2, the oil is kerosene and the liquid is water. The preset conditions: the interfacial tension between oil and water is 0.02 N/m, the interfacial tension between oil and gas is 0.03 N/m, and the interfacial tension between gas and water is 0.018 N/m, the inlet is filled with water, the velocity is 0.1 m/s, the outlet pressure is 0 Pa, the oil–water contact angle, oil–gas contact angle, and water–gas contact angle are all π/2. In the analysis of influencing factors, change one of the parameters, and refer to this preset parameter for other parameters. The total simulation time is 0.2 s.
The re-initialization parameter of the level set model is set to 0.1 m/s.
2.3.3 Simulation content
Firstly, model 1 is used to carry out dynamic simulation of Jamin effect of CO2 foam, and analyze changes in morphology and pressure. Secondly, the effects of injection rate, surface tension, liquid phase viscosity, surface tension and pore throat structure on Jamin effect were analyzed by changing the parameters. The simulation results were quantitatively characterized, and the flow process was summarized and analyzed.
The model 2 is used to analyze the mechanism of CO2 foam flooding. Under the same conditions, the change of residual oil volume in the process of water flooding and CO2 foam flooding is compared and analyzed. The calculation formula of residual oil volume is as follows:
In addition, the surface tension, the key parameter for foam to play a role, is emphatically analyzed. Under different surface tensions, the change of remaining oil is analyzed to obtain the influence of foam with different properties on CO2 foam flooding.
3 Simulation results and discussion
3.1 Dynamic simulation of CO2 Jamin effect
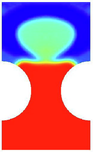
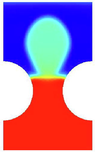
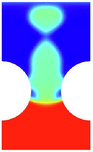
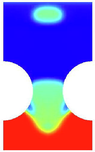
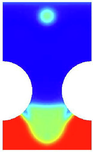
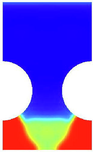
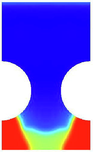
Fig. 3 shows that the diameter of CO2 foam is larger than the diameter of the rear half pore throat, and the foam starts to deform and stretch gradually when it touches the narrow pore throat driven by the driving fluid, at this time the bubble is smaller than the radius of curvature of the back-end foam because the radius of curvature of the front end of the deformed foam, so the resistance is generated through the pore throat because of the Jamin effect based on Laplace's equation, and the foam needs to overcome additional resistance under the action of the pressure difference between the two ends when passing through the pore throat. When the pressure of the driving fluid is greater than the resistance, the foam moves forward, and the resistance is related to the curvature radius of the foam before and after deformation. In other words, the greater the pressure of the driving fluid, the greater the deformation and stretching of the foam. In fact, in both uniform and inhomogeneous media, countless tiny foams also produce superimposed Jamin effect, which prevent the foam to pass through (Li et al., 2015; Nguyen et al., 2014). When enough foam enters in the high permeability layer, the Jamin effect has a blocking effect, forcing the foam to move to the low permeability layer, driving the crude oil in the low permeability layer, making the inlet profile more uniform in both high and low permeability layers, especially in fractured reservoirs with CO2 injection (Singh and Mohanty, 2017; Seddiqi et al., 2023; Songyan, et al., 2008; Xu et al., 2020; Sun et al., 2015), it can control the gas channeling of CO2. It has an important role in increasing the recovery of medium and low permeability reservoirs.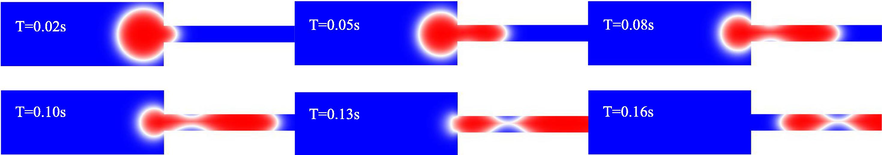
Simulation process of Jamin effect.
It can be seen in Fig. 4 that the pressure of CO2 foam rises rapidly to the highest point when it first enters the narrow pore throat, and the pressure gradually tends to a stable state at the highest point during the process of CO2 foam completely entering the small pore throat from the large pore, and the pressure drops rapidly when the foam completely passes through the narrow pore throat, even down to a negative pressure of 120 pa. This also microscopically illustrates the mechanism by which the foam can achieve negative pressure operation. Besides, the corresponding moments (yellow dots) are consistent with those in Fig. 3, which are 0.02 s, 0.05 s, 0.08 s, 0.10 s, 0.13 s and 0.16 s respectively.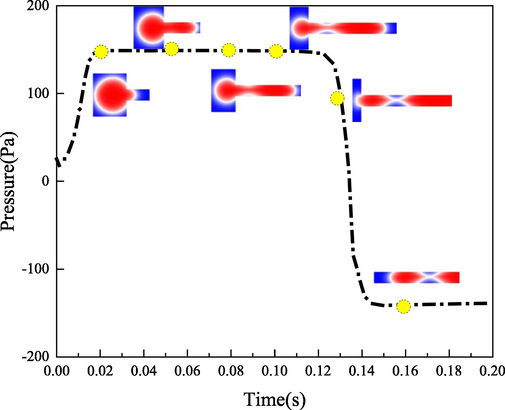
Pressure variation in Jamin effect process with time.
3.2 Influence of injection rate on CO2 Jamin effect
The geometric model is as Fig. 1, the gas is CO2, the liquid is water, set the surface tension 0.005 N/m, the wetting angle is π/6, change the injection rate to 0.001 m/s,0.005 m/s, 0.010 m/s, 0.020 m/s, and analyze the effect of injection rate on the CO2 Jamin effect is analyzed, and the simulation results are as follows.
According to the comprehensive analysis in Figs. 5 and 6, with the increase of injection rate and injection pressure, the time of deformation of the CO2 foam and the time of passing through the narrow pore throat are shortened. At the same time, the greater the injection rate, the greater the deformation of the CO2 foam. Therefore, when the CO2 foam passes through the narrow pore throat, the greater the capillary resistance that needs to overcome the Jamin effect, and the greater the starting pressure (black dotted line arrow). When the injection rate is low, the pressure will rise slowly, but with the increase of the injection rate, the pressure rise trend will decrease, or even directly rise to the maximum value (0.02 m/s). The CO2 foam passes through the narrow channel in a very short time, and when it completely enters the channel, the pressure begins to decline, and the greater the injection rate, the shorter the time it takes to decline to the minimum value. When the CO2 foam passes through the channel, it deforms and needs to overcome the shear stress, so it will generate pressure, and the pressure will gradually rise. When the foam completely passes through the narrow channel, the pressure will no longer rise, and it will reach a plateau value and tend to be stable, but the stable value of the pressure is always smaller than the maximum value, which is also consistent with the macro displacement experiment process (the pressure will rise first and then decline and tend to be stable). In general, the greater the injection rate, the greater the maximum pressure generated and the greater the stable value of pressure.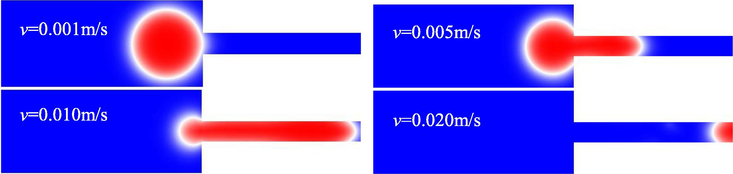
Simulation diagram at different flow rates (T = 0.01 s).
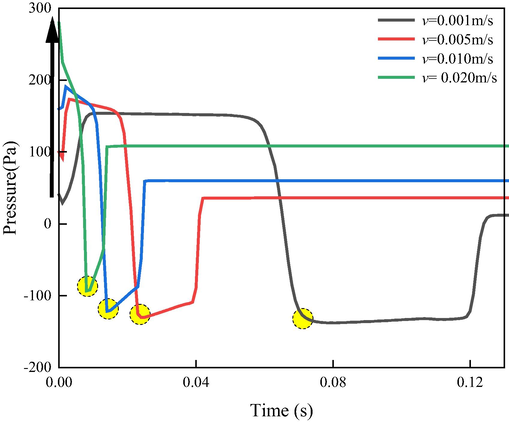
Pressure variation with time at different flow rates.
In order to further clarify the influence of injection rate on pressure, the relationship between maximum pressure and injection rate is analyzed, as shown in Table 1, Fig. 7.
Injection rate(m/s)
Maximum pressure(Pa)
0.001
153.9
0.005
173.4
0.01
190.56
0.02
279.34
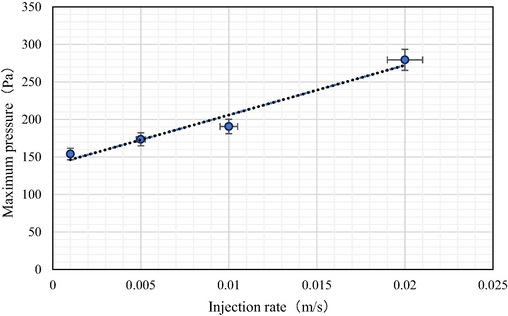
Pressure variation with time at different injection rate.
Table 1 and Fig. 7 show that the maximum pressure increases with the increase of injection rate during the CO2 foam transport, and the trend line is obtained by fitting the data through the least squares method, which shows that the Jamin effect is positively correlated with the injection rate, and the higher the injection rate of the foam when passing through the narrow pore throat, the higher the resistance of the Jamin effect.
3.3 Effect of liquid phase viscosity on the CO2 Jamin effect
The geometric model is as Fig. 1, the gas is CO2, the liquid phase is water, set the surface tension 0.005 N/m, the injection rate is 0.001 m/s, the wetting angle is π/6, change the viscosity of the liquid phase to 0. 05 Pa.s, 0. 10 Pa.s, 0. 50 Pa.s, 1. 00 Pa.s. The effect of liquid phase viscosity on the Jamin effect is analyzed and the simulation results are as follows.
According to the analysis in Fig. 8 and Fig. 9, the front end of the foam can only pass through the narrow channel if the corresponding deformation occurs. At the same time, the CO2 foam enters the narrow pore throat under the driving force. With the increase of the liquid viscosity, the strength of the foam liquid film is greater, and the deformation of the foam is more difficult. The greater the resistance of Jamin effect that needs to be overcome, the greater the pressure generated. When the CO2 foam enters the narrow channel, the instantaneous starting pressure reaches the peak, After the foam completely enters the narrow channel, the pressure will drop and gradually reach the lowest value because it no longer needs to overcome the larger capillary resistance. As the CO2 foam cannot completely pass through the narrow throat in a short time, some bubbles have to overcome the resistance of Jamin effect, and the pressure generated gradually rises. The greater the liquid viscosity is, the greater the maximum and minimum pressure values are. It can be seen from the pressure change amplitude in Fig. 8 that the liquid viscosity has a greater impact on the starting pressure of foam and a smaller impact on the pressure at the time of passing through the throat. It can be seen from the comparison of Fig. 7 that it has little impact on the shape change of foam, and also has a smaller impact on the speed of passing through narrow channels.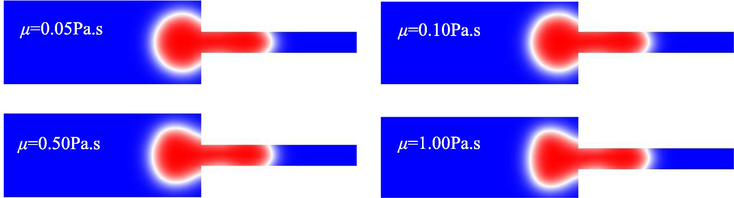
Simulation diagram at different liquid viscosity (T = 0.05 s).
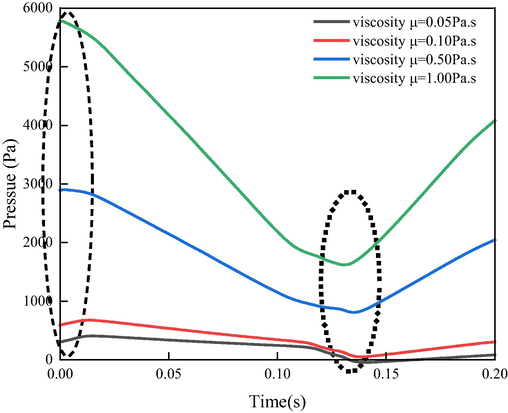
Pressure variation with time under different liquid viscosity.
In order to further clarify the influence of liquid viscosity on pressure, the relationship between maximum pressure and liquid viscosity is analyzed, as shown in Table 2, Fig. 10.
Liquid viscosity(Pa.s)
Maximum pressure(Pa)
0.05
407.17
0.1
676.8
0.5
2903.91
1
5775.79
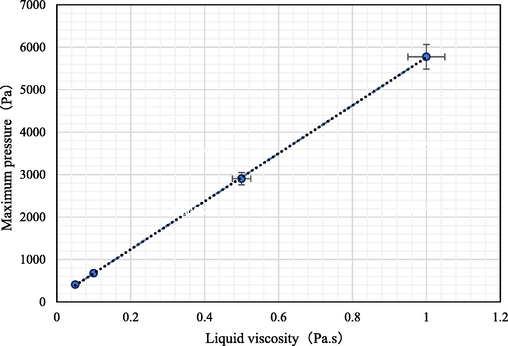
Pressure variation with time at different liquid viscosity.
Fig. 10 show that the maximum pressure increases with the increase of liquid viscosity during the CO2 foam transport, and the trend line is obtained by fitting the data through the least squares method, which shows that the Jamin effect is positively correlated with the liquid viscosity, and the higher the liquid viscosity of the foam, the higher the resistance of the Jamin effect.
3.4 Effect of surface tension on CO2 Jamin effect
The geometric model is as Fig. 1, the injection rate is 0.001 m/s, the wetting angle is π/6. By changing the surface tension to 0.001 N/m, 0.002 N/m, 0.005 N/m, 0.010 N/m, the simulation results are as follows.
Fig. 11 shows the shape of CO2 foam under different surface tensions at the same time (0.008 s). It can be seen that there is little difference in shape. Fig. 12 shows the comparison of the pressure with time at different surface tension during the transport process, and it can be seen that the greater the surface tension, the greater the maximum pressure, and the smaller the minimum pressure. In other words, the greater the amplitude of the pressure. However, it can be seen from the yellow area that the surface tension has little effect on the time of entering the narrow channel (once entering the channel, the pressure starts to drop sharply).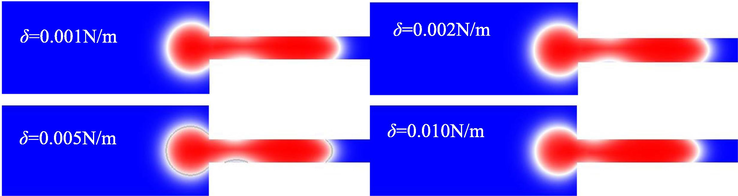
Simulation diagram at different surface tension (0.008 s).
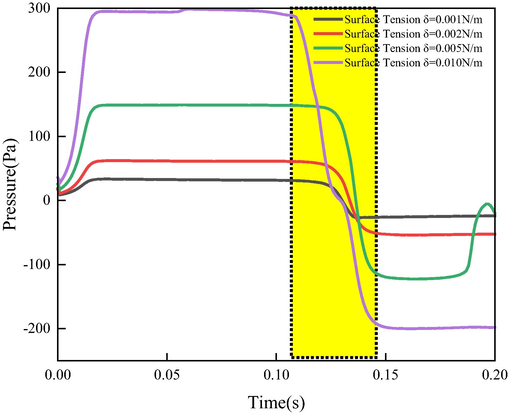
Pressure variation with time at different surface tension.
In order to further clarify the influence of surface tension on pressure, the relationship between maximum pressure and surface tension is analyzed, as shown in Table 3, Fig. 13.
Surface tension(N/m)
Maximum pressure(Pa)
0.001
33.50
0.002
62.06
0.005
149.06
0.010
298.56
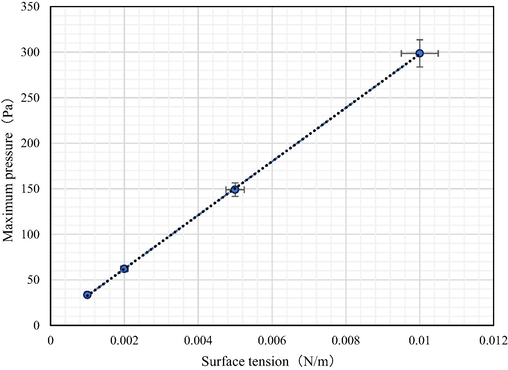
Variation of maximum pressure with surface tension.
Table 3 and Fig. 13 show that the maximum pressure increases with the increase of surface tension during the CO2 foam transport, and the trend line is obtained by fitting the data through the least squares method, which shows that the Jamin effect is positively correlated with the surface tension, and the higher the surface tension of the foam when passing through the narrow pore throat, the higher the resistance of the Jamin effect.
3.5 Effect of pore structure on the CO2 Jamin effect
In order to study the influence of pore throat diameter on CO2 Jamin effect, based on the geometric model in Fig. 1, the size of the left end channel remains unchanged (200 μ m), change the size of the right end channel, and design four groups of models with pore throat ratio (the size of the left end is larger than the right end), which are 5:1, 3.3:1, 2.5:1 and 2:1 respectively. The simulation results are shown in Fig. 14.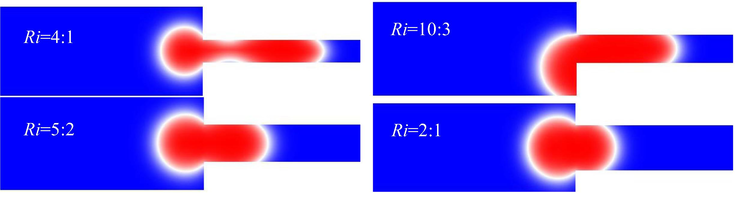
Simulation diagram of Jamin effect with different pore throat ratio.
Similarly, in order to further clarify the relationship between the pore throat ratio and the pressure, the relationship between maximum pressure and pore-throat ratio is analyzed, as shown in Table 4, Fig. 15.
Pore-throat ratio
Maximum pressure(Pa)
4:1
149.06
10:3
134.49
5:2
107.49
2:1
87.50
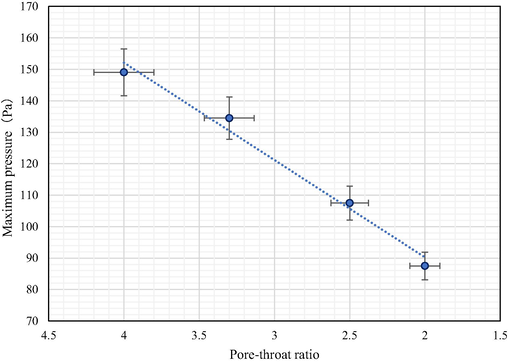
Variation of maximum pressure with pore throat ratio.
It can be seen in Table 4 and Fig. 15 that the maximum pressure gradually decreases as the pore throat ratio decreases. The diameter of the left end channel is fixed, while the diameter of the right end channel gradually increases. Because the wetting angle is unchanged, the larger the diameter of the channel, the greater the radius of curvature, the weaker the CO2 Jamin effect, and the smaller the resistance. According to the least square fitting curve, the pore throat ratio is also positively correlated with the pressure, so the radius of curvature is negatively correlated with Jamin resistance.
3.6 Oil displacement mechanism of CO2 foam
In order to study the effect of CO2 foam Jamin effect on enhancing oil recovery, water flooding and CO2 foam flooding models were established respectively, the only difference between the models is that foam flooding is a three-phase flow and water flooding is a two-phase flow, other conditions are the same. The process of CO2 foam flooding and water flooding are compared and analyzed, and finally the results are processed to calculate the volume fraction of remaining oil according to Formula 4 and compare the oil flooding efficiency of CO2 foam flooding and water flooding.
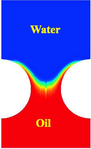
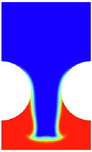
Table 5 shows the dynamic phase distribution results of the central cross section (2D) of the two 3D models. It can be seen from the simulation comparison that the topological structure will change during the CO2 foam oil displacement process, and it will continue to deform and burst, which is consistent with some results in the experiment. The CO2 foam deforms through the narrow channel, the oil, gas and water begin to contact, the three-phase interfacial tension changes, the front end of the CO2 foam deforms, and the foam is stretched. Due to the behind of the lamella, it even snaps off (Radke and Ransohoff, 1985; Liu and Grigg, 2005). With the increase of pressure, the foam gradually passes through the pore throat, producing Jamin effect. The flow resistance increases, and the movement process of the CO2 foam becomes more difficult. At this time, there will be greater resistance, which will reduce the channeling of the water phase because of the occupation behavior of foam, then the oil phase is carried out of the pore throat. The pressure on the pore wall also increases and because of foam is similar to “deformable piston flow”, The driving mode of wall oil is extrusion and scraping, which wraps the oil phase and moves toward the displacement direction. Especially after passing through the narrow channel, it still has a certain oil displacement effect on the subsequent wider channel because of the “negative pressure drainage” mechanism of foam. In comparison, the process of water flooding is relatively simple and the pressure distribution is basically stable, which only washes the oil on the water channel, while the oil outside the channel can rarely be driven.
T = 0.02 s
T = 0.04 s
T = 0.06 s
T = 0.08 s
T = 0.10 s
T = 0.12 s
T = 0.14 s
T = 0.16 s
T = 0.18 s
T = 0.20 s
CO2 Foam

Water


In order to better compare and analyze the displacement effect of CO2 foam and water, the dynamic residual oil volume of the two models is statistically analyzed according to Formula 4. The results are shown in the figure below.
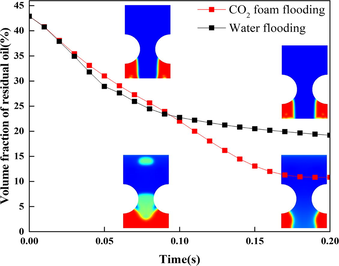
Fig. 16 shows the volume fraction of residual oil during displacement, the reason for the lower oil displacement efficiency at the beginning of the foam flooding compared with the water flooding is that the water flooding does not require any preparation and starts displacement directly, while the foam flooding needs a period of time to deform under the pressure for a period of time, and this deformation also needs a certain amount of time, and the oil displacement efficiency is significantly higher after the foam deformation compared with the water flooding, and the foam flooding relies on the Jamin effect of the foam, which can also be seen from the total volume ratio of the oil phase, and the foam flooding does improve the recovery of crude oil. As this simulation only simplifies the oil displacement process of one bubble, the oil recovery of foam flooding in the figure is 9% higher than that of water flooding, which is already very high(Du et al., 2016; Li et al., 2016).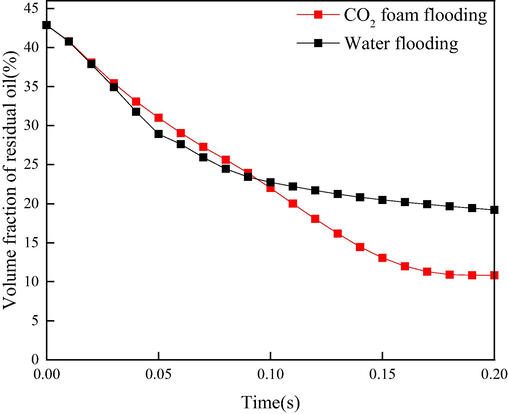
Volume fraction of residual oil in CO2 flooding and water flooding.
According to a large number of experimental studies, in the process of CO2 foam flooding, the performance of foam has a greater impact on the oil displacement effect, and the different interfacial tension between oil and water caused by different surfactants can reflect the different performance of foam. Therefore, we focus on the analysis of the influence of oil–water interfacial tension on the CO2 foam displacement effect.
Fig. 17 shows the phase distribution of CO2 foam flooding at the same time (0.15 s) under different oil–water interfacial tensions. It can be seen that the smaller the interfacial tension between oil and water, the easier the foam will break and produce more small bubbles, and the broken foam will be easier to attach to the wall of the pore throat, replacing more oil on the wall, and the better the oil displacement effect. Similarly, the dynamic volume fraction of residual oil volume under different oil–water interfacial tension is statistically analyzed.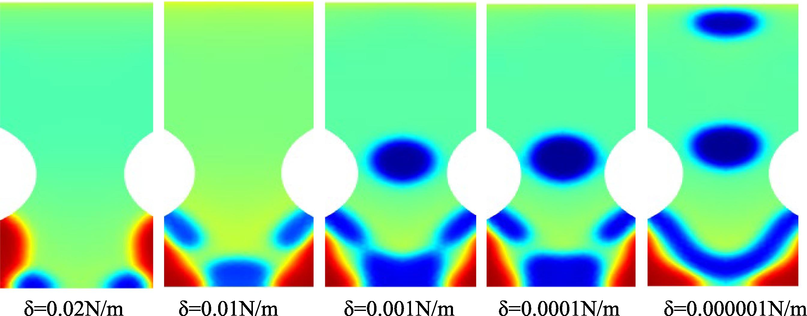
Simulation results under different oil–water interfacial tensions (0.15 s).
As can be seen from Fig. 18, in the first 0.14 s, the volume fraction of remaining oil decreases rapidly, and the oil is displaced out in large quantities. However, under different oil–water interfacial tensions, the volume fraction of remaining oil has little difference, mainly because the early oil displacement is mainly to displace the oil in the pore channel before passing through the pore throat, and the foam performance has little impact on oil displacement. After 0.14 s, it is mainly reflected in the displacement of oil on the front and rear walls by foam, which is closely related to the performance of foam. By magnifying the subsequent curve (0.12 s ∼ 0.20 s), it can be seen that when the interfacial tension reaches 0.0001 N/m and 0.000001 N/m, the oil displacement efficiency has significantly increased, which corresponds to the two dividing points of low interfacial tension and ultra-low interfacial tension, which is consistent with the relevant experimental results.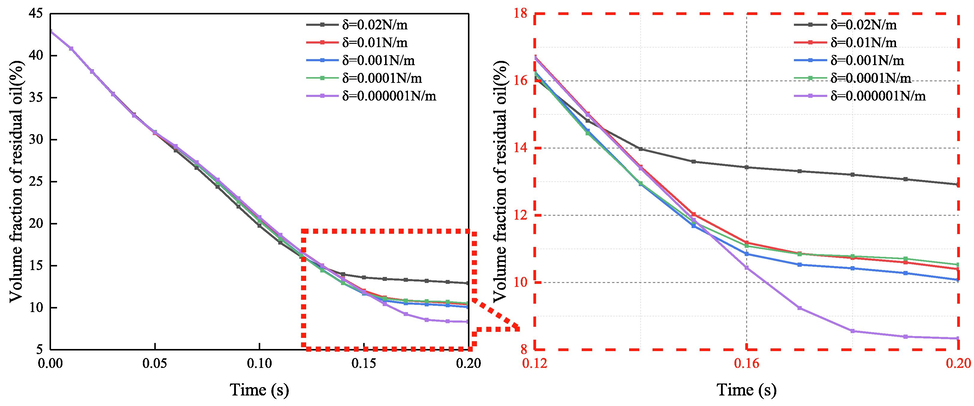
Volume fraction of residual oil under different oil–water interfacial tension.
In order to better analyze the influence of oil–water interfacial tension on the CO2 foam oil displacement effect, we have drawn the curve between oil–water interfacial tension and the final remaining oil, as shown in Fig. 19. The abscissa is the logarithmic coordinate.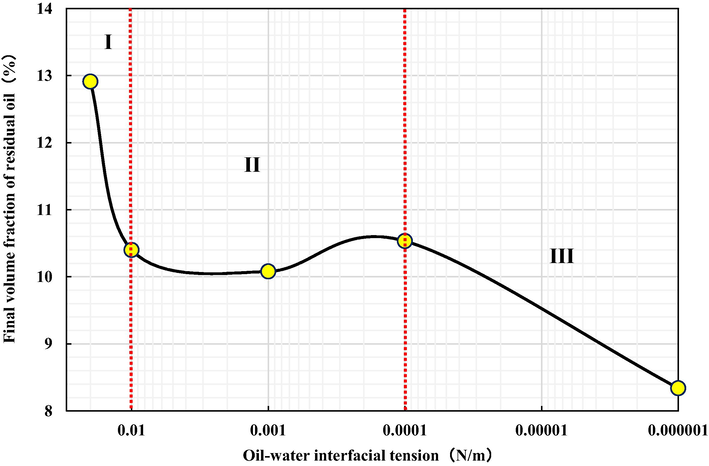
Final volume fraction of residual oil with the changing of oil–water interfacial tension.
From Fig. 19, it can be seen that as the interfacial tension decreases, the overall remaining oil shows a downward trend. Specifically, it can be divided into three stages. The first stage represents a significant decrease in the remaining oil after adding a general foaming agent in the oil displacement process (without foaming agent, the interfacial tension between oil and water is generally 0.02 N/m). The second stage represents that as the interfacial tension decreases, the remaining oil does not change significantly. After entering the third stage, the remaining oil has sharply decreased, which represents the significant impact of low interface (0.0001 N/m) and even ultra-low interface tension (0.000001 N/m) surfactants on oil displacement efficiency.
4 Conclusion
(1) The Jamin effect of foam in formation is visually analyzed through simulation. When the CO2 foam passes through the narrow pore throat, it generates additional resistance, and the foam can pass through the pore throat only when the forward and backward pressure difference is greater than the additional resistance, the pressure of CO2 foam rises rapidly to the highest point when it first enters the narrow pore throat, and the pressure gradually tends to a stable state at the highest point during the process of CO2 foam completely entering the small pore throat from the large pore, and the pressure drops rapidly when the foam completely passes through the narrow pore throat. In fact, the foam will generate superimposed Jamin effect to seal the high permeability layer in the formation.
(2) With the increase of injection rate, the resistance of CO2 Jamin effect increases, the maximum pressure also increases, and the stable value of pressure also increases; with the increase of liquid phase viscosity, the strength of foam liquid film increases, the resistance of Jamin effect increases, and a maximum pressure and a minimum pressure are generated, and their values will both increase.
(3) CO2 Jamin effect resistance is positively correlated with surface tension, the greater the surface tension, the more difficult it is for the foam to deform and the greater the driving force required, the simulation results also clearly show that as the surface tension increases, the maximum pressure increases. CO2 Jamin effect resistance is negatively correlated with the radius of curvature, the simulation results show that the larger the radius of curvature, the smaller the Jamin effect resistance.
(4) The effect of CO2 foam Jamin effect on enhancing oil recovery was analyzed by comparing the process of CO2 foam flooding and water flooding. The topological structure will change during the CO2 foam oil displacement process, and it will continue to deform and burst. Due to Jamin effect, CO2 foam can displace the oil tapped on the wall, and the oil recovery of foam flooding is 9% higher than that of water flooding. The smaller the oil–water interfacial tension is, the more CO2 foam displacement is, especially when the ultra-low interfacial tension is reached.
Acknowledgements
This work was financially supported by the Shandong Provincial Natural Science Foundation (No. ZR2021QE008). We sincerely thank other persons in the Geo-Energy Research Institute for helping with the experimental research.
Declaration of Competing Interest
The authors declare that they have no known competing financial interests or personal relationships that could have appeared to influence the work reported in this paper.
References
- Modeling steady-state foam flow: Hysteresis and backward front movement. Energy Fuel. 2019;33(11):11353-11363.
- [Google Scholar]
- Experimental investigation of nanolaponite stabilized nitrogen foam for enhanced oil recovery. Energy Fuel. 2018;32(3):3163-3175.
- [Google Scholar]
- Clark, Jennifer A, Santiso, et al. Carbon Sequestration through CO2 Foam-Enhanced Oil Recovery: A Green Chemistry Perspective[J]. Engineering, 2018.
- Experimental study on the inlet behavior of CO2 foam three phase displacement processes in porous media. Exp. Therm Fluid Sci.. 2019;103:247-261.
- [Google Scholar]
- Experiments on CO2 foam seepage characteristics in porous media. Pet. Explor. Dev.. 2016;43(3):499-505.
- [Google Scholar]
- Stability improvement of carbon dioxide foam using nanoparticles and viscoelastic surfactants for enhanced-oil-recovery applications. SPE Reserv. Eval. Eng. 2019:SPE191251.
- [Google Scholar]
- Effectiveness of modified CO2 injection at improving oil recovery and CO2 storage-Review and simulations. Energy Rep.. 2020;6:1922-1941.
- [Google Scholar]
- Evaluating the transport behavior of CO2 foam in the presence of crude oil under high-temperature and high-salinity conditions for carbonate reservoirs. Energy Fuel. 2019;33(7):6038-6047.
- [Google Scholar]
- Insights into effects of surfactant concentration on foam behavior in porous media. Energy Fuel. 2019;33(2):822-829.
- [Google Scholar]
- Experimental study and field demonstration of air-foam flooding for heavy oil EOR. J. Pet. Sci. Eng.. 2020;185:106659
- [Google Scholar]
- Li S , Li Z , Li B .EXPERIMENTAL STUDY ON FOAMED GEL FLOW IN POROUS MEDIA.Journal of Porous Media, 2015, 18(5):519-536.
- Experimental study of the stabilization of CO2 foam by sodium dodecyl sulfate and hydrophobic nanoparticles. Ind. Eng. Chem. Res.. 2016;55(5):1243-1253.
- [Google Scholar]
- Complex foam flow in series and parallel through multiscale porous media: Physical model interpretation. Int. J. Heat Mass Transf.. 2021;164:120628
- [Google Scholar]
- Studying the generation of foam in the presence of nanoparticles using a microfluidic system. Chem. Eng. Sci.. 2020;215:115427
- [Google Scholar]
- CO2 injection strategies for enhanced oil recovery and geological sequestration in a tight reservoir: An experimental study. Fuel. 2021;284:119013
- [Google Scholar]
- Monitoring of CO2 and CO2 oil-based foam flooding processes in fractured low-permeability cores using nuclear magnetic resonance (NMR) Fuel. 2020;263:116648
- [Google Scholar]
- Liu Y , Grigg R , Svec R .CO2 Foam Behavior: Influence of Temperature, Pressure, and Concentration of Surfactant[C]//SPE Production Operations Symposium.2005.SPE94307.
- Investigation of pore-scale behaviors of foam flow in a polydimethylsiloxane micromodel. Ind. Eng. Chem. Res.. 2018;57(44):15172-15180.
- [Google Scholar]
- Enhanced oil recovery using aqueous CO2 foam stabilized by particulate matter from coal combustion. Energy Fuel. 2020;34(3):2880-2892.
- [Google Scholar]
- Ma J , Wang X , Gao R , et al. Enhanced light oil recovery from tight formations through CO2 huff 'n' puff processes. Fuel, 2015, 154(aug.15):35-44.
- Mingming Lv, Zhigang Liu, Can Ji, Lei Jia, Yake Jiang. Investigation of Pore-Scale Behaviors of Foam Flow in a Polydimethylsiloxane Micromodel. Industrial & Engineering Chemistry Research, 2018, 57(44), 15172-15180.
- Pore-scale assessment of nanoparticle-stabilized CO2 foam for enhanced oil recovery[J] Energy Fuel. 2014;28(10):6221-6227.
- [Google Scholar]
- Mechanism of foam generation in glass-bead packs. SPE Reserv. Eng.. 1985;3(2):573-585.
- [Google Scholar]
- Experimental evaluation of carbon dots stabilized foam for enhanced oil recovery. Energy Fuel. 2019;33(10):9629-9643.
- [Google Scholar]
- Optimization and performance evaluation of a foam plugging profile control well selection system. ACS Omega. 2023;8(11):10342-10354.
- [Google Scholar]
- Swej Y. Shah, Herru As Syukri, Karl-Heinz Wolf, Rashidah M. Pilus, William R. Rossen. Foam Generation in Flow Across a Sharp Permeability Transition: Effect of Velocity and Fractional Flow. SPE Journal, 2020, 25(1), 1-14. SPE195517.
- CO2-responsive agent for restraining gas channeling during CO2 flooding in low permeability reservoirs[J] Fuel. 2021;292(1):120306
- [Google Scholar]
- Visualized study of a nanoparticle-assisted foam system to enhance oil recovery by nuclear magnetic resonance online flooding experiment. Energy Fuel. 2021;35(1):465-472.
- [Google Scholar]
- Foam flow investigation in 3D-printed porous media fingering and gravitational effects. Ind. Eng. Chem. Res.. 2018;57(21):7275-7281.
- [Google Scholar]
- Singh R , Mohanty K K .Foam flow in a layered, heterogeneous porous medium: A visualization study. Fuel, 2017, 197(JUN.1):58-69.
- Songyan L, Zhaomin L, et al. Mathematical models for foam-diverted acidizing and their applications.Petroleum Science, 2008.
- Tuning foam parameters for mobility control using CO2 foam: Field application to maximize oil recovery from a high temperature high salinity layered carbonate reservoir[J] Energy Fuel 2017
- [Google Scholar]
- Sun Q , Li Z , Wang J ,et al.Properties of multi-phase foam and its flow behavior in porous media.RSC Advances, 2015, 5.
- Wang F, Du D, Chen H, et al. Simulation of Evolution Mechanism of Dynamic Interface of Aqueous Foam in Narrow Space Base on Level Set Method. Colloids and Surfaces A: Physicochemical and Engineering Aspects, 2019.
- Stabilization mechanism of fly ash three-phase foam and its sealing capacity on fractured reservoir. Fuel. 2020;264:116832
- [Google Scholar]
- Aqueous foam stabilized by an in situ hydrophobic polymer via interaction with alkyl polyglycoside for enhancing oil recovery. Energy Fuel. 2020;34(2):1639-1652.
- [Google Scholar]
- Design of nanocellulose fibrils containing lignin segment (L-NCF) for producing stable liquid foams as “green” flooding agents for oil recovery. ACS Sustain. Chem. Eng.. 2019;7(13):11426-11437.
- [Google Scholar]
- Flow characteristics of foam in fracture networks. Ind. Eng. Chem. Res.. 2020;59(44):19817-19828.
- [Google Scholar]
- Interfacial characteristics and the stability mechanism of a dispersed particle gel (DPG) three-phase foam. J. Mol. Liq.. 2020;301:112425
- [Google Scholar]
- Yu W , Lashgari H R , Wu K , et al. CO2 injection for enhanced oil recovery in Bakken tight oil reservoirs[J]. Fuel, 2015(159-Nov.1).
- Zeng, TongzhouMiller, Chammi S.Mohanty, Kishore K. Combination of a chemical blend with CO2 huff-n-puff for enhanced oil recovery in oil shales. Journal of Petroleum Science & Engineering, 2020, 194(1).
- Smart mobility control agent for enhanced oil recovery during CO2 flooding in ultra-low permeability reservoirs. Fuel. 2019;241:442-450.
- [Google Scholar]


