

Translate this page into:
Impacts of annealing temperature on microstructure, optical and electromagnetic properties of zinc ferrites nanoparticles synthesized by polymer assisted sol-gel method
⁎Corresponding author. lutforrahman@bcsir.gov.bd (Md. Lutfor Rahman) lutforju33@gmail.com (Md. Lutfor Rahman)
-
Received: ,
Accepted: ,
This article was originally published by Elsevier and was migrated to Scientific Scholar after the change of Publisher.
Peer review under responsibility of King Saud University.
Abstract
Nanocrystalline zinc ferrite (NZF) were successfully synthesized at different calcination temperature via sol-gel method from the precursor salt solutions using tartaric acid and PVA solution as a chelating agent and binder respectively. The characterization of NZF and their properties had been investigated using sophisticated techniques viz. X-ray diffraction, Fourier transform infra-red spectroscopy, Scanning electron microscopy, Transmission electron microscopy, Energy dispersive X-ray spectroscopy, X-ray photoelectron spectroscopy, UV–Vis-NIR spectroscopy, Vibrating sample magnetometer and Impedance analyzer. X-ray peak profile analysis through Debye Scherer and Wilson method, Halder-Wagner method has been used to estimate the structural parameters. The crystallite size and particle size of ZnFe2O4 samples were found to increases with increasing annealing temperature while lattice parameters and lattice strain decreases. Dynamic light scattering and zeta potential measurements were used to evaluate the particle size distribution and stability of these systems. The room temperature magnetic properties measurement showed that the net magnetic moment is observed for NZF due to cation distribution although the bulk ZnFe2O4 is non-magnetic. Direct optical band gaps of the prepared NZF samples has been investigated by UV–Vis NIR spectroscopy using Tauc formula and found that energy band gaps (Eg) values are in a narrow range of 1.19–1.86 eV. The frequency dependent dielectric properties, impedance and modulus spectroscopy measurement has been investigated in the frequency range of 100 Hz to 20 MHz. The synthesized NZF particles will be applied for Gas sensor, humidity sensor and photocatalyst.
Keywords
X-ray peak profile
X-ray photoelectron spectroscopy
Magnetic properties
Electrical properties
Optical band gap

1 Introduction
Ferrites are a group of compound that have drawn much attention because of their amazing magnetic and electrical properties (Anu and Vinod, 2021). These are some of the nanosized materials that are now being studied in order to change their characteristics for a variety of purposes ranging from basic research to industrial uses. (Virlan et al., n.d.; Goodarz et al., 2011). Ferrites have spinel structure and are widely used in gas sensor, stress sensor and humidity sensor (Rani et al., 2015; Yang et al., 2019; Kuru et al., 2018; Muthurani et al., 2010). Ferrites have several advantages, including shape versatility, low eddy current loss, high dielectric constant and high electrical resistivity etc. They have gained much attention of the researcher because of their multiple usages such as magnetic devices, data storage, communication devices, electronics, medical equipment, transformers, pollution reduction, photocatalyst, pigments, biomedical materials, antibacterial materials, and so on (Vedrtnam et al., 2020). Due to their low cost, ease of manufacturing, good dielectric and magnetic properties these are the prepared materials in the field of technological applications (Anu and Vinod, 2021; Kuru et al., 2018). Spinel ferrites have been used as humidity sensors and have catalytic applications because owing to their porous structure, large surface-to-volume ratio and electrical characteristics (Anu and Vinod, 2021; Fan et al., 2009). Ferrites can be characterize by electrical resistivity and induction current which make them conducive to be used in electromagnetic device (Praveena et al., 2015). The magnetic materials for some application demand focusing on their electrical and magnetic properties which must be controlled to make the material more effective (Das et al., 2021; Chavan and Naik, 2018; Virlan et al., n.d.). These properties of ferrites can be easily controlled by substitution, thermal treatment, preparation condition, metal cation lattice sites etc. (Kuru et al., 2018; Chavan and Naik, 2018). These are very attractive materials for research since they are readily available, cheap and have harm-less properties (Gul et al., 2020).
Ferrites are good dielectric materials containing an inhomogeneous medium of Maxwell–Wagner type (Mohammed, 2018). The study of frequency dependent electrical properties will help us to recognize the dielectric polarization technique in ferrites.
The spinel structure of metal oxide having general formula AB2O4 contain tetrahedral A and octahedral B locations. In the unit cell of spinel structure, oxygen atoms form cubic close packing composed of 32 number of oxygen atoms with 8 tetrahedral (A) and 16 octahedral (B) occupied locations. The general formula of spinel ferrites is MFe2O4. Three spinel ferrite structure are possible based on different cation distribution between tetrahedral and octahedral site: Normal spinel where divalent cation (M2+) occupy tetrahedral site and Fe3+ occupy octahedral site, inverse spinel where Fe3+ filled both tetrahedral and octahedral positions and divalent cation (M2+) filled octahedral position. Mixed spinel ferrite where tetrahedral and octahedral position are randomly allocated by divalent and Fe3+ cations. Because of different arrangement of cations between tetrahedral and octahedral sites, spinel ferrites exhibits magnetic properties (Nikolic et al., 2019).
Zinc ferrite has previously been studied among the spinel ferrites by dint of its distinct properties such as chemical and thermal stability, low coercivity, moderate saturation magnetization, idiosyncratic structural, optical, electrical and dielectric properties which make it a good competitor for applications as soft magnets and| further its properties can be modified (Anu and Vinod, 2021; Goodarz et al., 2011; Thandapani et al., 2018; Dippong and Levei, 2021; Mahapatra et al., 2020). It is found that zinc ferrites (ZnFe2O4) possess adequate magnetic moment for usable in medicine, power storage, microwave applications and sensors. Generally, ZnFe2O4 have normal spinel structure having Fd3m space group with equal magnetic moments in both A and B location. Thus, bulk zinc ferrite possesses zero magnetic moment in equilibrium as magnetic moments of Fe3+ ions nullify each other. However, at nanoscale, a dramatic change of magnetic moment arises as the distribution of metastable cation changes leading to the formation of partially inverse spinel structure, spin canting etc. (Ebrahimi and Masoudpanah, 2014).
Literature review have revealed that bulk ZnFe2O4 is paramagnetic while at the nanoscale range it is superparamagnetic with the larger magnetic moment. The properties of ZnFe2O4 samples can be controlled by synthesis conditions and techniques. ZnFe2O4 nanopowder were used to synthesize by variety of methods for examples; sol gel, co-precipitation, sonochemical, hydrothermal, ball milling and solid state reaction methods (Shahraki et al., 2012; Iqbal et al., 2016; Alzoubi, 2022; Sivakumar et al., 2006; Lemine, 2013; Bera, 2001). Some of these methods are very complex and expensive (Pradeep et al., 2011). Sato et al. and Kamiyama et al. reported that coprecipitated zinc ferrite nanoparticles have noncollinear alignment of Fe spins or mixed spinel structure (Diffraction, 1992; Upadhyay and Verma, 2007). We have employed a facile, cost effective and reliable sol-gel method which offer the good control of stoichiometric composition and microstructure of the product.
In this work, synthesis of Zinc ferrite nanoparticle with distinct calcination temperature has been investigated from the mixture of precursor salt solutions employing tartaric acid and PVA solution as a chelating agent and binder respectively. The structural, morphological, optical, electrical and magnetic properties of the prepared samples have been analyzed by using X-ray Diffraction, Fourier Transform Infra- Red Spectroscopy, Scanning Electron Microscopy, Energy Dispersive X-ray Spectroscopy, UV–Vis-NIR Spectroscopy, Impedance Analyzer and Vibrating Sample Magnetometer.
2 Experimental
2.1 Materials
Ferric nitrate nanohydrate [Fe(NO3)2·9H2O] (M.W.= 241.08 g/mol, Merck, Germany), zinc acetate dihydrate [Zn(CH3COO)2·2H2O] (M.W.=219.5 g/mol, Merck, Germany), tartaric acid (M.W.=150.087 g/mol, Merck, Germany), PVA (Merck, Germany) were used as received without further purification.
2.2 Method
Sol-gel method have been utilized to synthesize nanocrystalline ZnFe2O4 samples. 0.5 M aqueous solutions of zinc acetate dihydrate [Zn(CH3COO)2·2H2O] and ferric nitrate nonahydrate [Fe(NO3)3·9H2O] were used to prepare the samples. 1.0 M tartaric acid solution was added as a chelating agent at a mole proportion of 1:1 with reference to anions and 5% PVA solution was added as a binder. The pH of the homogeneous mixture was adjusted to ∼7.00 by making use of 25% ammonia solution. Aqueous solution was prepared using deionized (DI) water. At the beginning, the salt solutions were uniformly mixed together in 1:2 ratios at ambient condition with constant stirring applying a magnetic stirrer (Stuart, UC152D, UK). The tartaric acid and PVA solutions were then slowly added to the salt solution and the pH of the solution was maintained. Then the solution was heated to 80–85 °C to form gel and after a while the gel is burned when it was continued to heat at the hot plate with the same temperature. This resultant burned powder of ZnFe2O4 was ground to get a powder in good homogenizing, small grain size. After that, the powder samples were sintered at different temperature to get the final product and labeled as NZF-1, NZF-2, NZF-3, NZF-4, NZF-5 for the sample calcined at 200 °C, 400 °C, 600 °C, 800 °C and 1000 °C for 2 h respectively. The synthesis flow diagram is presented in Fig. 1.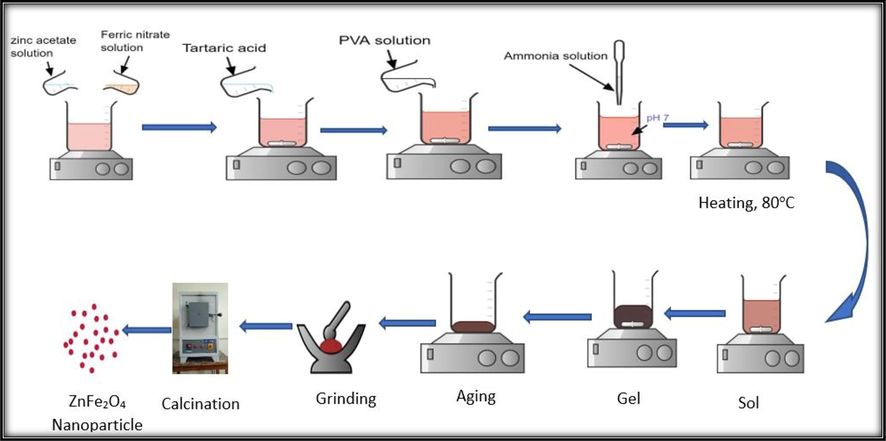
Schematic presentation of ZnFe2O4 nanoparticles preparation by sol–gel technique.
2.3 Characterization techniques
TGA-DSC studies has been carried out using simultaneous thermal analyzer, STA (STA 449 F5, NETZSCH, Germany) to investigate the thermal behavior of the intermediate of ZnFe2O4 samples.
An X-ray diffractometer (SmartLab SE, Rigaku, Japan) with Cu-Kα radiation in 10° ≤ θ ≤ 80° range and 20°/min scanning rate has been used to utilize the structural characteristics of the prepared samples.
Fourier Transform Infrared (FTIR) spectra of the prepared NZF-3 has been recorded in the range of 4000–400 cm−1 using Fourier Transform Infrared Spectrometer (Model- IRAffinity-1S, MIRacle 10, Shimadzu, Japan) in order to confirm the spinel structure by making pellet with the assisted of KBr.
The morphological and compositional analysis of the prepared ZnFe2O4 has been carried out by SEM and EDX with the help of (MA15 VP-SEM, Carl Zeiss Evo, UK). Transmission electron microscopy (TEM) images were captured utilizing JEOL JEM 2100 Plus at the accelerating voltage 200 kV. A requisite amount of sample was dispersed in ethanol with the help of ultrasonic homogenizer (model: LUH-105, Labocon, UK) and then a single drop was added on carbon coated copper grid and dried. Average particle size of the prepared samples was measured using ImageJ software. The surface chemistry of the ZnFe2O4 was explored by X-ray photoelectron spectroscopy, XPS (K-Alpha, Thermo Scientific, UK) using Al K-alpha (1486.69 eV) as X-ray source.
Nanoparticle Analyzer (nano Partica SZ-100-S2, HORIBA scientific Ltd, Japan) has been employed to estimate the zeta potential of the synthesized NZF to investigate the stability of nanoparticles dispersed in aqueous media. We dissolved 10 mg of as obtained ZnFe2O4 samples in 100 ml of DI water and dispersed by ultrasonic homogenizer for 30 min and then the sample was ready for the measurement.
Particle size distribution have also been observed by dynamic light scattering based Nanoparticle Analyzer (nano Partica SZ-100-S2, HORIBA scientific Ltd., Japan). The dispersions were made in the same way as zeta potential.
UV–Vis-NIR spectrometer using Perkin-Elmer (Lamda 1050+, USA) ranging from 200 to 800 nm at room temperature have been employed to demonstrate the optical properties of the prepared samples. The sample was prepared as zeta potential for the measurement.
A vibrating sample magnetor (VSM) (5604, Lakeshore, USA) in the applied magnetic field ranging from -15kOe to +15kOe have been employed at room temperature to investigate the magnetic measurement of the prepared ZnFe2O4 samples.
For the dielectric measurement, 10% polyvinyl alcohol (PVA) solution in ethanol was mixed with the powder sample and compacted to get the cylindrical pellet with a diameter of 13 mm for dielectric analysis. PVA solution was used as a binding agent. The pellet was then calcined at 400 °C to remove the PVA from the samples. After that, the frequency dependent capacitance, impedance, resistance, conductivity and phase angle were measured to determine the dielectric and electric properties of the pellets with a precision impedance analyzer (model: 65120B, Wayne kerr electronics, UK) in the range of 100 Hz to 20 MHz using dielectric material fixture (model: 1 J1020).
3 Results and discussion
3.1 TGA and DSC studies
The thermogravimetric (TG) and differential scanning calorimetry (DSC) are presented in Fig. 2. The phase changes could be observed from the DSC curve. The endothermic peaks are observed from derivative thermogravimetry (DTG) curves at 66 °C, 233 °C, 360 °C, 597 °C and 905 °C. The first weight loss at (60–120 °C) results from the removal of gases and moisture absorbed from the environment. Further the peaks under 400 °C arises due to loss of moisture from dried gel, combustion of nitrates and remaining organic substance. The peaks observed around 600◦C and 900◦C could be due to the rearrangement of various oxides and spinel phase formation respectively. The existence of this endothermic peak reveals that a high discharge of energy, which is typically utilised in the ignition process and the formation of spinel phases. The loss of weight in TG curves has good support from DTG curves data. The curve of weight loss around 900 °C represents that the sample is thermally stable above this temperature (Mohammed, 2018; Lakshmi Ranganatha et al., 2020).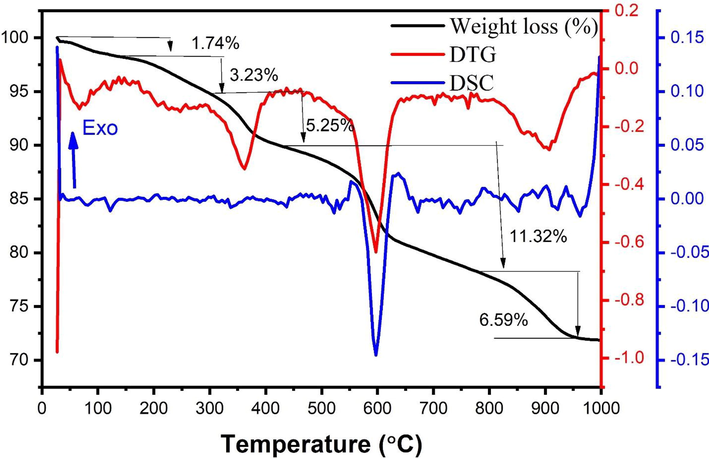
TG and DSC analysis of intermediate of ZnFe2O4.
3.2 X-ray diffraction (XRD) analysis
The X-ray Diffraction pattern of the prepared NZF samples are represented in Fig. 3. XRD analysis of the samples exhibits characteristics peaks that were indexed by standard values. The spinel structure of ZnFe2O4 was used to identify all diffraction peaks (ICDD Card No. 01–080-3537). There are characteristic peaks in the XRD spectra of the samples NZF-1, NZF-2, NZF-3, NZF-4, NZF-5 at(2θ=18.19°, 29.91°, 35.23°, 42.81°, 56.61°, 62.15°, 70.49°, 73.50°, 74.50°, 78.42°) corresponding to (1 1 1), (2 2 0), (3 1 1), (4 0 0), (3 3 3), (4 4 0),(6 2 0), (5 3 3), (6 2 2) and(4 4 4) planes which are well matched with zinc ferrite by comparing with standard values (Vinosha et al., 2017).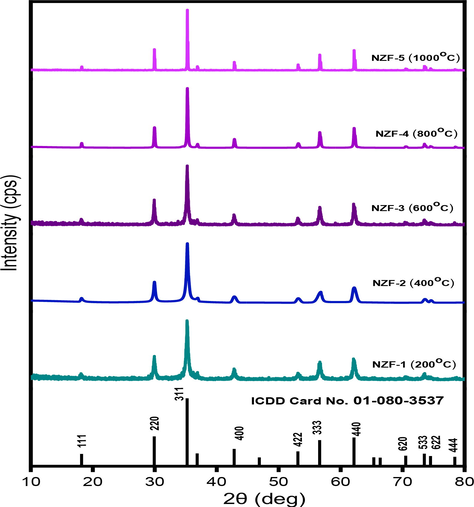
X-ray diffractograms of ZnFe2O4 nanoparticles prepared at different calcination temperature.
The XRD pattern of the prepared samples is highly consistent with the ICDD Card No. 01–080-3537. The width of the prominent peaks grows sharper as the calcination temperature rises, suggesting an increase in crystallinity and crystallite size, as shown in Fig. 3.
3.2.1 Determination of crystallite size and lattice strain
3.2.1.1 Debye-Scherrer method and Wilson method
Literature review reveals several methods for determining crystallite size by peak widening analysis. Scherrer technique is the easiest way that has been utilized the value of full width at half maximum (FWHM) for the highest intense peak to estimate the average crystallite size using Eq.(1) (Basak et al., 2021; Kumar et al., 2020).
Where, D is the crystallite size, k = 0.9 symbolize the shape factor, λ = 0.154060 nm stand for wavelength of Cu-Kα radiation, βD is the integral breadth of the most intense peak (FWHM) and θ stand for Bragg’s angle. By reorganizing the Eq. (1) integral breadth can be obtained.
Stokes and Wilson relation can be used to express the lattice strain in powder samples caused by crystal imperfection, deformation and lattice misalliance as shown in Eq.(3) (Basak et al., 2021).
Here, ε represent the lattice strain, βstrain represent the integral breadth.
Crystallite size (DD-S) and lattice strain (ε) obtained from Eq. (1) and Eq. (3) are tabulated in Table 1.
Sample ID
D-S and Wilson Method
H-W plot
DD-S (nm)
Strain εW × 10−3
DH-W (nm)
Strain εH-W× 10−4
NZF-1
25.70
4.645
18.03
25
NZF-2
30.50
3.91
22.40
24
NZF-3
32.90
3.6
30.01
18
NZF-4
67.70
1.8
50.60
4.7
NZF-5
178.90
0.67
182.44
2.20
3.2.1.2 Halder-Wagner method
The crystallite size and lattice strain have been ascertain through Halder-Wagner method by utilizing the value of βhkl and planar spacing dhkl (Basak et al., 2021; Kumar et al., 2020). In H-W approach, a different technique has been used as shown in Eq. (4) (Basak et al., 2021; Kumar et al., 2020).
Here, DH-W is the Halder–Wagner crystallite size and εH-W is the lattice strain. β * represent the integral width and d* signify the interplanar distance.
β* and d* can be expressed by Eq. (5) and Eq. (6).
Equation 4 can be modified by using the value of β* and d*,
Eq. (7) can be written as,
Eq. (8) is same as the expression of straight line, y = mx + c, where Kλ/DH-W represent the slope and 16ƐH-W2 represent the intercept. (β/tanθ)2 vs βcosθ/sin2θ has been plotted according to Halder-Wagner method to calculate DH-W and ƐH-W as shown in Fig. 4. DH-W can be measured from the slope (Kλ/DH-W) and the value of ƐH-W can be computed from the intercept (16ƐH-W2) obtained from the straight line using the data and listed in Table 1.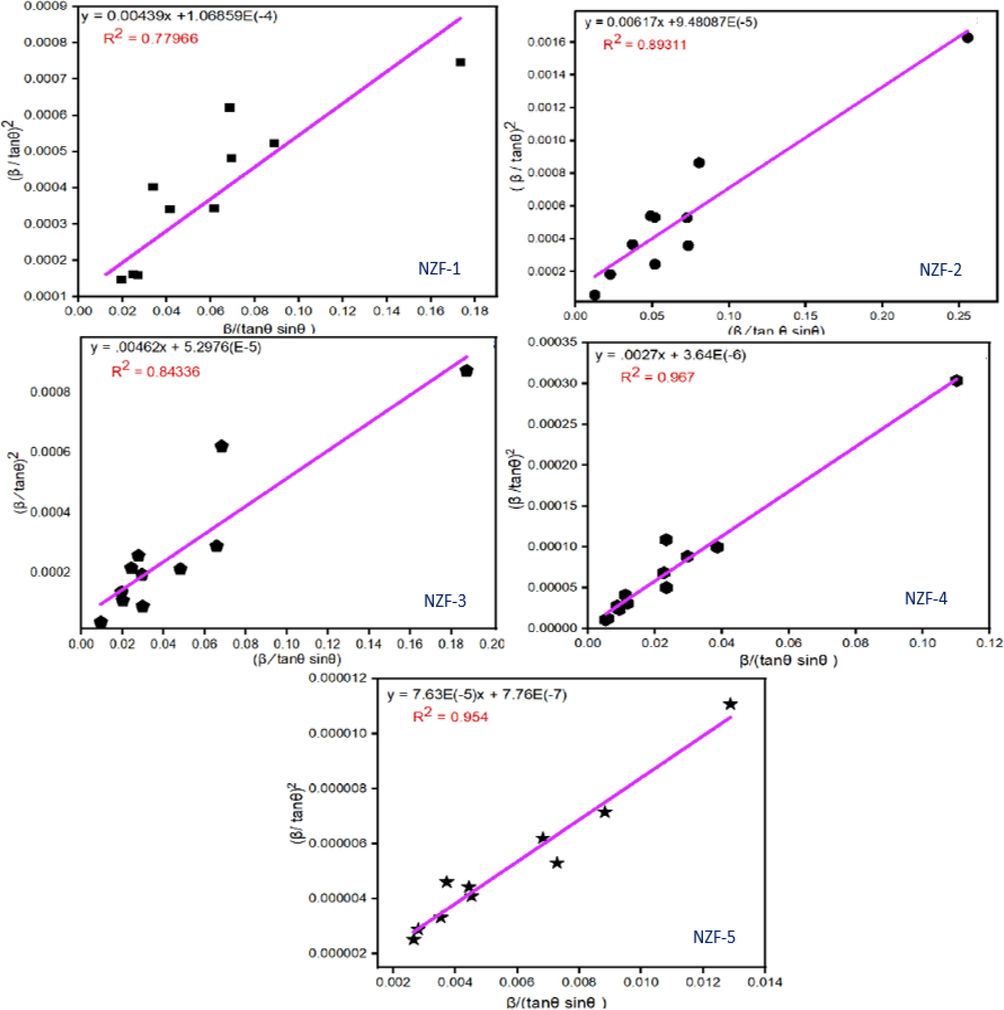
Halder-Wagner plot of the zinc ferrite nanoparticles.
The straight lines obtained by plotting Halder-Wagner formula are appropriate because the correlation coefficient value R2 is near about 1. The R2 values are 0.77966, 0.89311, 0.84336, 0.967 and 0.954 for the nano zinc ferrites calcined at 200 °C, 400 °C, 600 °C, 800 °C, 1000 °C respectively.
From the table, it is revealed that, the crystallite size of ZnFe2O4 particles were noticed to be increases with rising calcination temperature whereas lattice strain decreases.
Williamson and Smallman’s relation has been used to estimate the dislocation density (δ) of the prepared samples. The dislocation density (δ) has been measured by using Eq. (9) (Basak et al., 2021; Das et al., 2020)
For minimal dislocation densities, n is regarded as unity.
The lattice constant (a) of the prepared ZnFe2O4 nanoparticles have been evaluated using Eq. (10) and (11) (Basak et al., 2021; Das et al., 2020).
Here, d is the interplanar spacing, n is the order of diffraction which is normally 1, λ = 0.154060 nm is the Bragg’s wavelength.
Here, the integers h, k and l represent the Miller indices of diffraction planes. The cell volume ‘V’ can be derived from the value of lattice constant ‘a’ as shown in Eq. (12) (Basak et al., 2021; Majid et al., 2019).
The X-ray density ρx of the synthesized nanoparticles have been determined using Eq. (13) (Basak et al., 2021).
Various microstructural parameters of the prepared sample synthesized at different calcination temperature are recorded in Table 2.
Sample ID
Dislocation Density, δ×1016(lines/m2)
Lattice constant, a (Å)
Cell volume, V (Å3)
X-ray Density, ρx(kg/m3)
D-S method
H-W method
NZF-1
15
31
8.46
605.50
4937.23
NZF-2
10
20
8.45
603.35
4954.782
NZF-3
9.2
11
8.45
603.35
4954.782
NZF-4
2.1
8
8.45
603.35
4954.782
NZF-5
.312
4.1
8.39
590.59
5061.845
According to Table 2, it can be concluded that the dislocation density obtained from the two approaches decreases with increasing temperature and is approximately comparable with one another for the sample NZF-3. The calculated lattice constants of all of the samples are quite near to the theoretical lattice constant of zinc ferrite that is 8.41 Å (Ahn et al., 2014).
3.3 FT-IR analysis
Formation of metal–oxygen bond of cubic spinel structure at octahedral and tetrahedral sites of the prepared samples has been revealed by Fourier Transform Infrared Spectrometer. The spectra of the sample calcined at 600 °C is presented in Fig. 5. In FT-IR spectra of the prepared zinc ferrite samples - two prominent absorption bands at high frequency and low frequency region have been found. The high frequency band was found near 550 cm−1 is due to the metal–oxygen stretching vibration in tetrahedral (A) position and the band at lower frequency region was observed near 449 cm−1 is due to metal–oxygen stretching vibration in octahedral (B) location of the prepared sample. The difference between the observed band at difference frequency is attributed to the variation in the Fe3+–O2– distance for tetrahedral and octahedral site and may also due to bonding force and the mass of cation (Ramachandran, 2016). The presence of spinel structure of the prepared ZnFe2O4 samples is confirmed by these vibrational modes.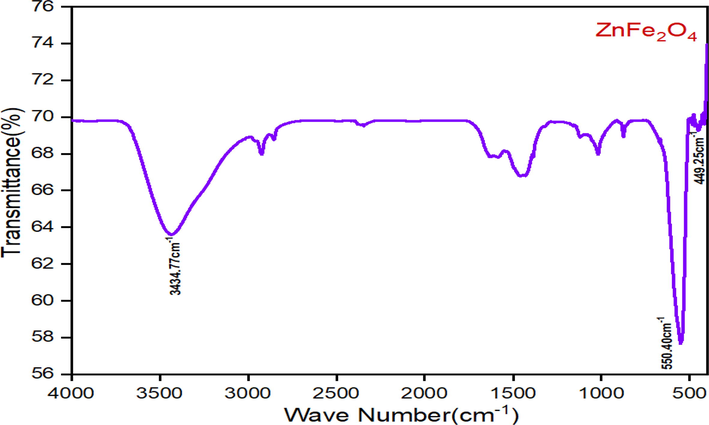
FT-IR spectra of ZnFe2O4 sample calcined at 600 °C.
The absorption bands noted around 3400 cm−1 and 1600 cm−1 are assigned to the stretching and bending vibration of water molecules adsorbed on the surface of the nanoparticles (Madhukara et al., 2020). The peaks close to 2925 cm−1and 2852 cm−1 are assigned to the symmetric and asymmetric vibration of C–H bonds presence in diols as PVA was used during the synthesis (Jafarpour et al., 2022). The absorption band at around 1400 cm−1 indicates the presence of stretching vibration of anti-symmetric NO3– ions (Madhukara et al., 2020).
3.4 Morphological studies
3.4.1 SEM analysis
The particle size and surface morphology of the developed ZnFe2O4 nanoparticles has been explored by SEM analysis. The average particle size determined by ImageJ software are shown in Table 3. Fig. 6 shows the particle size distribution histograms and SEM images for the sample NZF-1, NZF-2, NZF-3, NZF-4 and NZF-5. Particle size are increases with increasing calcination temperature. Agglomerated nanoparticles are observed in the SEM images as the prepared ZnFe2O4 samples have larger surface-to-volume ratio. At higher temperature bigger particles are observed due to the addition of some crystallinity because of lesser of Gibbs free energy. As a result surface area of the particles become decreasing (Jafarpour et al., 2022). The particle size obtained from SEM results ranges from 50 nm to 280 nm and are bigger than the crystallite sizes determined by XRD data which suggest the higher degree of agglomeration of the particles (Jafarpour et al., 2022). The highest value of average particle size of 272 nm observed for the sample NZF-5, whereas the sample NZF-1 has the smallest average particle size of 50 nm.
Sample ID
Average Particle Size (nm)
NZF-1
50
NZF-2
61
NZF-3
69
NZF-4
88
NZF-5
272
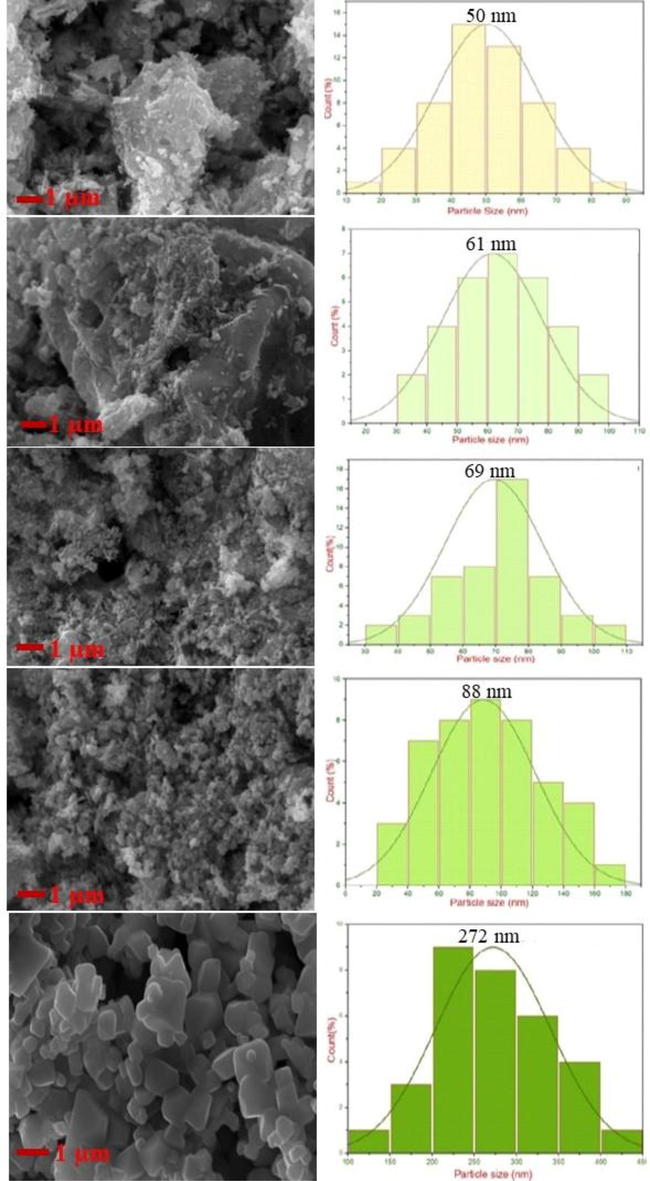
SEM micrographs of ZnFe2O4 samples.
3.4.2 TEM analysis
The TEM images of synthesized NZF-1 calcined at 200 °C with different magnifications are depicted in Fig. 7. The TEM images shown that the particles are agglomerated in nature which are very common tendency for nanoparticles. The average particle size of the sample is 16 nm that is good agreement with the crystallite size determined using H-W method. The high-resolution TEM (HR-TEM) image gives the crystalline lattice fringes illustrated that the spacing between the crystal lattice planes 0.468, 0.298, and 0.400 nm which can be assigned for (1 1 1), (2 2 0), and (2 0 0) planes respectively of the cubic spinel structured ZnFe2O4 crystals (Guo et al., 2017). The selected area electron diffraction (SAED) pattern of the sample indicate the existence of cubic spinel ZnFe2O4 nanoparticles having polycrystallinity. The d-spacing from HR-TEM image and SAED pattern are well consistent with data obtained from XRD analysis as illustrated in Fig. 3.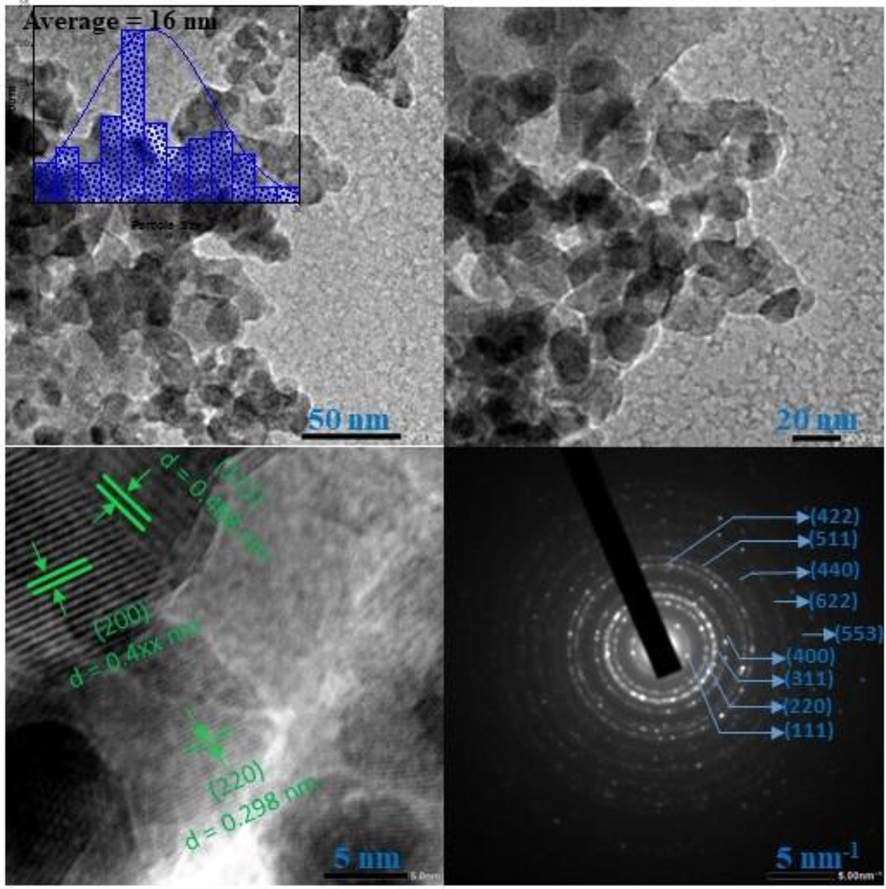
TEM images at different magnification and selected area electron diffraction pattern of NZF-1.
3.5 Compositional analysis
Energy Dispersive Spectroscopy (EDS) have been utilized for the compositional analysis of the ZnFe2O4 nanoparticles to demonstrate the existance of associated elements with their percent ratio of atomic weight as in Fig. 8.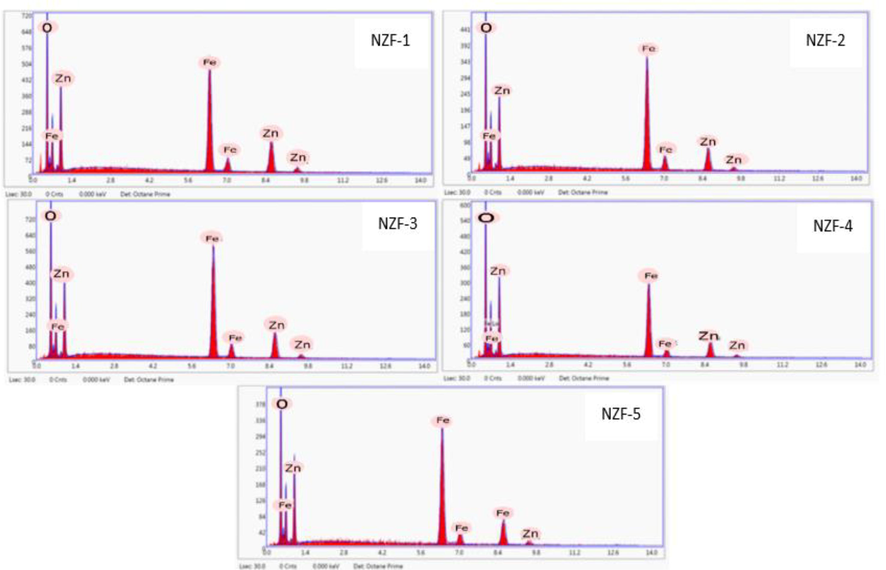
EDS of ZnFe2O4 Nanoparticles.
The EDX spectrum illustrate the purity and presence of Zn, Fe and O atoms in the prepared samples with good elemental percentage recorded in Table 4. In the EDS spectra, no peak was observed except the expected Zn, Fe and O which identify that the prepared ZnFe2O4 sample is highly pure. The atomic weight ratio of Zinc and Iron was very close to theoretical as well as experimental Zn/Fe ratio of spinel ZnFe2O4. The EDS pattern of ZnFe2O4 nanoparticles calcined at 200 °C (NZF-1) indicates that zinc - iron ratio is 0.62 which is significantly higher than the theoretical ratio. The Zn/Fe ratio of NZF-3 and NZF-5 were considerably near to 0.5 in comparison to all other ZnFe2O4 nanoparticles.
Sample ID
Atomic %
Ratio
Zn
Fe
Zn/Fe
NZF-1
19.43
31.18
0.623
NZF-2
14.06
34.60
0.41
NZF-3
15.80
33.74
0.47
NZF-4
12.20
28.24
0.43
NZF-5
15.13
34.63
0.53
3.6 X-ray photoelectron spectroscopy
The surface chemistry of the synthesized NZF-1 sample was analyzed using X-ray photoelectron spectroscopy (XPS) keeping the binding energy range 0.00–1350 eV as presented in Fig. 9. The surface survey scan of the sample indicates the presence of Zn, Fe and O for zinc ferrite with carbon as depicted in Fig. 9a. The atomic weight ratio between the Zn 2p and Fe 2p spectra is 16.70: 17.09 at the sample surface which indicates the iron deficiency from the stoichiometry of ZnFe2O4. The binding energy (BE) was calibrated by considering C 1 s peak at 284.8 eV due to adventitious carbon present in ZnFe2O4 and this is happened when the material was exposed to air after the synthesis (Parmar et al., 2022; Xing et al., 2012). In the Zn region (Fig. 9b), the peak at BE 1021.3 eV and 1044.37 eV are corresponding to Zn 2p3/2 and Zn 2p1/2 which confirms the existence of Zn2+ oxidation state (Guo et al., 2017; Shouliang Wu et al., 2015). In Fig. 9c for Fe 2p spectra, it shows two peaks at the BE 710.46 eV and 723.9 eV are attributed to the presence of Fe 2p3/2 and Fe 2p1/2. A satellite peak can also be noticed at 733 eV. The Fe 2p peaks with satellite peak stipulate the formation of Fe3+ chemical state of iron in synthesized ferrite (Liu et al., 2011; Nikolic et al., 2019). After the deconvolution of the unevenness peak for O 1 s spectrum two peaks can be obtained as in Fig. 9d. The peak at the BE 529.6 eV is the identical for lattice oxygen which means the oxygen present in the M-O framework associated with both Zn and Fe. Another peak obtained for oxygen at 531.2 eV can be explained to the adsorbed oxygen from physisorbed water on the upper surface of the sample (Nikolic et al., 2019). The broad peak with FWHM 2.65 eV indicates the presence of chemisorbed moisture on the nanoparticle surface (Das et al., 2021). Therefore, the O1s spectra suggest that the synthesized zinc ferrite nanoparticles can be suitable for humidity sensor as it can interact with water molecules by chemisorption and physorption process.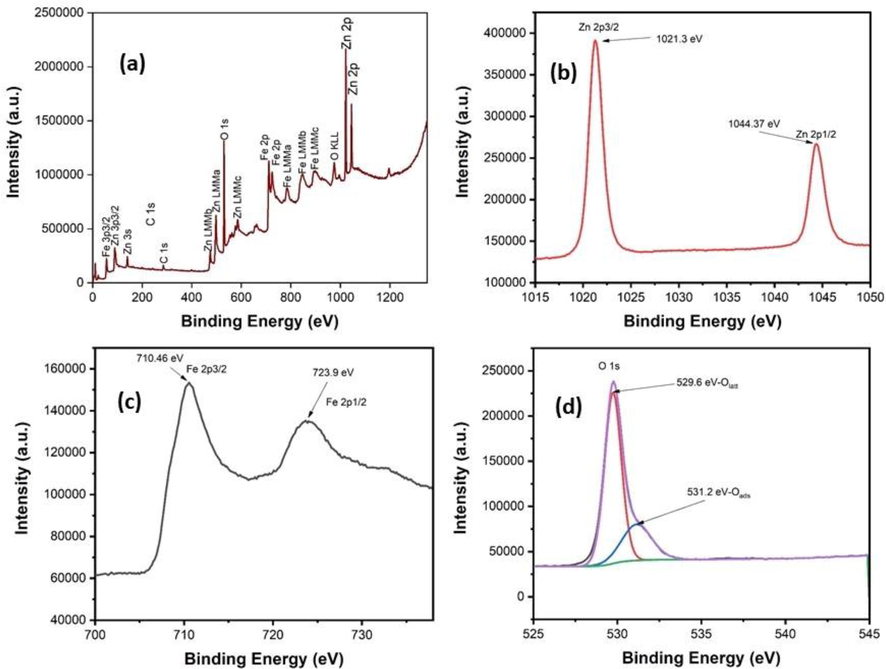
XPS spectra of NZF-1 sample: (a) survey spectrum, deconvoluted Zn 2p (b), Fe 2P (c) and O1s (d) spectra.
3.7 Zeta potential
The stability of nanoparticles dispersed in DI water were checked out by assessing the zeta potential and results are presented in Fig. 10. Zeta potential of the zinc ferrite samples were recorded by Nanoparticle Analyzer as in Table 5. Zeta potential represent the potential difference between the sliding plane and the bulk potential in the electronic double layer (Guo et al., 2017). Zeta potential measurements typically provide a good indication of colloidal stability (Bloemen et al., 2012). Zeta potential value represents the degree of electrostatic repulsion between the nanoparticles as it is connected to surface charge on nanoparticles (Milanovi et al., 2017). The particles are assumed to be electrostatically stable if the absolute value of zeta potential exceeds 30 mV (Jafarpour et al., 2022; Bloemen et al., 2012; Milanovi et al., 2017). The samples were dispersed in a DI water (pH ̴7) to assess the zeta potential value. The sample NZF-5 exhibits the greatest zeta potential value of 49.8 mV and the sample NZF-4 has the 2nd highest zeta potential value which is −31.5 mV. But the sample NZF-1, NZF-2 and NZF-3 shows zeta potential value of -2.3 mV, -10.9 mV and -18.1 mV which are lower than the absolute value of 30 mV. So, NZF-4 and NZF-5 are stable in dispersion but NZF-1, NZF-2 and NZF-3 are unstable in dispersion. In the current research, it is shown that the trend of zeta potential increases with increasing particle size. This can be explained by the Monte Carlo simulation and theories based on integral equations which estimate that, at a definite surface charge and electrolyte concentration, the zeta potential of nanoparticles decreases with particle size decreases (Holmberg et al., 2013). There may be some reasons behind this contradictory experimental behavior of nanoparticles size dependent zeta potential. Nanoparticles have the tendency to become aggregated staunchly and when the particles are aggregated, they showed very different behavior with respect to mono-dispersed particles. As a result, surface charge as well as zeta potential are more likely big micro sized particles (Abbas et al., 2008).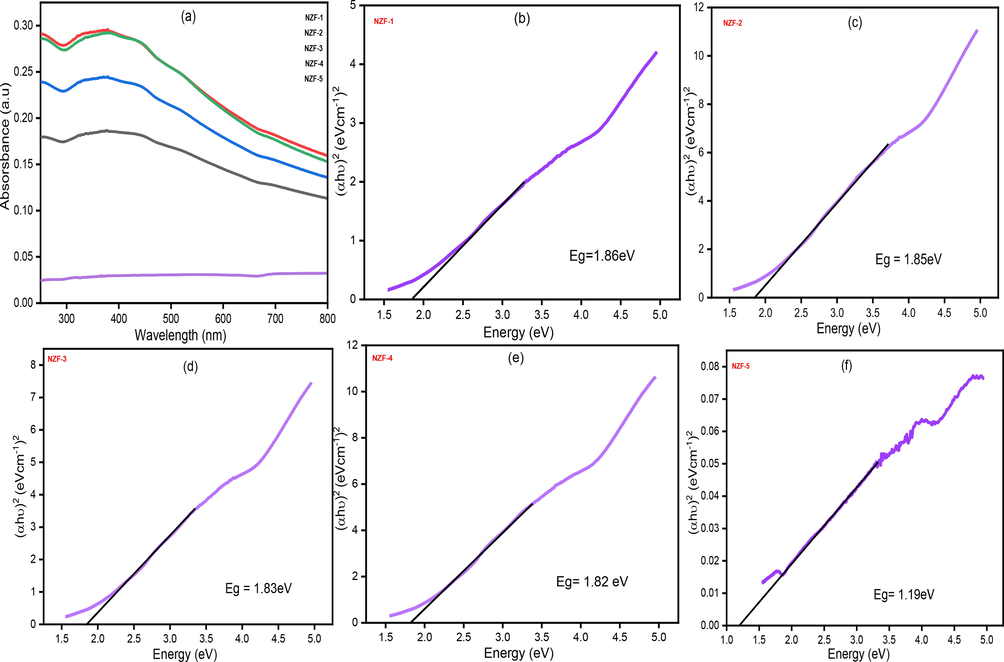
(a) UV–Vis absorbance spectra, (b-f) Tauc plots of (αhν)2 against hν (eV) for zinc ferrite.
Sample ID
Zeta potential(mV)
NZF-1
-2.30
NZF-2
-10.90
NZF-3
-18.10
NZF-4
-31.50
NZF-5
-49.80
3.8 Determination of particle size by dynamic light scattering (DLS)
The results of particle size distribution observed by DLS based Nanoparticle Analyzer are tabulated in Table 6. The average particle size of the synthesized ZnFe2O4 was increased with calcination temperature which were in the range from 790 nm to 4.53 µm. The hydrodynamic diameter measured by Nanoparticle Analyzer is always higher than the dehydrated diameter obtained from SEM results (Basak et al., 2021). Concerning DLS, the theory illustrates that as the dispersed particle flows through a liquid medium, a thin electrical double layer of the medium attaches to the surface. Thus, hydrodynamic diameter provides information about the inorganic core, as well as any coating and solvent layer adhered to the particle as it moves under the influence of Brownian motion. SEM gives information only about the inorganic core. As a result, the average diameter measured by Nanoparticle Size Analyzer is higher than obtained from the electron microscopic results and the average particle size rises as the SEM result (De Calle, 2019; Bootz et al., 2004).
Sample ID
Average Particle Size (nm)
NZF-1
791
NZF-2
814
NZF-3
865
NZF-4
964
NZF-5
4535
3.9 Optical properties
The absorbance as a function of wavelength for the prepared ZnFe2O4 nanoparticles is represented in Fig. 10(a). Except for NZF-5, all of the nanoparticles exhibit significant absorption in the range of (370–400) nm implying their application in optical devices (Ramachandran, 2016). The Tauc model which is the most widespread model to evaluate the optical behavior of nanocrystalline zinc-ferrite allows us to determine the band gap energy Eg from the plot of (αhʋ)2 vs incident energy (hʋ). Tauc relation to calculate the band gap energy can be expressed as Eq. (14) (Ahmed et al., 2015).
Where α represent the absorption coefficient, the proportionality constant is denoted by A which also known as edge width parameter, Eg indicates the band gap energy, hν represent the incident photon’s energy, and n = (1/2, 1, 2) is an index that characterizes the optical absorption process.
The Eg of the prepared ZnFe2O4 sample have been explored by plotting (αhʋ)2 vs (hʋ) and extrapolating the plot on the X-axis (Tauc plots) as indicated in Fig. 10 (b-f). The calculated band gap energy from the plot are1.86, 1.85, 1.83, 1.82 and 1.19 eV for the samples NZF-1, NZF-2, NZF-3, NZF-4 and NZF-5 which are calcined at 200 °C, 400 °C, 600 °C, 800 °C and 1000 °C respectively. The Eg declined with the enlargement of particle size as the calcination temperature increased which are in similar results with earlier reported values (Fan et al., 2009; Manikandan et al., 2013). The best linear fit of (αhʋ)2 vs (hʋ) was obtained for n = 1/2 Fig. 10(b-f), which suggest the permitted direct transitions covering the energy band gap of ZnFe2O4 (Saha et al., 2022). The band gap values are near to the desired value which is required for optical application.
3.10 Magnetic properties
The magnetic measurement of the as prepared NZF particles have been evaluated employing a VSM system in the applied magnetic field ranging from -15kOe to +15kOe at the ambient temperature. The hysteresis loops for ZnFe2O4 samples are represented in Fig. 11. The value of saturation magnetization (Ms), coercivity (Hr), retentivity (Mr) of the samples obtained from hysteresis loop are tabulated in Table 7. Further, the magnetic moment (ηB), anisotropy constant (K), and remanence ratio (R) have been calculated from these values which are also shown in Table 7.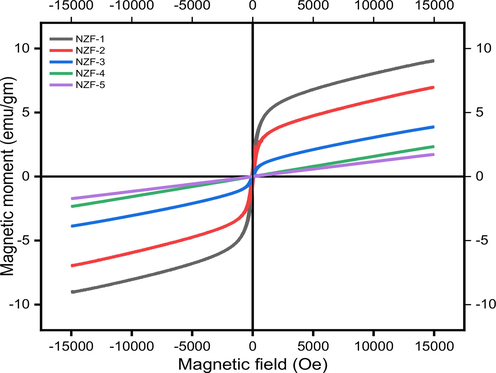
M-H loop of Prepared ZnFe2O4 nanoparticles |.
Sample ID
Hc (Oe)
Mr (emu/g)
Ms (emu/g)
K (erg/cm-3)
Mr/Ms
ηB
NZF-1
47.75
0.67
9.02
448.65
0.074
0.389
NZF-2
75.50
0.65
6.95
546.589
0.09
0.299
NZF-3
68.92
0.18
3.85
276.398
0.05
0.166
NZF-4
9.76
2.62 x 10⁻⁵
0.04
0.4067
0.00066
0.0017
NZF-5
6.26
1.46 x 10⁻⁵
0.03
0.196
0.00049
0.00129
The magnetic measurement reveals that the value of coercivity initially increases and then falls with rising sintering temperature above 400 °C, whilst the value of magnetization and retentivity decreases incessantly. Magnetic anisotropy, which hinders the magnetic moment from orientation in an applied field is lowered leading to decrease in saturation magnetization and coercivity. The value of magnetic anisotropy was measured by the Eq. (15) (Basak et al., 2021; Almessiere et al., 2019; Singh Yadav et al., 2020).
ZnFe2O4 have normal spinel structure with non-magnetic Zn2+ ions in tetrahedral sites and octahedral sites are occupied by antiparallel Fe3+ ions which are distributed in equal moment. Therefore, bulk ZnFe2O4 possess zero magnetic moment. However, the distribution may be altered by lowering the grain size of ZnFe2O4 to nano range. The alteration in the cation distribution caused a significant exchange in the magnetic moment at the nanoscale (Hossain et al., 2017). A net magnetic moment is observed for the synthesized nanocrystalline ZnFe2O4 samples due to decoupling of Fe atoms as some of the Fe atoms shifted to the tetrahedral A site of the spinel ferrite (Manikandan et al., 2013). Calcination leads to the change of cation distribution resulting in mixed spinel structure. The larger values of lattice parameter than that of the normal spinel structure of ZnFe2O4 as shown in Table 2 indicates that the prepared zinc ferrite nanoparticles have a mixed spinel structure because some of the Fe3+ ions were exchanged for larger sized Zn2+ ions in octahedral sites, causing the spinel lattice to expand (Alzoubi, 2022; Ahmed et al., 2015). There is a abatement of saturation magnetization(Ms) and magnetic moment(ηB) with increasing calcination temperature (Table 7) because the shift in cation distribution further returns to the normal spinel forms (Masoudi, 2014). The magnetic moment(ηB) can be estimated from Eq. (16) (Singh Yadav et al., 2020).
Here, MW is the molecular weight of ZnFe2O4 which equals to 241.74 gm.
Ferrimagnetic nature was perceived in ZnFe2O4 nanoparticles due to the rearrangement of iron and zinc cations in octahedral and tetrahedral locations (Shahraki et al., 2012). The s-shaped hysteresis loop and low coercivity for the samples NZF-1, NZF-2, NZF-3 suggest that sol–gel method leads to the formation of ferrimagnetic ZnFe2O4 nanoparticles. The magnetic ions on the surface layer lack the full exchange of interaction, resulting in disordered spins which causes ferrimagnetic coupling between the two sites and greater magnetization detected as compared to the bulk particle (Ebrahimi and Masoudpanah, 2014). Lack of coercivity with linear magnetization without fully saturation of the sample NZF-4 and NZF-5 relative to the superparamagnetic behavior (Fig. 11) (Ebrahimi and Masoudpanah, 2014; Shahraki et al., 2012; Manikandan et al., 2013). The hysteresis loop reveals that the samples are not fully saturated at 15kOe which confirms the single domain particles (Shahraki et al., 2012).
The magnetization decreases with rising particle size due to decrease of inversion co-efficient attributed to the decrease of superexchange interaction of Fe3+ cations between octahedral and tetrahedral site (Ebrahimi and Masoudpanah, 2014; Shahraki et al., 2012). Higher surface to volume ratio of the very tiny particles result in stresses and distortions near to the surface. As a result, the energy distinction in the two cases, namely the Fe3+ ion taking place one of the A or B sites, is predicted to be decreased for nanoparticles in contrasted with the bulk materials which support inversion (Atif et al., 2006).
Chinnasamy et al. have also observed that crystallite size affects the cation distribution and magnetic characteristics of ZnFe2O4 nanoparticles prepared by ball-milling process, indicating that magnetization reduces with increasing crystallite size. This is due to an increment in the cation inversion parameter and thus, the intensity of super exchange reaction among Fe3+ ions in A and B-sites (Chinnasamy et al., 2000). The enhancement of Magnetization with curtailment of particle size may also be the results of the spin canting (Ebrahimi and Masoudpanah, 2014).
3.11 Dielectric and electrical properties
The AC conductivity and dielectric properties measurements of the prepared samples were investigated at frequencies ranging from 100 Hz to 20 MHz. The electrical parameter has been calculated using the following Eq. 17, 18 & 19
Here, ε′ and ε′′ represent the real and imaginary part of dielectric constant, εo is the vacuum dielectric constant (8.85 x 10⁻¹²F/m), Cp and Rp are the parallel capacitance and resistance of the spinel ferrite tablet with surface area A and thickness of the tablet is d, tan(δ) is the dielectric loss tangent and f is the frequency.
The dielectric constant may be used to represent the dielectric behavior of ferrite materials expressed as a complex number with real and imaginary component i.e. Eq (19) (Lazarević et al., 2013).
The real and imaginary component of the dielectric constant have been evaluated using eq. (17) and (19). Fig. 12(a-b) exhibits the frequency dependent real and imaginary parts of dielectric constant of the ZnFe2O4 samples. The dielectric constant drops with increasing frequency and remain almost constant at higher frequencies, according to these figures. At low frequencies, the grain boundary is more active compare to the grains, which causes dielectric dispersion. The inability of charge carriers to follow the applied electric field reduces space charge polarization at high frequencies, causing the dielectric constant to drop as frequency increases (Singh Yadav et al., 2020). This behavior can be explained by the Maxwell–Wagner two layers model, which is in agreement with Koops model. In this model, it is considered that, ferrite materials contain conducting ferrite grains that are partitioned by a thin covering of grain boundaries with poor conductivity. When an electric field is applied to this arrangement, charge carriers aggregate at the boundaries, resulting in space charge polarization. (Jafarpour et al., 2022; Singh Yadav et al., 2020; Naeem et al., 2009; Yousaf et al., 2020; Jahan et al., 2022; Murugesan and Chandrasekaran, 2015). Due to the hopping mechanism in the octahedral regions between iron ions i.e. Fe2+ + Fe3+ ↔ Fe3+ + Fe2+, charges are moved to the grain boundaries. As a result, polarization and dielectric constant are relatively high in the low-frequency region and further decreases with increasing frequency and attains almost constant value due to charge transmission among Fe2+ and Fe3+ cations does not coincide with the frequency of the electromagnetic wave (Naeem et al., 2009; Jahan et al., 2022; Pradeep et al., 2011). Four major types of polarization i.e. ionic, dipolar, interfacial and electronic polarizations are responsible for dielectric constant. In the lower frequency range, only interfacial and dipolar polarizations play their role which is highly depends on temperature. The lattice defects and dipolar polarization are arising in the crystal as because of variation of calcination temperature of the interfacial polarization. The dielectric constant is very high for higher calcination temperature in the low frequency arena due to the prominent effect of the interfacial polarization (Pendyala et al., 2019). At high frequencies, ionic and electronic polarizations have a considerable impact on the dielectric constant of a material. Such type of polarization arises due to hopping between the less resistive grain and more resistive grain boarders. When the frequency value exceeds certain limits, the electronic crowd reverses its direction, reducing the number of electrons at grain boundaries and, as a result, the polarization decreased and ultimately reaches a constant value (Singh Yadav et al., 2020; Hakeem et al., 2021; Mathe and Kamble, 2013).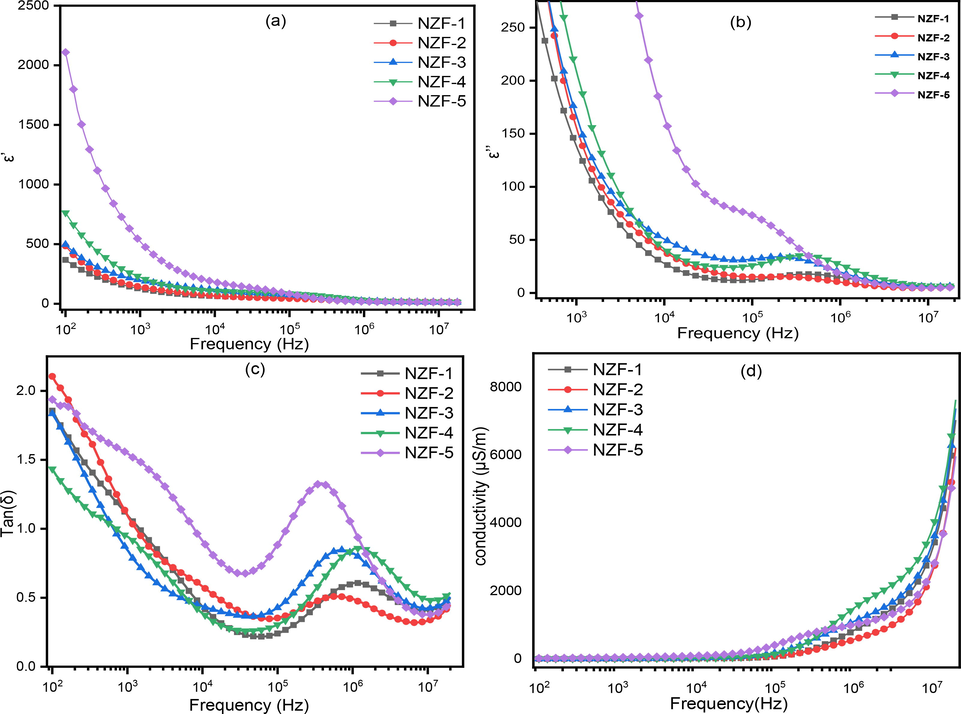
Frequency dependent (a) real part of dielectric constant (ε′) (b) imaginary part of dielectric constant (ε″) (c) dielectric loss tangent, tan(δ), and (d) ac conductivity of ZnFe2O4.
The space charge polarization is highly affected with temperature which results in the rapid increase of dielectric constant with increase of temperature at low frequencies (Pendyala et al., 2019). In the current research, it was noticed that, the dielectric constant enhances with increasing calcination temperature. This is because of decrease in resistivity of ZnFe2O4 with calcination temperature, since the ε′ is proportional to the square root of conductivity (Khandekar et al., 2011). For NZF-5, the very high grain size may be the reason for very high dielectric constant compare to others.
Relationship between dielectric constant and dielectric loss tangent can be expressed as Eq. (21) (Jafarpour et al., 2022; Lazarević et al., 2013; Hakeem et al., 2021).
The dielectric loss tangent, tan(δ) is generally employed to describe energy loss which can be defined as the ratio of imaginary and real parts of the dielectric constant Eq. (17). The frequency dependent dielectric loss tangent (tan(δ)) is represented in Fig.12(c). Figure show that the dielectric loss tangent, tan(δ) falls with the escalation of frequency similar to the changes in dielectric constant because of the close relation between the conduction mechanism and dielectric performance of ferrite materials (Naeem et al., 2009). It is caused by the polarization which lags behind the applied electric field and it dependent on the grain boundaries, impurities and flaws. The bouncing of electrons cannot cooperate with fluctuations of electric field of the electromagnetic wave at high frequencies (Jafarpour et al., 2022; Singh Yadav et al., 2020). Phenomenological Koop’s theory can explain this phenomena i.e. at low frequencies, where the grain boundary is more active and resistivity is high, more energy is needed for electron transfer between Fe2+ and Fe3+ ions, thus the loss is more, whereas at high frequencies, where the grain have significant role and resistivity is low, a small energy is needed for electron exchange between Fe2+ and Fe3+ ions at the octahedral site. When hopping frequency is equal to the frequency of an applied electric field the dielectric loss tangent shows its maximum value (Lazarević et al., 2013). Furthermore, it is also seen that, the tan(δ) showed abnormal behavior for all the synthesized samples. The tan(δ) declined with escalating frequency, then inclined with frequency and again declined as the frequency rising as shown in Fig.12(c). Rezlescu’s model described that, the twain p and n type charge bearer can be contributed separately behind the relaxation behavior of ferrites. This property is also due to the electrical interactions among Fe2+ and Fe3+ (Rahman et al., 2023; Gul et al. and Maqsood, 2008). Fig.12(d) illustrates the frequency dependent AC conductivity of ZnFe2O4 samples. In general, conduction in ferrites is caused by the hopping of charge carriers between the sites (Jafarpour et al., 2022; Singh Yadav et al., 2020; Lazarević et al., 2013; Gul and Maqsood, 2008; Narsimulu et al., 2015; Hajlaoui et al., 2019). As frequency increases, conductivity rises gradually at low frequencies and quickly at high frequencies. The conduction mechanism at low frequencies is attributed to weak electron hopping, whereas the AC conductivity at higher frequencies can be calculated using the following Eq.(22) (Jafarpour et al., 2022; Singh Yadav et al., 2020; Lazarević et al., 2013).
Where, A(T) is the temperature dependent parameter and n is a power law exponent i.e. 0 ≤ n ≤ 1 that has been previously reported (Jafarpour et al., 2022). Therefore, sharp increase in conductivity has been observed in higher frequency region. Maxwell–Wagner theory and Koop’s model can also be used to describe the increase of conductivity with frequency. According to this theory, conducting ferrite grains is separated by non-conducting oxygen rich grain boundary. The non-conductive grain boundaries are more significant at low frequency region, whereas at higher frequency region, conductive grains are more prominent, thus the frequency of skipping between Fe2+ and Fe3+ ions of zinc ferrite increases (Lazarević et al., 2013; Murugesan and Chandrasekaran, 2015; Hakeem et al., 2021). Thus, conductivity rises gradually with frequency due to increasing the hopping frequency. The smaller polaron type of conduction is confirmed by the continuous rise in frequency dependent AC conductivity (Lazarević et al., 2013).
3.12 Impedance and modulus analysis
The dielectric and electrical characteristics of the synthesized zinc ferrite nanoparticles have been correlated with microstructures by impedance and modulus spectroscopy. The increase in frequency causes a decrease of real(Z′) and imaginary components of impedance (Z′′) due to space charge polarization in nanocrystalline ZnFe2O4 samples (Singh Yadav et al., 2020). The decrease of impedance with increasing frequency reflects the previously reported rise in AC conductivity.
Complex impedance spectroscopy is an effective method for investigating the interaction of properties (electrical conductivity, dielectric behavior etc.) with microstructures. Fig. 13(a) shows complex impedance spectrum (Z′ vs Z′′) of arcs of the prepared samples. The impedance spectrum is mostly related to the parallel connection of resistance and capacitance of the material. Typically, the impedance spectrum contains two semicircles; first semicircle corresponds to the resistance at grain boundary observed at lower frequency region and the second semicircle attributed to the resistance at the grain sites observed at higher frequency region. The plot of the prepared ZnFe2O4 samples contains single semicircle, which is mostly owing to the significant contribution of the grain boundary to conductivity (Lazarević et al., 2013; Murugesan and Chandrasekaran, 2015; Hakeem et al., 2021).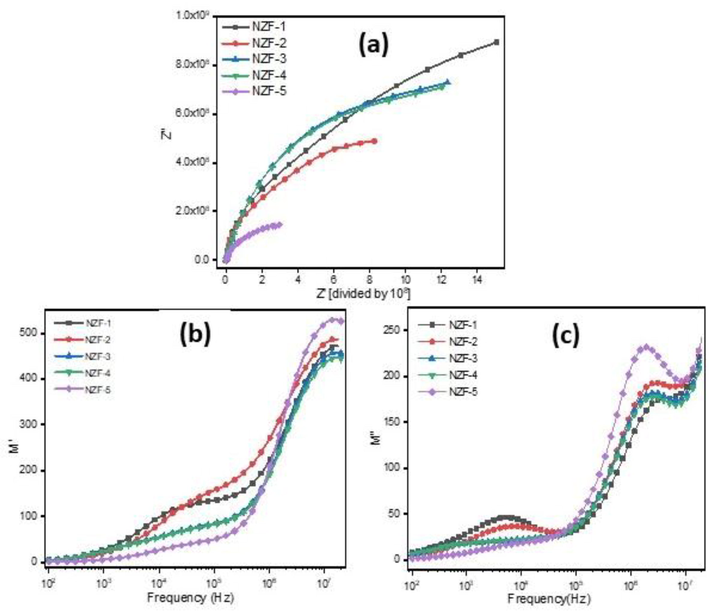
(a) The Nyquist plots (Complex impedance spectrum) and frequency dependent (b) real part of modulus (M′) (c) imaginary part of modulus(M″) of ZnFe2O4.
The frequency dependent real part(M′) and imaginary part(M′′) of modulus are illustrated in Fig. 13(b-c). Figure clearly shows that the real part (M′) and imaginary part (M′′) of modulus rise with frequency, and it has two plateau regions that specify two relaxation processes. The peak in the low frequency region in M′′ spectra is caused by long distance bouncing of ions from one ionic site to the other at grain boundaries while the peak observed at high frequency region is caused by short distance hopping of ions at grains site (Singh Yadav et al., 2020).
4 Conclusion
ZnFe2O4 nanoparticles has been successfully synthesized following the polymer assisted sol–gel method at different annealing temperature using tartaric acid as chelating agent and 5% PVA as fuel. XRD, XPS and FTIR study supports the formation of single-phase cubic spinel structure of nanocrystalline ZnFe2O4 samples and the structural, optical, magnetic and electrical properties were analyzed. X-ray crystallographic data shows that with the escalation of calcination temperature the lattice strain, lattice parameter, dislocation density and cell volume is reduced while the particle size and X-ray density increased. The EDX and XPS spectra demonstrates the purity and existence of Zn, Fe, and O atoms with a high elemental proportion in the prepared samples. The mean particle sizes determined by SEM are found to be larger than the crystallite sizes calculated from XRD data while is smaller than the particle size achieved from Nanoparticle Analyzer based on dynamic light scattering but very close to the particle size obtained from TEM. The band gap value obtained from Tauc formula is lying between 1.86 eV to 1.19 eV and the band gap energy decreases with increase in temperature. Magnetic measurement shows that magnetizations is related to crystallite size and the maximum magnetization found in zinc ferrite nanoparticles calcined at 200 °C. Smaller coercivity values indicate that the prepared ZnFe2O4 nanoparticles are soft magnetic in nature. The dielectric study performed by impedance analyzer revealed that real (ε′) and imaginary (ε′′) parts of dielectric constant decreases with increasing frequency and remains almost constant at higher frequencies. The frequency dependent ac conductivity is found to follow Maxwell–Wegner two-layer model. Complex impedance plots have indicated the presence of single semi-circular arcs which is mainly due to the prominent grain boundary contribution. The synthesized NZF will be applied for gas sensor, humidity sensor and photocatalyst.
Acknowledgements
The authors would like to acknowledge Institute of Glass and Ceramic Research & Testing (IGCRT), Strengthening of Institute of Glass and Ceramic Research & Testing (IGCRT) project (SIGCRT), Institute of Fuel Research & Development (IFRD), Bangladesh Council of Scientific and Industrial Research (BCSIR), Dhaka, Bangladesh for providing technical supports.
Declaration of Competing Interest
The authors declare that they have no known competing financial interests or personal relationships that could have appeared to influence the work reported in this paper.
References
- Size-dependent surface charging of nanoparticles. J. Phys. Chem. C. 2008;112(15):5715-5723.
- [CrossRef] [Google Scholar]
- Structural and optical properties of Mg 1–x Zn x Fe 2 O 4 nano-ferrites synthesized using co-precipitation method. Adv. Nanopart.. 2015;4(May):45-52.
- [CrossRef] [Google Scholar]
- Y. Ahn, D. H. An, M. Sciences, K. U. Kang, M. Sciences, and K. Lee, “Magnetization and Mossbauer Study of Nanosize ZnFe ∼ 2O ∼ 4 Particles Synthesized by Using a Microemulsion Method ¨ ssbauer Study of Nanosize ZnFe 2 O 4 Particles Magnetization and M o Synthesized by Using a Microemulsion Method,” Journal- Korean Phys. Soc., vol. 41, no. July 2014, pp. 123–128, 2002.
- M. A. Almessiere et al., “Sonochemical synthesis of Dy3+ substituted Mn0.5Zn0.5Fe2−xO4 nanoparticles: Structural, magnetic and optical characterizations M.A.,” Ultrason. - Sonochemistry J., vol. 61, no. October 2019, pp. 1350–4177, 2020, doi: doi.org/10.1016/j.ultsonch.2019.104836.
- Hydrothermal synthesis of single - domain zinc ferrite nanoparticles (ZnFe 2 O 4): Structural, morphological, and magnetic studies. J. Supercond. Nov. Magn. 2022:2417-2424.
- [CrossRef] [Google Scholar]
- Evaluation of structural, magnetic, optical, electrical, and humidity sensing properties of manganese - substituted zinc ferrite nanoparticles. Appl. Phys. A. 2021;127(11):1-9.
- [CrossRef] [Google Scholar]
- Magnetization of sol – gel prepared zinc ferrite nanoparticles : Effects of inversion and particle size. Solid State Commun.. 2006;138:416-421.
- [CrossRef] [Google Scholar]
- M. Basak, L. Rahman, F. Ahmed, B. Biswas, and N. Sharmin, “The use of X-ray diffraction peak profile analysis to determine the structural parameters of cobalt ferrite nanoparticles using Debye- Scherrer , Williamson-Hall , Halder-Wagner and Size-strain plot : Different precipitating agent approach,” J. Alloys Compd., no. xxxx, p. 162694, 2021, doi: 10.1016/j.jallcom.2021.162694.
- Calcination effect on structural, morphological and magnetic properties of nano-sized CoFe 2 O 4 developed by a simple co-precipitation technique. Mater. Chem. Phys.. 2021;264(January)
- [CrossRef] [Google Scholar]
- Formation of zinc ferrite by solid-state reaction and its characterization by XRD and XPS. J. Mater. Sci.. 2001;6:5379-5384.
- [Google Scholar]
- Improved functionalization of oleic acid-coated iron oxide nanoparticles for biomedical applications. J. Nanopart. Res.. Sep. 2012;14(9):1100.
- [CrossRef] [Google Scholar]
- Comparison of scanning electron microscopy, dynamic light scattering and analytical ultracentrifugation for the sizing of poly (butyl cyanoacrylate) nanoparticles. Eur. J. Pharm. Biopharm.. 2004;57:369-375.
- [CrossRef] [Google Scholar]
- Effect of Bi3+ ions on the humidity sensitive properties of copper ferrite nanoparticles. Sensors Actuators B. Chem. 2018
- [CrossRef] [Google Scholar]
- Magnetic properties of nanostructured ferrimagnetic zinc ferrite. J. Phys. Condens. Matter. 2000;12(35):7795-7805.
- [CrossRef] [Google Scholar]
- Effect of substrate temperature on the properties of RF sputtered CdS thin fi lms for solar cell applications. Results Phys.. 2020;17(April)
- [CrossRef] [Google Scholar]
- S. Das, L. Rahman, P. P. Mondal, P. L. Mahapatra, and D. Saha, “Screen-printed MgAl 2 O 4 semi-thick film based highly sensitive and stable capacitive humidity sensor,” Ceram. Int., no. August, 2021, doi: 10.1016/j.ceramint.2021.08.260.
- Particle size characterization of sepia ink eumelanin biopolymers by SEM, DLS, and AF4-MALLS : A comparative study. Food Anal. Methods. 2019;12:1140-1151.
- [CrossRef] [Google Scholar]
- Cation distribution in ZnFe20 4 fine particles studied by neutron powder diffraction. Solid State Commun.. 1992;81(7):563-566.
- [Google Scholar]
- T. Dippong and E. A. Levei, “Recent Advances in Synthesis and Applications of MFe 2 O 4 (M = Co , Cu , Mn , Ni , Zn) Nanoparticles,” vol. 4, pp. 3–8, 2021.
- M. Ebrahimi and S. M. Masoudpanah, “Magnetic Properties of Zinc Ferrite Nanoparticles Synthesized by Coprecipitation Method,” Supercond. Nov. Magn., vol. 27, no. June, 2014, doi: 10.1007/s10948-014-2485-4.
- Nanocrystalline zinc ferrite photocatalysts formed using the colloid mill and hydrothermal technique. Chem. Eng. J. J.. 2009;155:534-541.
- [CrossRef] [Google Scholar]
- Synthesis and characterization of zinc ferrite nanoparticles by a thermal treatment method. Solid State Commun.. 2011;151(14–15):1031-1035.
- [CrossRef] [Google Scholar]
- Al-substituted zinc spinel ferrite nanoparticles : Preparation and evaluation of structural, electrical, magnetic and photocatalytic properties. Ceram. Int.. 2020;46(9):14195-14205.
- [CrossRef] [Google Scholar]
- Structural, magnetic and electrical properties of cobalt ferrites prepared by the sol-gel route. J. Alloys Compd.. 2008;465(1–2):227-231.
- [CrossRef] [Google Scholar]
- A facile spray pyrolysis method to prepare Ti-doped ZnFe2O4 for boosting photoelectrochemical water splitting. J. Mater. Chem. A. 2017;5(16):7571-7577.
- [CrossRef] [Google Scholar]
- Conductivity and giant permittivity study of Zn0.5Ni0.5Fe2O4 spinel ferrite as a function of frequency and temperature. RSC Adv.. 2019;9(56):32395-32402.
- [CrossRef] [Google Scholar]
- Magnetic, dielectric and structural properties of spinel ferrites synthesized by sol-gel method. J. Mater. Res. Technol.. 2021;11:158-169.
- [CrossRef] [Google Scholar]
- Surface charge and interfacial potential of titanium dioxide nanoparticles: Experimental and theoretical investigations. J. Colloid Interface Sci.. 2013;407:168-176.
- [CrossRef] [Google Scholar]
- S. Hossain et al., “Effect of synthesis methods and a comparative study of structural and magnetic properties of zinc ferrite Effect of synthesis methods and a comparative study of structural and magnetic properties of zinc ferrite,” vol. 105321, 2017.
- Synthesis of ZnFe 2 O 4 using sol-gel method : Effect of different calcination parameters. Procedia Eng.. 2016;148:787-794.
- [CrossRef] [Google Scholar]
- The effect of lanthanum substitution on the structural, magnetic, and dielectric properties of nanocrystalline Mn-Ni spinel ferrite for radio frequency (RF) applications. Phys. Lett. A. 2022;446
- [CrossRef] [Google Scholar]
- Correlation among the structural, electric and magnetic properties of Al3+ substituted Ni-Zn-Co ferrites. RSC Adv.. 2022;12(24):15167-15179.
- [CrossRef] [Google Scholar]
- Effect of calcination temperature on the structural and electrical properties of cobalt ferrite synthesized by combustion method. J. Alloys Compd.. 2011;509(5):1861-1865.
- [CrossRef] [Google Scholar]
- S. Kumar, S. Tapash, C. Paul, S. Dutta, and M. N. H. M. N. H. Mia, “XRD peak profile and optical properties analysis of Ag ‑ doped h ‑ MoO 3 nanorods synthesized via hydrothermal method,” J. Mater. Sci. Mater. Electron., vol. 31, no. 2, pp. 1768–1786, 2020, doi: 10.1007/s10854-019-02694-y.
- Structural, dielectric and humidity properties of Al-Ni-Zn ferrite prepared by co- precipitation method. J. Alloys Compd. 2018
- [CrossRef] [Google Scholar]
- V. Lakshmi Ranganatha, S. Pramila, G. Nagaraju, Udayabhanu, B. S. Surendra, and C. Mallikarjunaswamy, “Cost-effective and green approach for the synthesis of zinc ferrite nanoparticles using Aegle Marmelos extract as a fuel: catalytic, electrochemical, and microbial applications,” J. Mater. Sci. Mater. Electron., vol. 31, no. 20, pp. 17386–17403, 2020, doi: 10.1007/s10854-020-04295-6.
- Structural, electrical and dielectric properties of spinel nickel ferrite prepared by soft mechanochemical synthesis. Mater. Res. Bull.. 2013;48(10):4368-4378.
- [CrossRef] [Google Scholar]
- Effect of milling conditions on the formation of ZnFe 2 O 4 nanocrystalline. Int. J. Phys. Sci.. 2013;8(10):380-387.
- [CrossRef] [Google Scholar]
- Highly active S-modified ZnFe2O4 heterogeneous catalyst and its photo-Fenton behavior under UV-visible irradiation. Ind. Eng. Chem. Res.. 2011;50(12):7219-7227.
- [CrossRef] [Google Scholar]
- E. S. M. Madhukara, N. M. Vinuth, and Y. V. R. Reddy, “Green synthesis of Lawsonia inermis ‑ mediated zinc ferrite nanoparticles for magnetic studies and anticancer activity against breast cancer (MCF ‑ 7) cell lines,” J. Mater. Sci. Mater. Electron., no. 0123456789, pp. 1–8, 2020, doi: 10.1007/s10854-020-03394-8.
- Novel capacitive humidity sensing properties of cobalt chromite nanoparticles based thick film. Microchem. J.. 2020;152(November 2019):104452.
- [CrossRef] [Google Scholar]
- Effect of hydrothermal reaction time on electrical, structural and magnetic properties of cobalt ferrite. Z. Phys. Chem. 2019
- [CrossRef] [Google Scholar]
- Optical and magnetic properties of Mg-doped ZnFe 2 O 4 nanoparticles prepared by rapid microwave combustion method. Superlattices Microstruct.. 2013;64:118-131.
- [CrossRef] [Google Scholar]
- M. M. H. Masoudi, “Zinc Ferrite Nanoparticles : New Preparation Method and Magnetic Properties Zinc Ferrite Nanoparticles : New Preparation Method,” no. August, 2014, doi: 10.1007/s10948-014-2625-x.
- Electrical and dielectric properties of nano crystalline Ni-Co spinel ferrites. Mater. Res. Bull.. 2013;48(4):1415-1419.
- [CrossRef] [Google Scholar]
- M. Milanovi, I. Stijepovi, V. Pavlov. V. V Srdi, “Functionalization zinc ferrite nanoparticles Influ. Modif. Proced. Colloid. Stab. Funct. zinc ferrite nanoparticles Influ. Modif. Proced. o, vol. 10, no. January 2017, pp. 287–293, 2016, doi: 10.2298/PAC1604287M.
- E. M. Mohammed, “Effect of Sintering Temperature on the Structural Magnetic and Electrical Properties of Zinc Ferrite Samples,” J. Nanomater. Mol. Nanotechnol., no. October, 2018, doi: 10.1080/00150193.2016.1239478.
- Enhanced electrical and magnetic properties of annealed magnesium ferrite nanoparticles. J. Supercond. Nov. Magn.. 2015;28(12):3607-3615.
- [CrossRef] [Google Scholar]
- S. Muthurani, M. Balaji, S. Gautam, and K. Hwa, “Magnetic and humidity sensing properties of nanostructured Cu x Co 1 − x Fe 2 O 4 synthesized by auto combustion technique,” cond-mat.mtrl-science, 2010.
- Structural, electrical and magnetic characterization of Ni-Mg spinel ferrites. J. Alloys Compd.. 2009;487(1–2):739-743.
- [CrossRef] [Google Scholar]
- Synthesis, characterization and electrical properties of ZnFe2O4 nanoparticles. AIP Conf. Proc.. 2015;1665(2):946-948.
- [CrossRef] [Google Scholar]
- Investigation of ZnFe 2 O 4 spinel ferrite nanocrystalline screen-printed thick films for application in humidity sensing. Int. J. Appl. Ceram. Technol.. 2019;16(3):981-993.
- [CrossRef] [Google Scholar]
- Superparamagnetic and perfect-paramagnetic zinc ferrite quantum dots from microwave-assisted tunable synthesis. ACS Omega. 2022;7(35):31607-31611.
- [CrossRef] [Google Scholar]
- “Investigations on physical properties of Mg ferrite nanoparticles for microwave applications”. J. Microw. Power Electromagn. Energy. 2019;53(1):3-11.
- [CrossRef] [Google Scholar]
- Structural, magnetic and electrical properties of nanocrystalline zinc ferrite. J. Alloys Compd.. 2011;509(9):3917-3923.
- [CrossRef] [Google Scholar]
- Structural and magnetic properties of Mn-Zn ferrites synthesized by microwave-hydrothermal process. Solid State Phenom.. 2015;232:45-64.
- [CrossRef] [Google Scholar]
- Investigation of structural, morphological and magnetic properties of nanostructured strontium hexaferrite through co-precipitation technique: Impacts of annealing temperature and Fe/Sr ratio. Heliyon. 2023;9(3):e14532.
- [Google Scholar]
- N-N-methylene bis acrylamide : A novel fuel for combustion synthesis of zinc ferrite nanoparticles and studied by X-Ray photoelectron spectroscopy. Int. J. ChemTech. Res.. 2016;6(May):2834-2842.
- [Google Scholar]
- J. Rani, D. Dayalan, and K. S. Nagaraja, “Synthesis of metal ferrite (MFe 2 O 4 , M = Co , Cu , Mg , Ni , Zn) nanoparticles as humidity sensor materials,” no. September 2015, 2012, doi: 10.1080/17458080.2012.690893.
- Structural, optical, dielectric, and magnetic properties of spinel MFe2O4 (M = Co and Zn) nanoparticles synthesized by CTAB-assisted hydrothermal method. Ceram. Int. Jul. 2022
- [CrossRef] [Google Scholar]
- Structural characterization and magnetic properties of superparamagnetic zinc ferrite nanoparticles synthesized by the coprecipitation method. J. Magn. Magn. Mater.. 2012;324(22):3762-3765.
- [CrossRef] [Google Scholar]
- J. L. and C. L. Shouliang Wu, Panpan Wang, Yunyu Cai, Dewei Liang, Yixing Ye, Zhenfei Tian, “Reduced Graphene Oxide Anchored Magnetic ZnFe2O4 Nanoparticles with Enhanced Visible Light Photocatalytic Activity Shouliang,” RSC Adv., vol. 5, pp. 9069–9074, 2015, doi: DOI: 10.1039/C4RA14587A.
- Impact of sonochemical synthesis condition on the structural and physical properties of MnFe2O4 spinel ferrite nanoparticles. Ultrason. Sonochem.. 2020;61:104839
- [CrossRef] [Google Scholar]
- A new ultrasonic cavitation approach for the synthesis of zinc ferrite nanocrystals. Curr. Appl. Phys.. 2006;6:591-593.
- [CrossRef] [Google Scholar]
- P. Thandapani, M. R. Viswanathan, and J. C. Denardin, “Magnetocaloric Effect and Universal Curve Behavior in Superparamagnetic Zinc Ferrite Nanoparticles Synthesized via Microwave Assisted Co-Precipitation Method,” Phys. Status Solidi A, no. February, 2018, doi: 10.1002/pssa.201700842.
- Effect of size and synthesis route on the magnetic properties of chemically prepared nanosize ZnFe 2 O 4. J. Magn. Magn. Mater.. 2007;312(May):271-279.
- [CrossRef] [Google Scholar]
- A comprehensive study on structure, properties, synthesis and characterization of ferrites. AIMS Mater. Sci.. 2020;7(6):800-835.
- [CrossRef] [Google Scholar]
- Study of structural, optical, dielectric and magnetic properties of zinc ferrite synthesized by co-precipitation. Nano Hybrids Compos.. 2017;17:1-9.
- [CrossRef] [Google Scholar]
- C. Virlan, F. Tudorache, and A. Pui, “Increased sensibility of mixed ferrite humidity sensors by subsequent heat treatment,” pp. 0–2, doi: 10.1111/ijlh.12426.
- One-step hydrothermal synthesis of ZnFe2O4 nano-octahedrons as a high capacity anode material for Li-ion batteries. Nano Res.. 2012;5(7):477-485.
- [CrossRef] [Google Scholar]
- Y. Yang, X. Wang, G. Yi, H. Li, C. Shi, and G. Sun, “Hydrothermal Synthesis of Co 3 O 4 / ZnO Hybrid Nanoparticles for Triethylamine Detection,” no. 2, pp. 1–12, 2019.
- S. Yousaf et al., “Structural and electrical properties of Ba-substituted spinel ferrites,” Mater. Sci. Semicond. Process., vol. 122, no. May 2020, p. 105488, 2021, doi: 10.1016/j.mssp.2020.105488.


