

Translate this page into:
Exploring the application of the hybrid nano-bioreactor technology based on the developed polyethersulfone mixed-matrix membrane for industrial effluent treatment
⁎Corresponding author at: Department of Chemical Engineering, Babol Noshirvani University of Technology, Shariati Av., P.O. Box: 484, Babol 47148-71167, Iran. mmohse@yahoo.com (Mohsen Jahanshahi)
-
Received: ,
Accepted: ,
This article was originally published by Elsevier and was migrated to Scientific Scholar after the change of Publisher.
Peer review under responsibility of King Saud University.
Abstract
Due to the high concentration of various contaminants in the paper mill effluent, it must undergo an efficient treatment process before being discharged to the environment or being reused in the production cycle. In the present study, the submerged membrane adsorption bioreactor (SMABR) system was used for the treatment of the paper mill effluent. The modified polyethersulfone PES/MoS2 membrane was fabricated by incorporating exfoliated MoS2 nanosheets prepared in the laboratory, into the PES matrix. This membrane along with the powdered activated carbon (PAC) were utilized in the SMABR system for the paper mill effluent treatment. After the acclimation of the sludge with the target effluent, the optimum values of food to microorganism (F/M), hydraulic retention time (HRT), and adsorbent dosage were determined separately to be 0.451, 18 h, and 3 g/L by considering the maximum values of chemical oxygen demand (COD) removal and mixed liquor suspended solid MLSS concentration in each stage. In the final stage, the MBR and SMABR systems (using the pristine and modified membranes, separately) were prepared to separately investigate the effect of the presence of the PAC adsorbent and modified membrane, on the output parameters. In all systems, the values of pH and dissolved oxygen (DO) were maintained in the normal range (pH: 6.2–6.7, DO>2) to provide favorable conditions for the growth of microorganisms. Most importantly, best performance in this study was related to the SMABR system consisting the PES/MoS2 membrane and PAC adsorbent, with the highest values of COD removal (96%), MLSS concentration (15620 mg/L), and membrane permeation flux (110 L/m2.h). It is worth mentioning that the functionalized membrane exhibited better hydrophilicity compared with the pristine membrane, resulting in high water permeation flux, which is in accordance with the performance results.
Keywords
Submerged membrane adsorption bioreactors (SMABR)
Membrane bioreactor (MBR)
Mixed-matrix membranes (MMMs)
Paper mill
Effluent treatment
Powdered activated carbon (PAC)
Chemical Oxygen Demand (COD)

Nomenclature
- COD
-
Chemical Oxygen Demand
- BOD
-
Biochemical Oxygen Demand
- MLSS
-
Mixed Liquor Suspended Solid
- TSS
-
Total Suspended Solid
- TDS
-
Total Dissolved Solid
- SS
-
Suspended Solids
- EC
-
Electrical Conductivity
- DO
-
Dissolved Oxygen
- MoS2
-
Molybdenum disulfide
- DMF
-
Dimethylformamide
- NMP
-
N-Methyl-2-pyrrolidone
- DMAc
-
Dimethylacetamide
- H2SO4
-
Sulfuric Acid
- NaOH
-
Sodium Hydroxide
- C6H12O6
-
Glucose
- PES
-
Polyethersulfone
- PVP
-
Polyvinylpyrrolidone
- HRT
-
Hydraulic Retention Time
- F/M
-
Food to Microorganism
- PAC
-
Powdered Activated Carbon
- AC
-
Activated Carbon
- MBR
-
Membrane Bioreactor
- SMABR
-
Submerged Membrane Adsorption Bioreactor
- MMMs
-
Mixed-Matrix Membranes
- FESEM
-
Field-Emission Scanning Electron Microscopy
- EDX
-
Energy Dispersive X-Ray
- FTIR
-
Fourier Transform Infrared Spectroscopy
- CA
-
Contact Angle
- AFM
-
Atomic Force Microscopy
1 Introduction
The pulp and paper mill is one of the major industries in the countries having lands with dense forests. In the north of Iran, the pulp and paper mill is one of the largest manufacturing industries. Throughout different stages of operation including washing, pulping, bleaching, and paper-making, the pulp and paper industry has a significant demand for water. Available data reveals that approximately 250–300 m3 of water is used by the industry to manufacture 1 ton of paper (Chaudhry and Paliwal, 2018). Consequently, a substantial volume of liquid waste, containing a variety of harmful chemicals, is released into the environment. Discharged effluent from these factories are usually dark brown with high values of biochemical oxygen demand (BOD), chemical oxygen demand (COD), suspended solids (SS), and dye compounds (Haq and Raj, 2020). Therefore, using efficient treatment processes before discharging pulp and paper wastewater plays an integral role in minimizing environmental damage. Consequently, several studies have been conducted in the field of paper mill effluent treatment using a variety of physical, chemical, and biological techniques (Thompson, Swain et al. 2001, Žarković, Todorović et al. 2011, Elnakar and Buchanan 2019).
Several different methods have been used in order to treat industrial wastewater, such as biodegradation (in bioreactors), multistage membrane filtration, adsorption, and etc. (Adane, Adugna et al. 2021, Lima, Dehghani et al. 2021, Yekani, Peyravi et al. 2022). While physiochemical methods have the capability to eliminate the majority of the paper mill wastewater pollutants, they often necessitate substantial quantities of chemicals and a significant energy input (Kamali and Khodaparast, 2015). Currently, most of the paper mill effluents are treated using biological treatment systems. However, the effluent from the biological treatment usually still contains significant amount of color compounds, microorganisms, recalcitrant organic compounds, and SS (Gönder, Arayici et al. 2011). Another reliable separation method with high efficiency in effluent treatment is the membrane filtration (Wang, Fortunato et al. 2017). Mixed-matrix membranes (MMMs) composed of a functionalized filler incorporated into a polymer matrix are of great interest due to their improved properties, such as hydrophilicity, porosity, anti-fouling ability, water flux, and removal efficiency (Qadir, Mukhtar et al. 2017). One of the main drawbacks in using membrane filtration for the effluent treatment is the membrane fouling and a great portion of modification approaches are meant to mitigate this problem (Abdel-Karim, El-Naggar et al. 2021). Due to the drawbacks of the mentioned methods, hybrid systems have been devised to simultaneously harness their advantages and mitigate their unique limitations. The membrane bioreactor (MBR) and submerged membrane adsorption bioreactors (SMABR) are such hybrid systems (Guo, Vigneswaran et al. 2008, Xiao, Liang et al. 2019, Al-Shaeli, Smith et al. 2021). The MBR is composed of a suspended growth bioreactor and a submerged membrane module containing a porous membrane, which leads to the high retention of biomass and improved performance of the biological reactor, resulting to the high microbial concentration and high sludge ages, respectively (Pervez, Balakrishnan et al. 2020). Although the MBR systems offer the significant ability to remove contaminants and high resistance against high loadings, membrane fouling is still a problem that limits the industrial application of the MBR system (Du, Shi et al. 2020). There are two major approaches to mitigate this problem and enhance the overall system efficiency: (i) utilizing modified membranes with low fouling tendency, (ii) changing the system configuration. Regarding the second approach, the SMABR system was invented by use of powdered activated carbon (PAC) in the MBR system (Jeong, Naidu et al. 2013). PAC is used as a supplementary treatment agent in MBR for three main purposes. Firstly, it can adsorb bio-refractory organic pollutants that cannot be biologically degraded, thanks to its substantial adsorption capacity. Secondly, the high surface area of the nano porous adsorbent creates more growth sites for microorganisms and reactive sites between microorganisms and organic matter. Lastly, PAC acts as a filtration aid, helping to reduce membrane fouling (Peyravi, Jahanshahi et al. 2016).
In the present study, the SMABR system was used for the treatment of the paper mill effluent and the impact of using the modified PES/MoS2 membrane which fabricated by incorporating exfoliated MoS2 nanosheets into the PES matrix was investigated. The PAC was utilized in the SMABR system not only to mitigate the effects of membrane fouling but also to enhance the efficiency of the SMABR for the paper mill effluent treatment. The effluent used in this study was supplied from Pouya Aish Mazand paper mill located in Raja industrial estate in Babol, Mazandaran, Iran. To identify all the physicochemical and intrinsic properties of the samples existing throughout this study, different analytical methods and devices were employed, including the measurement of the mixed liquor suspended solids (MLSS) and COD, conductivity meter, field-emission scanning electron microscopy (FESEM), energy dispersive X-Ray (EDX) spectroscopy, Fourier transform infrared spectroscopy (FTIR), contact angle (CA) measurement and atomic force microscopy (AFM).
2 Materials and methods
2.1 Materials
All the analytical-grade chemicals used in this study were commercially supplied and utilized without further purification. Molybdenum disulfide (MoS2, commercial), dimethylformamide (DMF, C3H7NO, solvent), N-Methyl-2-pyrrolidone (NMP, C5H9NO, solvent), dimethylacetamide (DMAc, CH3C(O)N(CH3)2, solvent), sulfuric acid (H2SO4, acid agent), sodium hydroxide (NaOH, base agent), and glucose (C6H12O6, carbon source) were supplied from Merck, Germany. Polyethersulfone (PES, C27H22(SO4)n), polyvinylpyrrolidone (PVP, (C3H6O3)n), and powdered activated carbon powder (PAC, adsorbent) were purchased from Sigma-Aldrich, USA. Silver sulfate (Ag2SO4, COD test), mercury (II) sulfate (HgSO4, COD test), and potassium dichromate (K2Cr2O7, COD test) were supplied from Scharlau, Spain. Distilled water used throughout our experiments was produced in the laboratory.
The effluent used in this study was supplied from Pouya Aish Mazand paper mill located in Raja industrial estate in Babol, Mazandaran, Iran. At each stage, 20 L of effluent from the outlet of the chemical pretreatment unit of the treatment plant of this factory was supplied and stored in plastic containers. These containers were kept at 4 °C to stabilize some of their physical and chemical properties during the storage. Some of the main characteristics of the effluent obtained from the paper mill are illustrated in Table 1.
Parameter
Value
Unit
Chemical Oxygen Demand (COD)
2167–2756
mg/L
Biological Oxygen Demand (BOD5)
1410–1700
mg/L
Total Suspended Solid (TSS)
1740–3120
mg/L
Total Dissolved Solid (TDS)
1186–1680
mg/L
Electrical Conductivity (EC)
2205–3108
pH
6.5–7.4
–
The activated sludge used in this study was supplied from the effluent treatment plant of Baboltoyoor slaughterhouse located in Babol, Mazandaran, Iran. Some of the main characteristics of this activated sludge are shown in Table 2.
Parameter
Value
Unit
COD
100
mg/L
MLSS
3600
mg/L
TDS
1080
mg/L
pH
6–7
–
2.2 Fabrication of the exfoliated MoS2 nanosheet
To fabricate the exfoliated MoS2 nanosheet, the commercial MoS2 nanosheet must get exfoliated using the ultrasonic process. In order to reduce the level of toxicity and impurity, the commercial MoS2 powder was first dissolved in the 10 mg/ml solution consisted of isopropanol and distilled water with identical volume ratio upon the ultrasonic bath. To control the temperature and prevent any potential harm to the synthesis process, the ultrasonic bath was filled with ice and water. This methodology was indicated as a high efficiency procedure for the fabrication of the exfoliated MoS2 nanosheet, which results in the lowest level of impurity (Arefi-Oskoui, Khataee et al. 2020). Next, the unwanted precipitated particles were removed from the solution using a centrifuge at the speed of 6000 rpm for 15 min. This removal process was repeated two times to obtain a homogeneous solution with appropriate size and thickness distribution of nanosheets. Finally, the supernatant was collected and placed in a vacuum oven for 24 h to obtain the exfoliated MoS2 nanosheets.
2.3 Fabrication of the PES/MoS2 membrane
Non-solvent induced phase separation (NIPS) method was used in this study to fabricate the pristine (PES) and modified (PES/MoS2) membranes (Arjmandi, Peyravi et al. 2020). Accordingly, the PES polymer was used as the main polymer matrix of the membrane. For the pristine PES membrane, 20 wt% (based on the total weight of the solution) of the PES polymer was added to the DMAc solvent under vigorous stirring applied by a magnetic stirrer to obtain a homogeneous mixture. After that, the stirring speed was reduced to prevent the creation of internal bubbles as much as possible, and the mixture was allowed to mix for 12 h. Next, the homogeneous mixture was remained immobilized for a few hours for removing all entrained bubbles. Then, the polymer solution was casted on a nonwoven polyester sheet using a stain-less still casting knife with specific thickness. The casted sheet was immediately immersed in a water bath filled with distilled water and remained there for 24 h to complete the phase inversion. Finally, the formed membrane was naturally dried in the ambient temperature for 24 h.
The fabrication procedure of the PES/MoS2 membrane is similar to the aforementioned method in general, except for the preparation of the polymer solution. For the modified membrane, 0.2 g of the exfoliated MoS2 nanosheet was firstly added to the DMAc solvent in a container placed in the ultrasonic bath. Then, 1 wt% of the PVP as a surface stabilizer alongside with the 20 wt% of the PES polymer were added to the mixture and allowed to mix for 24 h using a magnetic stirrer. Then, the fabrication procedure was performed according to the PES membrane fabrication method, as mentioned earlier.
2.4 Acclimation of the effluent and activated sludge
In order to treat the effluent of the paper mill by the activated sludge process, an activated sludge acclimated with effluent is needed. The purpose of conducting this process prior to the aerobic treatment is to prevent shock to microorganisms due to high pollution of the effluent and their death (Wang and Wang 2018). During this process, values of the mixed liquor suspended solids (MLSS) and chemical oxygen demand (COD) parameters were recorded and monitored continuously through standard methods. Also, the concentration of dissolved oxygen for the mixture of effluent and activated sludge in the bioreactor, was kept under 3 mg/L using air pumps. For the acclimation, some aerobic activated sludge was first aerated for 24 h prior to adding to the effluent. Afterwards, diluted effluent with some glucose as an auxiliary carbon source was added to the bioreactor content in the early days to facilitate the acclimation. Then, the volume of added effluent was gradually increased daily so that the biomass in the sludge can withstand the effluent with higher organic load.
2.5 Investigation of the F/M ratio and optimal hydraulic retention time
The F/M ratio refers to balance between the food materials, inlet BOD or COD, and mass of microorganism in a system, and is an important operational parameter in the activated sludge process. This parameter has a meaningful effect on the removal efficiency of organic materials, sludge properties, and microbial composition, all of which affect the efficiency of the process and degree of membrane fouling in membrane bioreactors (Kitade, Wu et al. 2013). The F/M ratio is calculated according to the following equation:
To obtain the optimal points of the F/M and HRT values, some experiments were conducted for the system of this study. According to the experiments, the effluents of the paper mill with different concentrations were aerated at different HRT values (12, 18, and 24 h). The values of COD and MLSS were measured at the end of each experiment and the values of F/M and HRT were plotted versus the values removal efficiency based on COD, to obtain the optimal values of F/M and HRT.
2.6 Adsorption by the PAC and perlite powder and determining the optimum point
The performed experiments in batch systems were evaluated in the presence and absence of the PAC and perlite adsorbents in the bioreactors. To aim this goal, six 500 mL tanks consisted of 200 mL activated sludge and 200 mL effluent were prepared to estimate the needed amount of adsorbent. Certain amount of adsorbent powder was added to each tank. After 24 h, the removal trend of COD was evaluated based on the consumed amount of adsorbent.
2.7 Landfill leachate treatment system using activated sludge and adsorption
For performing the experiments of treating the effluent of the paper mill using the activated sludge alongside the adsorption, three bioreactors were made of plexiglass with nominal volumes of 20 L. Four circular air stones with approximate diameter of 5 cm were installed at the bottom of each tank to supply the uniform distribution of air bubbles produced by the air compressor. The feed stream enters the bioreactor from the top of the tank and the mixing process is conducted by the flow of bubbles produced by the air compressor that comes out of the built-in diffusers. The biological treatment system used in this study is composed of four hierarchical steps; pumping, aeration (reaction between unwanted organic materials and microorganisms), settling (settlement of the activated sludge), and discharge (discharge of the treated effluent).
According to the optimum F/M ratio, 8 L of the paper mill effluent with a COD concentration of 2462 mg/L was added to 8 L of the activated sludge with MLSS value of 5000 mg/L in two bioreactors. In addition to the 1:1 ratio of effluent and activated sludge in the reactors, one bioreactor containing PAC adsorbent and the other one without adding adsorbent were considered for this experiment. The experiment temperature was in the range of 25–27 °C (ambient temperature) for all the bioreactors and before the aeration stage, the PAC adsorbent was added in one of the bioreactors. Aeration of the bioreactors was done using an air compressor during 24 h at the optimum HRT. After the aeration stage and 30 min of settlement, 0.5 L of supernatant was collected and removed from the bioreactors, and then, 0.5 L of fresh leachate (and 3 gr of adsorbent for one of the bioreactors) was added to the system following by another aeration stage.
2.8 Membrane system
To conduct the membrane separation process using the fabricated membranes, the plate-and-frame module was used. The fabricated membranes were cut according to the dimensions of the module and their separation parameters were calculated. The membrane module used in this study is made of Plexiglas. In order to evaluate the performance of membranes in the bioreactor membrane and photobioreactor membrane systems, the membrane permeate flux was calculated under vacuum pressure of 0.7 bar and over 30 min according to the following equation (Arjmandi, Peyravi et al. 2019):
2.9 The submerged membrane adsorption bioreactor (SMABR)
After optimizing the combined process of activated sludge and adsorption, the membrane module was placed into the bioreactor to run the submerged membrane adsorption bioreactor (SMABR) process. To comprehensively evaluate all aspects of the modification approaches, this process was conducted through four bioreactors; (1) bioreactor containing the pristine membrane, (2) bioreactor containing the PES/MoS2 membrane, (3) bioreactor containing the pristine membrane and PAC adsorbent, and (4) bioreactor containing the PES/MoS2 membrane and PAC adsorbent. The bioreactors used in this study were devised as trapezoidal cubic tanks made of Plexiglas with 20 L volume for each. To facilitate the collection and disposal of the settled sludge, the bottom of the tanks was designed sloping at a slight angle with a drain valve. Also, three drain valves with a distance of 10 cm from each other (bottom to top) were embedded on the side-wall of the bioreactors. In the SMABR process designed in this study, the target effluent undergoes the aerobic process with simultaneous aeration and mixing. Also, the nanostructured adsorbent was manually added to the system.
2.10 Characterization
To identify all the physicochemical and intrinsic properties of the samples existing throughout this study, different analytical methods and devices were employed. To measure the values of MLSS of the liquid samples, the standard method of American Public Health Association (APHA) 2540 D was conducted (Association and Association, 1995). Briefly described, a well-mixed sample was first filtered through a weighed standard filter paper and the residue retained on the filter was dried to a constant weight at 103 to 105 °C. The increase in weight of the filter paper represents the total suspended solids. To measure the values of COD of the liquid samples, the standard method of APHA 5220 D (closed reflux, calorimetric method) was conducted (Association and Association, 1995). A conductivity meter (Lutor, WA-2017SD) was used to measure the values of conductivity, salt, and TDS for the liquid samples. The field-emission scanning electron microscopy (FESEM, MIRA3 TESCAN, Czech) and energy dispersive X-Ray (EDX) spectroscopy with an Everhart-Thornley (ET) detector and a Schottky field emission electron gun was employed to investigate the structure (morphology and thickness) and elemental compositions of the modified membrane. Also, the FESEM images were used to visualize the physical structure of the synthesized MoS2 nanostructures. To identify the chemical groups existing in the samples, the Fourier transform infrared spectroscopy (FTIR) spectra were collected (Thermo scientific, USA) in the range of 400 – 4000 cm−1. The membrane surface hydrophilicity of the substrates was analyzed with DI water using contact angle (CA) measurement (KRUSS G10, Germany). The prepared membranes were analyzed for the surface pore size and roughness using Atomic Force Microscopy (AFM). The AFM device used in this study was the Nanosurf scanning probe-optical microscope (EasyScan II_Swiss). To facilitate imaging, small squares of the prepared membranes, were cut and affixed onto glass substrates. The membrane surfaces were then scanned with a scan size of 10 µm x 10 µm. The height profiles of the AFM images obtained were analyzed using the Nanosurf Report software, enabling the extraction of the surface pore size distribution (PSD) and average surface pore size of the membranes. The average pore sizes of the membrane surface were subsequently determined by analyzing the surface PSD graphs, employing the following equation:
3 Results and discussion
3.1 Characterization
3.1.1 MoS2 nanosheets
The FTIR analysis was performed on the MoS2 nanostructures, for either the bulk or exfoliated phase, in the range of 400 – 4000 cm−1 to verify the chemical nature of the samples and the results are depicted in Fig. 1. According to the results, the distinct peak observed at 3426 and 1644 cm−1 FT-IR spectrum of bulk MoS2 can be attributed to the vibrational mode of O–H bonds within the crystalline framework of MoS2 (Jahangiri and Akbari 2015, Arefi-Oskoui, Vatanpour et al. 2016).When examining exfoliated MoS2, the presence of this pronounced peak verifies the formation of hydroxyl groups within the crystalline structure of MoS2 as a result of ultrasonication (Arefi-Oskoui, Khataee et al. 2020). Moreover, the presence of absorption bands within the spectrum of MoS2 nanosheets, specifically the prominent absorption band at 1398 cm−1, is significant. These absorption bands can be attributed to the vibration of the Mo-OH group, providing further confirmation of the generation of multiple hydrophilic hydroxyl groups during the exfoliation process facilitated by ultrasonic irradiation (Li, Wang et al. 2019, Ali, Mohammed et al. 2022). The peak at 1060 cm−1 can be ascribed to the formation of sulfate groups resulting from the surface oxidation of MoS2 in the presence of air (Ren, Zhang et al. 2015). Some of the absorption peaks observed in the samples can be attributed to the insignificant impurities adsorbed from the atmosphere such as water, CO2 and O2. The characteristic peaks are identical for the bulk and exfoliated MoS2 samples, and there are only some difference in the peak intensity, which can be attributed to the more surface oxidation of the exfoliated samples during their ultrasonication (Arefi-Oskoui, Khataee et al. 2020).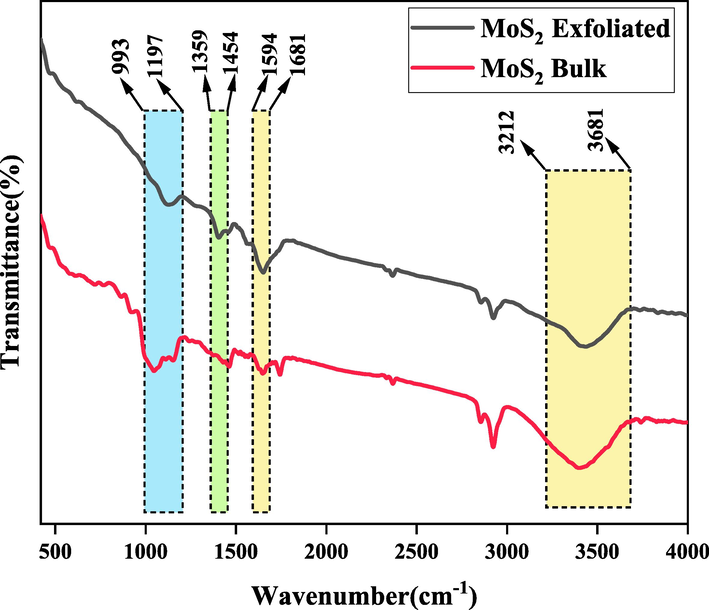
FTIR spectra of the bulk and exfoliated MoS2 samples.
The morphological analysis of the commercial MoS2 samples and exfoliated nanosheets prepared in the laboratory was performed using the FESEM images of these nanostructures, which are shown in Fig. 2. Accordingly, the pristine commercial MoS2 nanoparticles have the expected typical structure, large-scale, thick, with regular boundary and laminar structure (Liang, Wang et al. 2019). Notably, some layers were emerged in the FESEM images of the exfoliated MoS2 nanosheets. After exfoliation, FESEM analysis showed typical 2D flakes consisting of nanosheets as thin as a cicada wing. This observation easily confirms breaking the Mo-S bond by the isopropyl alcohol functional groups during the ultrasonic process (Ma, Shen et al. 2018). In conclusion, the exfoliated MoS2 nanosheets were successfully fabricated in this study.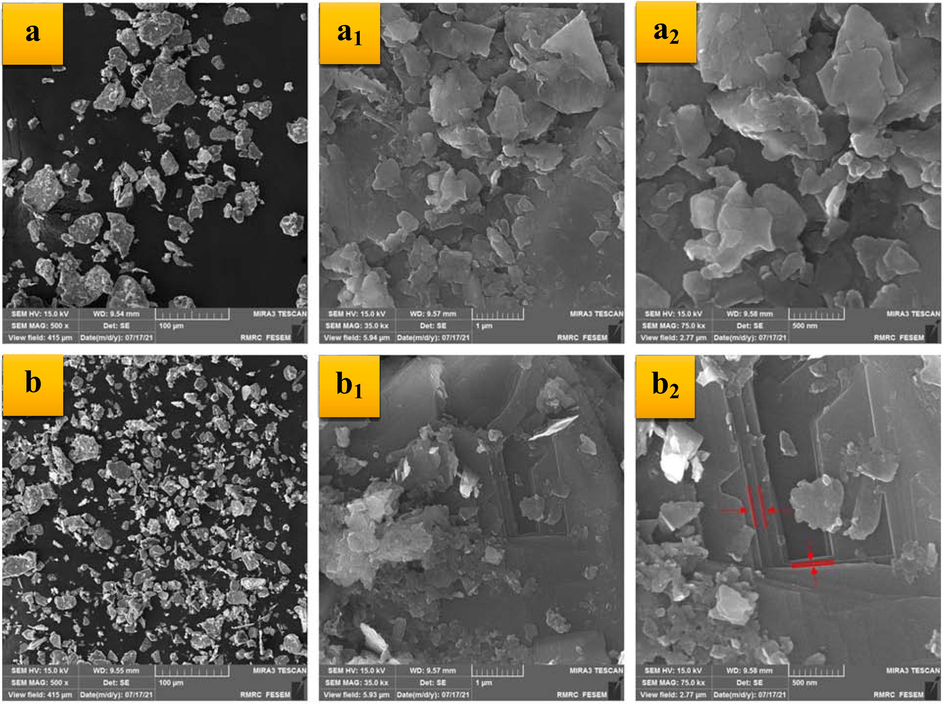
The FESEM images of the bulk (a: 100 µm, a1: 1 µm, a2: 500 nm) and exfoliated MoS2 samples (b: 100 µm, b1: 1 µm, b2: 500 nm) in different magnifications.
3.1.2 PES and PES/MoS2 membranes
In order to investigate the effect of the modification approach conducted in this study, FESEM images and results of the CA measurement were prepared and presented in this section. The top-surface and cross-section FESEM images of the pristine and MoS2-embedded membranes were prepared and illustrated in Fig. 3. According to the results, the PES membrane has a typical asymmetric structure that was expected. As can be observed, there is not any agglomeration on the top surface of the bare and nanocomposite membranes, confirming that the MoS2 nanosheets have been dispersed well in dope solution. By comparing the cross-section FESEM of the membranes, especially in more magnification, the number of finger-like pores and macropores was extended and suppressed, respectively, by incorporating the nanostructured fillers into the PES matrix.Incorporated the hydrophilic exfoliated MoS2 nanosheets into the casting solutions would lead to the high solvent/non-solvent exchange rate, which increases the formation of finger-like pores (Arjmandi, Peyravi et al. 2019). On the other hand, the increased viscosity reduces the solvent/non-solvent exchange rate (Arjmandi, Pourafshari Chenar et al. 2020). As a result, incorporating the MoS2 nanosheets into the polymer matrix will not affect the thickness significantly. The result of the EDX analysis performed on the PES/MoS2 membrane is also depicted in the same figure. Accordingly, the presence of the MoS2 nanoparticles is verified as the participating elements are detectable in the EDX spectrum (Budania, Baine et al. 2017).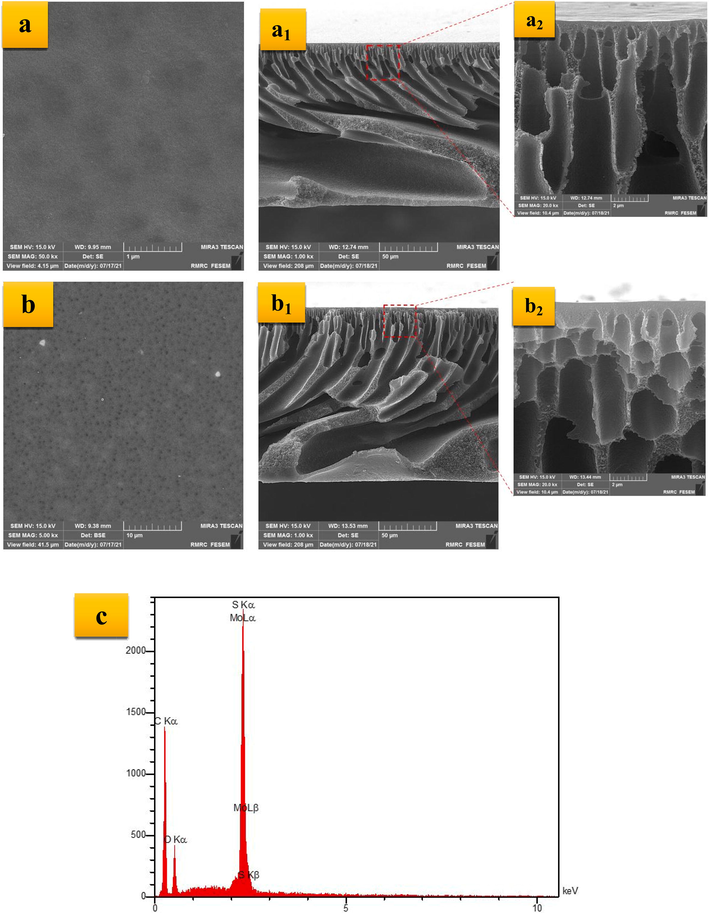
Top-surface and cross-section FESEM images of the PES (a: 1 µm, a1: 50 µm, a2: 2 µm) and PES/MoS2 (b: 10 µm, b1: 50 µm, b2: 2 µm) membrane and EDX analysis of the PES/MoS2 membrane (c).
The hydrophilicity of the membrane surface is a dominant factor that affects the membrane performance in terms of antifouling, permeation flux, and etc. (Miao, Wei et al. 2020).The surface water CA is a good factor to investigate the level of hydrophilicity of any surfaces. This value is the range of 0-180° and the surface hydrophilicity decreases by going from 0° (superhydrophilic) to 180° (superhydrophobic). The surface CA of the fabricated membranes in this study was measured and the graphical and numerical results are illustrated in Fig. 4. According to the results, the water CA of the PES/MoS2 membrane is relatively smaller than the neat PES membrane, which implies the more hydrophilicity of the modified membrane. This behavior of the MoS2-embedded membrane can be attributed to the presence of hydroxyl and sulfate functional groups generated during the ultrasonic process, on the exfoliated MoS2 nanosheets (Das, Tama et al. 2019). The generated functional groups can increase wettability and hydrophilicity of the PES membrane through forming robust intermolecular forces with water molecules. Notably, the hydroxyl functional groups generated during the ultrasonic process play the key role in increasing the surface hydrophilicity through forming hydrogen bonds with water molecules.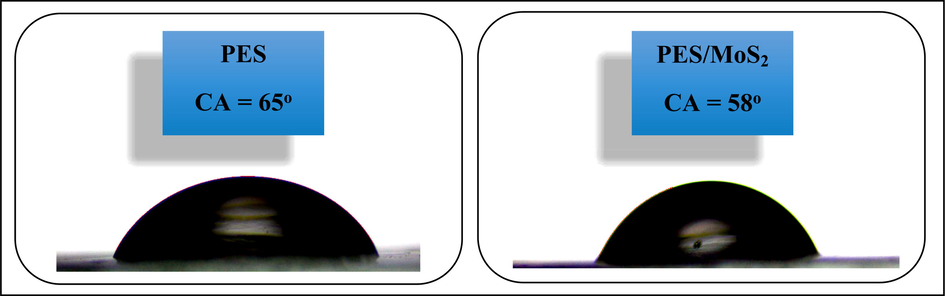
Graphical and numerical results of the CA measurement of the PES and PES/MoS2 membranes.
Figure 5 illustrates the normalized permeate flux of both the bare PES membrane and the modified membrane incorporating MoS2. In the early of filtration, a flux decline as a regular phenomenon due to the membrane compaction was observed for both membranes. In this point of view, after 20 min of filtration, the flux of the bare membrane and the nanocomposite membrane decreased to 68% and 79% of their initial values, respectively. The significantly lower decline in flux for the nanocomposite membrane compared to the bare membrane indicates the improved antifouling properties achieved by incorporating the optimal hydrophilic exfoliated MoS2 content into the PES membrane matrix. However, for the modified membrane, the rate of flux decline was equal to zero during the filtration which it shows the appropriate lifetime and performance in terms of the membrane fouling (Alpatova, Kim et al. 2014).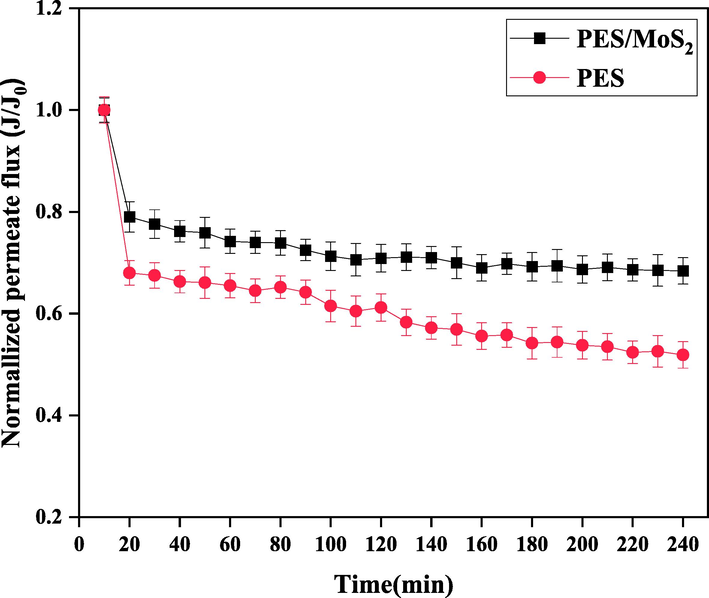
Normalized permeate flux of the pulp and paper wastewater using the PES and PES/MoS2 membrane.
The average pore size of the fabricated membranes was comprehensively examined through AFM analysis. Fig. 6 illustrates both the three-dimensional and two-dimensional AFM images, as well as the pore size distribution of the PES and PES/MoS2 membranes. It is evident from the results that the incorporation of MoS2 nanosheets into the PES membrane matrix led to an enhancement in the average surface roughness, as presented in Table 3. This increase in roughness is beneficial as it provides a larger effective filtration area, consequently resulting in an improved membrane flux (Peyravi, Rahimpour et al. 2012). Moreover, the introduction of MoS2 nanosheets in the PES/MoS2 membrane contributed to an enhancement in the average pore size (Table 3), facilitating the passage of water molecules through the membrane. Additionally, the high water flux observed in the PES/MoS2 membrane can be attributed to the presence of well expanded pores with a fingerlike morphology in the nanocomposite membrane's cross-section.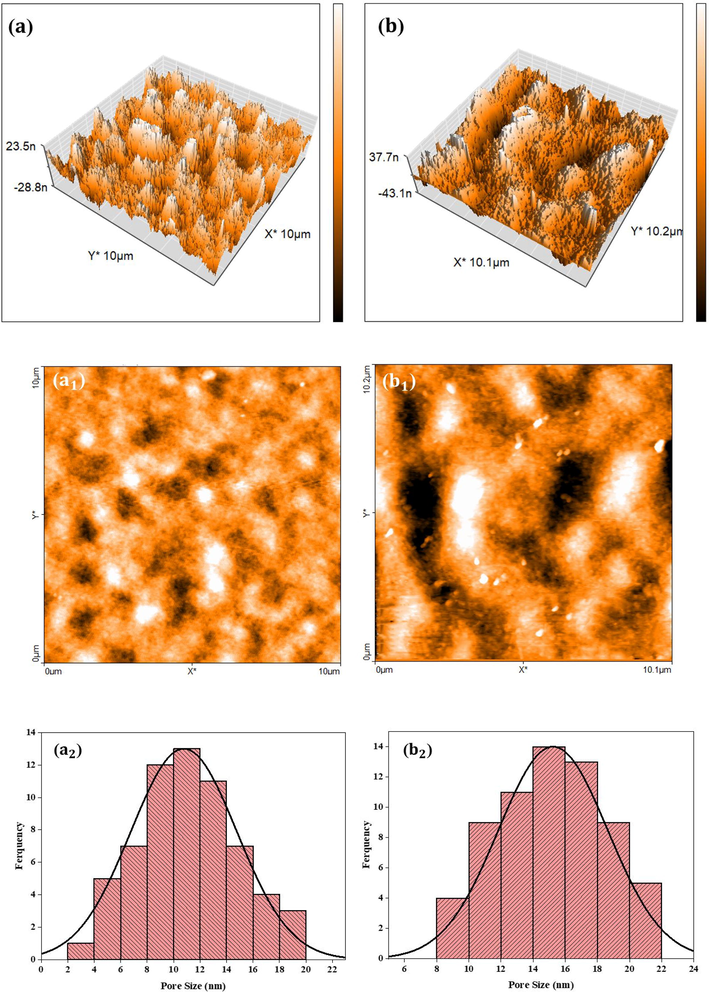
The three-dimensional AFM images of PES and PES/MoS2 membranes (a, b), the two-dimensional AFM images of PES and PES/MoS2 membranes (a1, b1), pore size distribution of PES and PES/MoS2 membranes (a2, b2).
Membrane
Average Pore Size (nm)
Roughness
Sa (nm)
Sq (nm)
Sz (nm)
PES
11
7.39
9.49
74.5
PES/MoS2
15
10.74
14.11
157.97
3.2 Performance evaluation
3.2.1 Activated sludge/adsorption hybrid system
Proper and principled setting up of biological systems is of great importance for increasing the treatment efficiency during operation. In order to study the treatability of the paper mill effluent using the SMABR system, aerobic microorganisms must first get acclimated to the effluent. For this purpose, the sludge returned from the aerobic treatment unit of Baboltoyoor slaughterhouse was first transferred to the laboratory. The number of suspended solids in the sludge was approximately 3600 ppm and filled half of the 20 L bioreactor. The bioreactors were then fed by glucose solution for the cultivation of microorganisms. The adaptation process lasted for 28 days, during which time the COD removal rate and MLSS concentration were measured daily. As shown in Fig. 7, the rate of COD removal increased up to 50%. Also, from day 26 onwards, this rate did not change much, which indicates the compatibility and adaptation of activated sludge with the effluent. Also, during the acclimation process, the MLSS reached a concentration of 5000 mg/L.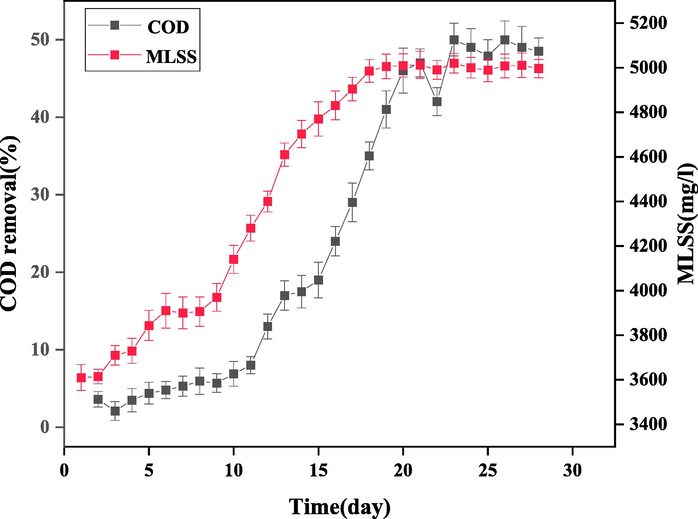
The COD removal rate and MLSS concentration during 28 days of acclimation.
In order to determine the optimal hydraulic retention time (HRT), the effluent treatment of the paper mill was investigated using aerobic activated sludge process at HRTs of 12, 18 and 24 h in reactors R1, R2, and R3, respectively. Fig. 8 shows the COD removal efficiency at different retention times. As can be seen, the rate of COD removal decreases by increasing HRT from 18 to 24 h. By considering the results depicted in Fig. 6 along with the concentrations of MLSS in this period (showed in Fig 9.), we can see that increasing HRT to 24 h causes microorganisms to die and thus reduces the efficiency of the process. The highest rate of COD removal and the highest concentration of MLSS were obtained in HRT = 18 h, which were 48% and 6640 mg/L, respectively. Also, the mentioned values for HRTs 12 and 24 h were 28%, 39%, 5840 mg/L, and 6230 mg/L, respectively. Therefore, HRT of 18 h was chosen as the optimal retention time for effluent treatment of the paper mill.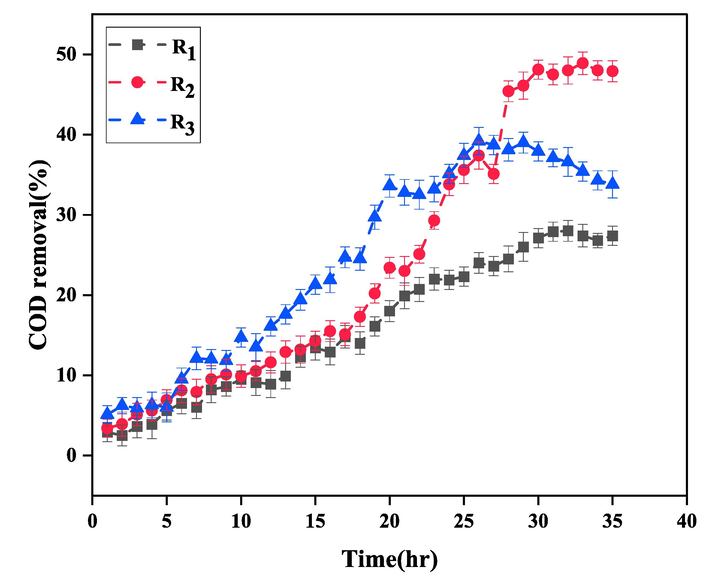
The COD removal efficiency at different HRTs: R1=12, R2=18, and R3=24 h.
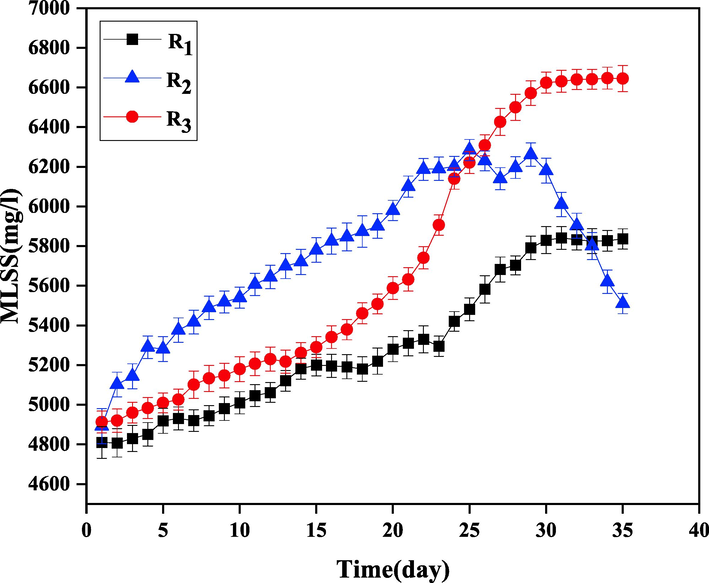
The MLSS concentration at different HRTs: R1=12, R2=18, and R3=24 h.
In order to determine the optimum F/M ratio, COD removal efficiency was plotted versus F/M for different values of HRT (bioreactors R1, R2, and R3), which is shown in Fig. 10. High F/M ratio provides microorganisms with high driving force and comes with high conversion rate of organic components. Yet, excessive increase in F/M ratio may upset the balance of the hydrolysis process and microbial ecology, as well as reduce the efficiency of the process, resulting in sludge mass dispersion and reduced quality. Low values of F/M ratio led to the increased efficiency of COD removal, clotting of microbial biomass, and subsequently increased sludge settlement in bioreactors. According to the previous reports, the best value of F/M ratio is in the range of 0.4–0.5 (Wu, Zhang et al. 2018). In this study, the maximum COD removal was achieved at F/M = 0.451 and HRT = 18 h (the optimum value of HRT determined previously), which is selected as the optimum value and is in accordance with the previous reports.(See Fig 11).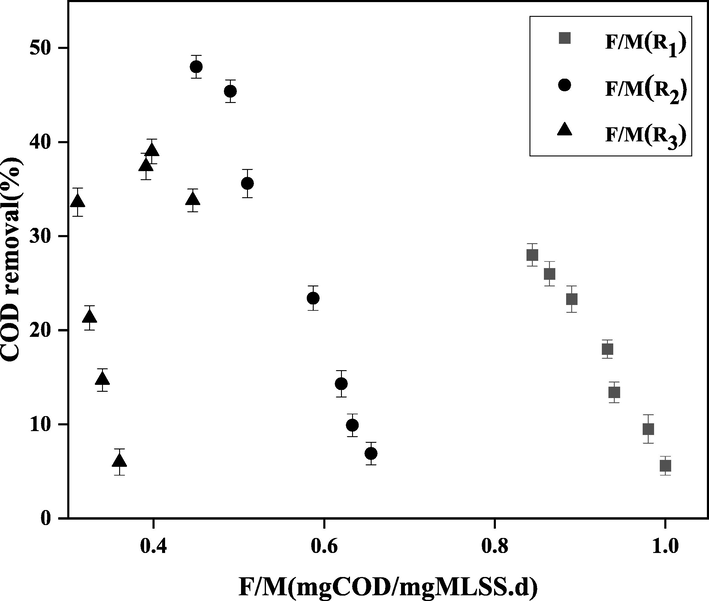
The COD removal efficiency versus F/M for different values of HRT (bioreactors R1, R2, and R3).
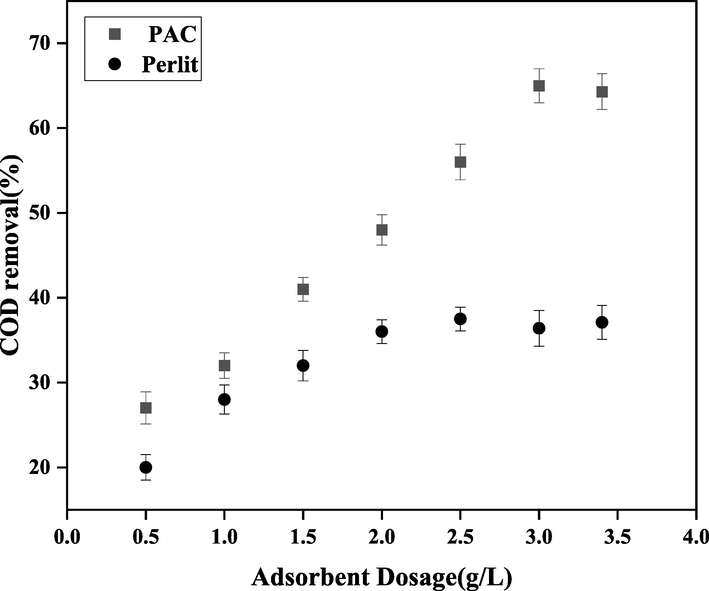
The COD removal efficiency versus different values of adsorbent dosage, for the perlite and PAC adsorbents.
The final step in this section is to determine the optimum amount of adsorbent dosage. To aim this goal, COD removal was plotted versus different amounts of the PAC and perlite adsorbents. The values of HRT and F/M were adjusted at their optimum values obtained previously. As can be seen in Fig. 9, COD removal was increased from 27 and 20% to the maximum values of 65 and 37% upon increasing the loading percentage from 0.5 to 3.5 g/L for the PAC and perlite, respectively. According to the results, the highest COD removal was achieved using the PAC adsorbent at the loading percentage of 3.0 g/L, which are selected as the optimum adsorbent and adsorbent dosage.
3.2.2 The submerged membrane adsorption bioreactor (SMABR) system
In the previous sections, the biological process along with the adsorption were investigated for the treatment of paper mill effluent. In the biological adsorption section, the reactor containing PAC adsorbent had the highest COD removal efficiency. In this section, by submerging the fabricated PES and PES/MoS2 membranes in the bioreactor, the combined process of the membrane bioreactor (MBR) with adsorption is also investigated (SMABR system). At this stage, by entering the membrane module in the bioreactor running with the optimum values of HRT (18 h), F/M (0.451), adsorbent type (PAC), and adsorbent dosage (3.0 g/L) determined earlier, the performance of the effluent treatment in the SMABR system was investigated. To have a comprehensive understanding on the effect of the modification approaches conducted in this system, four different systems were considered; (1) MBR system using the pristine PES membrane (MBR), (2) MBR system using the modified PES/MoS2 membrane (MBR(MoS2)), (3) SMABR system using the pristine PES membrane and PAC adsorbent (SMABR), and (4) SMABR system using the modified PES/MoS2 membrane and PAC adsorbent (SMABR(MoS2)). Also, 10 days of retention time was considered for the sludge during 72 days. During the treatment process in each system, the values of COD removal rate, MLSS, membrane permeation flux, dissolved oxygen content, and pH of bioreactors were measured daily.
In Fig. 12 and 13, COD removal and MLSS values were plotted versus time for all the four treatment systems, respectively. As shown in Fig. 12, SMABR(MoS2) treatment system had the highest removal rate with 96% COD removal. Also, the concentration of MLSS (Fig. 13) in this bioreactor was increased to 15620 mg/L. The rate of oxidation reaction of organic compounds in the activated sludge process is directly proportional to the MLSS concentration and increases with increasing biomass concentration. However, the increase in MLSS concentration is affected by the physical factors of sludge, effluent, and microorganisms as well as the presence of adsorbent. By increasing the biomass concentration, the oxygen transfer phenomenon decreases and reduces the efficiency of the treatment process. Increasing the sludge concentration also increases the viscosity of the mixture inside the bioreactor, which increases the energy required to suck the flow with the vacuum pump (Budania, Baine et al. 2017, Arjmandi, Pourafshari Chenar et al. 2020, Miao, Wei et al. 2020). At those points, a decrease in MLSS concentration reduced the COD removal efficiency. One of the main reasons for the increase in COD removal and MLSS in the SMABR(MoS2) system compared to other bioreactors is the simultaneous presence of PAC adsorbent and modified PES/MoS2 membrane. PES/MoS2 membrane, due to being more hydrophilic and porous than the pristine membrane, in addition to provide more water permeation flux, also increases its quality. On the other hand, the presence of PAC adsorbent in the membrane bioreactor can increase the membrane fouling, which is probably the reason for the increment of the MLSS concentration. It is worth mentioning that the highest rate of COD removal and MLSS concentration in MBR, MBR(MoS2), and SMABR reactors are 73%, 80%, 84% and 9840 mg/L, 12670 mg/L, and 14100 mg/L, respectively.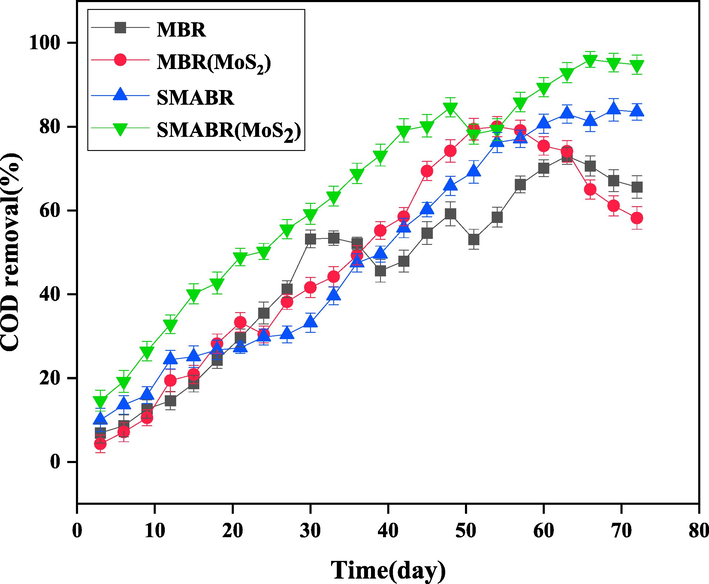
The COD removal efficiency during 72 days for all the systems: MBR, MBR(MoS2), SMABR, and SMABR(MoS2).
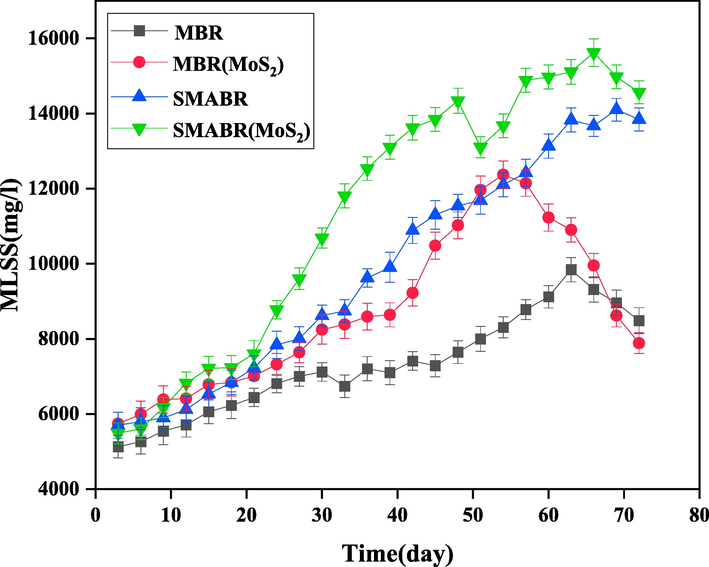
The MLSS concentration during 72 days for all the systems: MBR, MBR(MoS2), SMABR, and SMABR(MoS2).
In aerobic biological treatment processes, the oxygen demand is usually supplied by submerged intake aerators or surface aerators. In the diffused aeration process, air bubbles enter the liquid inside the tank and in the surface aeration method, liquid droplets are dispersed in space and oxygen is transferred into the droplets. In this research, bioreactors are equipped with four cubic air diffusers and a circular air diffuser that was installed at the bottom of the membrane. A circular diffuser is used to clean the membrane, which prevents air from blowing. Accumulation of deposited material on the surface of the membrane is significantly reduced, thus reducing the membrane fouling. To maintain proper aerobic conditions for the growth of microorganisms in bioreactors, air was continuously supplied during the operation period and dissolved oxygen was measured continuously and regularly using a portable dissolved oxygen (DO) meter. Fig. 14 shows the amount of DO in the bioreactor during different operation days. DO in the bioreactor at the lowest and highest values during operation is 2.12 and 3.88 mg/L, respectively. The level of dissolved oxygen did not decrease to less than 2 mg/L. The reason for the decrease in the amount of DO in the bioreactor was the clogging of the air diffusers that were located in the bottom of the bioreactor container. This deficiency was compensated by increasing the amount of air entering the bioreactor through the valve on the aeration pump. Another reason for the reduced DO of the mixed liquid in the bioreactor was the excessive clogging of the air diffuser cavities due to particle deposition. If DO in the process was too low, the amount of dissolved oxygen in the bioreactor would increase by replacing the air diffusers.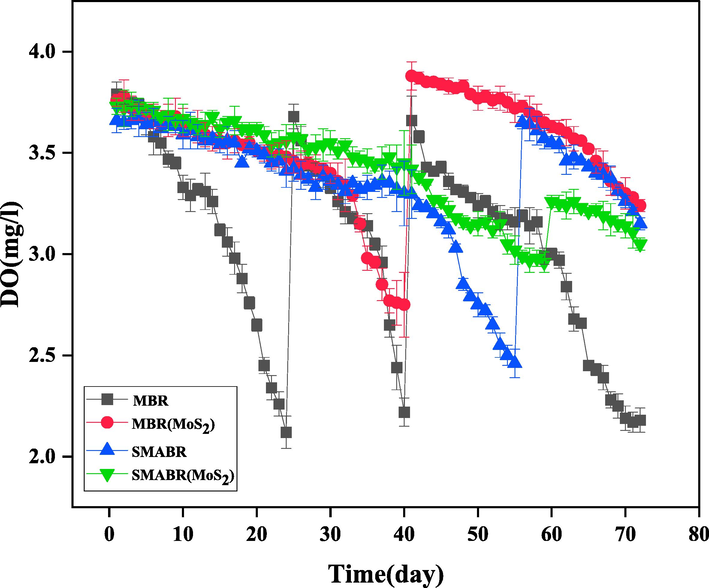
The amount of DO during 72 days for all the systems: MBR, MBR(MoS2), SMABR, and SMABR(MoS2).
According to the contents discussed earlier, the best conditions for microbial growth of most microorganisms are only in dilute solutions with normal pH and temperatures close to ambient temperature. According to the obtained results and measured pHs, the conditions in the bioreactor are suitable for the growth of microorganisms. Fig. 15 shows the changes in the pH of the mixed liquid inside the bioreactor during the treatment period. As shown in the figure, the range of pH of the mixed liquid inside the bioreactor is 6.2 to 7.6. The results show that there are suitable and sufficient conditions for the growth of microorganisms inside the bioreactor. Only on day 45, the pH of the reactor (MBR) decreased significantly, which was gradually compensated by increasing the feed (paper mill effluent) pH entering the bioreactor.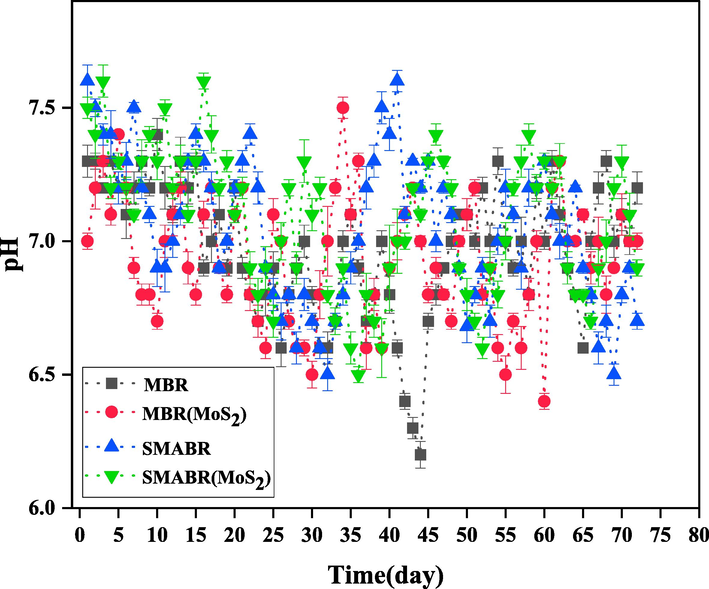
The pH of the mixed liquid inside the bioreactor during 72 days for all the systems: MBR, MBR(MoS2), SMABR, and SMABR(MoS2).
Fig. 16 shows the permeation flux trend of submerged membranes of the bioreactors. As can be seen in the figure, the addition of exfoliated MoS2 nanosheets increases the permeation flux of the membrane due to the increase in membrane hydrophilicity and porosity, so that the permeation flux in the presence of nanoparticles increased to 101 L/m2. h. Also, the effect of the presence of PAC adsorbent on increasing the permeation flux due to the reduction of fouling is quite evident, so that in the presence of PAC adsorbent, the permeation flux from PES/MoS2 membrane increased to 110 L/m2. h. Additionally, to prevent a reduction in system efficiency due to flux reduction both in the presence of PAC (14%) and without PAC (8%), the membranes used were replaced every 10 days.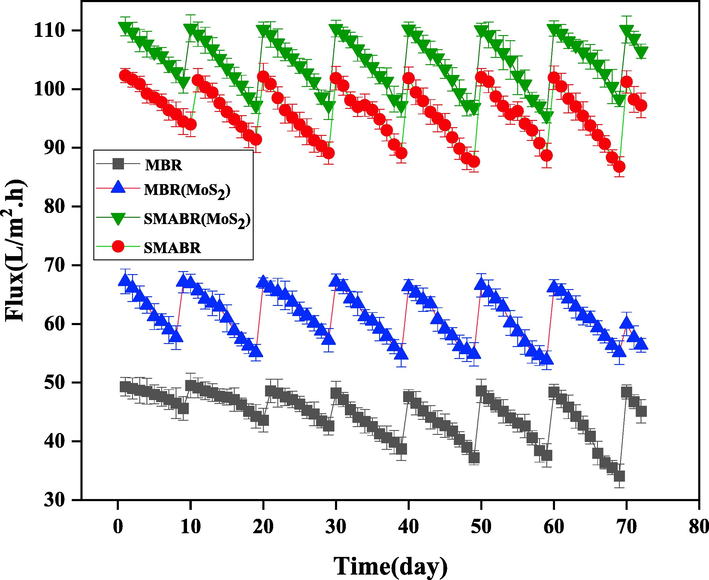
The permeation flux trend of submerged membranes of the bioreactors during 72 days for all the systems: MBR, MBR(MoS2), SMABR, and SMABR(MoS2).
4 Conclusion
In this study, the modified PES/MoS2 membrane was successfully fabricated by incorporating exfoliated MoS2 nanosheets prepared in the laboratory, into the PES matrix. The FESEM images demonstrated the successful exfoliation of MoS2 powder, resulting in the formation of MoS2 nanosheets. These nanosheets were then used as hydrophilic additives to modify PES membranes. The results indicated that the addition of MoS2 nanosheets improved the roughness and average pore size of the PES membranes. Furthermore, the contact angle of the modified membrane decreased compared to the bare membrane, providing evidence of enhanced hydrophilicity in the nanocomposite PES membrane. The PES/MoS2 membrane along with the PAC adsorbent were utilized in the SMABR system for the paper mill effluent treatment. The modified membrane showed higher flux than the bare one. At first, the sludge was acclimated to the effluent for a duration of 28 days, during which the removal of COD and the concentration of MLSS were monitored. Subsequently, the optimal values of F/M, HRT, and adsorbent dosage were individually determined as 0.451, 18 h, and 3 g/L, respectively. These values were selected based on achieving the highest levels of COD removal and MLSS concentration at each stage. In the final stage, the effects of using PES and PES/MoS2 membranes in the MBR and SMABR systems were investigated, both in the presence and absence of the PAC adsorbent. In all configurations, the values of pH and DO were maintained in the normal range (pH: 6.2–6.7, DO>2) in order to provide appropriate conditions for biological treatment. The PES/MoS2 submerged membrane employed in the MBR demonstrated superior performance in comparison to the PES membrane. Additionally, the SMABR system, comprising the PES/MoS2 membrane and PAC adsorbent, attained the highest levels of COD removal (96%), MLSS concentration (15620 mg/L), and membrane permeation flux (110 L/m2.h). Overall, the paper mill effluent treatment was successfully performed in this study using the SMABR system and the proposed methodology and membrane functionalization approach can be a great step toward increasing the treatment efficiency of industrial effluents such as paper mill effluent.
Declaration of Competing Interest
The authors declare that they have no known competing financial interests or personal relationships that could have appeared to influence the work reported in this paper.
References
- High-performance mixed-matrix membranes enabled by organically/inorganic modified montmorillonite for the treatment of hazardous textile wastewater. Chem. Eng. J.. 2021;405:126964
- [CrossRef] [Google Scholar]
- Adane, T., A. T. Adugna and E. Alemayehu (2021). “Textile industry effluent treatment techniques.” Journal of Chemistry 2021: 1-14.https://doi.org/10.1155/2021/5314404.
- Ali, M. E. M., R. Mohammed, S. M. Abdel-Moniem, M. A. El-Liethy and H. S. Ibrahim (2022). “Green MoS2 nanosheets as a promising material for decontamination of hexavalent chromium, pharmaceuticals, and microbial pathogen disinfection: spectroscopic study.” Journal of Nanoparticle Research 24(10): 191.https://doi.org/10.1007/s11051-022-05573-6.
- Treatment of oil sands process-affected water with ceramic ultrafiltration membrane: Effects of operating conditions on membrane performance. Sep. Purif. Technol.. 2014;122:170-182.
- [CrossRef] [Google Scholar]
- Long-term stable metal organic framework (MOF) based mixed matrix membranes for ultrafiltration. J. Membr. Sci.. 2021;635:119339
- [CrossRef] [Google Scholar]
- Development of a novel high-flux PVDF-based ultrafiltration membrane by embedding Mg-Al nanolayered double hydroxide. J. Ind. Eng. Chem.. 2016;41:23-32.
- [CrossRef] [Google Scholar]
- Modification of polyethersulfone ultrafiltration membrane using ultrasonic-assisted functionalized MoS2 for treatment of oil refinery wastewater. Sep. Purif. Technol.. 2020;238:116495
- [CrossRef] [Google Scholar]
- Channelization of water pathway and encapsulation of DS in the SL of the TFC FO membrane as a novel approach for controlling dilutive internal concentration polarization. Environ. Sci. Water Res. Technol.. 2019;5(8):1436-1452.
- [CrossRef] [Google Scholar]
- A new concept of MOF-based PMM by modification of conventional dense film casting method: Significant impact on the performance of FO process. J. Membr. Sci.. 2019;579:253-265.
- [CrossRef] [Google Scholar]
- Exploring the use of cheap natural raw materials to reduce the internal concentration polarization in thin-film composite forward osmosis membranes. Chem. Eng. J.. 2020;398:125483
- [CrossRef] [Google Scholar]
- Physical modification of polymeric support layer for thin film composite forward osmosis membranes by metal–organic framework-based porous matrix membrane strategy. J. Appl. Polym. Sci.. 2020;137(19):48672
- [CrossRef] [Google Scholar]
- Association, A. P. H. and A. W. W. Association (1995). Standard methods for the examination of water and wastewater. Standard methods for the examination of water and wastewater: [1000]-[1000]
- “Long-term stability of mechanically exfoliated MoS2 flakes”. MRS Commun.. 2017;7(4):813-818.
- [CrossRef] [Google Scholar]
- Chaudhry, S. and R. Paliwal (2018). “Techniques for remediation of paper and pulp mill effluents: processes and constraints.” Handbook of environmental materials management 12.
- Facile high-yield synthesis of MoS2 nanosheets with enhanced photocatalytic performance using ultrasound driven exfoliation technique. Mater. Res. Express. 2019;6(12):125079
- [CrossRef] [Google Scholar]
- A review on the mechanism, impacts and control methods of membrane fouling in MBR system. Membranes. 2020;10(2):24.
- [CrossRef] [Google Scholar]
- Pulp and paper mill effluent management. Water Environ. Res.. 2019;91(10):1069-1071.
- [CrossRef] [Google Scholar]
- Advanced treatment of pulp and paper mill wastewater by nanofiltration process: Effects of operating conditions on membrane fouling. Sep. Purif. Technol.. 2011;76(3):292-302.
- [CrossRef] [Google Scholar]
- Comparison of the performance of submerged membrane bioreactor (SMBR) and submerged membrane adsorption bioreactor (SMABR) Bioresour. Technol.. 2008;99(5):1012-1017.
- [CrossRef] [Google Scholar]
- Haq, I. and A. Raj (2020). Pulp and Paper Mill Wastewater: Ecotoxicological Effects and Bioremediation Approaches for Environmental Safety. Bioremediation of Industrial Waste for Environmental Safety, Springer: 333-356.https://doi.org/10.1007/978-981-13-3426-9_14.
- Hierarchical nanostructures as novel antifouling agents in nanofiltration process. Desalination. 2015;375:116-120.
- [CrossRef] [Google Scholar]
- Submerged membrane adsorption bioreactor as a pretreatment in seawater desalination for biofouling control. Bioresour. Technol.. 2013;141:57-64.
- [CrossRef] [Google Scholar]
- Review on recent developments on pulp and paper mill wastewater treatment. Ecotoxicol. Environ. Saf.. 2015;114:326-342.
- [CrossRef] [Google Scholar]
- Fouling reduction in MBR-RO processes: the effect of MBR F/M ratio. Desalin. Water Treat.. 2013;51(25–27):4829-4838.
- [CrossRef] [Google Scholar]
- Molybdenum disulfide quantum dots prepared by bipolar-electrode electrochemical scissoring. Nanomaterials. 2019;9(6):906
- [CrossRef] [Google Scholar]
- Zwitterionic functionalized MoS2 nanosheets for a novel composite membrane with effective salt/dye separation performance. J. Membr. Sci.. 2019;573:270-279.
- [CrossRef] [Google Scholar]
- Lima, É. C., M. H. Dehghani, A. Guleria, F. Sher, R. R. Karri, G. L. Dotto and H. N. Tran (2021). Adsorption: Fundamental aspects and applications of adsorption for effluent treatment. Green Technologies for the Defluoridation of Water, Elsevier: 41-88.https://doi.org/10.1016/B978-0-323-85768-0.00004-X.
- Understanding the exfoliation and dispersion of MoS2 nanosheets in pure water. J. Colloid Interface Sci.. 2018;517:204-212.
- [CrossRef] [Google Scholar]
- Influence of membrane hydrophilicity on water permeability: An experimental study bridging simulations. J. Membr. Sci.. 2020;604:118087
- [CrossRef] [Google Scholar]
- “A critical review on nanomaterials membrane bioreactor (NMs-MBR) for wastewater treatment”. NPJ Clean. Water. 2020;3(1):43.
- [CrossRef] [Google Scholar]
- Tailoring the surface properties of PES ultrafiltration membranes to reduce the fouling resistance using synthesized hydrophilic copolymer. Microporous Mesoporous Mater.. 2012;160:114-125.
- [CrossRef] [Google Scholar]
- Old landfill leachate treatment through multistage process: membrane adsorption bioreactor and nanofitration. Bioprocess Biosyst. Eng.. 2016;39:1803-1816.
- [CrossRef] [Google Scholar]
- Mixed matrix membranes for water purification applications. Sep. Purif. Rev.. 2017;46(1):62-80.
- [CrossRef] [Google Scholar]
- Ren, L., G. Zhang, Z. Yan, L. Kang, H. Xu, F. Shi, Z. Lei and Z.-H. Liu (2015). “Three-dimensional tubular MoS2/PANI hybrid electrode for high rate performance supercapacitor.” ACS applied materials & interfaces 7(51): 28294-28302.https://doi.org/10.1021/acsami.5b08474
- The treatment of pulp and paper mill effluent: a review. Bioresour. Technol.. 2001;77(3):275-286.
- [CrossRef] [Google Scholar]
- Wang, S. and J. Wang (2018). “Degradation of emerging contaminants by acclimated activated sludge.” Environmental technology 39(15): 1985-1993.https://doi.org/10.1080/09593330.2017.1345989.
- Gravity-driven membrane system for secondary wastewater effluent treatment: Filtration performance and fouling characterization. Sep. Purif. Technol.. 2017;184:26-33.
- [CrossRef] [Google Scholar]
- Optimization of F/M ratio for stability of aerobic granular process via quantitative sludge discharge. Bioresour. Technol.. 2018;252:150-156.
- [CrossRef] [Google Scholar]
- Current state and challenges of full-scale membrane bioreactor applications: A critical review. Bioresour. Technol.. 2019;271:473-481.
- [CrossRef] [Google Scholar]
- Design and annual operation of full scale landfill leachate plant in Iran: focus on multistage membrane technology. Chem. Pap.. 2022;76(7):4509-4521.
- [CrossRef] [Google Scholar]
- Simple and cost-effective measures for the improvement of paper mill effluent treatment–A case study. J. Clean. Prod.. 2011;19(6–7):764-774.
- [CrossRef] [Google Scholar]


