

Translate this page into:
A new multi-scale pore transport capacity model considering elliptical shape and retention effect of unequal-thickness water films
⁎Corresponding authors. 490260359@qq.com (Ke Wang), lyupc1@126.com (Yi Lou)
-
Received: ,
Accepted: ,
This article was originally published by Elsevier and was migrated to Scientific Scholar after the change of Publisher.
Peer review under responsibility of King Saud University.
Abstract
Most of current permeability evaluation models for shale gas reservoirs ignore the influence of imbibition during fracturing, moreover, several of the considerations are different from real conditions, for example, shale pore shape is circular and water film is with equal thickness, which is convenient for calculation but adverse to evaluation accuracy. In the study, shale pore shapes are closer to ellipse by statistically analyzing the scanning electron microscopy results, the thickness of water film is not equal on elliptical pore surface but related to the curvature. Based on these new insights, a quantitative model for determining the unequal thickness of water film was established, and then a new multi-scale elliptical pore permeability model, considering non-equal-thickness water film, wall roughness, stress sensibility, and retention effect, was established based on the multi-scale flow weighting theory. The prediction results of this permeability model are similar to the test results, and are more accurate than that of the previous models. Finally, factors analysis showed that the effect of roughness on permeability was small, but the negative impact of water film and stress sensitivity on permeability was significant.
Keywords
Shale
Elliptical pore
Permeability
Non-equal-thickness water film
Roughness
Stress sensitivity

1 Introduction
Shale gas reservoirs are extremely dense and must be drilled horizontally and hydraulically fractured on a large scale before commercial gas streams can be formed (Guo et al., 2021). During the process of fracture modification, the reservoir matrix pores within the near-fracture region are affected by the pressurized and percolated fracturing fluid (Fig. 1). The effects include changes in the in-situ gas–water distribution pattern, an increase in the water saturation within the pores, and changes in the effective permeability of the pores (Lou et al., 2022; Bai et al., 2022). As the near-fracture region is the pathway for fluids to enter the hydraulic fractures within the reservoir matrix system, the parameters within the zone influenced by imbibition are crucial for the evaluating reservoir capacity, especially pore permeability, which has been considered the most critical parameter by many researchers during the development of the petroleum industry. However, accurately assessing the permeability of shale reservoirs remains a significant challenge in the oil and gas industry. First, shale permeability testing experiments are complex and error-prone. Second, there are many factors that affect permeability, including pore shape, roughness, tortuosity, stress sensitivity, pore micro-scale effects, and fluid factors (Shen et al., 2023; Song et al., 2021). In addition, there is a significant difference between the in-situ reservoir permeability and the reservoir permeability after the influence of imbibition. Therefore, it is essential to establish a more reasonable and accurate reservoir permeability assessment model that will be of great significance to the development of the oil and gas industry.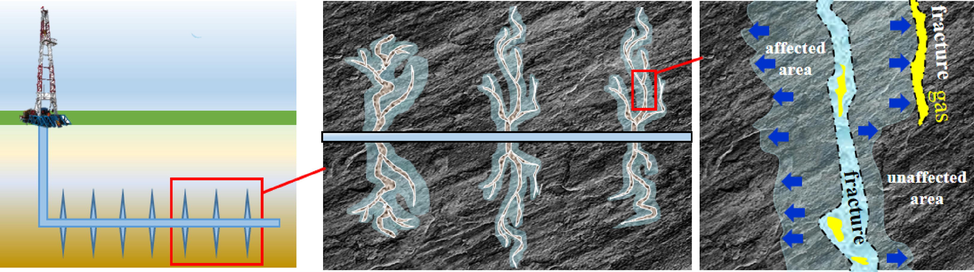
The unaffected area and affected area by fracturing fluid imbibition in the stimulated shale gas well.
Pore structure has the most apparent influence on permeability in shale reservoirs. First, the permeability of shale gas reservoirs has multiscale characteristics due to the different scale pores. Shale is a typical multi-scale porous medium, the pores can be divided into millimeter-scale pores, micron-scale pores, and nanoscale pores according to the pore size (Zou et al., 2011). Nanoscale pores can be further divided (Zhang et al., 2014) into micropores with sizes < 2 nm, mesopores with sizes in the range of 2–50 nm, macropores with sizes > 50 nm. Based on the Knudsen number, that is the ratio of molecular mean free path to pore diameter, the transport characteristics of gas is classified into the following types: continuous flow (Kn < 0.001), slip flow (0.001 < Kn < 0.1), transition flow (0.1 < Kn < 10), and Knudsen diffusion (Kn > 10). Continuous flow, namely Darcy flow, is the flow type that the flow velocity of molecules at the pore wall is zero. Slip flow is the flow type that the flow velocity of molecules at the pore wall is not zero, it is the result that the intermolecular collisions are far more frequent than the collisions between molecules and the pore wall. Knudsen diffusion is the flow type that the intermolecular collisions can be neglected, in other words, the collisions between molecules and the pore wall are dominated. Transition flow is the transitional type that the intermolecular collisions and the collisions between molecules and the pore wall are both important. Second, shale permeability is related to the pore shape. Pore shape is set to be circular, and fracture shape is set to be plate-like, in most previous studies, which simplifies the model calculation to some extent but reduces the evaluation accuracy because pore shale is not usually circular in the actual situations. Sun et al. (2016) found that the pore shape of the Longmaxi formation shale in the Sichuan Basin is elliptical primarily according to argon ion polishing field emission scanning electron microscopy (SEM). Xue et al. (2015) studied the pores of the Longmaxi formation shale in Northwest Guizhou Province, and found the matrix pores are primarily elliptical and linear, by analyzing the adsorption and desorption curves. In addition, permeability is also significantly affected by stress sensitivity. Fernandes et al. (2023) considered the stress-sensitive effect on permeability and monitored its role in the permeability change to enhance oil recovery. Chang et al. (2022) analyzed the effects of the stress loading methods, cyclic loading, and loading rates on reservoir permeability with tight rock samples from Ordos Basin, they found that tight reservoirs are sensitive to stress changes, and their permeability are decreased significantly with the increase in loading time. Finally, the roughness and tortuosity of the pore also have a certain influence on permeability. Zhao et al. (2021) studied the effect of roughness, pore size, and pressure on the flow of tight gas based on the fitting of a large number of simulation data, the results showed that the mass flow of gas is decreased by the greater roughness of pore wall. Wang et al. (2020) simplified the shale fracture network to a tortuous binary tree fracture network to study the permeability model, they found that the permeability is negatively correlated with the fractal dimension and the tortuosity. Wang et al. (2022) found that the permeability is still quite different even if the porous medias have the same or similar porosity and pore throat distribution characteristics, mainly because of the complexity and inconsistency of the pore throat structure, and it was observed that the smaller the curvature of the fluid channel space, the greater the permeability naturally.
Water film is another critical factor that affects shale permeability (James et al., 2018). Generally, the influence of water on pore permeability is limited due to the low original water saturation of gas-rich shale gas reservoirs, however, it will be increased significantly because the water saturation in the imbibition affected area of simulated reservoir is surged after fracturing.
Zhu et al. (2022) experimentally found that the spontaneous imbibition in shale is mainly in microporous, the permeability is increased significantly when the pores encounter water due to the newly generated microcracks by the interaction of water and clay, but it is gradually decreased as the water saturation is increased. The main reason is that the effect of water blocking is stronger than the effect of newly generated microcracks. Water film is formed to occupy part of the seepage channel and then reduces the seepage channel's radius when water enters the pores. Further increase in water saturation will make the water film thicker, thus the gas seepage resistance will become more prominent (Zhang et al., 2019). Li et al. (2015) quantified the water saturation of reservoir pores based on thermodynamic equilibrium theory, and established a permeability curve under different water saturations considering the influence of water saturation on gas flow. However, this was only established with uniform round tubes. Tian et al. (2020) simulated the trap formation process by measuring the changes in gas permeability and determining the thickness of the water film combined with empirical formulas before and after the trapping of tight gas reservoirs, and then monitored the change in permeability by core experiments. However, they did not consider the pore type. Shi et al. (2013) studied the pore size distribution and water distribution in shale matrix, and proposed a new gas transport model considering the organic matter content effect, and quantified the range of Knudsen number. Due to the presence of water film in the pores, the gas transport mechanism was controlled by the gas–water two-phase. Li et al. (2020) studied the circular nanoporous flow model with the presence of water films, and analyzed the influence of connected pores, pore size and slippage effects. Sun et al. (2019) established an elliptical nanopore transport model based on the superposition of continuous flow and Knudsen diffusion, a static water film was considered in the apparent permeability model, but its thickness was set to be equal. Actually, water film in the circular pores can be considered as equal but that in the oval pores was not with equal thickness, the main reason is that different curvatures in elliptical pores have different thickness of water film. Tokunaga et al. (1997) found that the surface of pores had uneven film thickness in different pores through two proposed crack distribution models, because the actual pores are heterogeneous with different minerals and curvatures that affect the adsorption forces on water.
Although previous studies have achieved good progress in apparent shale permeability through experiments and theories, most of them were conducted under ideal conditions. First, the circular shape for shale pore is convenient for permeability calculation but adverse to evaluation accuracy. For example, circular pore can be regarded as a special case of elliptical pore, and fracture can be considered as elliptical pore with a large gap between the long and short axes. Second, the assumption of equal thickness of the water film in elliptical pores is also inconsistent with the actual situation. Most models considered incomplete factors and could not reflect the law of gas transport in natural reservoirs, actually the apparent shale permeability is related to the pore structure, imbibition, and transport mechanism. This study found that most of the pores are elliptical by analyzing the scanning electron microscopy results of several blocks. The water film inside the elliptical pores after the influence of fracturing fluid imbibition was found to be with unequal thickness according to the theory of mechanical and thermodynamic conservation. Finally, dynamic evolutionary permeability models in the unaffected area and the imbibition-affected area were both established according to the method of weight coefficient, the former model considers the effect of surface diffusion, Knudsen diffusion, and viscous flow, the later model considers the effects of retained water film with unequal thickness, pore wall roughness, and stress sensitivity. The prediction results of the models were more accurate to the actual experimental results when compared with the previous model results. It was found that the effect of roughness on pore permeability was small, but the negative impact of water film and stress sensitivity on permeability was more significant. The structure of this paper is as follows: Section 2 presented the statistics of pore shapes in the targeted block and the quantified model of water film with unequal thickness in elliptical pores; Section 3 showed the permeability models of elliptical pores in the unaffected area and the imbibition - affected area; and Section 4 showed the validation and comparison of the proposed model and traditional models.
2 Quantification model of water film thickness within elliptical pore space
2.1 Shale pore shape investigation
To analyze the shape of shale pores clearly, field-emission scanning electron microscopy images of downhole cores from different blocks were selected, as shown in Fig. 2, where Fig. 2a-d and f-h are the images of downhole shale core from the Weiyuan Block, Fig. 2e is the image of downhole shale core from the Luzhou Block (Deng et al., 2022), Fig. 2i is the image of the Qingshankou mud shale from the Songliao Block (Zhao et al., 2022), and Fig. 2j-l are the images of Ordovician Utica shale from Quebec, Canada (Bai et al., 2016, Ardakani et al., 2018).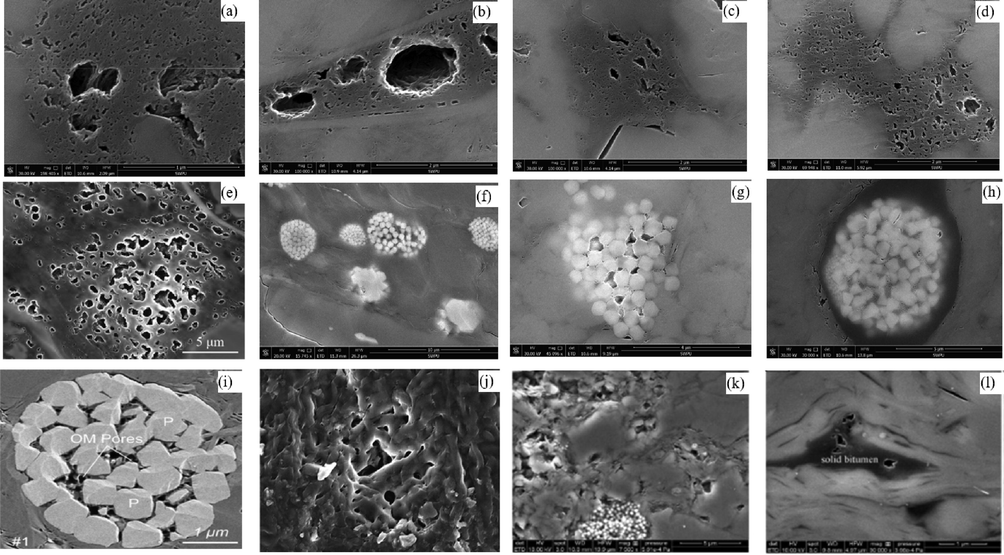
Field emission SEM images. (Figs. a-d and f-h are the images of downhole shale from the Weiyuan Block, Fig. e is the image of downhole shale from the Luzhou Block (Deng et al., 2022), Fig. i is the image of the Qingshankou mud shale from the Songliao Block (Zhao et al., 2022), and Figs. j-l are the images of the Ordovician Utica shale from Quebec, Canada (Bai et al., 2016, Ardakani et al., 2018)).
According to the above field emission SEM images, it can be seen that the shapes of shale pores, whether organic or inorganic, are not regular or round, and most of them are elliptical. Therefore, it is better to use elliptical shale pores to evaluate permeability than use round pores. In addition, elliptical pore is more representative; for example, circular pore can be regarded as a special case of elliptical pore, and fracture can be regarded as elliptical pore with a large gap between the long and short axes.
2.2 A new model for quantifying the thickness of water film in elliptical pores
There is a difference in the thickness distribution of the stable water film in the ellipse where the thinnest part is at the apex of the long axis and the thickest part is at the apex of the short axis, due to the different curvatures in elliptical pore. The bulk space besides the water film is another ellipse different with the elliptical pore. The long and short axes of the bulk space differ from that of the skeletal elliptical pores. The reason for this phenomenon is the difference in curvature at different point of the ellipse. The curvature at the apex of the short axis is the largest, and the capillary force is the largest, the curvature at the apex of the long axis is the smallest, and the capillary force is the smallest. Therefore, the thickness of water film is different at different points of the pore.
The schematic diagram of forces is shown in Fig. 3. The long and short-axis half-lengths of the elliptical pore are a0, b0, respectively; OL, OR, and OS are the circle center of the curvature circle for the long-axis apex, any point, and the short-axis apex, respectively; rL, rR, rS are the radius of the curvature circle for the long-axis apex, any point, and the short-axis apex, respectively. The thickness of the water film at long and short axis apex are hL, hS, respectively; П(hL), П(hS) are the adhesion pressure of the water film at the long-axis apex and short-axis apex, respectively.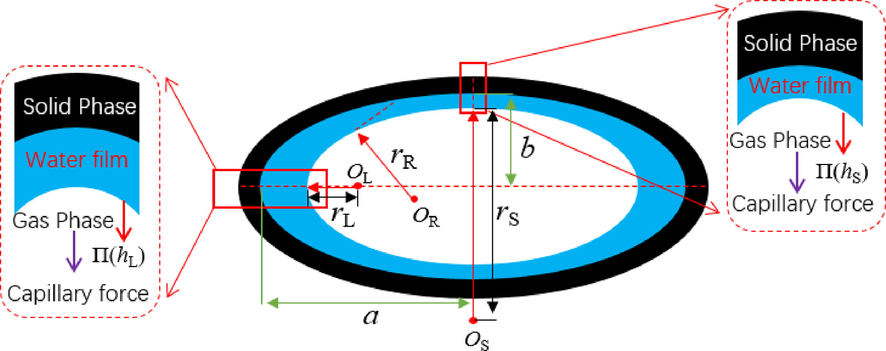
Schematic diagram of the forces for the water film at the inner surface of elliptical pore.
The radius of curvature circle at any point of the ellipse is calculated as follows:
Considering the influence of the adhering water film, the new elliptic radius of curvature circle is
The radius of curvature circle at the vertex of the long axis and the short axis are respectively:
According to the calculation formula of the capillary force for circular pore, the capillary force at any point of the ellipse, the vertex of the long axis, and the vertex of the short axis are respectively:
The capillary force at other areas was bigger than that at the vertex of the long axis and smaller than that at the vertex of the short axis. According to the quantitative model of water film thickness (Appendix A), the forces of the water film at any point has the following mechanical equilibrium relationship:
According to Eq. (9), the equilibrium equation for the forces on the water film at the long-axis vertex and short-axis vertex of the elliptical pores are respectively:
The van der Waals force Пm(hL), electrostatic force Пe(hL) and structural force Пs(hL) on the water film at the vertex of the long axis as well as the van der Waals force Пm(hS), electrostatic force Пe(hS) and structural force Пs(hS) on the water film at the vertex of the short axis are obtained from Eqs. (10), 11 and 12. When a0 = b0, Eqs. (13) and (14) change into Eq. (A-3) for the force acting on the circular pore water film.
3 A new elliptical pore permeability model
3.1 Flow model of elliptical pore in original reservoir
Roughness mainly affects the collision probability between molecules and pore walls; the rougher the wall, the greater the proportion of Knudsen diffusion. Cai (2010) equated the porous surface rough peak as a conical shape, as shown in Fig. 4, and derived the specific area relationship between the porous medium formed by the rough surface particles and the porous medium formed by the smooth surface particles:
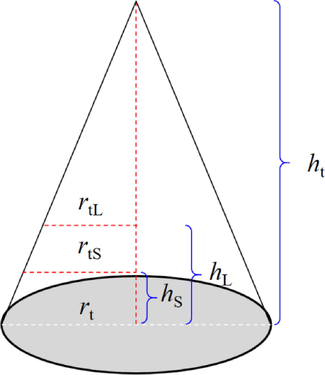
Schematic diagram of rough peak parameters of the inner pore wall (ht, hs, hL are the peak height, the height equivalent to the thickness of water film at the short axis, and the height equivalent to the thickness of water film at the long axis, respectively; rt, rts, rtL are the bottom radius of the dry cone, the bottom radius considering the thickness of hS and hL, respectively).
Assuming that the elliptical pores are distributed horizontally, the long axis is horizontal, and the short axis is vertical. The stress-sensitive damage happens to the short axis of the elliptical pores, and the long axis remains unchanged. Meng et al. (2015) found experimentally that the changes of shale porosity and pressure are both power-exponential, namely:
Subsequently, when the gas pressure decreases during the extraction process, the change in the short semi-axis of the pores is
If the desorption effect of the gas adsorption layer is further considered, the adsorption capacity for real gas is (Zhang et al., 2019):
Based on the adsorption theory of the Langmuir monolayer, gas coverage can be defined as the ratio of adsorption capacity to Langmuir volume (Zhang et al., 2019):
Because the methane molecule is adsorbed in monolayer on the pore surface, the radius of any curvature circle at the effective bulk space in elliptical pore considering the adsorption layer is
Then, the radius of curvature circle at the long semi-axis and short semi-axis, considering the adsorption layer in elliptical pores, are respectively:
The lengths of the long semi-axis and short semi-axis considering the adsorption layer are a0-dm·η and b0- dm·η, respectively. The ratio ξ* of the short and long semi-axes considering the adsorption layer is
The Knudsen number considering the influence of the adsorption layer is
The weight coefficient for elliptical pores considering stress sensitivity, roughness, and adsorption layer can be given by Eq. (25) and Eq. (26):
Simultaneously, the amount of viscous flow and Knudsen diffusion in elliptical pores considering stress sensitivity, roughness, and adsorption layer are respectively:
As shown in Fig. 5, the transport amount of gas in the entire pore ignored the influence of water film is a combination of the surface diffusion amount and the bulk flow amount. The total amount of gas flow in elliptical pore can be summed linearly, then the flow rate of the entire pore is
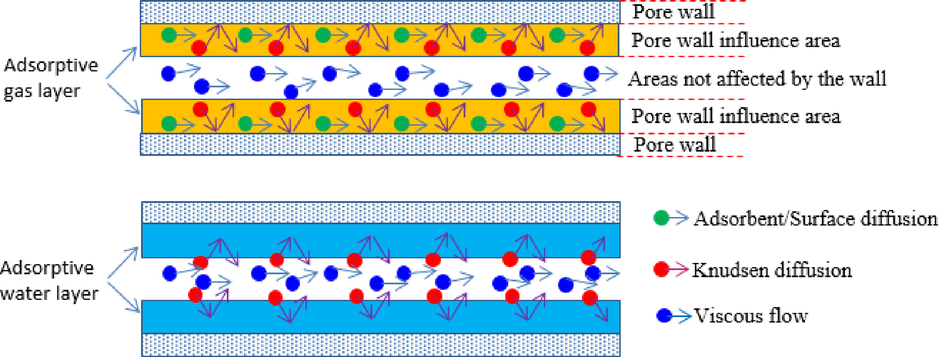
Gas transport mechanism in pores containing adsorbed gas or containing adsorbed aqueous layers.
According to the definition of apparent permeability, the relationship between the total flow mass qp and apparent permeability kpa can be expressed as follows:
Combining Eq. (29) and Eq. (33), the apparent permeability kpa of elliptical pores is
3.2 Flow model of elliptical pore considering the effect of retained water film
Imbibed water will promote the desorption of adsorbed methane. When the imbibed water in affected reservoir is successfully drained, the pore surface will be attached with a water film, thus the imbibition-affected reservoir can ignore the effect of adsorbed gas on flow capacity. As shown in Fig. 3, the lengths of the long and short semi-axes of the elliptical pore become a0-hL and b0-hS, respectively, considering the influence of water film. Then the Knudsen number in elliptical pore considering the water film is
Considering the influence of water film on rough peaks, the ratio of rough peak height to the bottom radius can be concluded according to Fig. 4:
Eq. (37) clearly illustrates that the effect of roughness on the bulk flow in elliptical pores is not affected by water film.
Because the water film is a rigid fluid, pressure-sensitive damage on elliptical pores considering a water film can be expressed:
Assuming that the thickness of water film remains unchanged during the production process, the weight coefficient in elliptical pores, considering the influence of water film and stress sensitivity, is
The viscous flow and Knudsen diffusion in elliptical pores considering a water film and the stress-sensitive influence are respectively as follows:
According to Eqs. 39–42, the transport amount of gas in nanopores is
According to Eq. (33), the apparent permeability of elliptical pores considering the water film, roughness, and stress sensitivity is
4 Model validation and analysis
4.1 Experimental verification
In order to verify the accuracy of the model, namely Eq.44, a stress-sensitive test was conducted with the longmaxi shale from the southwest of Guizhou Province, China. The detailed data is showed in Table 1. The confining pressure is between 3.45 MPa and 20 MPa, permeability is sharply decreased from 0.4524 mD to 0.0048 mD, which illustrated that the shale will be affected seriously by stress sensitivity.
Pe/MPa
ϕ
k/mD
3.45
4.225
0.4525
7
2.294
0.1883
10
1.512
0.0654
13
1.233
0.0229
17
1.070
0.0072
20
1.032
0.0048
The stress sensitivity coefficient was then fitted according to Eq. 16, and it was obtained as shown in Fig. 6. The value of parameter n is the negative value of the slope of the curve, thus n = 0.8531.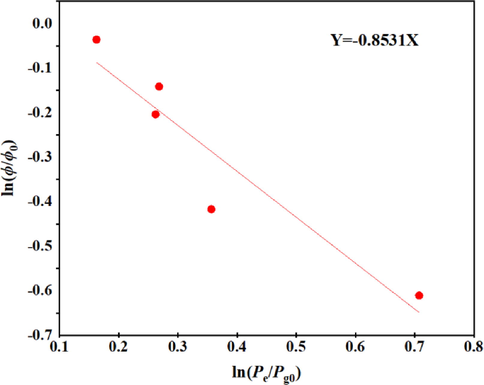
Fitting plot of the stress sensitivity coefficient.
Most of the values in Table 2 are obtained from corresponding experiments with the shale sample that be used in the former stress-sensitive test, several constants are referred from the references, the detained is showed in Table 2. We calculated the model by referencing the parameters in Table 2 and compared the result with the test data.
Parameter and symbol
Value
References
Parameter and symbol
Value
References
Methane molecular size dm, m
3.8E-10
(Wu et al., 2016)
Compression factor Z
1
(Wu et al., 2016)
Initial porosity ϕ0
0.05
This work
Tortuosity τ
4.3
This work
Temperature T, K
293.15
This work
Long semi-axis a0, m
0.0000195
This work
Surface diffusion coefficient Ds, m2/s
0.00000046
(Sun et al., 2019)
Short semi-axis b0, m
0.00000095
This work
Gas constant R, J/(mol·K)
8.314
(Sun et al., 2019)
Water film thickness at the long semi-axis apex hL, m
0.000000005
This work
Gas molar mass M, kg/mol
0.016
(Sun et al., 2019)
Water film thickness at the short semi-axis apex hS, m
0.000000002
This work
Langmuir pressure PL, Pa
1,820,000
This work
Gas Ranz volume qL, m3/kg
0.015
This work
The ratio of gas diffusion area to bulk flow area As-a
0.05
This work
Sample density ρs, g/cm3
2.6
This work
Atmospheric pressure P, Pa
100,000
This work
Scalar methane molar volume Vstd, m3/mol
0.0224
(Sun et al., 2019)
Ideal gas viscosity μ, Pa·s
0.000018
(Tokunage et al., 1997)
The ratio of the rough peak height to the radius of the base ζc
1
This work
As shown in Fig. 7, the model calculation result is consistent with the data trend of the pressure sensitive test, and the permeability is gradually decreased with the increase of effective stress. It is found that the prediction results of the model are similar to the real test data, which proves that the proposed model is accurate in permeability evaluation.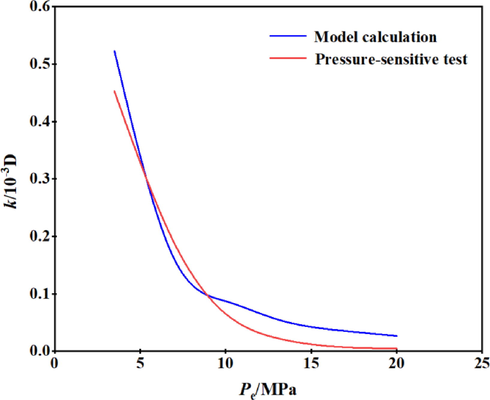
Model validation graph of stress sensitivity.
4.2 Model comparisons
To verify the accuracy of the new model, it was compared with the apparent permeability model of gas flowing in circular pores established by Li et al. (2018) (Li's model) and in elliptical nanopores established by Sun et al. (2019) (Sun's model). Most of the parameters and their values for comparison are shown in Table 2, the different values for some parameters are showed as follows: Pe = 3.4 MPa, a0 = 50 nm, b0 = 10 nm, n = 0.5.
The apparent permeability expressions for Li's and Sun's models are respectively:
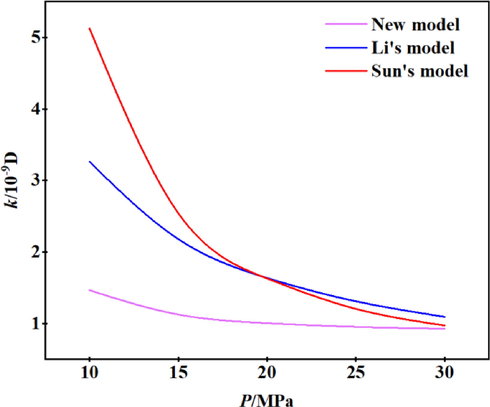
Model comparison of the proposed model, Li's model, and Sun's model.
According to the calculation results, gas reservoir pressure is inversely proportional to the apparent permeability. With the increase of the gas reservoir pressure, the apparent permeability shows a downward trend. Under low-pressure conditions, the apparent permeability of the new model is much lower than that of the other two models, and as the pressure increases, the difference between the apparent permeability of the new model and the remaining two models decreases; however, overall, the apparent permeability of the new model is lower. The reason is that the new model considers the influence of the fracturing fluid forming a water film on the surface of the pores on the apparent permeability during gas recovery, which is closer to the real situation, indicating that the new model is reliable in simulating the transport of nanopore gas.
4.3 Influence of imbibition water on reservoir permeability
By substituting the parameters in Table 2 into Eq. 34 and Eq. 44, the apparent permeability respectively considering the dry and water-bearing conditions can be obtained as shown in Fig. 9.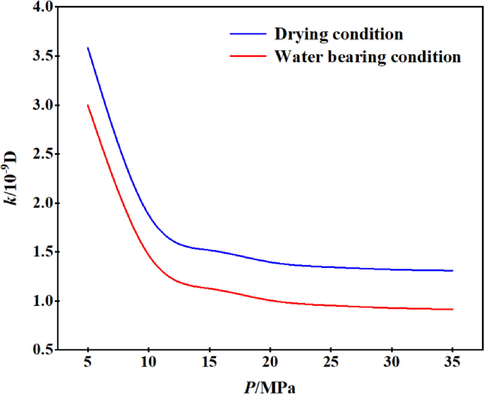
Apparent permeability under dry and watery conditions.
The only variable in this analysis is the water-bearing condition. The apparent permeability under dry condition and water-bearing condition are both decreased with the increase of gas reservoir pressure, and the decreasing trend is approximately the same. However, the permeability under the water-bearing condition is significantly smaller than that under dry condition. The main reason is that the existence of water film on the reservoir pore surface that reduces the effective flow pore size during gas flow process, which in turn leads to a decrease in apparent shale permeability. The apparent permeability is also decreased with an increase in the gas reservoir pressure. When p = 35 MPa, the apparent permeability of the shale matrix is decreased by 69.5%, indicating that retention water film is an essential factor affecting the apparent permeability of the shale matrix.
4.4 Other influencing factors analysis
Gas transport behavior in nano-porous medias such as shale is influenced by stress sensitivity, pore structure, surface roughness, and gas type (Chen et al., 2018); therefore, this section discusses the effects of water film, stress sensitivity, and surface roughness on gas transport.
4.4.1 The effect of unequal-thickness water film on shale permeability
Change the water film thickness at the short semi-axis to be consistent with the water film thickness at the long semi-axis, and then substitute the parameters and values in Table 2 into Eq. 44. Therefore, the apparent permeability considering the unequal thickness of water film and equal thickness of water film is respectively obtained and showed in Fig. 10.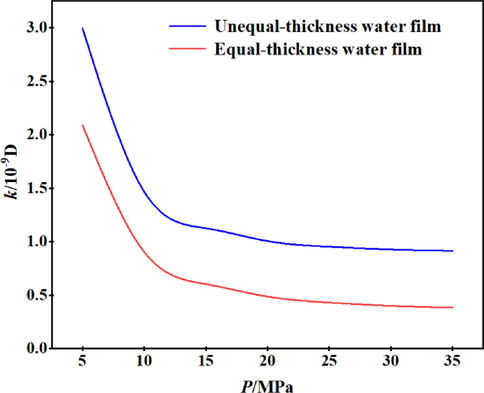
Apparent permeability of equal-thickness water film and unequal-thickness water film.
The apparent permeability considering equal-thickness water film and unequal-thickness water film are both decreased with the increase of gas reservoir pressure under the same conditions. The permeability considering the equal-thickness water film was smaller than that considering the unequal-thickness water film as shown in Fig. 8. Because of the differences in curvature at each point of the ellipse, the capillary forces at each point are also different, resulting in different thicknesses of the water film. Therefore, ellipse considering the unequal thickness of water film is closer to the reservoir's actual situation.
4.4.2 The effect of stress sensitivity on shale permeability
In the production process, matrix pores and fractures will be affected by the stress sensitivity, which is manifested in the decrease of nanopore size and permeability of shale with the decrease of pressure, particularly in the early pressure reduction stage (Wu et al., 2016).
We can see from Fig. 11, the higher the gas reservoir pressure, the smaller the apparent permeability of the shale matrix, when the effective stresses are same. Meanwhile, at the same gas reservoir pressure, the greater the effective stress, the smaller the apparent permeability of shale matrix. With the increase of effective stress, the stress-sensitive effect becomes stronger and the effective flow pore size is decreased. When the pore size is decreased, the slip effect enhances the gas transport capacity, but the increased amount of gas transport capacity is much smaller than the decreased amount of gas transport capacity caused by the decrease in pore size.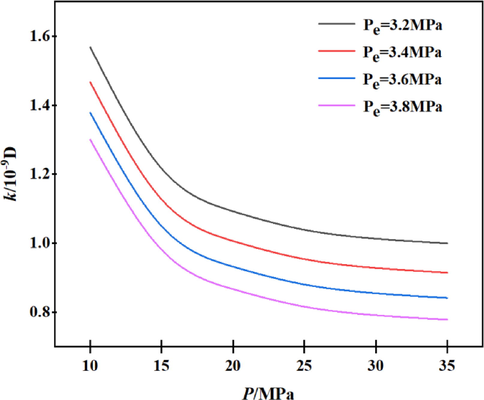
Apparent permeability at different effective stresses.
4.4.3 The effect of surface roughness on shale permeability
The pore surface of porous media is actually not smooth and flat, but it is usually rough and irregular, which decreases the permeability.
As shown in Fig. 12, the effect of roughness on permeability is more apparent when the gas reservoir pressure is low. The coarser the pore surface, the greater the apparent permeability. With an increase in the gas reservoir pressure, the influence of roughness on apparent permeability is gradually weakened. At p = 27 MPa, the permeability at the four selected roughness levels is approximately the same; when p > 27 MPa, the greater the roughness, the smaller the permeability.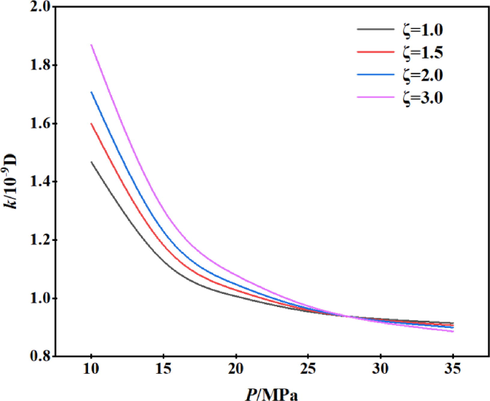
Apparent permeability at different surface roughness.
5 Conclusions
(1) Statistical analysis of SEM results showed that both inorganic and organic pores of shale tend to be elliptical, and in practice, round pores can be treated as a special case of elliptical pores; therefore, it is more universal to establish a permeability characterization model for elliptical pores.
(2) Based on the theory of solid surface interface mechanics and thermodynamic conservation theory, the quantification model of unequal-thickness water film in elliptical pores was established. The model comparison results showed that the new model's theoretical applicability is better than Li's and Sun’s models and is more in line with the actual production situation.
(3) The apparent gas permeability is affected by the pore water content, stress-sensitive effect, surface roughness, and pore shape. When the pore surface contains water, the apparent permeability of shale decreases; when the effective stress is constant, the apparent permeability of shale tends to decrease with an increase in gas reservoir pressure; when the gas reservoir pressure is constant, the apparent permeability of shale tends to decrease with an increase in effective stress; the rougher the pore surface of shale, the greater its apparent permeability.
Acknowledgements
The authors acknowledge the funds provided by Guizhou University, China (Number: 702825), and the Science and Technology Program of Guizhou Province, China (Qian Science Foundation- ZK [2022] General 106 and No.[2019]1119, and Qian Science Cooperation Project of Prospecting Strategy, China [2022] ZD001), and National Natural Science Foundation Project of China (No. 42002166).
Declaration of Competing Interest
The authors declare that they have no known competing financial interests or personal relationships that could have appeared to influence the work reported in this paper.
References
- Ardakani, O.M., Sanei, H., Ghanizadeh, A., Lavoie, D., Chen Z.H., Clarkson, C.R., 2018. Do all fractions of organic matter contribute equally in shale porosity? A case study from Upper Ordovician Utica Shale, southern Quebec, Canada. 92, 7964-808.
- Bai, J.J., Wang, G.Q., Zhu, Q.J., Tao, L., Shi, W.Y., 2022. Investigation on flowback behavior of imbibition fracturing fluid in gas–shale multiscale pore structure. Energies 15(20), 7802-7802.
- Petrophysical properties of Ordovician Utica shale in Quebec, Canada. Pet. Explor. Dev.. 2016;43(01):69-76.
- [Google Scholar]
- Cai, J.C., 2010. Study on several transport characteristics of low permeability reservoirs based on fractal theory. doctoral dissertation of HUST (in Chinese with English abstract).
- Chang, Y.L., Yang, Z.M., Zhang, Y.P., Niu, Z.K., Chen, X.L., 2022. Permeability characterization and its correlation with pore microstructure of stress-sensitive tight sandstone: take Chang 6 in Ordos Basin for example. Geofluids 2022.
- Research on multi-scale mass transfer characteristics and process coordination mechanism of shale gas. Sci. China: Tech. Sci.. 2018;48(05):473-487. (in Chinese with English abstract)
- [Google Scholar]
- Isotherms of capillary condensation influenced by formation of adsorption films. J. Colloid Interface Sci.. 2000;221(2):246-253.
- [Google Scholar]
- Differences in pore structure between shale and coal rock and their natural gas transport mechanism. Gas Ind.. 2022;42(11):37-49. (in Chinese with English abstract)
- [Google Scholar]
- Fernandes, F. B., Braga, A.M.B., de, S.A.L.S., Soares, A.S., 2023. Mechanical formation damage control in permeability Biot’s effective stress-sensitive oil reservoirs with source/sink term. J. Pet. Sci. Eng. 220(PB).
- Adsorption of binary hydrocarbon gas mixtures on activated carbon. Ind. Eng. Chem. Fundam.. 1966;5(4):490-498.
- [Google Scholar]
- Quantitative analysis of anisotropy effect on hydro fracturing efficiency and process in shale using X-Ray computed tomography and acoustic emission. Rock Mech.. 2021;54(11):1-16.
- [Google Scholar]
- Adsorption kinetic properties of methane in molded nanoactivated carbon. Chin. J. Chem. Eng.. 2008;11:2726-2732.
- [Google Scholar]
- Hirasaki, G., 1991. Interfacial phenomena in petroleum recovery. Marcel Dekker, New York, Chapter 3.
- Two-phase frictional pressure drop and water film thickness in a thin hydrophilic microchannel. Int. J. Heat Mass Transf.. 2018;127:813-828.
- [Google Scholar]
- A fractal model for gas-water relative permeability curve in shale rocks. J. Nat. Gas Sci. Eng.. 2020;81:103417
- [Google Scholar]
- A model of tight sandstone/shale inorganic nanopore vapor phase permeability under reservoir water-bearing conditions. Chin. J. Mech.. 2015;47(06):932-944. (in Chinese with English abstract)
- [Google Scholar]
- A model of vapor phase permeability under the influence of bound water in shale reservoirs. Pet. Sci. Bull.. 2018;3(02):167-182. (in Chinese with English abstract)
- [Google Scholar]
- Lou, Y., Su, Y.L., Wang, K., Xia, P., Wang, W.D., Xiong, W., Shao, L.J., Yang, F.Q., 2022. Revealing the effects of water imbibition on gas production in a coalbed matrix using affected pore pressure and permeability. Atmosphere 13(8), 1314-1314.
- Experimental study on porosity and permeability of anthracite coal under different stresses. J. Pet. Sci. Eng.. 2015;133:810-817.
- [Google Scholar]
- A novel method for determining water saturation of porous media in relative permeability measurement using DPT. Meas. Sci. Technol.. 2023;34(3)
- [Google Scholar]
- Shi, J.T., Zhang, L., Li, Y.s., 2013. “Diffusion and flow mechanisms of shale gas through matrix pores and gas production forecasting.” Paper presented at the SPE Unconventional Resources Conference Canada, Calgary, Alberta, Canada, November 2013.
- The impacts of pore structure and relative humidity on gas transport in shale: A numerical study by the image-based multi-scale pore network model. Transp. Porous Media 2021:1-25.
- [Google Scholar]
- An analytical model for gas transport through elliptical nanopores. Chem. Eng. Sci.. 2019;199:199-209.
- [Google Scholar]
- Sun, Y.S., Guo, S.b., 2016. Qualitative and quantitative characterization of microscopic pore characteristics of shale based on image analysis technology. Adv. Earth Sci. 2016, 31(07), 751-763 (in Chinese with English abstract).
- Investigation of the controlling rock petrophysical factors on water phase trapping damage in tight gas reservoirs. Energy Sci. Eng.. 2020;8(3):647-660.
- [Google Scholar]
- Water film flow along fracture surfaces of porous rock. Water Resour. Res.. 1997;33(6):1287-1295.
- [Google Scholar]
- Permeability model of shale complex fracture network considering slippage effect and tortuous distribution characteristics. J. Cent. South Univ.. 2020;51(12):3454-3464. (in Chinese with English abstract)
- [Google Scholar]
- Quantitative characterization of sandstone pore throat structure complexity and its influence on permeability: a case study of shale street formation in Dongying sag. Pet. Geol. Recovery Effic.. 2022;29(05):39-48. (in Chinese with English abstract)
- [Google Scholar]
- A model for multiple transport mechanisms through nanopores of shale gas reservoirs with real gas effect–adsorption-mechanic coupling. Int. J. Heat Mass Transf.. 2016;93:408-426.
- [Google Scholar]
- Microscale effects of shale gas organic matter nanoporous gas t ransport. Gas Ind.. 2016;36(11):51-64. (in Chinese with English abstract)
- [Google Scholar]
- Xue, B., Zhang, J.C., Tang, X., Yang, C., Chen, Q., Man, X.J., Dang, W., 2015. Microscopic pore structure and gas storage characteristics of shale in Longmaxi Formation in northwest Guizhou Province. Acta Pet. Sin. 36(02), 138-149+173 (in Chinese with English abstract).
- Water production mechanism of tight sandstone gas reservoir and its influence on seepage capacity. Nat. Gas Geosci.. 2019;30(10):1519-1530. (in Chinese with English abstract)
- [Google Scholar]
- New progress in shale nanoporosity research. Adv. Earth Sci.. 2014;29(11):1242-1249. (in Chinese with English abstract)
- [Google Scholar]
- Review of micro seepage mechanisms in shale gas reservoirs. Int. J. Heat Mass Transf.. 2019;139:144-179.
- [Google Scholar]
- Zhao, R.X., Xue, H.T., Lu, S.F., Li, J.Q., Tian, S.S., Wang, M., Dong, Z.T.,2022. Multi-scale pore structure characterization of lacustrine shale and its coupling relationship with material composition: An integrated study of multiple experiments. Mar. Pet. Geol. 105648.
- Effect of coarse pore wall on tight sandstone gas flow at micro/nanoscale. J. Acta Pet. Sin.. 2021;42(05):641-653. (in Chinese with English abstract)
- [Google Scholar]
- Microscopic distribution of water during seepage absorption of shale reservoir and dynamic response characteristics of gas permeability. Acta Pet. Sin.. 2022;43(04):533-547. (in Chinese with English abstract)
- [Google Scholar]
- The first discovery of nanopores in oil and gas reservoirs in China and their scientific value. J. Petrol.. 2011;27(06):1857-1864. (in Chinese with English abstract)
- [Google Scholar]
Appendix A
For circular pores, assuming that the thickness of water film adsorbed by unit molar water molecules on the pore surface is Δh, then the adhesion pressure and capillary force work as follows (Churaev et al., 2000):
When the unit molar of water molecules is converted into liquid water, the change of adsorption potential can be calculated by the G-M binary gas adsorption model (Grant et al., 1966):
According to the law of conservation of energy, Δμ1 = Δμ2 (Churaev et al., 2000), then:
The microscopic adsorption force of water molecules on the mineral surface mainly includes van der Waals force Пm(h), electrostatic force Пe(h) and structural force Пs(h), of which van der Waals force is the intermolecular force, the electrostatic force is the interaction force generated by the mineral surface with charge or the formation of a two-electron layer in a polar solution, and the structural force is an additional force generated near the stern layer on the solid–liquid surface in the water film.
Appendix B
For elliptical pores, the characteristic lengths S and Knudsen number Kn are as follows:
The intermolecular collision frequency wp-v is:
Where is the average velocity of molecules, m/s; ρN is the molecular molar density, mol/m3.
For two-dimensional space, the collision frequency ωp-w of molecules with walls is:
Assuming ξ = b0/a0, then the weight coefficients fp-v for viscous flow dominated by intermolecular collisions and fp-Kn for Knudsen diffusion dominated by molecule-wall collisions in elliptical pores are:
According to the Navier-Stokes equations, the mass flow rate of viscous flow in elliptical pores dominated by intermolecular collisions is:
The Knudsen diffusion mass flow in elliptical pores is:
Based on Eqs. (B-5)-Eq. (B-8), the nanopore bulk phase transport is:


