

Translate this page into:
Study on the structural and photophysical properties of N-acyl amino acid europium complexes
⁎Corresponding author. naren0501@163.com (Gerile Naren),
-
Received: ,
Accepted: ,
This article was originally published by Elsevier and was migrated to Scientific Scholar after the change of Publisher.
Peer review under responsibility of King Saud University.
Abstract
In this paper, a series of acyl amino acid europium complexes (Eu[CH3(CH2CH2)nCONHCH(CH3)COO]3, n = 0 ∼ 5) were synthesized using N-acyl amido alanine as ligands, and their structures and photophysical properties were studied.The structural and functional group information of europium complexes was obtained by elemental analysis, as well as infrared and hydrogen nuclear magnetic spectral analysis (1H NMR). The theoretical structure of the complexes was obtained by density functional theory (DFT) calculations; the theoretical structure of the complex was shown to be reliable by the comparison of theoretical and experimental vibrational and 1H NMR spectra. Additionally, the photophysical properties of the solid complexes at room temperature were determined by analysis of Ultraviolet–visible spectroscopy(UV–vis) and luminescence spectra. From the test results, it can be seen that the complex had good light absorption capacity in the range of 200–––300 nm; By comparison of the luminescence intensities of the complexes and EuCl3 proved that acyl amino acid ligands played a role in sensitizing Eu3+ characteristic luminescence. In addition, the effect of solution concentration on fluorescence performance has been studied. It can be inferred that complexes with longer carbon chains are less prone to aggregation in solution (increasing repulsive forces with increasing hydrophobicity), and the concentration, where fluorescence quenching occurs, is higher. Moreover, the solvent effect on the luminescence performance of the complexes was investigated by testing the luminescence spectrum of the complexes with different carbon chain lengths in a methanol solution(0.01 mol/L). Finally, the variable temperature spectral analysis provided information on the temperature-dependent variation of the luminescence properties of the complexes. The fluorescence performance of complexes with different carbon chain lengths that having different changing trends with temperature, with long carbon chain complexes exhibiting better high-temperature fluorescence stability.
Keywords
Rare earth complexes
Amino acid ligands
Luminescent properties

1 Introduction
Ions of rare earth elements have attracted much attention in the field of luminescence because of their unique narrow-band luminescence characteristics that are not easily affected by the external ligand field(Nagaishi et al., 2003; Xiong et al., 2020; Nazabal and Adam, 2022; Guillaume et al., 2021; Crawford et al., 2021). Nevertheless, due to the difficulty of spontaneous electronic transitions of 4f level electrons, rare earth ions themselves have weak light absorption capacity, which enables them to achieve sensitization luminescence by bonding with organic ligands with good light absorption capacity(Khan and Khan, 2018). Amino acids are small biological molecular substances essential to life. They are also abundant in natural biological systems and are environment-friendly. Moreover, amino acids contain many coordinating functional groups, such as –COO-, –NH2, –OH, etc., which makes amino acids good biological ligands(Wen, 2010). Rare earth acidic complexes have long been studied in the past(Liu et al., 1997; Zhang et al., 2005). However, the sensitization ability of amino acid ligands to rare earth ion luminescence is weak. Because the single amino acid ligands, except for phenylalanine, tryptophan, and tyrosine that have absorption ability in the near ultraviolet region (220–––300 nm), due to their R groups (such as the benzene ring substituent, hydroxyl, etc.) containing a benzene ring, primarily absorb light in the far ultraviolet region (<220 nm), and their overall light absorption capacity is weak. Moreover, phenylalanine, tryptophan, and tyrosine are strong fluorescent substances, their energy transfer to rare earth ions in a non-radiative way is difficult and the luminescence of the newly formed complexes is poor(Prias et al., 2022). Therefore improving the light absorption and energy transfer ability of amino acid ligands has become an urgent problem to be solved. In recent years, acyl amino acid rare earth complexes have shown good sensitivity to the luminescence properties of rare earth ions(Iida et al., 2006; Shi et al., 2022; Zhang et al., 2021; Zhang et al., 2022). The introduction of the amide group enhances the light absorption ability of the ligands as well as the sensitization ability of amino acid ligands to rare earth ions. These studies explored the effect of different R groups of amino acids on the luminescence properties of rare earth ions. In this paper, alanine is selected as the basic ligand. Carbon chains are introduced into alanine through different amide substituents to investigate the impact of carbon chains of different lengths on the luminescence properties of rare earth complexes. Trivalent europium has a special energy level structure and strong luminescence characteristics(Wu et al., 2018; Gao et al., 2018; Yang et al., 2021; Gao et al., 2018; Liu et al., 2022).The characteristic light color of Eu3+ is red, red light plays an important role in simulating indoor natural light, horticultural cultivation, detecting biological information, treating physical diseases, and machine vision(Li et al., 2020; Rajendran et al., 2019). Thus, in this study, N-acyl amino acids are used as ligands to synthesize europium amino acid complexes with the objective to study their photophysical properties. In addition, the thermal quenching of rare earth ions is an important factor affecting the use of rare earth fluorescent powders(Zhao et al., 2021). In recent years, there have been many studies on the temperature dependent fluorescence spectra of inorganic doped complexes(Niu et al., 2023; Meena et al., 2022), but there has been less research on the fluorescence changes of organic rare earth complexes at different temperatures. Therefore, this article conducts temperature dependent fluorescence spectroscopy testing on amino acid europium complexes, with the aim of finding organic rare earth fluorescent powders that can still emit stable light at higher temperatures.
2 Experimental
2.1 Preparation of the complexes
First, the ligands were prepared by in-solution synthesis using alanine (≥99%) and ethylene, butyl, hexyl, octyl, decyl, and lauryl chloride (≥99%) compounds. Then several amino acid rare earth europium complexes were prepared according to the experimental method used by naren et al(Naren et al., 2009). A specific weight of each N-acyl amino acid ligand compound was dissolved in methanol, into which a KOH methanol solution was added to adjust the pH to about 6, and reacted for several hours under stirring. After that, the EuCl3 methanol solution was added dropwise to adjust the pH value and also reacted for several hours. A white solid powder was finally obtained after purification with ethanol and acetone. The elemental analysis results of these amino acid rare earth complexes are as follows: Eu(C5H8NO3)3·2H2O(abbreviated as Eu(ac-ala)3·2H2O): Anal: C 31.38, H 4.22, N 7.30 wt%. Theoretical: C 31.16, H 4.53, N 7.27 wt%. Eu(C7H12NO3)3·H2O (abbreviated as Eu(but-ala)3·H2O):Anal: C 39.17, H 6.11, N 6.41 wt%. Theoretical: C 39.13, H 5.94, N 6.25 wt%. Eu(C9H16NO3)3·H2O (abbreviated as Eu(hex-ala)3·H2O):Anal: C 45.26, H 7.04, N 5.76 wt%. theoretical: C 45.07, H 6.84, N 5.82 wt%. Eu(C11H20NO3)3·H2O (abbreviated as Eu(oct-ala)3·H2O):Anal: C 48.97, H 7.68, N 5.17 wt%. Theoretical: C 48.81, H 7.65, N 5.18 wt%. Eu(C13H24NO3)3·H2O (abbreviated as Eu(dec-ala)3·H2O):Anal: C 52.22, H 8.32, N 4.68 wt%. Theoretical: C 52.41, H 8.30, N 4.64 wt%. Eu(C15H28NO3)3·H2O (abbreviated as Eu(dod-ala)3·H2O):Anal: C 55.09, H 8.84, N 4.28 wt%. Theoretical: C 55.53, H 9.06, N 4.38 wt%.
2.2 Test method for complex analyses
To investigate the structure and properties of the complex, the following tests were conducted(Iida et al., 2006; Shi et al., 2022; Zhang et al., 2021; Zhang et al., 2022): A Perkin Elmer Spectrum Two FT-IR instrument was used to obtain the infrared vibrational absorption spectra of the complexes in the 400–––4000 cm−1. A BRUKER NMR600 NMR spectrometer was used for 1H NMR spectral analysis. The solvent was DMSO‑d6, and the structural information of the complex was inferred. The self-diffusion coefficient of complexes in methanol solution were obtained with Conductivity tester. The absorption spectra of the complexes were obtained with a Perkin Elmer Lambda 35 UV–Vis spectrometer in the wavelength range of 200–––700 nm, the solubility of the complex in methanol is the best, therefore a methanol solution of the complex was used for testing. The excitation and emission spectra of the complexes were obtained with an Edinburgh Instruments FS5 luminescence spectrophotometer, and the quantum yield and luminescence lifetime were determined.
2.3 Computational details
All calculations were performed with the GAUSSIAN 09 software package(Frisch et al., 2009). The ground state structure of the ligand compound molecules was optimized using the M062X functional and the 6-311G (d,p) basis set; theoretical infrared vibrational spectra were obtained through vibrational analysis. Based on the theoretical ground state structure, the PBE0 and M062X functionals and the 6-31G (d,p) basis set is used to simulate the excited state structure. Based on this excited state structure, the PBE0 and the M062X functionals and the def2TZVP basis set are used to obtain the excited state energy levels of the ligand compounds.
For the complexes, due to the large atomic number of the Eu3+ ion and the complexity of the internal 4f electronic layer, the Stuttgart pseudopotential basis set is introduced to simulate the theoretical structure of the complexes. The PBE0 functional and the ECP53MWB (for Eu3+) and 6-31G (d, p) (for C, O, N, and H) basis set was applied to determine the molecular structure and obtain the vibrational spectra.
1H NMR of the ligand compounds and complexes were computed using the revTPSS functional and the pcSseg-1(de Oliveira et al., 2021) (for C,O,N and H) and ECP53MWB (for Eu3+).
2.4 Formula used
From the CIE coordinates (x, y) of the complexes, the color coordinates (u ', v') of each complex are determined using Equation(1)(Hooda et al., 2022):
The correlated color temperature(CCT) of the synthesized europium complexes was determined from Equation(2)(McCamy, 1992):
The value of color purity in the synthesized complexes was estimated using Equation(3)(Zapata-Lizama et al., 2020):
Where xd(0.688) and yd(0.331) represent the dominant points for red color and xi(0.333) and yi(0.333) signify the illumination points(Nehra et al., 2022).
Luminescence lifetime curves were fitted to a double exponential equation: , where and are luminescence lifetimes, , , and are (amplitudes A and initial intensity I) fitting parameters. Then the final luminescence lifetimes of the six complexes were obtained by the equation for the mean lifetime: .
The coordination environment in the complexes around the Eu3+ ion was determined using the Judd-Ofelt theory. Photoluminescence data were utilized to determine the J-O parameters and transition rates. Radiative transition rates of the complexes were calculated by summation of the radiative rates (AOJ) for 5D0→7F0-4. AOJ was estimated by the relationship Equation (4)(De Sa et al., 2000):
The luminescence quantum efficiency of the complexes was determined using Equation (6)(Biju et al., 2006):
Judd-Ofelt intensity parameters (Ω2 and Ω4) were affected by the coordination field around the Eu3+ ion, which can be estimated by Equation (7)(Yu, 2020):
The fluorescence branching ratio that depicts the involvement of each transition as the percentage of radiative decay rate was calculated using Equation(8)(Righini and Ferrari, 2005):
3 Results and discussion
3.1 Molecular structure analysis of the complexes
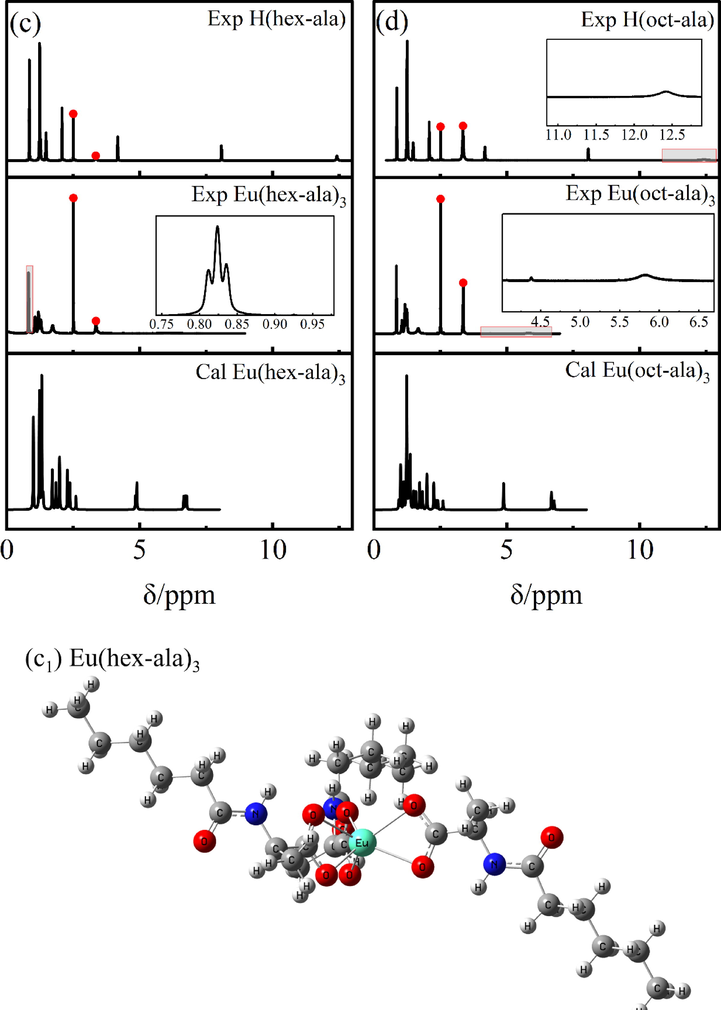
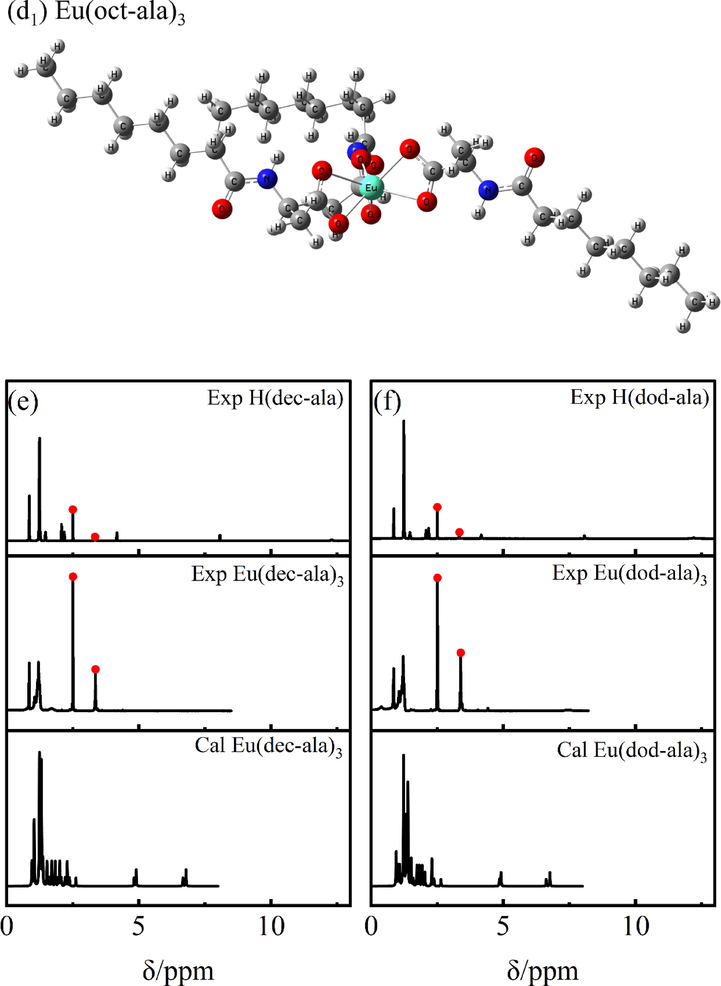
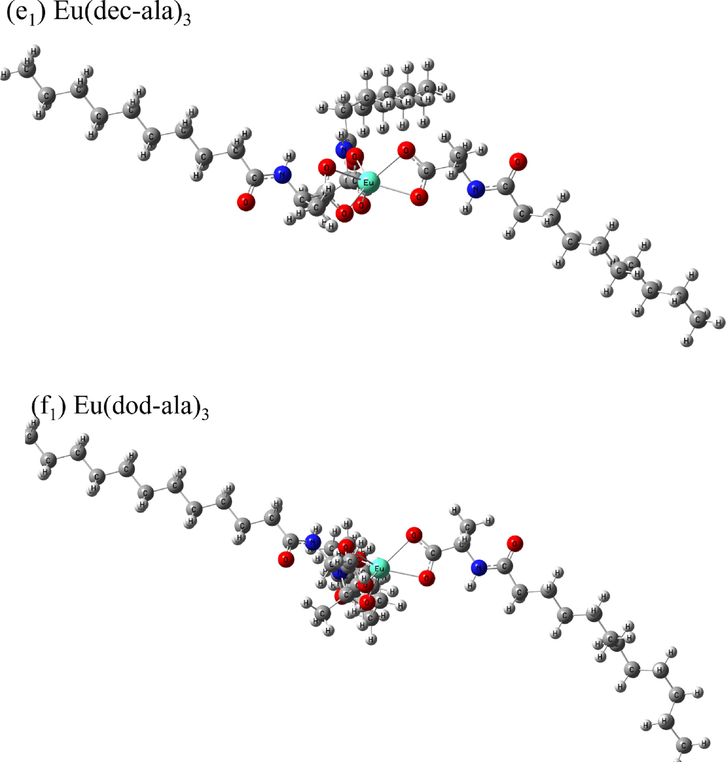
1H NMR was used for the identification of the different chemical environments of hydrogen atoms in the rare earth molecular complexes based on the different resonance signal intensities and chemical shifts. The chemical shifts “δ” of the hydrogen atoms in the six ligands are as follows: H(ac-ala):1H NMR (600 MHz, DMSO‑d6) δ 13.22 (s, 1H), 8.43 (s, 1H), 3.92 (s, 1H), 1.41 – 1.40 (m, 6H). H(but-ala): 1H NMR (600 MHz, DMSO‑d6) δ 8.26 (s, 1H), 8.14 – 8.02 (m, 1H), 3.91 – 3.90 (m, 1H), 2.45 – 1.58 (m, 2H), 1.39 (s, 5H), 1.29 – 1.20 (m, 2H), 0.95 – 0.76 (m, 1H). H(hex-ala): 1H NMR (600 MHz, DMSO‑d6) δ 12.42 (s, 1H), 8.07 (s, 1H), 4.17 (s, 1H), 2.08 (s, 2H), 1.56 – 1.22 (m, 9H), 0.85 (s, 3H)。H(oct-ala): 1H NMR (600 MHz, DMSO‑d6) δ 12.42 (s, 1H), 8.06 (s, 1H), 4.18 (s, 1H), 2.08 (s, 2H), 1.48 (s, 2H), 1.31 – 1.26 (m, 2H), 1.25 (s, 5H), 1.24 (s, 4H), 0.86 (s, 3H)。H(dec-ala): 1H NMR (600 MHz, DMSO‑d6) δ 12.30 (s, 1H), 8.07 (s, 1H), 4.17 (s, 1H), 2.13 (s, 2H), 1.54––1.23 (m, 17H), 0.86 (s, 3H)。H(dod-ala): 1H NMR (600 MHz, DMSO‑d6) δ 12.29–––12.11 (m, 1H), 8.07 (s, 1H), 4.17 (s, 1H), 2.18 (s, 2H), 1.24 (s, 21H), 0.86 (s, 3H)。The chemical shifts of hydrogen atoms in the six Eu3+complexes are as follows: Eu(ac-ala)3:1H NMR (600 MHz, DMSO‑d6) δ 7.76 (s, 1H), 4.38 – 4.01 (m, 1H), 2.13 – 2.07 (m, 1H), 1.48 – 1.00 (m, 3H), 0.63 – 0.27 (m, 2H). Eu(but-ala)3:1H NMR (600 MHz, DMSO‑d6) δ 7.70 – 7.62 (m, 1H), 4.40 (s, 1H), 1.86 – 1.15 (m, 2H), 1.05 (q, J = 6.8 Hz, 3H), 0.66 (s, 5H). Eu(hex-ala)3:1H NMR (600 MHz, DMSO‑d6) δ 8.04 (s, 1H), 4.20 – 4.18 (m, 1H), 1.41 (d, J = 7.2 Hz, 5H), 1.23 (t, J = 7.1 Hz, 6H), 0.62 (s, 3H). Eu(oct-ala)3:1H NMR (600 MHz, DMSO‑d6) δ 5.82 (s, 1H), 4.23 (d, J = 185.8 Hz, 1H), 1.90 – 1.49 (m, 3H), 1.38 – 0.97 (m, 12H), 0.85 (t, J = 7.2 Hz, 3H). Eu(dec-ala)3:1H NMR (600 MHz, DMSO‑d6) δ 6.06 (s, 1H), 4.45 – 4.02 (m, 1H), 1.70 (s, 2H), 1.46 – 0.95 (m, 17H), 0.85 (m, J = 7.0 Hz, 3H). Eu(dod-ala)3:1H NMR (600 MHz, DMSO‑d6) δ 7.45 (s, 1H), 4.41 (s, 1H), 1.70 – 1.31 (m, 2H), 1.21 – 1.07 (m, 21H), 0.86 (d, J = 6.9 Hz, 3H). Fig. 1 shows the position of hydrogen atoms corresponding to each signal in the 1H NMR spectra of the europium (III) complexes and ligand compounds. The two peaks highlighted in red in Fig. 1 are the solvent peak (2.49 ppm) and solvent water peak (3.3 ppm) of DMSO‑d6, respectively. Comparing the 1H NMR signals of the experimental and the theoretical spectra of the complexes, it can be seen that there is only a small difference in the chemical shifts of nonreactive hydrogens, proving the reliability of the theoretical structures obtained for the complexes. Furthermore, the chemical shift differences of the complexes relative to those of the individual ligands are significant, supporting the binding of europium ions to the ligands. In addition, it can be seen from the theoretical structure of the complexes shown in Fig. 1 that the ligands coordinate to the central Eu3+ through the bidentate chelation mode.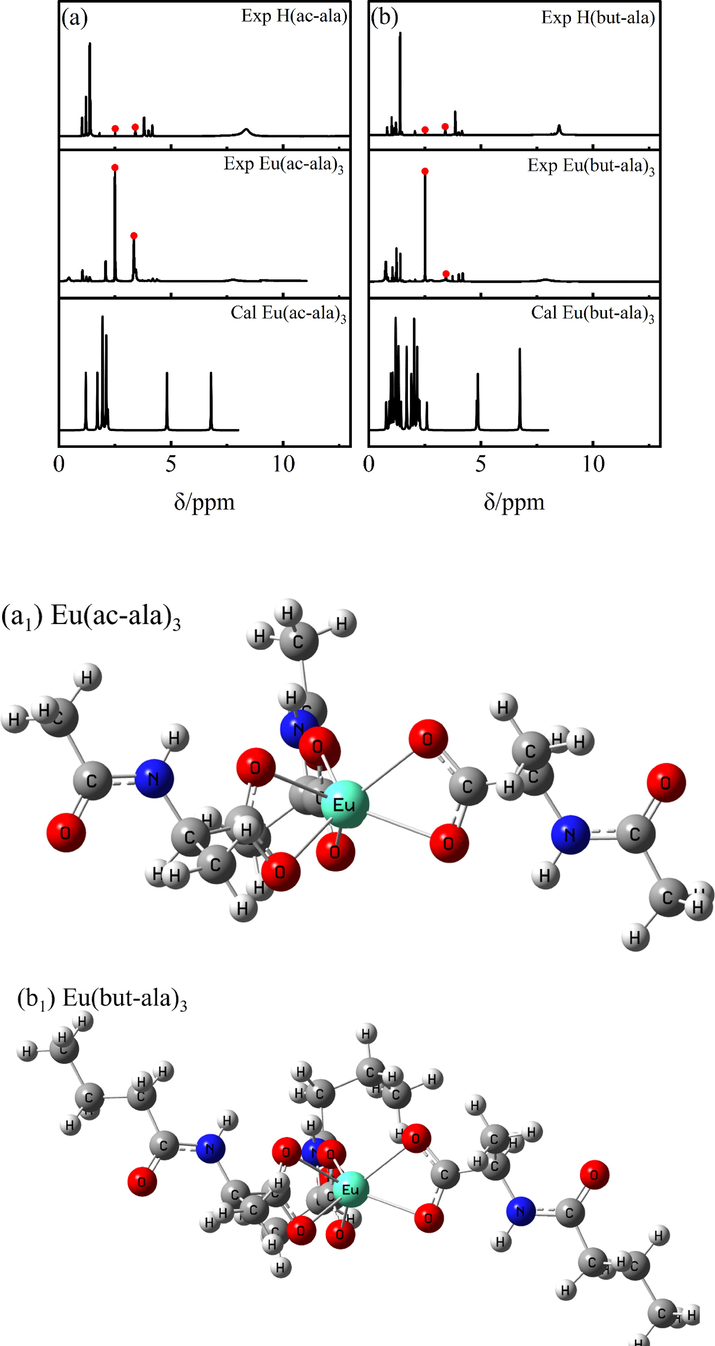
1H NMR spectra of the ligands and europium complexes.
1H NMR spectra of the ligands and europium complexes.
1H NMR spectra of the ligands and europium complexes.
1H NMR spectra of the ligands and europium complexes.
Structural information of the rare earth complexes was obtained by FT-IR spectral analysis as shown in Fig. 2. There is a significant difference in the FT-IR spectra between the ligands and the complexes indicating that the ligands were bonding with Eu3+. It can be observed that the vibrational peaks of the –CONH-functional groups of the six europium complexes were distributed around 3090 cm−1. The acyl chloride reacted with alanine to generate acyl amino acid ligand compounds, indicated by the fact that these vibrational peaks only appeared in the infrared spectra of solid samples. The functional group –CONH- is a secondary amide, which generally produces three absorption bands. They were the amide band I (C = O (CONH) which showed a strong absorption peak in the range of 1680–––1630 cm−1), amide band II (the coupling between δNH and vC-N formed the amide band II due to the resonance absorption in the range of 1570–––1510 cm−1), and amide band III (the coupling between δNH and vC-N formed the amide band III of the resonance absorption in the range of 1335–––1200 cm−1). The complex is an organic carboxylate. Its –COO- functional group is a multi-electron conjugated system with strong absorption peaks in the wavenumber range of 1610–––1560 cm−1 and 1440–––1350 cm−1. They respectively correspond to the antisymmetric and symmetric stretching vibrations; the peak intensity of the symmetric stretching vibration was smaller than that of the antisymmetric stretching vibration(Ning and Ernst, 2014). In addition, the absorption peak near 535 cm−1 belongs to the absorption band generated by O-Eu formed by the ligand binding to the rare earth ions. The lower the wave number, the higher the energy. The vibration peak of –CH2- shifts towards the short wave number as the length of the carbon chain increases, indicating that the vibration of long carbon chains requires higher energy. And the vibration peak of O-Eu tends to shift towards higher wave numbers as the carbon chain grows, indicating that the binding force of short carbon chain complexes is stronger. The peaks corresponding to the respective functional groups are shown in Table 1.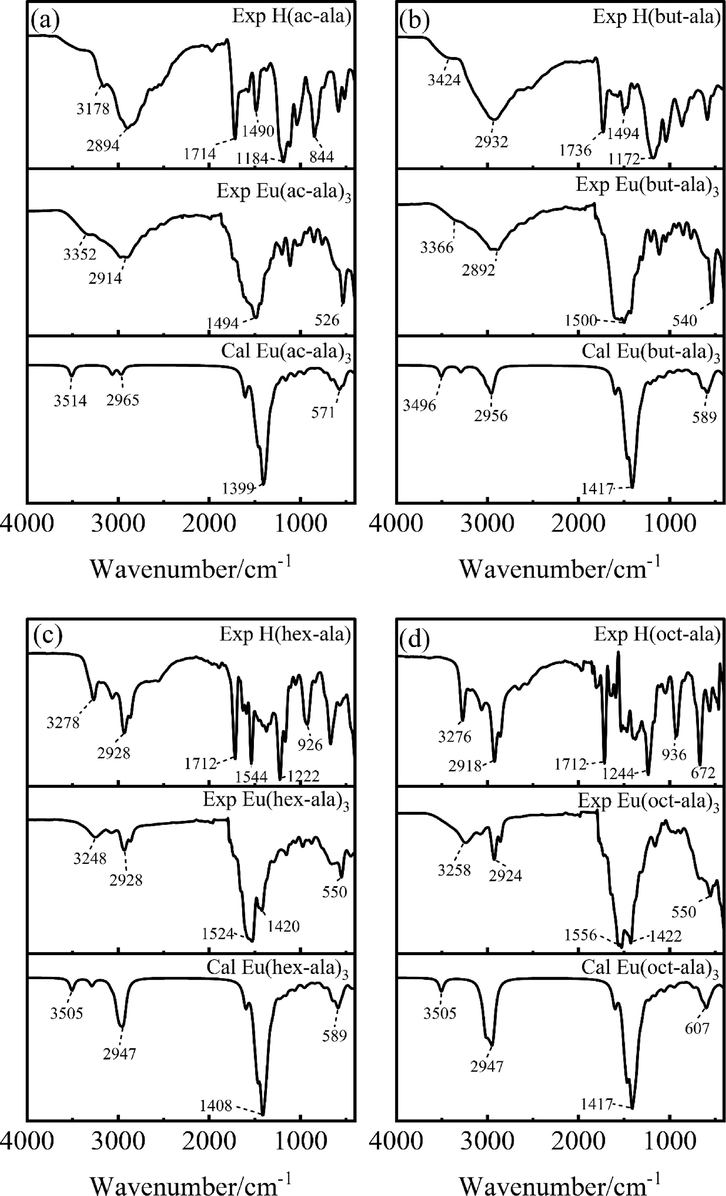
FT-IR spectra of ligands and europium complexes.
FT-IR spectra of ligands and europium complexes.
–CONH- (solid state)
v(–CH2-)
vC = O(COOH)
vC-OH
vsC-OH
vasCOO-
vC = O(CONH)
νsCOO-
O-Eu
H(ac-ala)
3176
2942
1720
2526/2618
1184/848
–
1580
–
–
H(but-ala)
–
2928
1730
2510/2592
1176/866
–
1626/1584
–
–
H(hex-ala)
3068
2900
1728
2516/2602
1176/864
–
1632/1580
–
–
H(oct-ala)
3068
2926/2864
1712
2560/2652
1238/924
–
1648/1594
–
–
H(dec-ala)
3066
2920/2856
1716
2570/2650
1238/932
–
1632/1596
–
–
H(dod-ala)
3034
2916/2852
1700
2562/2672
1238/934
–
1644/1598
–
–
Eu(ac-ala)3
3344
2910/2974
–
–
–
1602
1506
1302/1346
526
Eu(but-ala)3
3358
2878/2970
–
–
–
1604
1500
1304/1372
540
Eu(hex-ala)3
3358
2924/2974
–
–
–
1568
1488
1304/1372
550
Eu(oct-ala)3
3250
2858/2926
–
–
–
1632
1528
1292/1370
550
Eu(dec-ala)3
3324
2856/2922
–
–
–
1618
1570
1332/1364
556
Eu(dod-ala)3
3328
2858/2922
–
–
–
1626
1538
1300/1372
524
According to the infrared spectral analysis, the complex had characteristic functional groups such as –CONH- and n-alkyl groups. The hydrogen atom in –CONH- is an active hydrogen, and its characteristic signal was a blunt peak. Additionally, its oxygen atom is a strong electrophile, causing a decrease in the electron density around the nuclei of the hydrogen atoms and a further increase in its chemical shift. As a result, its characteristic peak appeared at about 5.5–––7 ppm. The methylene chemical shifts of the n-alkyl groups were relatively close, and the peaks were concentrated around 1.25 ppm. The top methyl group was the most obvious, showing triplets at about 0.87 ppm. However, the electron-affinity of the group affected the methylene hydrogen atom close to –CONH-, and its chemical shift increased as compared to the other methylene groups, moving to around 1.5 ppm(Ning and Ernst, 2014). According to the elemental analysis, 1H NMR, and FT-IR analysis, the molecular structure and the photophysical properties of the target product could be determined.
3.2 Light absorption and luminescence capacity of the complexes
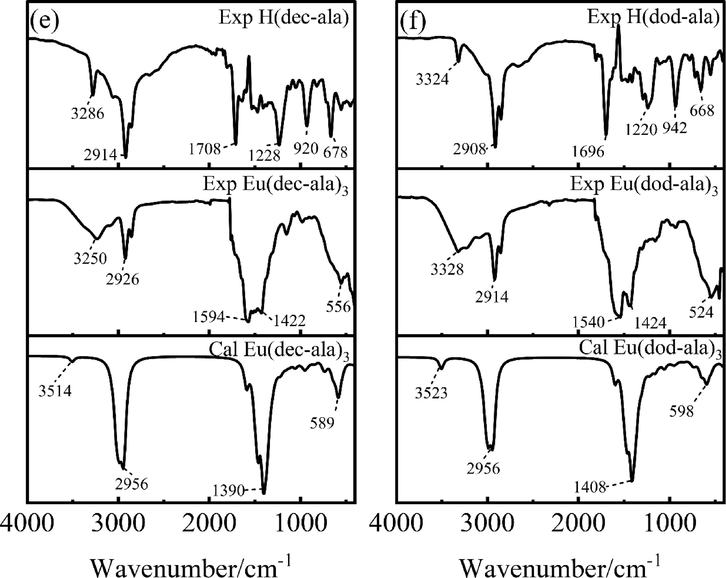
The energy transfer from ligands to rare earth ions is also known as the antenna effect(Wu et al., 2018). First, the energy absorbed by the ligand allows for their transition from the ground state to the excited singlet state level and then passes through the intersystem crossing (ISC) radiationless transition state to the excited triplet state level. The energy is transferred to the lowest excited state level of rare earth ions. Since the light absorption capacity of the complex is one of the main factors affecting the luminescence performance of the complex, UV–visible absorption spectra of the complex in methanol solution (0.01 mol/L) were taken and analyzed. The results are illustrated in Fig. 3. It can be observed that the light absorption capacity of the complex came primarily from the ligand and that the complex had good light absorption capacity in the range of 200–––300 nm, shown as two distinct absorption peaks. The above analysis shows that the complex contains –CONH- and the carboxyl functional group contains C = O, where the unpaired n electrons on both sides of the oxygen atom are excited to the antibonding orbital Π* of the C = O double bond after absorbing energy, thus generating an optical absorption peak(Jin, n.d.). In addition, the absorption spectra in the enlarged view of Fig. 3 show that there are some absorption bands with very low absorption intensity, among which the absorption peak at 394 nm can be attributed to the 4f-4f transition absorption of Eu3+. There was no significant difference in the absorption capacity of the six complexes with different chain lengths, with the exception of the Eu(oct-ala)3 complex, which had a slightly stronger absorption capacity.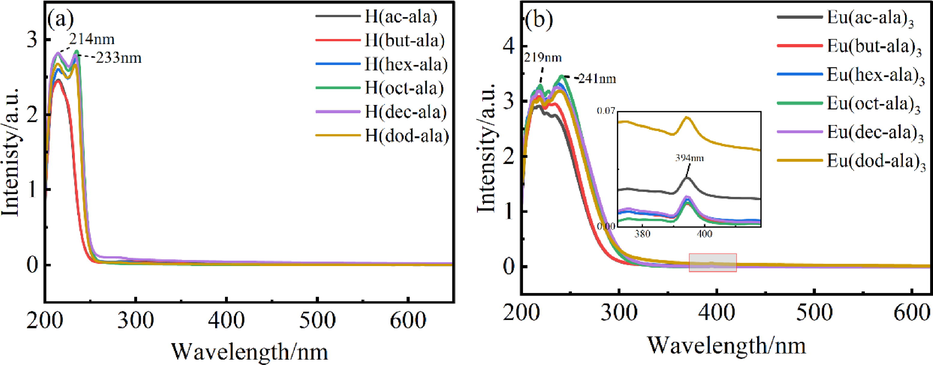
UV–vis spectrum of ligands and europium complexes (a) ligands (b) complexes.
3.3 Luminescence spectral analysis of the solid complexes
The luminescence excitation spectral scan measures the total excitation wavelength-dependent luminescence of the samples(Jin, n.d.). The optimal excitation value of the luminescence emission spectrum can be obtained by the analysis of the excitation spectrum. Excitation spectra of EuCl3 and the complexes were taken, and their analytical results are shown in Fig. 4. As shown in Fig. 4(a), the sharp absorption peaks of EuCl3 at 298 nm (7F0→5F4), 318 nm (7F0→5H6), 362 nm (7F0→5D4), 384 nm (7F0→5L7), 394 nm (7F0→5L6), 416 nm (7F0→5D3), and 464 nm (7F0→5D2) were attributed to the 4f → 4f characteristic absorption peak of Eu3+(Khan et al., 2014). By comparing the EuCl3 excitation spectra of EuCl3 and the rare earth europium complexes, it was found that the difference between the excitation peaks of the complex and chloride was small, and the optimal excitation wavelength was still at 394 nm. The complex still produced luminescence in the range of 200–––250 nm, but the total luminescence intensity was weak, indicating that the ligand compound could transfer energy to Eu3+ only with low efficiency.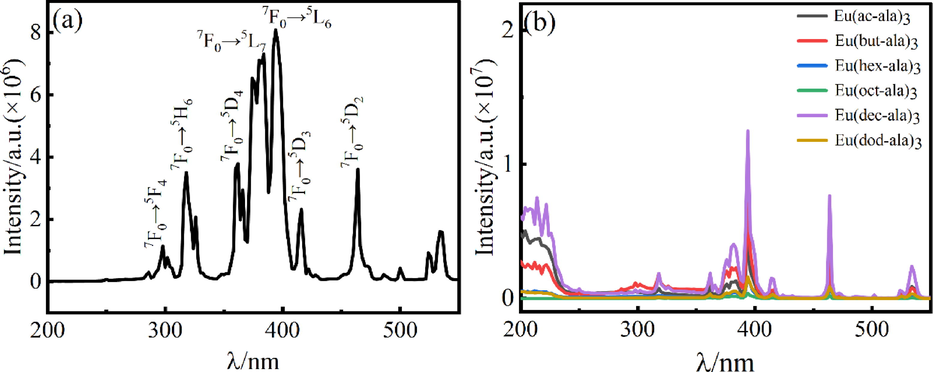
Excitation spectrum of EuCl3(a) and europium complexes(b).
The optimal excitation wavelength for each complex determined from the luminescence excitation spectrum was used for the luminescence emission spectral analysis. The results are shown in Fig. 5. The four major emission peaks of the Eu3+ complex were detected at 590 nm, 610 nm, 650 nm, and 698 nm. The corresponding electronic transitions of Eu3+ are 5D0→7F1, 5D0→7F2, 5D0→7F3, and 5D0→7F4, among which 5D0→7F1 is a magnetic dipole transition, and 5D0→7F2 is an electric dipole transition(Wu et al., 2015). Since this transition emission peak was the strongest, this peak was used as the detection peak in the luminescence lifetime test of the complex. The remaining emission peaks at 467 nm, 482 nm, 536 nm, 556 nm, and 571 nm correspond to the 5D2→7F2, 5D2→7F3, 5D1→7F1, 5D1→7F2 and 5D0→7F0 transitions of Eu3+(Lima et al., 2017; Wang et al., 2015; Huang et al., 2013; Jiang et al., 2012). A comparison of the luminescence intensities of the complexes and EuCl3 proved that acyl amino acid ligands played a role in sensitizing Eu3+ characteristic luminescence. In addition, the 5D0→7F1 (590 nm) transition peak of Eu3+ was attributed to the magnetic dipole transition, and its intensity was not much affected by the coordination environment. However, the 5D0→7F2 (610 nm) transition is an electric dipole transition, and its intensity was quite sensitive to changes in the surrounding chemical environment. Therefore, the coordination environment of Eu3+ ions could be determined by comparing the two transition intensities. The general indicator for a centrosymmetric coordination environment is I(610 nm/590 nm) < 8(Jin, (1068)). The luminescence intensities at 610 nm and 590 nm of the six Eu3+ complexes were compared, and the results are as follows: IEu(ac-ala)3 = 3.114; IEu(but-ala)3 = 2.664; IEu(hex-ala)3 = 3.254; IEu(oct-ala)3 = 3.585; IEu(dec-ala)3 = 4.442; IEu(dod-ala)3 = 4.160. The comparison showed that the six complexes Eu3+ were in a centrosymmetric position. According to Refs.(Shi et al., 2012; Binnemans et al., 1997), the Judd-Ofelt (J-O) intensity parameter Ω2 (shown in Table3) significantly impacts the intensity of the ultra-sensitive transition (5D0→7F2), which is determined by the asymmetry of the coordination environment of rare earth ions. The increase in asymmetry will enhance the luminescence intensity of rare earth ions leading to a difference in the luminescence intensity of the complexes in Fig. 5(b).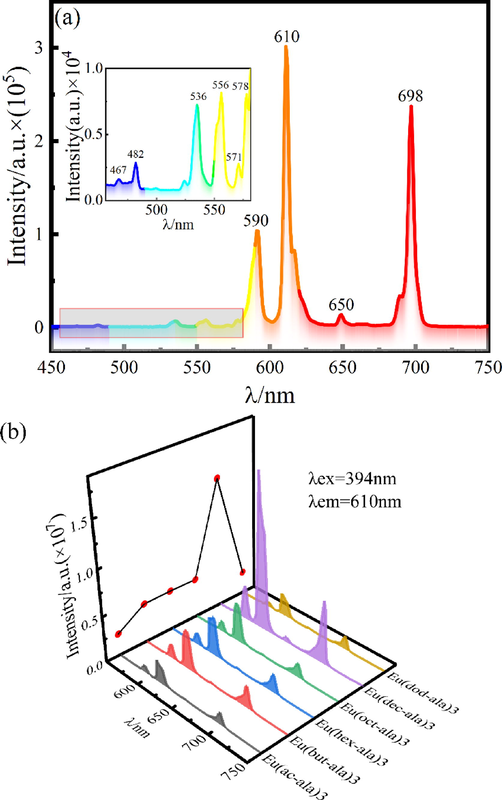
Emission spectrum of EuCl3 (a) and europium complexes (b).
3.3.1 Energy transfer mechanism
According to the excitation spectrum of the complexes in 4(b), there is total fluorescence generated by the energy transfer from the ligand to the Eu3+ in the range of 200–––250 nm, but the peak intensity is low. The excited triplet energy level of the ligand compound has been obtained by theoretical calculation, as shown in Table 2, determined by the calculation algorithm presented above.
Excitation energy
T
ΔE(T2-Emission level)
1
2
Eu3+(5D1 19027))
Eu3+(5D0 17250))
H(ac-ala)
12083.8
25832.3
6805
8582.3
8492.8
8367.8
8287.9
8321.8
8373.4
H(but-ala)
12257.2
25742.8
6715
H(hex-ala)
12178.9
25617.8
6590
H(oct-ala)
12178.9
25537.9
6510
H(dec-ala)
12178.9
25571.8
6544
H(dod-ala)
12184.6
25623.4
6596
According to the Dexter electronic exchange mechanism principle(Zhang et al., 2012): the triplet state energy level of the ligand needs to be 2000–––5000 cm−1 higher than the lowest excited state energy level of the rare earth ion to carry out effective energy transfer, otherwise it will lead to an inverse transfer of energy. It can be seen from Table 2 that the difference between the triplet energy level of the ligand compound corresponding to each complex and the lowest excited state energy level of the europium ion is far higher than the range of effective energy transfer, which leads to low energy transfer efficiency.
3.3.2 CIE color coordinates and color temperature
From the emission spectrum data of the complexes, chromaticity coordinates were analyzed, and the CIE diagram was drawn, as shown in Fig. 6. The color parameters for synthesized complexes are located within the red region of the CIE triangle. From the CIE coordinates (x, y) of the complexes, the color coordinates (u ', v'), the correlated color temperature(CCT) and the value of color purity in the synthesized complexes was estimated. Several optical parameters of the complexes are presented in Table 3.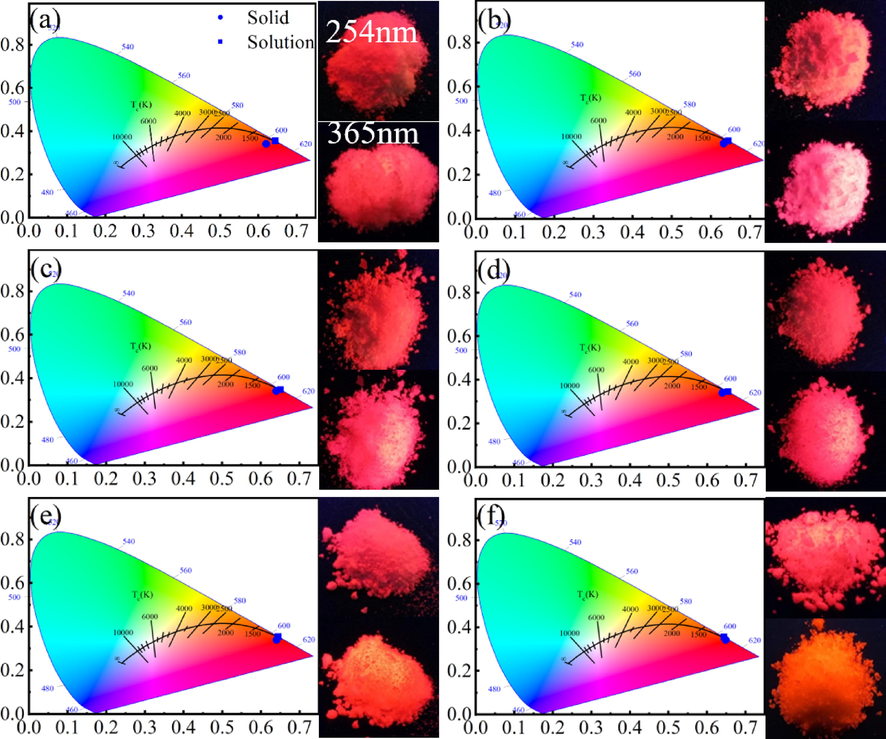
Real object diagram of rare earth europium complex CIE and luminescence (a)Eu(ac-ala)3; (b)Eu(but-ala)3; (c)Eu(hex-ala)3; (d)Eu(oct-ala)3; (e)Eu(dec-ala)3; (f)Eu(dod-ala)3.
(x,y)
(u’,v’)
CCT/K
CP/%
Eu(ac-ala)3
(0.551,0.331)
(0.375,0.507)
1860
65.07
Eu(but-ala)3
(0.633,0.342)
(0.434,0.527)
2544
89.62
Eu(hex-ala)3
(0.640,0.342)
(0.439,0.528)
2632
91.71
Eu(oct-ala)3
(0.639,0.340)
(0.441,0.527)
2677
91.39
Eu(dec-ala)3
(0.640,0.340)
(0.441,0.527)
2700
91.68
Eu(dod-ala)3
(0.648,0.343)
(0.445,0.530)
2723
94.10
The CCT is an imperative luminescence indicator related to the measurement of temperature and color of lighting sources. Their values for the complexes reflect their application significance. It can be seen from Table 3 that the color purity (CP) and CCT of the complexes increase with the length of the carbon chain of the ligand.
3.3.3 Luminescence lifetime, efficiency, and Judd-Ofelt parameters
The luminescence lifetime and quantum yield tests of the complexes were carried out to assess their luminescence lifetime and quantum yield which are important indicators for the luminescence performance of substances., The luminescence lifetime curve is shown in Fig. 7. Luminescence lifetime curves were fitted to a double exponential equation:
, where
and
are luminescence lifetimes,
,
, and
are (amplitudes A and initial intensity I) fitting parameters. Then the final luminescence lifetimes of the six complexes were obtained by the equation for the mean lifetime:
. The test results are shown in Table 4.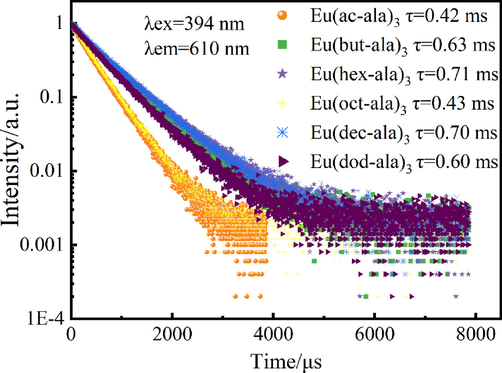
Luminescence lifetime diagram of rare earth europium complexes.
τ /ms
Arad (s−1)
Anrad (s−1)
η (%)
Ω2 (×10-20 cm2)
Ω4 (×10-20 cm2)
Eu(ac-ala)3
0.4
339.7
2041.3
14.3
0.31
0.27
Eu(but-ala)3
0.6
319.4
1267.9
20.1
0.29
0.27
Eu(hex-ala)3
0.7
319.1
1089.4
22.7
0.31
0.23
Eu(oct-ala)3
0.4
367.4
1958.2
15.8
0.36
0.26
Eu(dec-ala)3
0.7
406.8
1021.8
28.5
0.41
0.28
Eu(dod-ala)3
0.6
413.5
1253.7
24.8
0.38
0.35
The coordination environment in the complexes around the Eu3+ ion was determined using the Judd-Ofelt theory. Photoluminescence data were utilized to determine the J-O parameters and transition rates. Radiative transition rates, nonradiative rates, the fluorescence branching ratio that depicts the involvement of each transition as the percentage of radiative decay rate of the complexes, and several experimentally determined photophysical parameters such as decay time, and quantum efficiency, are presented in Tables 4 and 5.
/ %
β(5D0→7F0)
β(5D0→7F1)
β(5D0→7F2)
β(5D0→7F3)
β(5D0→7F4)
Eu(ac-ala)3
1.17
14.72
57.85
2.24
24.02
Eu(but-ala)3
0.69
15.65
56.57
1.66
25.42
Eu(hex-ala)3
0.81
15.67
59.26
2.01
22.25
Eu(oct-ala)3
0.82
13.61
62.6
1.85
21.12
Eu(dec-ala)3
0.84
12.29
63.96
2.11
20.79
Eu(dod-ala)3
1.04
12.09
58.96
2.18
25.61
3.4 Performance analysis of the complexes in the solution
3.4.1 The dissociation of metal complexes in the solution
The degree of aggregation/diffusion of the metal complexes in methanol solution was obtained by measuring the self-diffusion coefficient of the europium complexes. The decrease in the solute self-diffusion coefficient indicates an interaction between solute and soluteAziz et al., 1971. Fig. 8 shows the conductivity of the three europium complexes, Eu(ac-ala)3, Eu(hex-ala)3, and Eu(dec-ala)3, in methanol as a function of the concentration of the complex. The magnitude of the conductivity in solution at lower concentration ranges of the europium complexes is in the order of Eu(ac-ala)3 > Eu(dec-ala)3 > Eu(hex-ala)3. As the concentrations increase to about 0.002–––0.012 mol/L, the conductivities of all three Eu3+ complex solutions increase indicating that dissociation occurs in the complex solutions. When the concentration is higher than 0.014 mol/L, with increasing molar mass concentration, the conductivities of the Eu(ac-ala)3 solution start to decrease. This is due to the aggregation behavior of metal ions and ligand ions in solution forming aggregate states(Naren et al., 2009; Naren et al., 2008). However, the complexes with longer carbon chains are less prone to form aggregate states.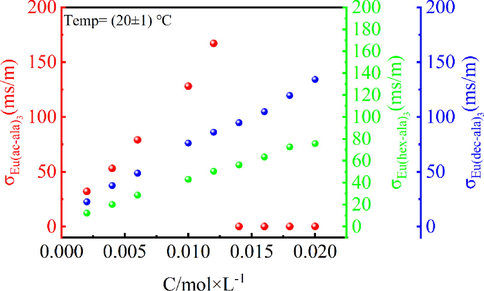
Electric conductivities (σ) of Eu(ac-ala)3, Eu(hex-ala)3, and Eu(dec-ala)3 in methanol as a function of the concentration (C) of the complex.
3.4.2 The effect of the solution concentration on fluorescence performance
Fig. 9 shows the luminescence intensity of the complexes, (a) Eu(ac-ala)3, (b) Eu(hex-ala)3, and (c) Eu(dec-ala)3. The luminescence intensity of all three complexes increases as the molar concentration increases. This is caused by an increase in the number of luminescent particles. The fluorescence lifetime of the complexes also varies with concentration, as shown in Fig. 10, indicating that as the concentration increases to about 0.002–––0.012 mol/L, the fluorescence lifetime of the Eu(ac-ala)3 also increases. When the concentration is higher than 0.014 mol/L, as the molar concentration increases, the conductivities of the Eu(ac-ala)3 solution start to decrease, as shown by the dissociation of metal complexes in the solution that form an aggregated state of Eu(ac-ala)3 at 0.014 mol/L. At this time, the Eu3+ ions are aggregating, one of the excited Eu3+ ions (ion 1) transfers energy to another nearby ion (ion 2) through cross-relaxation, ion 1 returns to the ground state in a radiationless decay and ion 2 is excited to a higher energy level, which results in a decrease of the original radiation transition, manifested as a decrease in fluorescence lifetime(Meert et al., 2014). This trend of the fluorescence lifetime for Eu(hex-ala)3 reaches a plateau and remains unchanged with further increasing concentration. It can be inferred that complexes with longer carbon chains are less prone to aggregation in solution (increasing repulsive forces with increasing hydrophobicity), and the concentration, where fluorescence quenching occurs, is higher.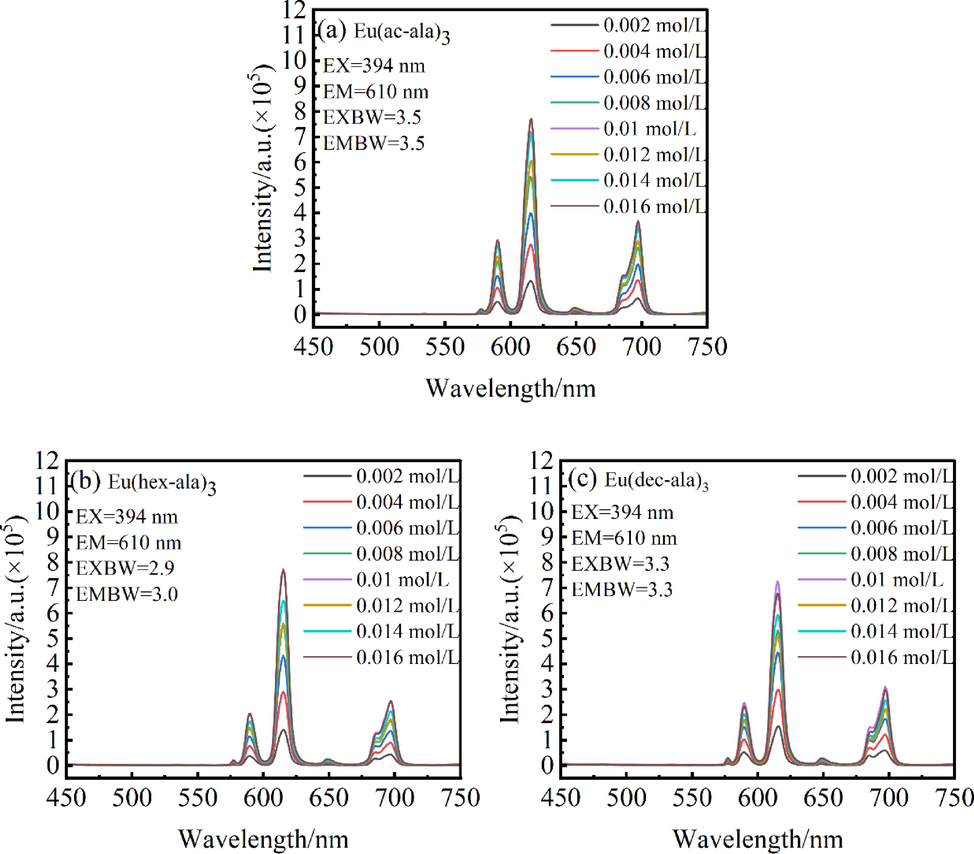
Luminescence intensity of complexes as a function of concentration.
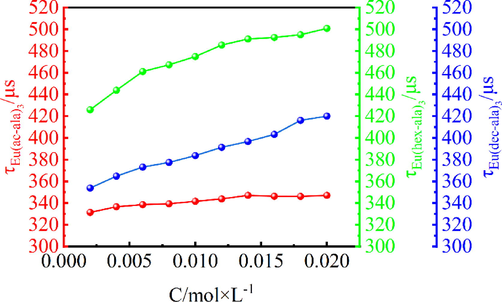
Fluorescence lifetime in solution as a function of concentration.
3.4.3 Solvent effect on the fluorescence performance of complexes with different carbon chain lengths
In order to explore the solvent effects on the luminescence properties of the complexes with different carbon chain lengths, the luminescence spectrum of a methanol solution (0.01 mol/L) of the complexes was studied, and the results are shown in Fig. 11. A comparison of Fig. 11(a) with Fig. 4(b)shows that the optimal excitation wavelength of the complex solution was still 394 nm. Nevertheless, the total luminescence peak generated at 200–––250 nm by the energy transfer from the ligand compounds to the rare earth ion disappeared; instead, a smaller total luminescence peak appeared in the range of 250–––275 nm. This phenomenon can be attributed to the dissolution of the complex in methanol, where the methanol molecules formed a “solvent cage” around the complex. During the entire excitation and emission process, the solvent molecules would participate in the energy adjustment process(Jin, n.d.), causing a reduction in the energy level of the ligand compounds. Consequently, less excitation energy is required, leading to a redshift in wavelength. In addition, the above analysis shows that the energy transfer efficiency between the energy level of the ligand compound and Eu3+ was low, and the energy absorbed by the ligands was mainly dissipated through the rotation of their own functional groups and the vibration of the carbon chains. Furthermore, the complex molecules could rotate freely in the solution, which enhanced the energy dissipation of the complex molecules, leading to a decline in the total amount of luminescence generated by the energy transfer from the ligands to the Eu3+ ion. As shown in Fig. 11(b), no significant difference has been observed in the luminescence intensities of the Eu3+ complexes, which was different from the solid luminescence spectrum. As mentioned above, the asymmetric environment of Eu3+ increases the luminescence intensity of the Eu3+ ultra-sensitive transition, which led to the difference in the luminescence intensity of Eu3+ complexes in the solid spectra. However, in the solution spectra, the complex was dissolved in methanol. The methanol molecule coordinated with Eu3+, which changed the coordination environment of the complex(Kropp and Windsor, 1965), thus reducing the difference in luminescence intensity between the complexes. As can be seen from the luminescence curve in Fig. 11(b), the coordination environment of Eu(ac-ala)3 in solution seemed to contribute to the transition from 5D0→7F4, resulting in a transition peak intensity that was higher than those of other complexes, and in a large change in the fluorescent color of the solution compared with that of the solid state (see Fig. 6(a)).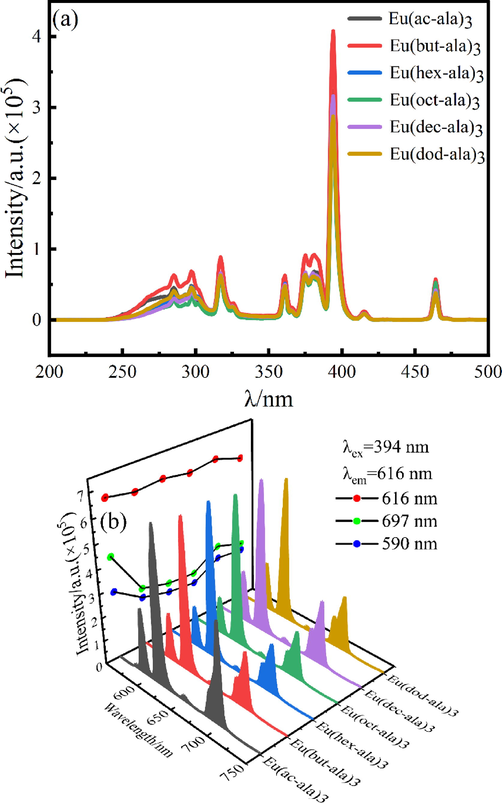
Luminescence spectra of europium complexes in methanol solution (a) excitation spectrum; (b) Emission spectrum.
3.5 Variable temperature spectral analysis
The thermal stability of fluorescent substances is an important index for the service life and luminescent properties of LEDs. Generally, the use temperature of the LED is about 150 °C(Gu, 2019). Under the optimal excitation and emission wavelengths of the complex, the variable temperature spectra were studied in the range of 25–––160 °C, and the test results are illustrated in Fig. 12 below. It is evident that within the studied temperature range, the six complexes could be divided into three groups according to the trends of the luminescence intensity variation with temperature: (I) Eu(ac-ala)3 showed a trend of first decreasing luminescence intensity, then increasing and then again decreasing; (II) the luminescence of Eu(oct-ala)3 and Eu(dec-ala)3 increased first and then decreased; (III) Eu(but-ala)3, Eu(hex-ala)3 and Eu(dod-ala)3 declined first, then remained stable and then again decreased; the luminescence intensity of the complexes changed little in the low-temperature region (20–––60 °C). The unique energy level structure of Eu3+ is shown in Fig. 13(a). When the difference between adjacent energy levels of rare earth ions is small (500–––2000 cm−1), photons at the adjacent energy levels can be added to saturate the atomic orbitals or removed with the change of temperature of the fluorescent substance. These adjacent energy levels are thermally coupled energy levels(Wang et al., 2015; Dramićanin, 2016). The 5D0 and 5D1 of Eu3+ were thermally coupled energy levels, consequently, their corresponding luminescence peak intensities would change with temperature. At high temperatures, the energy of two rare earth ions can be attenuated by cross-relaxation(Meert et al., 2014), as shown in Fig. 13(b). The photon absorption energy on ion 1 5D0 jumped to the 5D1 level, and then ion 1 transferred its energy at the 5D1 level to ion 2. Ion 1 returned to the ground state, and ion 2 was excited to the 5D1 level, which enhanced the luminescence emission from 5D1. Thus, with rising temperature, the 5D1→7FJ transition increased, and the 5D0→7FJ transition intensity decreased. As mentioned above, the 610 nm peak was attributed to the 5D0→7F2 transition, and the 534 nm peak to the 5D1→7F1 transition. Therefore, the intensities corresponding to the 610 nm and 534 nm peaks of the complex as a function of temperature were compared, to investigate the reasons for the change in the luminescence intensity of the complexes (Fig. 14).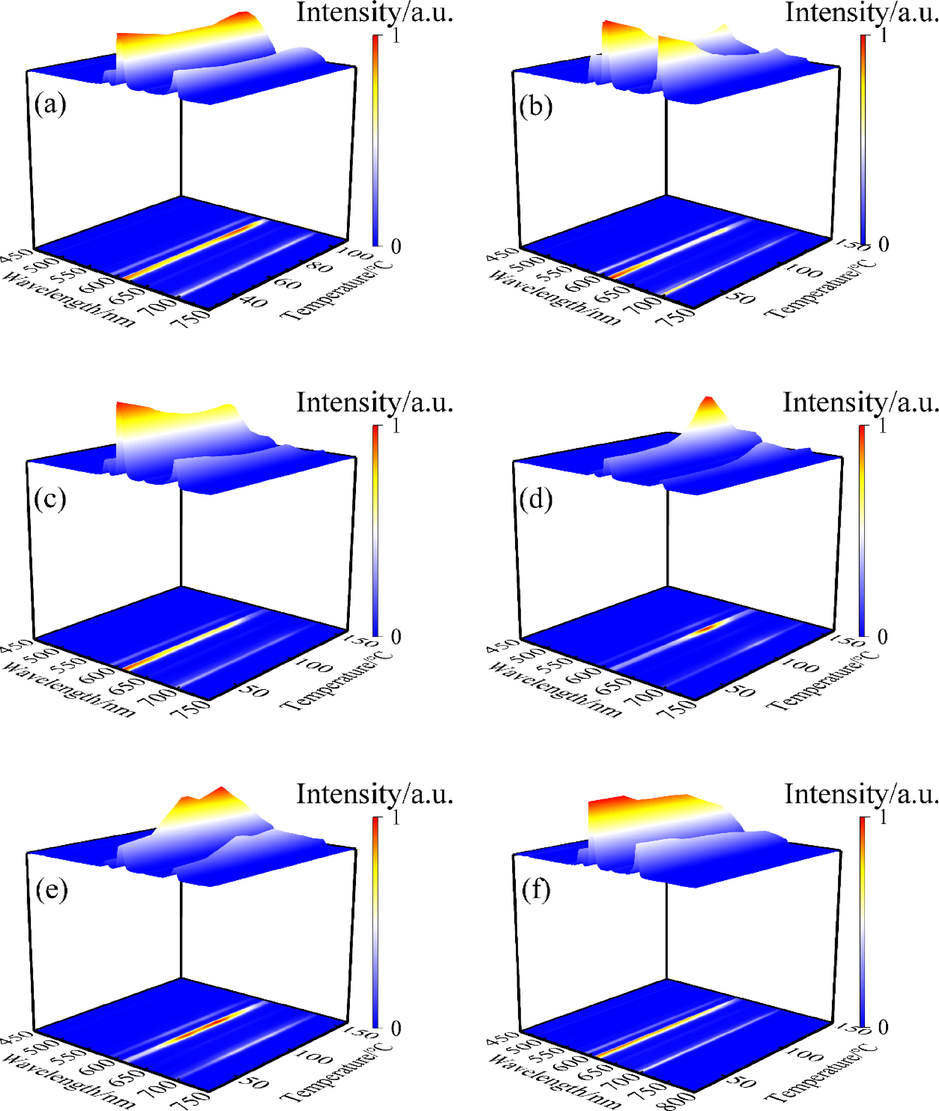
Variable temperature spectrogram of the complexes:(a) Eu(ac-ala)3; (b) Eu(but-ala)3; (c) Eu(hex-ala)3; (d) Eu(oct-ala)3; (e) Eu(dec-ala)3; (f) Eu(dod-ala)3.
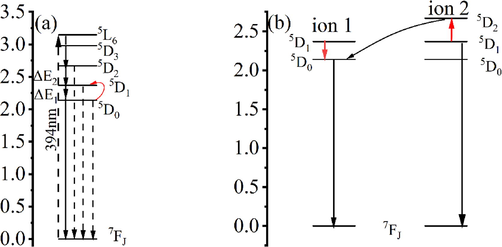
(a) Variable temperature energy transfer diagram of the Eu3+complex; (b) Schematic diagram of Eu3+cross relaxation.
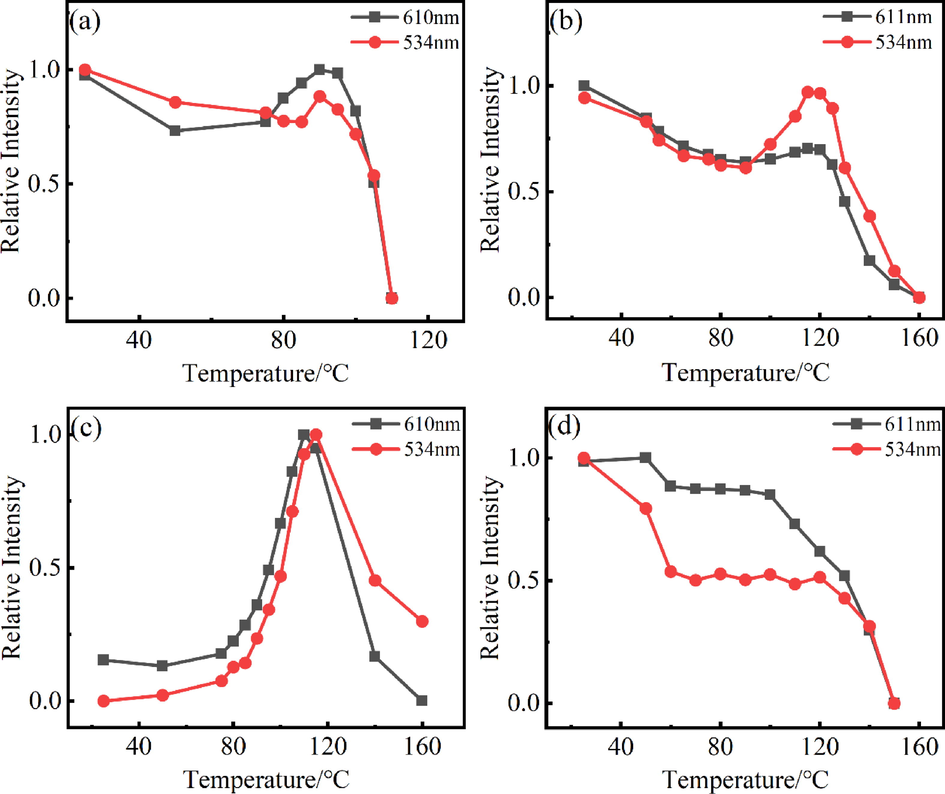
Graphs showing the temperature-dependent luminescence intensity of the rare earth europium complexes at different wavelengths. (a)Eu(ac-ala)3; (b) Eu(hex-ala)3; (c) Eu(oct-ala)3; (d) Eu(dod-ala)3.
The luminescence intensity curves of 610 nm and 534 nm peaks of the complex were increasing and decreasing at the same time, which seemed to be inconsistent with the trend of luminescence intensity variation at the thermally coupled energy level. In this regard, the author puts forward two points of view. (1) When the complex was in a low-temperature range, 5D0 and 5D1 had an uncoupling relationship, which increased the probability of non-radiative transition of the complex with rising temperature, and the luminescence intensity of the complex decreased. When the two energy levels reached the coupling temperatures, the two ions increased the transition probability of 5D1 by cross-relaxation, resulting in an increase in the intensity of the 534 nm transition peak corresponding to 5D1→7F1. Since the energy difference between 5D1 and 5D0 was ΔΕ1 = 1885 (+/-100) cm−1, and the energy difference between 7F2 and 7F4 was 2064 cm−1, the transition wavelength of 5D1→7F4 was similar to that of 5D0→7F2. Thus, when 5D1 of Eu3+ was the main emission level, the 5D1→7F4 transition supplemented the missing 5D0→7F2 transition, leaving the 610 nm unchanged or enhancing its intensity. Whether the peak intensity was enhanced depended on whether the coordination environment of the complex was suitable for the 5D1→7F4 transition. As mentioned above, the 5D0→7F4 transition of Eu(ac-ala)3 was enhanced in the solution. The coordination environment of this complex in a molten state was similar to that in solution, so its 5D1→7F4 transition was stronger, and its corresponding 610 nm peak was stronger as well, while the intensity of the 534 nm transition peak corresponding to 5D1→7F1 increased only slightly, as shown in Fig. 11(a). For the complexes whose coordination environment was not suitable for the 5D1→7F4 transition, the increase in its 610 nm peak intensity was small, whereas the increase in the 534 nm peak intensity corresponding to 5D1→7F1 was large, as shown in Fig. 14(b). (2) The second proposed mechanism is that the photon absorption energy on ion 1 5D0 jumped to the 5D1 level and transferred energy to ion 2 through cross-relaxation. However, different from the above process, the energy on ion 1 5D1 was transferred to ion 2, causing the transition of photons on ion 2 from 5D1 to 5D2. As shown in Fig. 10(a), ΔΕ2 (2153 cm−1) was the energy level difference between 5D1 and 5D2. Although ΔΕ2 > ΔΕ1, the temperature supplemented the energy required for the photon transition, and the photon on 5D1 jumped to 5D2. The photon on ion 1 was deexcited to the 5D0 level, and the energy on ion 2 5D2 was transferred back to the ion 1 5D0 level. At this time, there were “two” photons on the 5D0 level, enhancing the transition peak corresponding to 5D0, or keeping it unchanged. This process is similar to a photon avalanche (Chivian et al., 1979). Whether the corresponding transition peak was enhanced depended on the energy transfer from 5D2 to 5D0. According to the excitation spectrum of the solid shown above, the 464 nm (7F0→5D2) absorption peak could also generate the 5D0→7F2 (610 nm) transition (energy was transferred to 5D0 by non-radiative transition). The total luminescence peak generated was determined by the energy transfer efficiency from 5D2 energy level to 5D0. Therefore, the intensity of I (464 nm/394 nm) was used to assess the probability of a 5D0→7F2 (610 nm) transition, and to measure the energy transfer efficiency from the 5D2 energy level to 5D0. The results are as follows: IEu(ac-ala)3 = 0.5017; IEu(but-ala)3 = 0.4086; IEu(hex-ala)3 = 0.3819; IEu(oct-ala)3 = 0.5170; IEu(dec-ala)3 = 0.6138; IEu(dod-ala)3 = 0.5359. It can be seen that the values of Eu(ac-ala)3, Eu(oct-ala)3, Eu(dec-ala)3 and Eu(dod-ala)3 were large, indicating that “more” 5D0→7F2 (610 nm) transitions were generated at the 5D2 energy level. Therefore, within a certain temperature range, the 5D0→7F2 (610 nm) transition peak was enhanced or modified slightly with temperature.
4 Conclusions
The theoretical structures of the complexes were obtained by the density functional theory (DFT), and the theoretical structure of the complex was confirmed to be reliable by the comparison of theoretical and experimental vibrational spectroscopy and by 1H NMR analysis.
The light absorption capacity of the rare earth complex was primarily due to the ligand compounds, which had good absorption capacity in the range of 200 ∼ 300 nm. The carbon chain length had little effect on the light absorption performance of the complex. The 7F0→5L6 transition absorption of Eu3+ could be observed in the absorption spectrum, and its absorption peak was 394 nm, but the absorption intensity was extremely low. The excitation and emission spectra of the solid complex and europium chloride were obtained by luminescence spectroscopy studies. The spectra showed that the optimal excitation value of the complex was 394 nm, attributed to the characteristic excitation value of Eu3+ itself. A total luminescence peak was generated by energy transfer from the ligand to the Europium ion in the range of 200–––250 nm in the excitation spectrum of the complex, indicating that the ligand compound could transfer energy to the Europium ions. However, the transfer efficiency was low leaving the optimal excitation value of the complex unchanged. A comparison of the luminescence intensity of the complexes and EuCl3 in the emission spectrum showed that the acyl amino acid ligand could sensitize luminescence, resulting in different luminescence intensities of each complex due to the influence of the different ligand fields.
Studies of conductivity and fluorescence lifetime in solution with different concentrations showed that Eu(ac-ala)3 exhibits aggregation at 0.014 mol/L, resulting in a decrease in its fluorescence lifetime. It can be inferred that complexes with longer carbon chains are less prone to aggregation in solution, and the concentration of fluorescence quenching is higher. The luminescence spectral analysis results of the methanol solution (0.01 mol/L) of the complex showed that the optimal excitation value of the solution spectrum remained at 394 nm. However, due to the solvent effect, the emission peak of the emission spectrum showed a redshift (610 → 616 nm), which led to the change of the luminescence color of the complex, and a redshift of the total luminescence peak corresponding to the ligand in the excitation spectrum. Differences in luminescence intensity between the complexes diminished due to the coordination of solvent molecules. The luminescent properties of the complexes as a function of temperature were studied by variable temperature spectroscopy. According to the different trends in the variation, the six complexes could be divided into three groups: Eu(ac-ala)3 showed a trend of first decreasing, then increasing, and then again decreasing luminescence. Eu(oct-ala)3 and Eu(dec-ala)3 showed a trend of first increasing and then decreasing luminescence; Eu(but-ala)3, Eu(hex-ala),3 and Eu(dod-ala)3 showed an initial trend of first decreasing luminescence, which remained steady first and then decreased. The analyses showed that the luminescence intensity of the complex changed little in the low-temperature region because 5D0 and 5D1 of Eu3+ had an uncoupling relationship at low temperatures. As the temperature rose, however, the two energy levels were thermally coupled. In this case, the energy could be exchanged and transferred between the energy levels, and then deexcited through cross relaxation or similar mechanisms, i.e., photon avalanche, resulting in a change of luminescence peak intensity. Moreover, due to the influence of the ligand fields of the different complexes, the trends of luminescence peak intensity with temperature change were different.
These rare earth amino acid complexes with excellent properties have great application potential in chemistry, biology, and materials science.
Acknowledgment
This project is supported by the National Science Foundation of China (Grant No. 21663018) and the Research Program of Science and Technology at Universities of Inner Mongolia Autonomous Region (Grant No. NJZZ23020).
Declaration of Competing Interest
The authors declare that they have no known competing financial interests or personal relationships that could have appeared to influence the work reported in this paper.
References
- (a) The complexation of alaninate with europium(III) has been studied in aqueous solution: A. Aziz, S. J. Lyle and J. E. Newbery, J. Inorg. Nucl. Chem., 33 (1971), 1757; (b) A. Aziz and S. J. Lyle, J. Inorg. Nucl. Chem., 33(1971), 3407.
- Synthesis, crystal structure, and luminescent properties of novel Eu3+ heterocyclic β-diketonate complexes with bidentate nitrogen donors. Inorg. Chem.. 2006;45:10651-10660.
- [Google Scholar]
- Influence of dipicolinate ligands on the spectroscopic properties of europium (III) in solution. Chem. Phys. Lett.. 1997;266:297-302.
- [Google Scholar]
- Investigation of red-emission phosphors (Ca, Sr)(Mo, W) O: Eu3+ crystal structure, luminous characteristics and calculation of Eu3+ 5D0 quantum efficiency. Thin Solid Films. 2011;519:7971-7976.
- [Google Scholar]
- The photon avalanche: A new phenomenon in Pr3+-based infrared quantum counters. Appl. Phys. Lett.. 1979;35:124-125.
- [Google Scholar]
- Influence of the anionic zinc-adeninate metal–organic framework structure on the luminescent detection of rare earth ions in aqueous streams. ACS Appl. Mater. Interfaces. 2021;13:7268-7277.
- [Google Scholar]
- M.T. de Oliveira, J.l.M. Alves, A.A. Braga, D.J. Wilson, C.A. Barboza, Do double-hybrid exchange–correlation functionals provide accurate chemical shifts? A benchmark assessment for proton NMR, J. Chem. Theory Comput., 17 (2021) 6876-6885.
- Spectroscopic properties and design of highly luminescent lanthanide coordination complexes. Coord. Chem. Rev.. 2000;196:165-195.
- [Google Scholar]
- Spectroscopic properties and design of highly luminescent lanthanide coordination complexes. Coord. Chem. Rev.. 2000;196:165-195.
- [Google Scholar]
- Sensing temperature via downshifting emissions of lanthanide-doped metal oxides and salts. A review. Methods Appl. Fluoresc.. 2016;4:042001
- [Google Scholar]
- M.J. Frisch, G.W. Trucks, H.B. Schlegel, e. al., Gaussian 09W program, Gaussian Inc., 2009.
- Preparation and luminescent properties of Eu (Ⅲ) organic complex and novel transparent ethylene-methyl acrylate copolymer (EMA) films doped with complexes. Opt. Mater.. 2018;85:193-199.
- [Google Scholar]
- Synthesis and photoluminescence properties of novel Schiff base type polymer-rare earth complexes containing furfural-based bidentate Schiff base ligands. Opt. Mater.. 2018;77:77-86.
- [Google Scholar]
- Preparation and spectral properties of narrow-band rad phosphors for W-LED. Taiyuan University of Technology; 2019.
- Influence of post annealing treatments on the luminescence of rare earth ions in ZnO: Tb, Eu/Si heterojunction. Appl. Surf. Sci.. 2021;556:149754
- [Google Scholar]
- Preparation and photoluminescent analysis of Sm3+ complexes based on unsymmetrical conjugated chromophoric ligand. J. Mater. Sci. Mater. Electron.. 2022;33:11132-11142.
- [Google Scholar]
- Red-emitting β-diketonate Eu (III) complexes with substituted 1, 10-phenanthroline derivatives: optoelectronic and spectroscopic analysis. J. Fluoresc.. 2022;32:1413-1424.
- [Google Scholar]
- Effect of doping ions on properties of the white-light long-lasting phosphor Y2O2S: Tb3+, Eu3+, M2+(M=Mg, Ca, Sr, Ba), Zr3+. Chin. J. Lumin.. 2013;34:262.
- [Google Scholar]
- Formation of molecular glasses of (N-acylalaninato) europium (III) complexes and the luminescence properties. J. Alloy. Compd.. 2006;408:1022-1025.
- [Google Scholar]
- Synthesis and luminescence properties of beta-NaYF(4) doped with Eu (3+) and Tb (3+) Chin. J. Lumin.. 2012;33:683-687.
- [Google Scholar]
- W.J. Jin, Molecular Emission Spectrometric Analysis, Anal. Chem., 46 (1068) 1068.
- L. Khan, Z. Khan, Rare Earth Luminescence: Electronic Spectroscopy and Applications, 2018, pp. 345-404.
- L.U. Khan, H.F. Brito, J. Hölsä, K.R. Pirota, D. Muraca, M.C. Felinto, E.E. Teotonio, O.L. Malta, Red-green emitting and superparamagnetic nanomarkers containing Fe3O4 functionalized with calixarene and rare earth complexes, Inorganic chemistry, 53 (2014) 12902-12910.
- Luminescence and energy transfer in solutions of rare-earth complexes. I. Enhancement of fluorescence by deuterium substitution. J. Chem. Phys.. 1965;42:1599-1608.
- [Google Scholar]
- A novel double-perovskite LiLaMgTeO6: Mn4+ far-red phosphor for indoor plant cultivation white LEDs: crystal and electronic structure, and photoluminescence properties. J. Alloy. Compo.. 2020;832:154905
- [Google Scholar]
- Plasmon-Assisted efficiency enhancement of Eu3+-doped tellurite glass-covered solar cells. J. Electron. Mater.. 2017;46:6750-6755.
- [Google Scholar]
- Y.P. Liu, J.X. Liu, Y.H. Sun, e. al., Synthesis and Luminescence of the Solid Ternary Complexes of Pr3+, Eu3+, and Tb3+ with L-Tyrosine and Glycine, Acta Scientiarum Naturalium Universitatis NeiMongol, (1997) 72-75.
- B. Liu, K. Wang, J. Li,et al. The synthesis and luminescent properties of Eu3+ doped Li5La3Ta2O12 garnet phosphor with enhanced red emission and thermally stable. J. Solid. State. Chem, (2022):305.
- Correlated color temperature as an explicit function of chromaticity coordinates. Color Res. Appl.. 1992;17:142-144.
- [Google Scholar]
- M. L. Meena, S. Som, R. Chaurasiya ,et al.Spectroscopic, optical properties and ab-initio calculation of thermally stable Na2Ca1-xP2O7: xEu3+ phosphors for wLEDs .Ceram. Int, 2022(14):48.
- Energy transfer in Eu3+ doped scheelites: use as thermographic phosphor. Opt. Express. 2014;22:A961-A972.
- [Google Scholar]
- Energy transfer in Eu3+ doped scheelites: use as thermographic phosphor. Opt. Express. 2014;22:A961-A972.
- [Google Scholar]
- R. Nagaishi, T. KIMURA, S.P. SINHA, Luminescence properties of lanthanide (III) ions in concentrated carbonate solution, Mol. Phys., 101 (2003) 1007-1014.
- Formation of molecular glasses and the aggregation in solutions for lanthanum(III), calcium(II), and yttrium(III) complexes of octanoyl-DL-alaninate. Dalton Trans.. 2008;13:1698-1709.
- [Google Scholar]
- Aggregation in methanol and formation of molecular glasses for europium (III) N-acylaminocarboxylates: effects of alkyl chain length and head group. Dalton Trans. 2009:5512-5522.
- [Google Scholar]
- Infrared luminescence of chalcogenide glasses doped with rare earth ions and their potential applications. Opt. Mater. X. 2022;15:100168
- [Google Scholar]
- Exploration of newly synthesized red luminescent material of samarium for display applications. Inorg. Chem. Commun.. 2022;139:109361
- [Google Scholar]
- Y.-C. Ning, R.R. Ernst, Structural identification of organic compounds with spectroscopic techniques, Spectroscopy, DOI (2014).
- Y. D. Niu,; Wang, Yu-Zhen; Zhu, Kai-Ming, et al.Thermally enhanced photoluminescence and temperature sensing properties of Sc2W3O12:Eu3+ phosphors. Chinese Physics B ,32(2023):549-554;
- A theoretical and experimental analysis of the luminescent properties of Europium (III) complex sensitized by tryptophan. J. Photochem. Photobiol. A Chem.. 2022;428:113875
- [Google Scholar]
- V. Rajendran, H. Chang, R.S. Liu. Recent progress on broadband near-infrared phosphors-converted light emitting diodes for future miniature spectrometers. Opt. Mate: X, 1(2019): 100011-100011.
- Photoluminescence of rare-earth—doped glasses. La Rivista del Nuovo Cimento. 2005;28:1-53.
- [Google Scholar]
- Synthesis, Structures, optical properties and DFT studies of neodymium complexes containing octanoyl amino carboxylic acids. Opt. Laser Technol.. 2022;155:108445
- [Google Scholar]
- Enhanced two-photon absorption of hypersensitive transitions induced by coordination field in europium (III) complex. J. Lumin.. 2012;132:398-402.
- [Google Scholar]
- Synthesis and investigation of enhanced luminescence of Ln (III)-complexes containing fluorinated β-diketone and oxygen donor ancillary ligands for efficient advanced displays. J. Lumin.. 2020;223:117255
- [Google Scholar]
- Optical transition, electron-phonon coupling and fluorescent quenching of La2 (MoO4)3: Eu3+ phosphor. J. Appl. Phys.. 2011;109:053511
- [Google Scholar]
- Optical temperature sensing of rare-earth ion doped phosphors. RSC Adv.. 2015;5:86219-86236.
- [Google Scholar]
- Preparation and luminescent properties of 1D Lu2O2S: Eu3+ nanorods. Opt. Mater.. 2015;45:131-135.
- [Google Scholar]
- Fluorescent properties of rare-earth complexes and its composites. Beijing University of Chemical Technology; 2010.
- Synthesis, characterization, and luminescence properties of rare-earth europium aromatic carboxylate organic complexes with 1,10- phenanthroline. Acta Opt. Sin.. 2015;35:313-320.
- [Google Scholar]
- Preparation and luminescent properties of the novel polymer-rare earth complexes composed of Poly (ethylene-co-acrylic acid) and Europium ions. Opt. Mater.. 2018;80:65-70.
- [Google Scholar]
- Rapid detection of the biomarkers for carcinoid tumors by a water stable luminescent lanthanide metal–organic framework sensor. Adv. Funct. Mater.. 2018;28:1707169.
- [Google Scholar]
- Application research on the development of latent fingermarks using color tunable LiZnPO4: Eu3+ phosphors. Mater. Today:. Proc.. 2020;22:2544-2549.
- [Google Scholar]
- Novel flavonoid derivatives and their corresponding rare earth complexes: Synthesis and luminescent properties. J. Lumin.. 2021;237:118195
- [Google Scholar]
- C.F. Yu, Application of Judd-Ofelt Theory to Optical Transition of Trivalent Rare Earth Ions, Dalian Maritime University, 2020.
- A systematic study of the optical properties of mononuclear hybrid organo–inorganic lanthanoid complexes. Inorg. Chem. Front.. 2020;7:3049-3062.
- [Google Scholar]
- Synthesis and optical performance of terbium complexes with octanoyl amino acids. Arab. J. Chem.. 2021;14:103033
- [Google Scholar]
- Studies on fluorescence spectra of the solid quaternary complexes of Eu3+, Tb3+ and Dy3+ with L-Proline, L-Alanyl and Glycine. Chin. Rare Earths. 2005;26:83-85.
- [Google Scholar]
- Synthesis, characterization, and DFT studies of praseodymium (III) Octanoyl-DL-aminocarboxylate complexes. ChemistrySelect. 2022;7:e202104100.
- [Google Scholar]
- Synthesis, characteristic and intramolecular energy transfer mechanism of reactive terbium complex in white light emitting diode. J. Rare Earths. 2012;30:10-16.
- [Google Scholar]
- Recent advances in rare-earth doped upconverison materials with thermally-enhanced emissions. Chin. J. Lumin.. 2021;42:13.
- [Google Scholar]


