

Translate this page into:
Studying the kinetic parameters of BaTi5O11 by using the thermoluminescence technique
⁎Corresponding author. ghada_bassioni@eng.asu.edu.eg (Ghada Bassioni)
-
Received: ,
Accepted: ,
This article was originally published by Elsevier and was migrated to Scientific Scholar after the change of Publisher.
Peer review under responsibility of King Saud University.
Abstract
The present study discusses the thermoluminescence (TL) characteristics of monoclinic barium titanate (BaTi5O11) which is chemically prepared using the sol–gel technique. The crystallinity is confirmed by X-ray diffraction, and the oxidation state of each element, morphology, and particle size of the prepared powder are chemically probed by different spectroscopic tools including X-ray Photoelectron Spectroscopy and Energy dispersive X-Ray spectroscopy. The sample is irradiated by a beta (β)-source with different applied doses in the range of 1.1––385 Gy. The kinetic parameters which correspond to the charge carrier traps were determined. The analysis methods indicated that the TL glow curve of BaTi5O11 consists of 6 overlapped peaks corresponding to 6 electron traps. The values for the trap depth are found to be in the range 0.94–1.40 eV and the TL glow peaks are located between 380.4 and 560.5 K. The study confirms the potential of BaTi5O11 for β-dosimetry.
Keywords
BaTi5O11
Sol-gel
Thermoluminescence
Dosimetry

1 Introduction
Thermally stimulated luminescence, simply called thermoluminescence (TL), is the release of stored energy in the form of light within thermal stimulation of the investigated insulator, or semiconductor, following an intake of energy from ionizing radiation such as alpha (α), beta (β), gamma (γ), or cosmic rays (McKeever, 1985; Duragkar et al., 2019; Sarıkcı et al., 2022). During heating, light is stimulated from a material exhibiting TL, and this stimulated and emitted light can be measured as a function of the applied temperature (Jin et al., 2016). The resulting curve is called a glow curve. This curve contains details about traps within the band gap of the investigated material. Moreover, such charge carrier traps are characterized by their kinetic parameters, such as the peak position (Tm), the trap depth, or activation energy (E), the frequency factor (s), and the order of kinetics (b) (Gartia et al., 2020; Souadi et al., 2022). Fluorides, sulfates, borates and sulfides of alkali and alkaline earth elements are the most common and well-researched materials for TL dosimetry. In addition, other phosphors have been developed based on metal oxides and mixtures of metal oxides, halo sulfates and various types of glasses and perovskites (Nieto, 2016; Bekker et al., 2021; Malletzidou et al., 2019; Ikea et al., 2020).
Metal oxides (MOs) are interesting substances for a wide range of applications (Burra et al., 2018; Hussein et al., 2019; Yousef et al., 2021) as they have special optical and electronic properties. In particular, significant chemical stability, high thermal conductivity, high radiation resistance, as well as low permeability to alkali impurities promise applications on metal oxide semiconductor structures (Zhang et al., 2014; Li et al., 2015; El-Shazly et al., 2018).. Mixed metal oxides including Li (Lin et al., 2020), Ba (Yuan et al., 2022) like lithium borate (Li2B4O7) (El-Faramawy et al., 2021; Sanyala et al., 2017), barium zirconate (BaZrO3) (Agrawal, 2018; Bhargavi et al., 2016), barium titanate (BaTiO3) (Singh et al., 2017; Oglakci et al., 2021; Batoo et al., 2021), and zirconium dioxide (Salah et al., 2011; Ananchenko et al., 2022), have been investigated on TL properties and the accompanying kinetic parameters of the traps within the substance. This is particularly useful in evaluating the electrical charges and the capability to obtain these charges (El-Faramawy et al., 2021).
One of the most outstanding metal oxides is monoclinic barium titanate (BaTi5O11) which is a type of ceramic material that has a perovskite structure. It has many properties like low dielectric loss and high dielectric constant that are worth mentioning (Guo et al., 2012), in addition to its less toxic nature as compared to many other ceramics such as lead-based metal oxides (Dumková et al., 2017). It can be used for various applications such as sensors, actuators, capacitors, and memory devices. Moreover, BaTi5O11 nanoparticles can be doped with different elements to modify their properties and enhance their performance (Liu et al., 2020).
Different techniques are used for the synthesis of BaTi5O11. Among other, BaTi5O11 can be prepared by solid-state (Zou and Zhang, 2020), co-precipitation (Aktaş, 2021), hydrothermal (Li et al., 2019), sputtering (Jang et al., 2006) methods as well as sol–gel technique (Chan and Hsu, 2014).
The current study is focusing on BaTi5O11 prepared by sol–gel technique due to the use of non-expensive equipment, low-temperature processing, non-vacuum requirement, and good chemical homogeneity (Tangjuank and Tunkasiri, 2004). A full characterization of the compound is presented. The morphology and crystal structure of BaTi5O11 is determined by different spectroscopic tools.
In order to study the release of energy stored in form of light during thermal stimulation of the samples under investigation, beta irradiation is used to study the Thermoluminescence (TL) response and record the kinetic parameters of the sample by using various methods.
2 Experimental
2.1 Sample preparation
BaTi5O11 was prepared using the sol–gel process of titanium isopropoxide, Ti[OCH(CH3)2]4, 98%, Aldrich, and barium diacetate, Ba(CH3COO)2, 99%, Aldrich as starting materials. 7.497 mL of Titanium isopropoxide was mixed with 50 mL absolute ethanol and 1.2769 g barium acetate was dissolved in 15 mL glacial acetic acid in a separate beaker under magnetic stirring at 50 °C. Then, the barium solution was poured slowly into the titanium mixture, which was then magnetically stirred for 15 min to obtain a uniform solution. Ammonium hydroxide (NH4OH, 1 M) was then added dropwise to the solution and stirred until the gel was completely formed. The obtained gel was filtrated and rinsed with distilled water. After drying for 12 h at 80 °C, the obtained material is grinded to fine powder then calcinated at 800 °C for 2 h. The synthesis is shown in Fig. 1.
Flowchart of synthesis of BaTi5O11 powder using the sol–gel method.
2.2 Material characterization
The crystallinity and phase identification of the prepared powder are obtained by X-ray diffraction (XRD, Bruker-D8 Discover) at room temperature (RT) with X-Ray copper tube, namely, CuKα (λ = 1.54 Å) as a source of radiation with operating current I and voltage V of 40 mA and 40 kV, respectively. To identify the crystalline phase, the obtained XRD pattern is compared to the corresponding JCPDS diffraction data cards. The prepared sample is chemically examined by X-ray Photoelectron Spectroscopy (XPS, Thermo Scientific-K-Alpha) to know more information about the composition as well as chemical state of each element. The morphology of the prepared powder is further investigated using Scanning Electron Microscopy (SEM, ZEISS-EVO 15) equipped with EDX, Energy dispersive X-Ray spectroscopy, that is used to identify any impurities in the prepared sample. Transmission electron microscopy (TEM, JEM-2100) is used to examine the particle shape and size of the sample.
2.3 Thermoluminescence (TL) measurements
A Lexsyg Smart TL/OSL reader was used to record the TL-glow curves at temperatures ranging from ambient (about 300 K) to 723 K with a heating rate of 5 K/s. The TL reading, which was produced in the instrument, employed a contact heating. A beta source (90S/90Y) that produces beta particles with a maximum energy of 2.2 MeV and an irradiation rate of 0.11 Gy/s is integrated into the reader. A standard detection bi-alkaline PMT (Hamamatsu H7360-02) with a sensitivity range of 300–650 nm is used for the measurements. Powder samples of around 20 mg each were used for the TL measurements.
The kinetic parameters can be calculated using kinetic analysis (Furetta, 2010). A special software is used to deconvolute the obtained glow curves into several peaks; each peak corresponds to a certain carrier trap. This TL software is not only used to deconvolute the glow curve, but also to evaluate the TL kinetics for each peak within the curve (M. El–Kinawy, H. F. El–Nashar, N. El–Faramawy, , 2019).
3 Experimental findings
3.1 X-ray diffraction (XRD)
The sample has undergone crystallographic measurements using X-ray diffraction analysis. Analyzing with 2θ from 10 to 70°, the XRD spectrum shows the identified peaks corresponding to monoclinic BaTi5O11 (JCPDS no. 35–0805) (Fig. 2) (Tillmanns, 1969).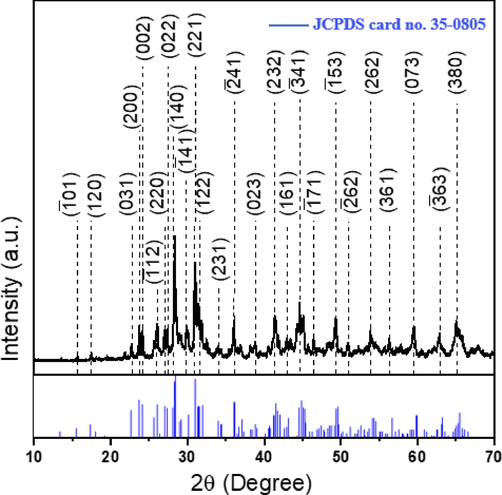
X-ray diffraction pattern for monoclinic BaTi5O11; the miller indices are in parentheses for respective crystal planes. The vertical blue lines represent reference XRD lines from standard samples (JCPDS card no. 35–0805).
The crystallite size (D) of the sample can be estimated by using Scherrer’s equation (Garvie, 1965) as the following:
Where k is a shape factor (0.9), λ is the wavelength of CuKα radiation (0.1544 nm), β hkl is full width at half maximum (FWHM) in radians, and θ the Bragg's angle in radians. The most intense peak (1 4 0) at 2θ = 28.35° was considered for the determination of β hkl (Chavan et al., 2010; Kazan et al., 2016). The FWHM of the XRD was used to calculate the crystallite size according to the previous equation. From the calculations, the crystallite size estimated was ∼ 27 nm.
In monoclinic structure, lattice parameters a ≠ b ≠ c and lattice angles α = γ = 90° and β ≠ 90.
The relation between the d-spacing for monoclinic structure, the lattice parameters (a, b, and c), and the Miller indices (hkl) is given by the following equation (Cullity and Stock, 2001):
The values of a, c, d, and β are determined using this equation:
For (0 2 2) d022 = 3.264
For (0 2 3) d023 = 2.319
(X1) ÷ (X2)
For (0 0 2) d002 = 3.689
Substituting the value of (X4) in equation X3.
b = 14.09 °A.
By the same way β = 98.097°, a = 7.577 °A, and c = 7.453 °A.
3.2 X-ray photoelectron spectroscopy (XPS)
This spectroscopic tool is used for further examination of BaTi5O11 elements. The survey scan spectrum in Fig. 3a shows that high resolution Ti 2p, Ba 3d, and O 1 s photoelectron peaks are observed. As seen in Fig. 3b, Ti 2p peaks can be divided into Ti 2p3/2 and Ti 2p1/2 which appear at 458.2 and 463.9 eV, respectively.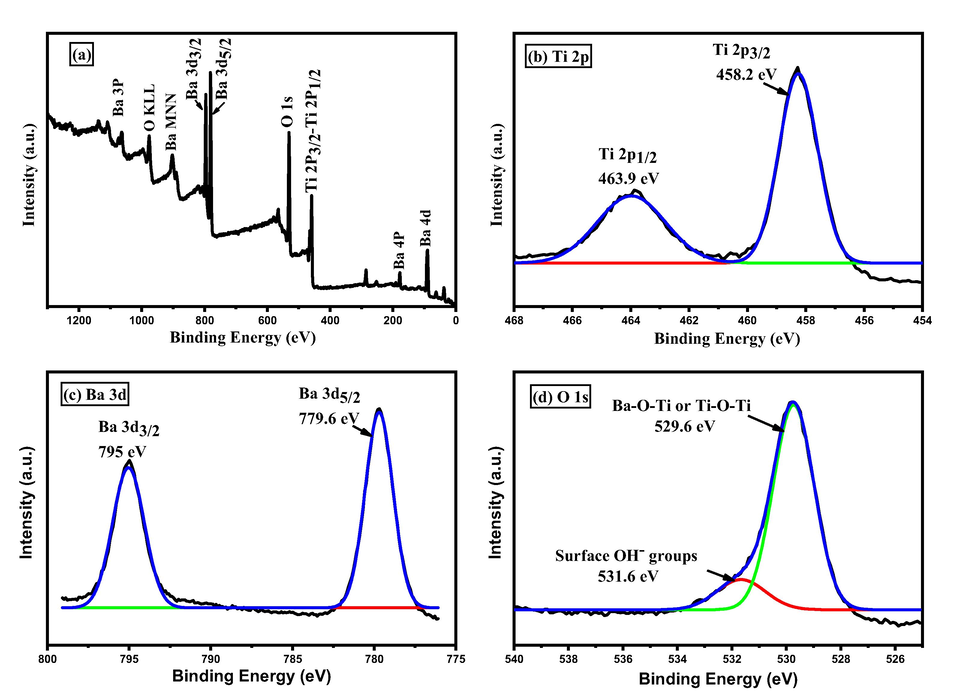
(a) XPS survey scan spectrum of BaTi5O11. (b) XPS scan spectrum of Ti 2p. (c) XPS scan spectrum of Ba 3d. (d) XPS scan spectrum of O 1 s.
These peaks correspond to Ti4+ (Zou et al., 2010). Ba 3d peaks in Fig. 3c are resolved into two components Ba 3d5/2 and Ba 3d3/2 that appear at 779.6 and 795 eV, respectively. These peaks correspond to Ba2+ (Sengupta et al., 2018). Fig. 3d shows the O 1 s spectrum, the main peak at 529.7 eV corresponds to lattice oxygen of Ba-O-Ti or Ti-O-Ti (Nayak et al., 2014) and the shoulder peak at 531.6 eV can be attributed to surface OH– groups from adsorbed water molecules on the surface of the prepared sample (Kong et al., 2015).
3.3 Energy dispersive X-ray spectroscopy (EDX) and scanning electron microscopy (SEM)
The EDX spectrum of BaTi5O11 is shown in Fig. 4a. It verifies the existence of Ba, Ti, and O in the prepared sample. There are no other peaks for any contaminants, which means that the prepared sample is pure. SEM was utilized to characterize the morphology of BaTi5O11. The spectrum shows various shapes and sizes in addition to agglomerated clusters observed in SEM micrographs Fig. 4b and 4c.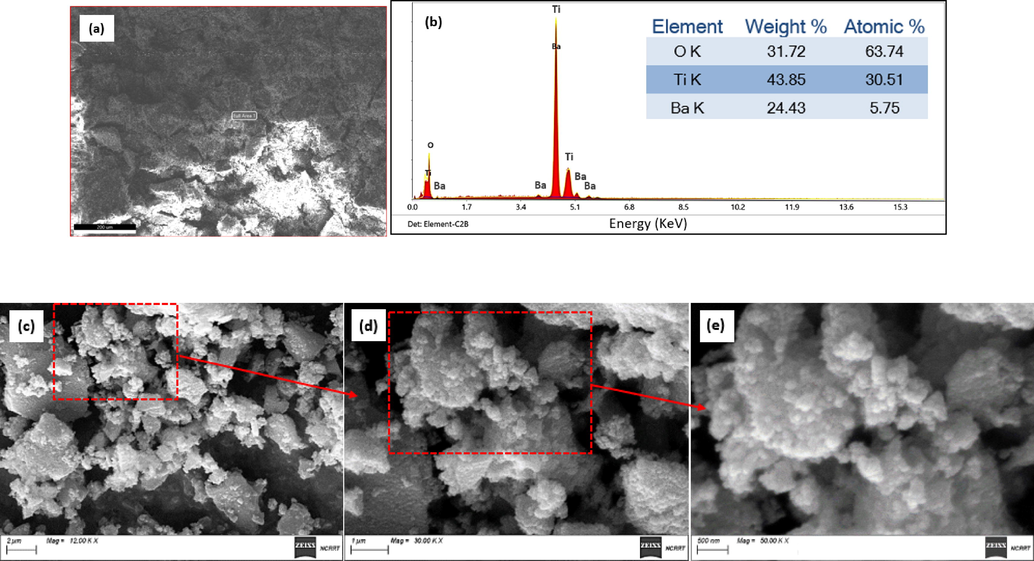
(a), (b) EDX analysis of BaTi5O11 and the corresponding elemental composition. (c), (d) and (e) SEM images of BaTi5O11 where the scale bar is 2 μm, 1 μm, and 500 nm, respectively.
The d- spacing values for planes for h, k, and l Miller indices were determined by using Bragg's law (nλ = 2dhkl sin θ) where n is diffraction order (for first order n = 1), θ is the diffraction angle, and λ is the wavelength of X-ray used (λ = 1.5406 °A) (Le Pevelen, 2010). The peaks position, Miller indices, and d-spacing are listed in Table 1.
2θ (Degree)
Miller indices (hkl)
d- spacing (°A)
2θ (Degree)
Miller indices (hkl)
d- spacing (°A)
15.6
( −1 0 1)
5.675
36.0
( −2 4 1)
2.492
17.4
(1 2 0)
5.092
38.8
(0 2 3)
2.319
22.7
(0 3 1)
3.914
41.3
(2 3 2)
2.184
23.7
(2 0 0)
3.751
43.4
(1 6 1)
2.083
24.1
(0 0 2)
3.689
44.6
( −3 4 1)
2.030
26.1
( −1 1 2)
3.411
46.4
( −1 7 1)
1.955
26.9
(2 2 0)
3.311
49.3
( −1 5 3)
1.846
27.3
(0 2 2)
3.264
50.9
( −2 6 2)
1.792
28.3
(1 4 0)
3.151
53.8
(2 6 2)
1.702
29.8
( −1 4 1)
2.995
56.3
(3 6 1)
1.632
30.97
(2 2 1)
2.885
59.4
(0 7 3)
1.554
31.46
(1 2 2)
2.841
62.84
( −3 6 3)
1.477
33.9
(2 3 1)
2.642
65.0
(3 8 0)
1.433
3.4 Transmission electron microscopy (TEM)
TEM was used to further characterize the shape and size of the prepared BaTi5O11. The TEM images in Fig. 5a and 5b confirm the agglomeration and irregular shape of the particles. The histogram in Fig. 5c shows the particle size of BaTi5O11 between 34 and 102 nm. The average particle size is estimated to be 54 nm. As in Fig. 5d, selected area diffraction (SAD) pattern of BaTi5O11 particles typically display diffraction of a ring pattern, with light and more distinctive points around the ring. This observation refers to the presence of certain large crystals. The rings are still almost continuous, proving that the crystals are in nanometer size.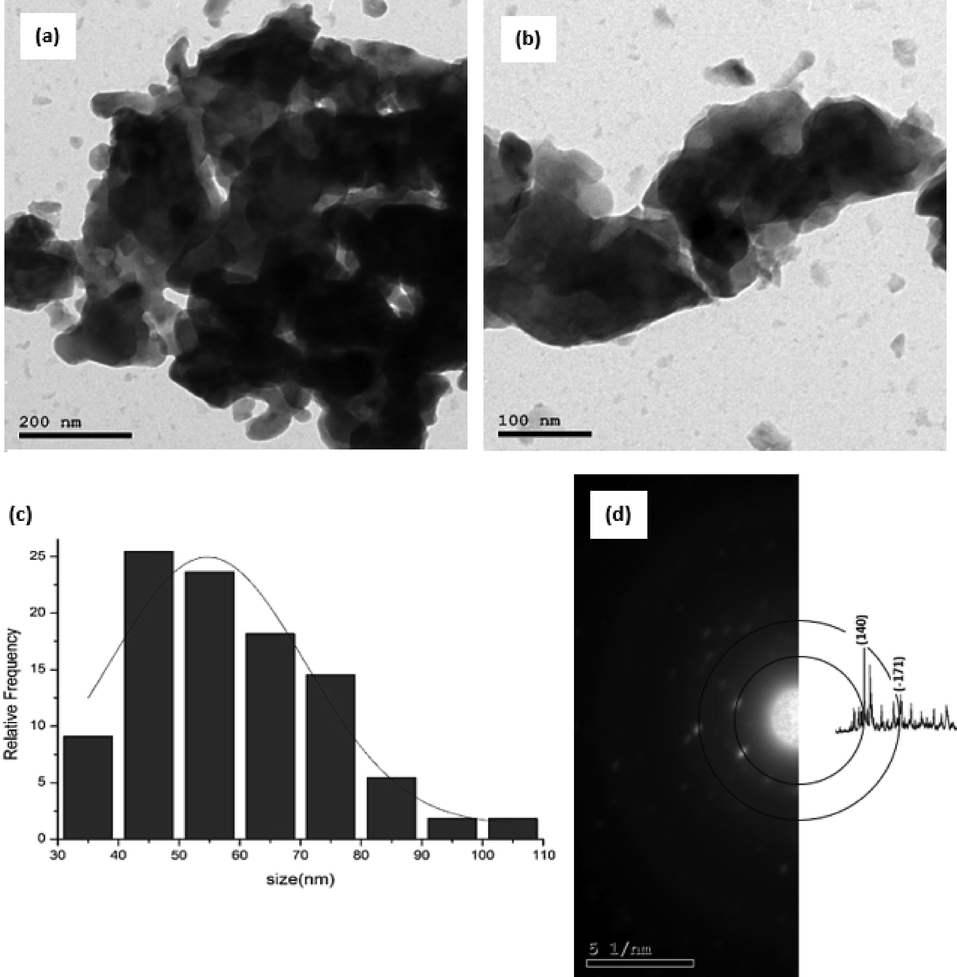
(a) and (b) TEM images, (c) Particle size distribution histogram, (d) selected area diffraction (SAD) of BaTi5O11.
3.5 Diffuse reflectance spectroscopy (DRS)
The DRS spectrum of BaTi5O11 was performed from 200 to 800 nm, as can be seen in Fig. 6. The graph shows variation in optical absorbance with variation in wavelength.
Bandgap calculation for BaTi5O11 by Tauc plot in UV–VIS diffuse reflectance spectrum.
The band gap of BaTi5O11 has been determined from the DRS spectrum using Tauc relation (Tauc et al., 1966):
3.6 Thermoluminescence (TL) measurements
3.6.1 TL glow curve structure
By exposing the samples under investigation to 385 Gy of β radiation, the glow curve structure is obtained. The obtained experimental glow curve is represented in Fig. 7 with both linear and logarithmic scales in the main figure and the inset, respectively. The recorded glow curve displays a rise in TL intensity across low-temperature from 325 − 393 K. Furthermore, the highest intensity is reached at 393 K after which the intensity falls to 493 K. The intensity remains almost the same at temperatures of 493 K to 565 K. Above 565 K, the intensity decreased again and diminished at around 600 K.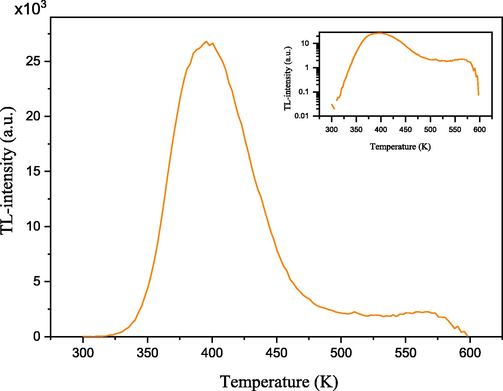
Experimental glow curve (linear and logarithmic scales presented in the main figure and the inset, respectively) obtained from the samples irradiated by beta particles to a dose of 385 Gy.
3.6.2 Tm - Tstop approach
At the range of temperature reported, the glow curve is made up of several glow peaks in the temperature range studied. To estimate the amount of glow peaks with locations that compose the glow curve, the (Tm–Tstop) approach is widely used (Abdou et al., 2022). For this, the sample is exposed to β-radiation (55 Gy). The TL measurement is performed at a rate of 5 Ks−1 and at low temperature (50 °C (323 K), named Tstop), after which the sample is brought to RT. The last step involves collecting the data of the TL glow curve of the cooled sample (2nd TL reading). From the second TL reading, the temperature at Tm, the temperature corresponding to the maximum intensity, is obtained. At a 5 K interval, this procedure is repeated for Tstop from 323 to 460 K and each time the Tm value is recorded. After that, Tm is plotted versus Tstop. Fig. 8 shows the staircase-shape of the Tm-Tstop curve which indicates that the glow curve consists of 6 overlapped peaks.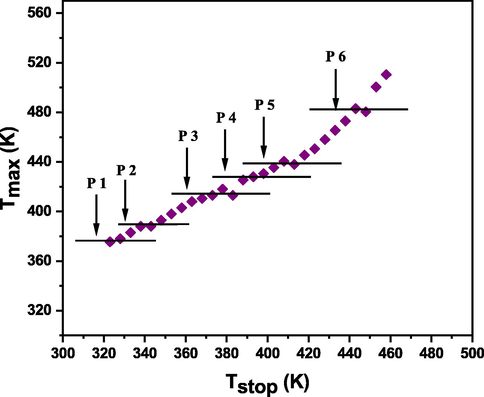
Tm–Tstop plateau of BaTi5O11 samples.
3.6.3 Computerized glow curve deconvolution (CGCD) analysis
CGCD is utilized for the deconvolution of the observed glow curve into its constituent peaks and retrieve the kinetic parameters of the respective traps. The approach is translated into a code using MATLAB (M. El–Kinawy, H. F. El–Nashar, N. El–Faramawy, , 2019). The in-house developed software was used in order to analyze the experimental glow curve of irradiated samples with 385 Gy of β particles (shown in Fig. 7). Analytical data are obtained using the general-order TL deconvolution equation (M. El–Kinawy, H. F. El–Nashar, N. El–Faramawy, , 2019), given by
in which IM is the glow peak’s maximum intensity and TM is the temperature accordingly. The functions
and
are determined as
Where the term is the exponential integral function (Erdelyi, 1954).
E and TM are calculated from the non-linear optimization process enables the calculation of the frequency factor, at maximum intensity, such that
with β being the heating rate.
The deconvolution quality is concluded using the figure of merit (FOM) parameter, defined by (Balian and Eddy, 1977):
According to the results of the Tm-Tstop procedure, the deconvolution analysis method is used for fitting the glow curve with six TL glow peaks and extracting the kinetic parameters of each one. Fig. 9 displays the deconvolution of the glow curve achieved by the CGCD approach. The experimental data and fitted curve are in good agreement, as shown in the lower part of Fig. 9, which is called residue.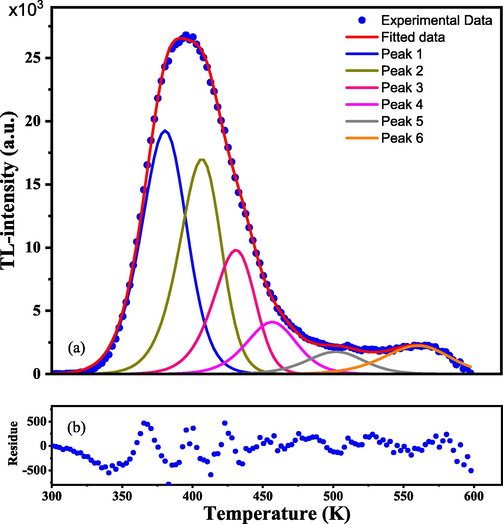
Experimental and deconvoluted glow curves (blue dotted and red curves, respectively) and the glow peaks via the CGCD method. Irradiation of samples by beta particles of a dose of 385 Gy.
Table 2 shows the kinetic parameters of the glow peaks that were retrieved using the CGCD approach, including the trap depth E (eV), frequency factor s (s−1), trap center position Tm (K), and kinetic order (b). Values for the trap depth are in the range 0.94–1.40 eV. It is found that the TL glow peaks are located between 380.4 and 560.5 K. According to the results, the frequency factor values were of orders 12 and 13. According to the b values, all peaks exhibit general order kinetics. The FOM value is below 1%, which is a promising sign of good analysis.
Peak
E (eV)
TM (K)
IM (a.u.)
s (s−1)
Area (a.u.)
b
FOM (%)
1
0.94
380.44
1.9E + 04
9.2E + 11
8.1E + 05
1.50
0.964
2
1.11
406.68
1.7E + 04
2.4E + 13
6.6E + 05
1.37
3
1.22
431.02
9.8E + 03
6.4E + 13
3.8E + 05
1.29
4
1.27
456.68
4.1E + 03
4.0E + 13
1.9E + 05
1.61
5
1.35
502.09
1.8E + 03
1.0E + 13
9.4E + 04
1.61
6
1.40
560.50
2.2E + 03
9.0E + 11
1.3E + 05
1.48
Fig. 10 shows band diagram of the charge carrier traps located at 0.94, 1.11, 1.22, 1.27, 1.35, and 1.4 eV from the bottom of the conduction band minimum (CBM) which was set to 3.39 eV (from Fig. 6). The valence band minimum (VBM) was set to zero eV.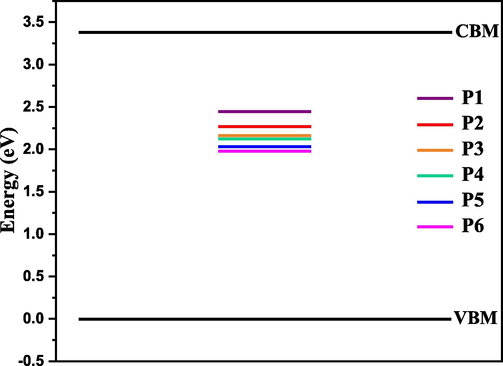
Band diagram of the charge carrier traps located at 0.94, 1.11, 1.22, 1.27, 1.35, and 1.4 eV at conduction band minimum. The valence band minimum was set to zero.
3.6.4 Dose-response linearity
A BaTi5O11 sample was exposed to β-radiation from 1.1 to 385 Gy to explore how the TL light it generates depends on the dose received. A “wide band blue” filter is used to read the associated glow curves. Fig. 11a displays the response of the glow curves obtained. The inset of Fig. 11a represents the dose interaction. For the range of 5.5 – 385 Gy, a linear response by area under the glow curve is observed. Values of the area are fitted to a power function on the form
, with
being the irradiated dose, a and c are fitting parameters.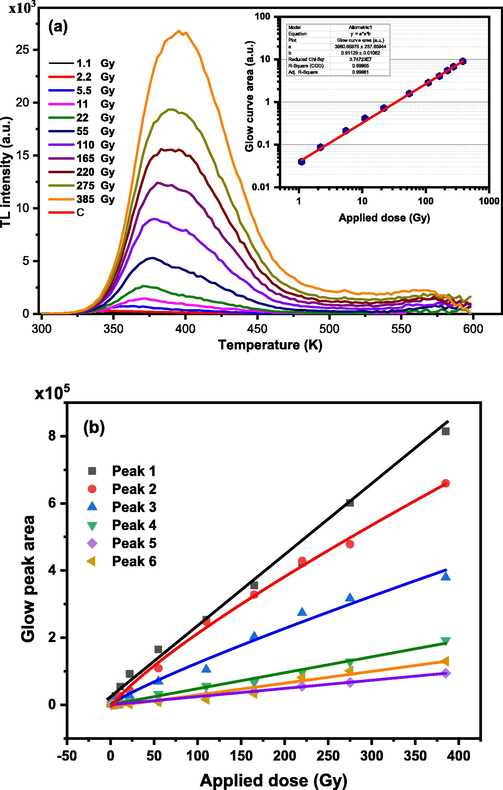
Response of TL of (a) the glow curves & glow curves area (inset in the figure) of the sample after irradiation with beta particles of doses in the range 1.1 – 385 Gy, (b) the area under the glow peaks composing the glow curves extracted after deconvoluting the glow curves using the CGCD method.
The values of a and c obtained from the fitting are 3981 ± 238 and 0.91 ± 0.01. The value of c reflects the linearity behavior in the irradiated dose range. The R2 value of the fitting process is 0.9996.
Deconvolution of the glow curves into their TL peaks as shown in Fig. 11b shows the trend in response to the β dose. Peaks 1, 4, 5, and 6 exhibit a linear dose–response for the whole range of 1.1 – 385 Gy and fit to a linear function of , with A and B being fitting parameters. Peak 2 is fitted to , with c = 0.8. While peak 3 is fitted to , with c = 0.86.
3.6.5 Reusability
To determine whether the sample under study could be used again and still exhibit the same TL glow curve in response to a certain dose, a sample was exposed to a dose of 55 Gy of β radiation, and its TL glow curve was recorded. This step of irradiation (55 Gy)-TL glow curve measurement was then repeated for another nine times. The recorded glow curves exhibited a constant shape and intensity against the applied dose. The glow curves were then deconvoluted to their constituents and the property was tested to the glow peaks. Fig. 12 shows the observed behavior of the glow curves versus the reading cycle. The displayed response by the individual peaks reflects reliability in reusing each peak for β-dosimetric applications.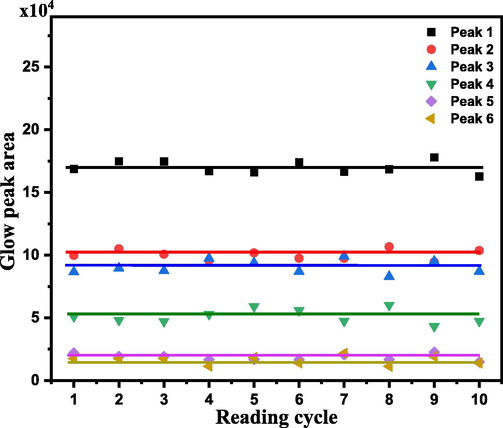
The area under the glow peaks composes the glow curves of the irradiated sample with a 55 Gy dose ten times.
3.6.6 Thermal fading
To study the thermal fading property of the prepared samples, the powder samples were irradiated to a beta dose of 55 Gy and stored in black boxes for different periods before measuring their TL signal. The irradiated samples were stored for 0, 8, 24, 144, and 192 h after which their TL glow curves were recorded. The normalized area below the measured glow curves is shown in Fig. 13. After the storage periods of 8, 24, 144, and 192 h, the fading experiment has revealed that the normalized glow curve area decreased to around 75 %, 56 %, 64 %, and 60 %, respectively, of its value measured at 0 h. The displayed normalized areas of the measured glow curves were fitted to the one-phase exponential decay function of the form
], with y0 being the area offset, A1 being the amplitude, and t1 being a time constant. The values of the fitting parameters are shown as inset in the figure. The decay rate of the TL signal, namely 1/t1, was found to be around 0.144 h−1.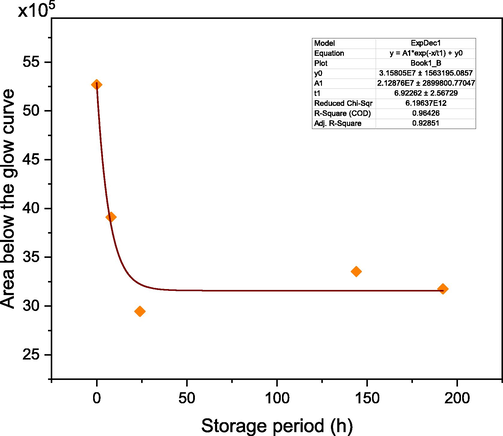
Normalized area below the glow curves of the irradiated samples stored for 0, 8, 24, 144, and 192 h before TL measurement.
4 Conclusions
In this study, BaTi5O11 was prepared by sol–gel technique and characterized by different spectroscopic tools. XRD confirmed the presence of monoclinic phase of BaTi5O11 and XPS has proven the existence of Ti4+, Ba2+, and O2–. The purity of the sample was confirmed by EDX which shows peaks for Ti, Ba, O, and we did not notice any other peaks. SEM and TEM showed the agglomeration and different shapes of the prepared particles.
The Tm-Tstop plateau has proven that the glow curves of the beta irradiated samples compose of six overlapping TL components. The kinetic parameters of the TL glow curve of beta irradiated BaTi5O11 were determined by CGCD. The analysis indicated that the six overlapping peaks are located at 380.44, 406.68, 431.02, 456.68, 502.09, and 560.50 K, respectively. The calculated activation energies for the six peaks are 0.94, 1.11, 1.22, 1.27, 1.35, and 1.40 eV, respectively. BaTi5O11 displays a linear dose response from 5.5 to 385 Gy. When the BaTi5O11 sample is exposed to β -radiation of 55 Gy ten times, it shows almost the same TL glow curve every time. The observed TL signals of the beta irradiated samples have exhibited low thermal fading rates after storage periods ranges from 0 to 192 h.
Acknowledgement
G. Bassioni and M. Riede acknowledge funding from the UKRI-GCRF grant Synchrotron Techniques for African Research and Technology (START) ST/R002754/1.
Declaration of Competing Interest
The authors declare that they have no known competing financial interests or personal relationships that could have appeared to influence the work reported in this paper.
References
- Dosimetric properties of potassium magnesium borate glass doped with copper. J. Mater. Sci. Mater. Electron.. 2022;33:12927-12940.
- [Google Scholar]
- Synthesis and characterization of rare earth activated barium zirconate ceramic. Mater. Sci. Eng.. 2018;383:012004
- [Google Scholar]
- Synthesis of BaTi5O11 by an aqueous co-precipitation method via a stable organic titanate precursor. J. Serb. Chem. Soc.. 2021;86:415-427.
- [Google Scholar]
- Paramagnetic defects and thermoluminescence in irradiated nanostructured monoclinic zirconium dioxide. Materials. 2022;15:8624-8639.
- [Google Scholar]
- Figure-of-merit (FOM), an improved criterion over the normalized chi-squared test for assessing goodness-of-fit of gamma-ray spectral peaks. Nucl. Inst. Methods. 1977;145:389-395.
- [Google Scholar]
- Improved room temperature dielectric properties of Gd3+ and Nb5+ co-doped Barium Titanate ceramics. J. Alloy. Compd.. 2021;883:160836-160857.
- [Google Scholar]
- The influence of co-doping on the luminescence and thermoluminescence properties of Cu containing fluoride borate crystals. Cryst. Eng. Comm.. 2021;23:6599-6610.
- [Google Scholar]
- Structural characterization and thermoluminescence studies of UV irradiated and Eu3+ activated BaZr0.25Ti0.75O3 powders. Mater. Sci. Semicond. Process.. 2016;44:38-47.
- [Google Scholar]
- Catalytic transformation of H2S for H2 production. Int. J. Hydrogen Energy. 2018;43:22852-22860.
- [Google Scholar]
- Optical properties and microstructure of BaTi5O11 thin films by sol-gel method. JPS Conf. Proc.. 2014;1:012087
- [Google Scholar]
- Structural and optical properties of nanocrystalline Ni–Zn ferrite thin films. J. Alloy. Compd.. 2010;507:21-25.
- [Google Scholar]
- Elements of X-ray diffraction (third ed.). New Jersey: Prentice Hall; 2001.
- Sub-chronic inhalation of lead oxide nanoparticles revealed their broad distribution and tissue-specific subcellular localization in target organs. Part. Fibre Toxicol.. 2017;14:55-74.
- [Google Scholar]
- Versatility of thermoluminescence materials and radiationdosimetry–A review. Luminescence. 2019;34:656-665.
- [Google Scholar]
- Dosimetric properties of lithium borate glass doped with dysprosium. Luminescence. 2021;36:210-214.
- [Google Scholar]
- M. El–Kinawy, H. F. El–Nashar, N. El–Faramawy, New designed software to deconvolute the thermoluminescence glow–curves, SN Applied Sciences 1 (2019) 1-7.
- Solid-state dye-sensitized solar cells based on Zn1− xSnxO nanocomposite photoanodes. RSC Adv.. 2018;8:24059-24067.
- [Google Scholar]
- Erdelyi, Editor, Tables of Integral Transforms vol. II. McGraw Hill, New York, 1954.
- Handbook of thermoluminescence (Second ed.). Singapore: World Scientific Publishing Co., Pte. Ltd; 2010.
- Determination of thermoluminescence parameters in nanocrystalline CaAl2O4. J. Lumin.. 2020;219:116867-116873.
- [Google Scholar]
- The occurrence of metastable tetragonal zirconia as a crystallite size effect. J. Phys. Chem.. 1965;69:1238-1243.
- [Google Scholar]
- Impedance spectroscopy of dielectric BaTi5O11 film prepared by laser. Chem. Vapor Deposition Method. 2012;41:689-694.
- [Google Scholar]
- Production of CO from CO2 over mixed-metal oxides derived from layered-double-hydroxides. Appl. Energy. 2019;235:1183-1191.
- [Google Scholar]
- The effect of copper on the structural and thermoluminescence properties of aluminium borate. J. Lumin.. 2020;226:117504-117510.
- [Google Scholar]
- Microwave dielectric properties of the BaTi5O11 thin films grown on the poly-si substrate using rf magnetron sputtering. J. Eur. Ceram. Soc.. 2006;26:2151-2154.
- [Google Scholar]
- Multifunctional near-infrared emitting Cr3+-doped Mg4Ga8Ge2O20 particles with long persistent and photostimulated persistent luminescence, and photochromic properties. J. Mater. Chem. C. 2016;4:6614-6625.
- [Google Scholar]
- Magnetic properties of triethylene glycol coated CoFe2O4 and Mn0.2Co0.8Fe2O4 NP’s synthesized by polyol method. Arab. J. Chem.. 2016;9:S1131-S1137.
- [Google Scholar]
- Defect-induced yellow color in Nb-doped TiO2 and its impact on visible-light photocatalysis. J. Phys. Chem. C. 2015;119:16623-16632.
- [Google Scholar]
- D. D. Le Pevelen, Small Molecule X-Ray Crystallography, Theory and Workflow, Encyclopedia of Spectroscopy and Spectrometry (Second Edition) (2010) 2559-2576.
- Preparation of single-crystalline BaTi5O11 nanocrystals by hydrothermal method. Mater. Lett.. 2019;245:215-217.
- [Google Scholar]
- MoOx and V2Ox as hole and electron transport layers through functionalized intercalation in normal and inverted organic optoelectronic devices. Light Sci. Appl.. 2015;4:e273.
- [Google Scholar]
- High-security-level multi-dimensional optical storage medium: nanostructured glass embedded with LiGa5O8: Mn2+ with photostimulated luminescence. Light Sci. Appl.. 2020;9:1-10.
- [Google Scholar]
- Morphology evolution of BaTi5O11 nanocrystals prepared by hydrothermal method and their permittivity. J. Mater. Sci. Mater. Electron.. 2020;31:6883-6889.
- [Google Scholar]
- The effect of water on the thermoluminescence properties in various forms of calcium sulfate samples. Radiat. Meas.. 2019;122:10-26.
- [Google Scholar]
- Thermoluminescence of Solids. Cambridge University Press; 1985.
- Facile preparation of uniform barium titanate (BaTiO3) multipods with high permittivity: impedance and temperature dependent dielectric Behavior. RSC Adv.. 2014;4:1212.
- [Google Scholar]
- Present status and future trends in the development of thermoluminescent materials. Appl. Radiat. Isot.. 2016;117:135-142.
- [Google Scholar]
- Thermoluminescence study and trapping parameters of beta irradiated NaBaBO3:Gd3+ phosphor. J. Lumin.. 2021;238:118245-118253.
- [Google Scholar]
- Thermoluminescence and photoluminescence of ZrO2 nanoparticles. Radiat. Phys. Chem.. 2011;80:923-928.
- [Google Scholar]
- Synthesis and characterization of Dy3+ doped lithium borate glass for thermoluminescence dosimetry. J. Non Cryst. Solids. 2017;475:184-189.
- [Google Scholar]
- Structural and analyses of thermoluminescence glow curves in Sm doped SrGd2O4 phosphor. J. Alloy. Compd.. 2022;911:165008-165015.
- [Google Scholar]
- Restoration of perovskite phase in the top layer of thin BTO film by plasma treatment and annealing. J. Phys. D Appl. Phys.. 2018;51:085304
- [Google Scholar]
- Intense visible light emission from dysprosium (Dy3+) doped barium titanate (BaTiO3) phosphor and its thermoluminescence study. Mater. Electron.. 2017;28:13690-13697.
- [Google Scholar]
- Synthesis and characterization of perovskite barium titanate thin film and its application as LPG sensor. Sens. Actuators, B. 2017;241:1170-1178.
- [Google Scholar]
- Thermoluminescence characteristics of a novel Li2MoO4 phosphor: Heating rate, dose response and kinetic parameters. Radiat. Phys. Chem.. 2022;194:110025-110033.
- [Google Scholar]
- Effects of heat treatment on structural evolution and morphology of BaTi5O11 powder synthesized by the sol–gel method. Mater. Sci. Eng. B. 2004;108:223-226.
- [Google Scholar]
- Optical Properties and Electronic Structure of Amorphous Germanium. Phys. Stat. Sol. (b). 1966;15:627-637.
- [CrossRef] [Google Scholar]
- Acta Crystallogr. B. 1969;25:1444.
- Electric and magnetic properties of cobalt, copper and nickel organometallic complexes for molecular wires. Ain Shams Eng. J.. 2021;12:2135-2144.
- [Google Scholar]
- Enhanced blue-light excited cyan-emitting persistent luminescence of BaLu2Al2Ga2SiO12:Ce3+, Bi3+ phosphors for AC-LEDs via defect modulation. Light Sci. Appl.. 2022;11:1-13.
- [Google Scholar]
- Preparation and properties of mixed metal oxides based layered double hydroxide as anode materials for dye-sensitized solar cell. Chem. Eng. J.. 2014;250:1-5.
- [Google Scholar]
- Ni-doped BaTi5O11: New brilliant yellow pigment with high NIR reflectance as solar reflective fillers. Ceram. Int.. 2020;46:3490-3497.
- [Google Scholar]
- An amorphous TiO2 sol sensitized with H2O2 with the enhancement of photocatalytic activity. J. Alloy. Compd.. 2010;497:420-427.
- [Google Scholar]


