

Translate this page into:
Utilization of landscape biomass waste as activated carbon to scavenge oxytetracycline: Attraction mechanism, batch and continuous studies
⁎Corresponding author. chazmier@usm.my (Mohd Azmier Ahmad)
-
Received: ,
Accepted: ,
This article was originally published by Elsevier and was migrated to Scientific Scholar after the change of Publisher.
Peer review under responsibility of King Saud University.
Abstract
Oxytetracycline (OXY) is an antibiotic widely used in the livestock industry and its existence in water can cause antibiotic resistance genes. A treatment process in a continuous mode is required to treat a high volume of OXY wastewater. Hence, an effort was made in this study to adsorb OXY from an aqueous solution (batch and continuous modes) using landscape biomass waste-based activated carbon (LBWAC). This adsorbent was produced via potassium hydroxide (KOH) chemical treatment combined with microwave heating under carbon dioxide, CO2 gas. The resulting LBWAC exhibited 973.21 m2/g of BET surface area, 842.18 m2/g of mesopores surface area, 0.3911 cm3/g of total pore volume, and 2.44 nm of average pore diameter. In a batch study, OXY adsorption uptakes increased whilst OXY percentage removal decreased when OXY starting concentration increased from 25 to 300 mg/L. The highest uptakes of OXY occurred at a solution temperature of 60 °C (228.44 mg/g) and a solution pH of 12 (63.22 mg/g). The adsorption system studied obeyed the Langmuir model and pseudo-second-order in isotherm and kinetic studies, respectively. The obtained Langmuir monolayer capacity, Qm was 344.83 mg/g. Mechanism study revealed that O, H, and N elements in OXY molecules react with O, H, and N elements in functional groups on LBWAC’s surface via hydrogen bonds and vice versa. Parameters acquired in the thermodynamic study described the adsorption process as spontaneous, endothermic, and physisorption-controlled. The continuous bed column study revealed that the breakthrough point (Tb), exhaustion time (Tex), and maximum adsorption uptake (qmax) for the OXY-LBWAC adsorption system can be increased by decreasing the starting inlet concentration, decreasing the inlet flow rate and increasing the bed height. The continuous adsorption data fitted Thomas model the best. The LBWAC had a good potential to be applied in a large-scale operation for OXY wastewater treatment.
Keywords
Activated carbon
Adsorption process
Antibiotic
Bed column
Mechanism
Microwave heating

1 Introduction
Antibiotics are a class of medications used to treat bacterial infections. They work by killing or inhibiting the growth of bacteria, thus helping the body's immune system to eliminate the infection (Kovalakova et al., 2020). Antibiotics pose a significant environmental concern among the various pollutants, primarily due to their persistence and presence in drinking water, surface water, and wastewater, where their detection is frequent. The introduction of antibiotics has resulted in a growing pollution problem in aquatic environments, largely attributed to the improper use and overuse of pharmaceuticals in aquaculture, livestock farming, and hospital settings. Certain antibiotics exhibit limited oral bioavailability, resulting in their prolonged presence in the gastrointestinal tract beyond the desired duration. As a consequence, these antibiotics are excreted into the environment in residual and unabsorbed forms, potentially retaining their biological activity (Nkoh et al., 2023). One of the regular antibiotics that can be detected as a pollutant in water and soil is oxytetracycline (OXY) (Conde-Cid et al., 2019, Wang et al., 2023). OXY belongs to the category of tetracyclines, a class of broad-spectrum antibiotics extensively employed in the livestock industry. These antibiotics exhibit activity against various types of microorganisms, including numerous Gram-positive and Gram-negative bacteria (Zhang et al., 2023). In the future, the generation of wastewater containing antibiotics is expected to increase due to the increment of antibiotic usage worldwide due to (i) an increasing human population, (ii) easy access to antibiotics and (iii) increase demand for animal protein leads to an increase in antibiotics usage to sustain the food production (Van Boeckel et al., 2015, Zhao et al., 2019). Exposure to antibiotic residues causes a notable threat in terms of the rise of antibiotic-resistance genes and antibiotic-resistant bacteria (Zhan et al., 2020). Therefore, there is a need to develop an effective yet economical-friendly method to treat the ever-increasing wastewater containing antibiotics.
There are many methods to treat antibiotics wastewater. For instance, Cuerda-Correa et al. (2020) adopted advanced oxidation processes whilst Li et al., (2020) and Du et al., (2021) utilized photodegradation using metal–organic frameworks to treat antibiotics in wastewater. These methods are efficient but high in cost for chemical reagents or catalysts besides producing secondary pollutants in the form of metal sludge (Leng et al., 2020). Xiong et al., (2021), Ferrando and Matamoros (2020), and Gojkovic et al., (2019) studied algae-based techniques to treat antibiotics wastewater. Despite its effectiveness, this method requires relatively longer time to achieve its objective. In a study conducted by Bai and Acharya (2016), 7 days were needed to remove antibiotics from wastewater. Of all methods available, the adsorption process offers many advantages such as being effective, simple to operate, relatively fast process, and cheap (Mohamad Yusop et al., 2023a, 2023b, 2023c). Furthermore, this method has demonstrated versatility due to its ability to remove various type of contaminants from wastewater ranging from dyes (Lopes et al., 2021, Zhou et al., 2022, Zayed et al., 2023), heavy metals (Yusop et al., 2022a, 2022b, Bumajdad and Hasila 2023, Saka et al., 2023), water vapor (Liu et al., 2023), phenol (Arshad et al., 2019, Alam et al., 2023), nitric oxide (Lin et al., 2021), antibiotics (Zhou et al., 2022, Tiwari et al., 2023), hydrogen sulfide, H2S gas (Moradi et al., 2020, Nor et al., 2021), and so on. One of the most effective adsorbents to be used in the adsorption process is activated carbon (AC). Researchers are actively producing AC from biomass wastes since they are free materials and renewable sources. For instance, edamame shell (He et al., 2023), coconut shell (Oyekanmi et al., 2019, Amran et al., 2021, Yusop et al., 2022a, 2022b), pineapple peel (Rosli et al., 2023), date seed (Said et al., 2023), wood wastes (Firdaus et al., 2022, Mohamad Yusop et al., 2023a, 2023b, 2023c), oak seeds (Borghei et al., 2021), mangosteen peel (Jawad et al., 2022), jackfruit peel (Mohamad Yusop et al., 2023a, 2023b, 2023c), orange peel (Ajay et al., 2021) and others. In this study, biomass waste from landscape tree (Tabebuia rosea tree) was selected as the precursor to be converted into activated carbon (AC). This tree is commonly known as “Malaysian Sakura” and is highly chosen as a landscaping plant. The local authorities in Malaysia have extensively planted this tree along roadsides, gardens, parks, residential areas, and university campuses (Nur et al., 2014). Despite its beauty, this tree has no other purposes and is often dumped in a dumping site. Therefore, utilizing their waste in AC would be beneficial in promoting the “waste to wealth” concept.
In the literature, few studies targeting OXY to be treated from wastewater were noticed. Nguyen et al., (2021) studied OXY adsorption by cobalt-based zeolite, Juengchareonpoon et al., (2019) utilized hydrogen film to adsorb OXY, and Khan et al., (2021) performed an adsorption test on OXY using groundwater treatment sludge as magnetic adsorbent. These studies share similarities in where the adsorption test was conducted through batch mode. The batch mode in the adsorption process is not suitable for large-scale applications due to (i) at the end of the adsorption process, the adsorbent is required to be filtered out from the solution, therefore adding more work and labour cost, (ii) variations in terms pH and temperature occur in different batch, resulting inconsistencies in adsorption process and (iii) wasting adsorbent since adsorbent is used in excess quantity to achieve adequate adsorption. On the contrary, the continuous mode of adsorption process is more beneficial since it provides higher treatment capacity, improved efficiency, consistent performance, cost-effectiveness, control, and flexibility, making it a preferred choice for many large-scale or continuous treatment applications. Therefore, this research aimed to study the OXY adsorption onto LWBAC through batch and continuous bed column. The equilibrium, isotherm, kinetic, and thermodynamic studies were performed in batch adsorption whilst several adsorption models were utilized in continuous bed column to determine breakthrough time, Tb, and exhaustion time, Tex. Moreover, the interaction between OXY molecules and LWBAC’s surface was also verified to understand the adsorption mechanism involved. To the best of our knowledge, the investigation of antibiotic adsorption in a continuous bed column system and the possible OXY-LBWAC mechanism interaction is novel.
2 Materials and methods
2.1 Materials
The landscape biomass waste (Tabebuia rosea tree) was supplied by Seberang Perai City Council, Penang, Malaysia. Upon received, the size of this precursor was between 15- and 20-mm. Riedel-el Haen, Germany had supplied potassium hydroxide (KOH) to be utilized during chemical activation whereas Merck, Germany had provided hydrochloric acid, HCl to be used during the washing step. Both nitrogen, N2 gas (consumed as an inert gas during char production in a vertical furnace) and carbon dioxide, CO2 gas (utilized during microwave heating to provide gasification treatment on samples) were acquired from MOX Gases Berhad, Malaysia.
2.2 LBWAC preparation
The precursor was dried under direct sunlight in an open area for 72 h. 200 g of dried precursor was carbonized in a vertical furnace for 1 h at a carbonization temperature of 550 °C. The N2 gas was purged through the vertical furnace at 150 cm3/min during the whole carbonization process. After 1 h, the furnace was turned off to lower the temperature of the sample to room temperature. The N2 gas was allowed to purge through the furnace throughout the cooling process. Once the furnace reached room temperature, the sample was unloaded from the furnace. This sample is now known as char. The resulting char was impregnated with KOH at impregnation ratio (IR) of 1.00 g/g. IR is computed using Eq. (1):
2.3 Methods of characterization
This study provides several characteristics for the samples produced. The first characterization of surface area (BET and mesopores), volume of total pores, and average diameter of the pores were acquired from Micromeritics volumetric adsorption analyser (ASAP 2010) (Baruah et al., 2022, Karakehya 2023). The characterization in terms of elemental composition and proximate composition was done by operating the elemental analyzer (Model: Perkin Elmer Series II 2400, USA) and simultaneous thermal analyzer (STA) (Model: Perkin Elmer STA 6000, USA), respectively (Askaruly et al., 2023). For quality control, the elemental analyzer is calibrated regularly using certified reference materials to ensure a precise measurement by linking the instrument's response to the element concentrations in the samples. The morphology image of samples was taken by scanning electron microscopy (SEM) was taken by (Model: LEO SUPRA 55VP, Germany) (Zayed et al., 2023). The zeta potential value was measured using the zeta potential analyser (Zetasizer Nano Series DKSH) (Senol-Arslan et al., 2022). The functional groups on samples were verified using Fourier transforms infrared spectroscopy (FTIR) (Model: Shidmazu Prestige 21, Japan), through the transmission method (Mawhinney and Yates 2001, Ahmad et al., 2020a, 2020b).
2.4 Preparation of OXY stock solution
To prepare the OXY solution, 1.00 g of accurately weighted OXY powder was mixed with 1 L of deionized water in a conical flask. The solution was stirred to dissolve the OXY powder completely. The resulting solution was known as a stock solution with a concentration of 1000 mg/L. To prepare the OXY solution at different initial concentrations, the stock solution was diluted using the following formula:
2.5 Study of equilibrium
The influences of several factors on the equilibrium state of the adsorption process were verified. The first factor was starting concentration of the OXY solution. OXY solution with six different starting concentrations (25, 50, 100, 200, 250, and 300 mg/L) was prepared in an Erlenmeyer flask. The volume for each one of these solutions was 200 mL. These flasks were then inserted inside the water bath shaker, and 0.20 g of LBWAC was added to every flask. The rotating speed and temperature controller on the water bath shaker were set to 80 rpm and 30 °C, respectively. The second factor studied was the solution temperature effect. OXY starting concentration, OXY solution volume, LBWAC dosage and rotating speed were chosen to be 300 mg/L, 200 mL, 0.20 g, and 80 rpm, respectively, whilst the solution temperature was changed between 30, 45, and 60 °C. The third factor verified was the solution pH effect. The starting concentration for OXY was selected to be 100 mg/L and the pH of the OXY solution was altered using NaOH / HCl to be 2, 4, 6, 10, and 12. The measurement of pH was made using a pH meter (Model Delta 320, Mettler Toledo, China). Other experimental conditions followed the same conditions in the study for the solution temperature effect. At the equilibrium point (after 24 h), the concentration of OXY in the solution, Ce (Eq. (3)), and its percentage removal (Eq. (4)) are calculated using the following equations:
2.6 Study of isotherm
The data obtained in the equilibrium study were fitted on isotherm models namely Langmuir (Eq. (5)) (Langmuir 1918), Freundlich (Eq. (6)) (Freundlich 1906), and Temkin (Eq. (7)) (Tempkin and Pyzhev 1940). Their equations are as follows:
2.7 Study of kinetic
In contrast with equilibrium and isotherm studies, the study of kinetic was performed by measuring the concentration of OXY at a specific time interval between 0.15 h and 24 h. Other procedures in the kinetic study were similar to equilibrium and isotherm studies. The data obtained were tested on pseudo-first order, PFO (Eq. (8)) (Lagergren, 1898), and pseudo-second order, PSO (Eq. (9)) (Ho and McKay 1998). The rate-limiting step was determined from the Boyd plot (Eq. (10)) (Boyd et al., 1947). Their equations are as follows:
2.8 Study of thermodynamic
Two important parameters in thermodynamic study namely enthalpy change, ΔH° (kJ/mol), and entropy change ΔS° (kJ/mol.K) can be calculated from Van’t Hoff equation (Eq. (12)) (Achmad et al., 2012) as follows:
2.9 Study of continuous bed column
The effects of (i) starting influent concentration (50, 100, and 200 g/L), (ii) influent flow rate (10, 20, and 30 mL/min) and (iii) LBWAC bed height (40, 60, and 80 mm) on the continuous adsorption performance were investigated. A Perspex filter column with an internal diameter of 2.50 cm was used for this experiment. The OXY solution was pumped to the influent point using a peristaltic pump. A breakthrough curve was constructed by plotting the ratio of OXY concentration at time t to the OXY starting concentration (Ct/Co) against contact time. Based on the breakthrough curve, the breakthrough time, Tb, and the exhaustion time, Tex can be found at 0.10Ct/Co and 0.90Ct/Co, respectively.
3 Results and discussions
3.1 Characteristics of samples
Table 1 provides the physical properties of the samples studied. The carbonization process succeeded in initializing the pores development process in the precursors. Therefore, the resulting char exhibited 406.52 m2/g of BET surface area, 337.85 m2/g of mesopores surface area, 0.1586 cm3/g of pore volume, and an average pore diameter of 1.75 nm. These properties were noticed to increase further owing to an effective activation process that combined KOH chemical treatment, microwave heating, and CO2 gasification treatment. During these activation processes, the following chemical reaction took place (Norouzi et al., 2018, Xu et al., 2019, Mohamad Yusop et al., 2023a, 2023b, 2023c):
Sample
BET surface area (m2/g)
Mesopores surface area (m2/g)
Total pore volume (cm3/g)
Average pore diameter (nm)
precursor
0.98
–
0.0001
1.48
char
406.52
337.85
0.1586
1.75
LBWAC
973.21
842.18
0.3911
2.44
The K2CO3 ions penetrate the internal side of the sample whilst the microwave heating promoted more volatile matter to erupt and leave the sample. This led to the increment of BET surface area, mesopores surface area, and total pore volume in LBWAC to be 973.21 m2/g, 842.18 m2/g, and 0.3911 cm3/g, respectively. The gasification effect of CO2 aided the pores enlargement process, thus converting the micropores in char to mesopores (2.44 nm) in LBWAC.
Table 2 presents the chemical composition of the samples. Based on the proximate analysis, the precursor used in this study posed 22.85% of fixed carbon content which is higher in comparison to pomegranate fruit peel of 15.34% (Ahmad et al., 2020a, 2020b), and durian peel at 20.69% (Yusop et al., 2021). A high fixed carbon percentage is good since it made up the matrix structure of adsorbent A higher percentage of fixed carbon is usually linked to a finely developed porous arrangement. The empty spaces and gaps present in AC create a generous expanse of surface, enabling the adsorption process. Elevated fixed carbon levels frequently signify an increased volume of accessible pore areas, resulting in an expanded surface region. This expansion, in turn, facilitates the creation of additional sites for adsorption to take place (Firdaus et al., 2022). Carbonization and activation processes caused a further increment of fixed carbon percentage in LBWAC to 78.14%. Other components such as moisture and volatile matter shrink in percentage from 13.05% and 58.22% in precursor to 2.89% and 17.21% in LWBAC, respectively. These components evaporate and leave the sample. A relatively low ash percentage of 1.76% was good since ash contains ruptured pores, therefore is useless for the adsorption process. In terms of elemental composition, LWBAC was found to be dominated by C element (80.12%), followed by N + O elements (12.48%), H element (7.14%), and S element (0.07%). The existence of N, O, and S elements in LBWAC gave an insight that this adsorbent is filled with various functional groups on its surface.
Samples
Proximate analysis (%)
Elemental analysis (%)
Moisture
Volatile matter
Fixed carbon
Ash
C
H
S
(N + O)
Precursor
13.05
58.22
22.85
5.88
41.45
10.11
0.12
48.32
Char
5.89
35.78
54.22
4.11
64.21
8.21
0.09
27.49
LBWAC
2.89
17.21
78.14
1.76
81.24
7.14
0.07
11.55
Fig. 1(a) and (b) respectively show the SEM image for precursor and LBWAC. The precursor surface was seen to be dense with no pores since the precursor is packed with lignin, cellulose, hemicellulose, and tar components. These components vaporized during the carbonization and activation process. Hence, a porous structure can be observed on LBWAC’s surface. These porous structures were contributed by the penetration of K2CO3 during chemical.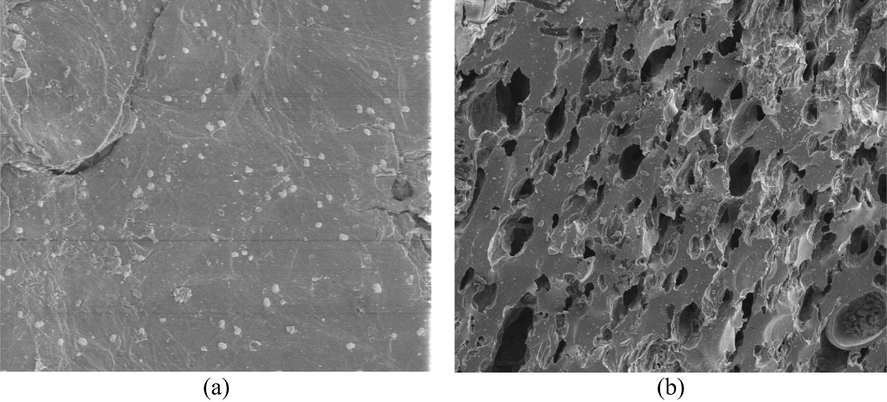
SEM images of (a) precursor (b) LWBAC (1000x magnificent level).
The zeta potential of LBWAC was found to be −14.5 mV, as shown in Fig. 2. A negative value of zeta potential signified that the LBWAC’s surface was negatively charged due to the existence of functional groups such as hydroxyl and carboxyl. The FTIR analysis shows that the surface of the precursor was filled with functional groups of vinyl C—H out-of-plane bend, primary amine C—N stretch, aryl -O stretch, methylene C—H asymmetric and alkyne C—H stretch at peaks of 890, 1030 & 1627, 1251, 2915 and 3320 cm−1, respectively. Only the primary amine C—N stretch survived the activation processes and appeared in LBWAC’s at 1076 cm−1, whilst other functional groups were missing in LBWAC’s surface. Several new peaks representing new functional groups were formed on LBWAC’s surface. These new functional groups include alkyl carbonate, secondary amine, >N—H bend, C≡C terminal alkyne (monosubstituted), C≡C medial alkyne (disubstituted) and hydroxy, OH group at bandwidth peaks of 1760, 1650, 2140, 2190 and 3200 cm−1, respectively. These new functional groups have resulted from the aggressive interaction between CO2, KOH, and other volatile components during activation processes.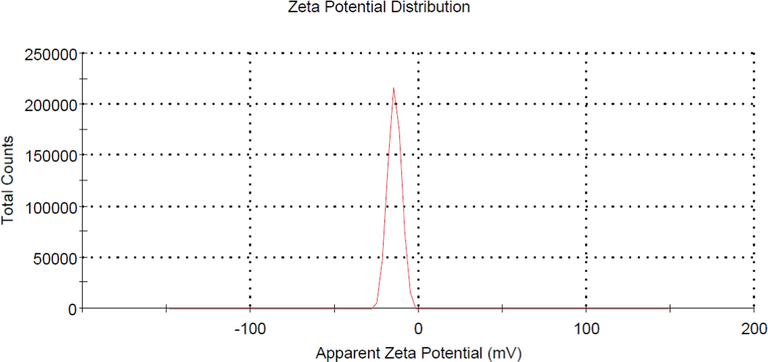
Zeta potential value for LBWAC.
Fig. 3 shows the possible mechanism attraction between OXY molecules and the functional groups in LBWAC. The OXY molecules contain 9O and 2 N. These atoms are more electronegative and have the potential to form hydrogen bond with H atoms in terminal alkyne, primary amine, hydroxy and alkyl carbonate. Also, N atoms in primary amine, O atoms in hydroxy and alkyl carbonate have potential to form hydrogen bonds with H atoms in OXY molecules. These interactions had aided the adsorption of OXY onto LBWAC. Pham et al., (2019) also found hydrogen bond plays a major role in the adsorption of OXY onto alumina particles.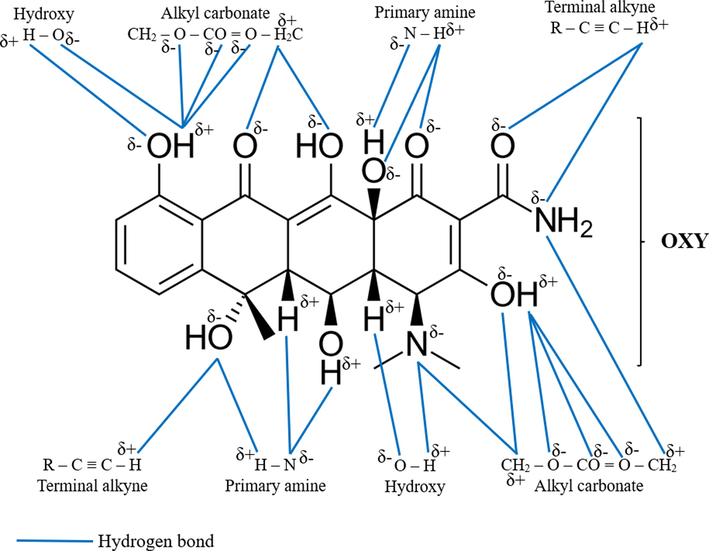
Possible attraction mechanism between OXY molecules and functional groups on LBWAC’s surface.
3.2 Adsorption equilibrium
3.2.1 Influence of contact time and OXY starting concentration
Fig. 4(a) and (b) provide the plot of OXY uptakes versus time at different starting concentrations and the plot of OXY percentage removal versus time at different starting concentrations, respectively. Based on Fig. 4(a), when OXY starting concentration increased from 25 to 300 mg/L, adsorption uptakes increased too from 21.65 to 212.79 mg/g. At higher starting concentrations, more OXY molecules are available in the solution to be adsorbed by LBWAC. It was also noticed that lower starting concentrations between 25 and 100 mg/L attained an equilibrium state faster at 6 h whereas higher starting concentrations between 200 and 300 mg/L achieved the same state at a longer time of 22 h. Based on Fig. 4(b), as the starting concentrations increased from 25 to 300 mg/L, OXY percentage removal decreased from 86.58 to 70.93%. At all starting concentrations studied, the number of active sites on LBWAC was constant. However, the quantity of OXY molecules was smaller at lower starting concentration, therefore, the adsorption process can complete faster, and the percentage removal was higher, and vice versa (Ahmad et al., 2021).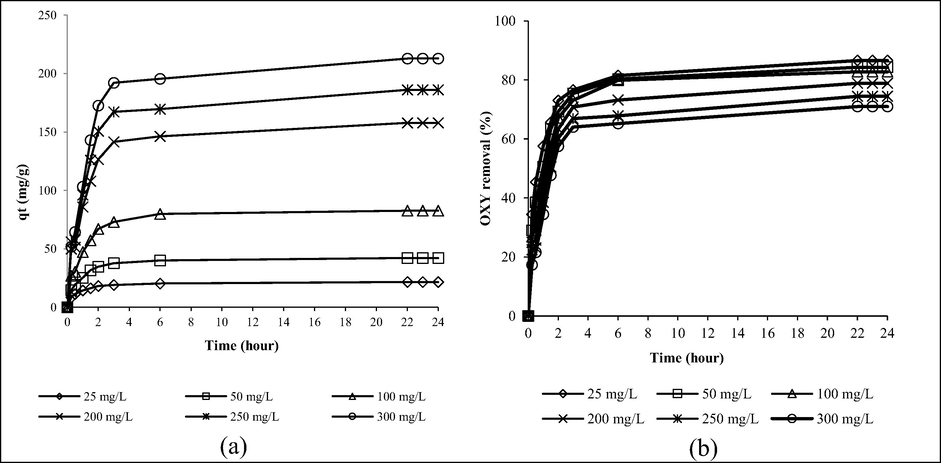
ots of (a) adsorption uptakes by LBWAC versus time and (b) percentage removal by LBWAC versus time for different starting concentrations of OXY at 30 ˚C (weight of LWBAC was 0.2 g, volume solution of 200 mL and original pH were used).
3.2.2 Influence of solution temperature
Fig. 5 presents the plot that showcased the relationship between adsorption uptakes of OXY at different solution temperatures. It was observed that as the solution temperature increased from 30 to 60 °C, the adsorption uptakes of OXY also increased from 212.79 to 228.44 mg/g. This finding suggests that higher solution temperatures favoured the adsorption process of OXY, indicating an endothermic behaviour. Higher OXY uptakes were caused by the increasing of kinetic energy of OXY molecules at higher solution temperatures (Li et al., 2019, Başkan et al., 2022). OXY uptakes also favoured at higher solution temperatures when adsorbed by zeolite/Fe3O4 particles (Başkan et al., 2022) and metal hydroxides (Eniola et al., 2020).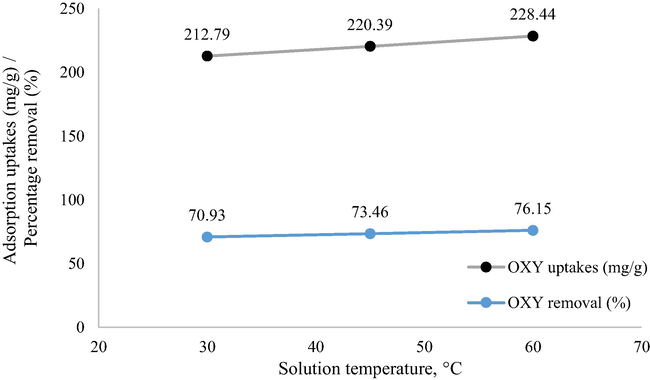
Plot of adsorption capacity at different solution temperature (weight of LWBAC was 0.2 g, volume solution of 200 mL, initial concentration of 300 mg/L and original pH).
3.2.3 Influence of solution pH
Fig. 6 shows the influence of solution pH on OXY uptakes. The lowest uptakes occurred at pH 2 of 46.05 mg/g. At pH 2, H+ ions occur in excess amounts and became attracted to the electronegative O and N atoms in OXY molecules. This phenomenon reduced the number of hydrogen bonds between OXY molecules and LBWAC’s surface (refers to Fig. 3). At pH 4 and 6, the number of H+ ions reduced, therefore OXY uptakes increased to 49.53 and 53.95 mg/g, respectively. At pH 8, OH– ions existed in the solution and induced the surface of LBWAC to be negatively charged. These negatively charged surface attracted the electropositive H atoms in OXY molecule. This effect combined with the formation of hydrogen bonds between the OXY molecule and functional groups caused the OXY uptakes to increase to 59.76 mg/g. At pH 10, OXY uptakes increased to 61.45 mg/g due to increasing of OH– ions in solution. At pH 12, only a small increment occurred for OXY uptakes to be 63.22 mg/g. At this pH, the induced effect of OH– had reached its limit. Adding more OH– in the solution brings no more effect to the OXY uptakes.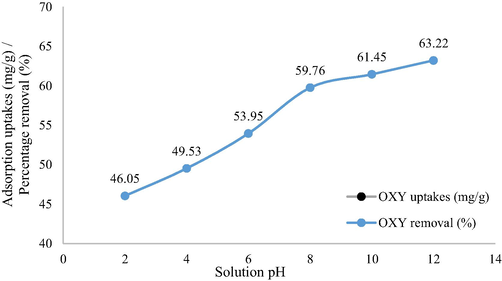
Percentage removal of adsorbates by LBWAC versus solution pH (weight of LWBAC was 0.2 g, volume solution of 200 mL, initial concentration of 100 mg/L and solution temperature of 30 °C).
3.3 Adsorption isotherm
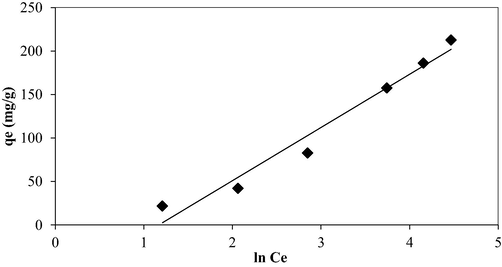
Figs. 7, 8, and 9 present the isotherm plots of Langmuir, Freundlich, and Temkin models, whilst the isotherm parameters are summarized in Table 3. Adsorption of OXY onto LBWAC obeyed the Langmuir model due to the highest R2 obtained of 0.9939. This indicated that OXY molecules developed a monolayer covering the surface of the LBWAC (García et al., 2018). The Langmuir maximum monolayer adsorption capacity, Qm for OXY by LBWAC was found to be 344.83 mg/g. This value was higher as compared to the OXY-metal hydroxide adsorption system of 250.07 mg/g (Eniola et al., 2020), the OXY- zeolite/Fe3O4 adsorption system of 83.33 mg/g (Başkan et al., 2022). The heterogeneity factor, nF, was determined to be 1.40. As this value falls within the range of 1 to 10, it indicates that the adsorption system studied is favourable (Firdaus et al., 2022).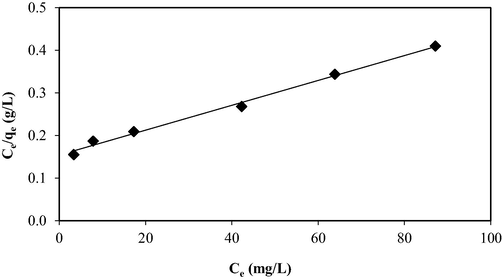
Langmuir isotherm plot for OXY-LBWAC adsorption system at 30 °C (weight of LWBAC was 0.2 g, volume solution of 200 mL and original pH were used).
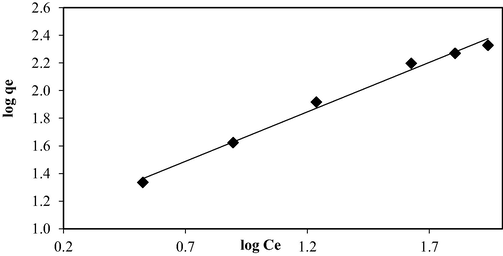
Freundlich isotherm plot for OXY-LBWAC adsorption system at 30 °C (weight of LWBAC was 0.2 g, volume solution of 200 mL and original pH were used).
Temkin isotherm plot for OXY-LBWAC adsorption system at 30 °C (weight of LWBAC was 0.2 g, volume solution of 200 mL and original pH were used).
Isotherms
Parameters
Langmuir
Qm (mg/g)
344.83
KL (L/mg)
0.0188
R2
0.9939
Freundlich
nF
1.40
KF (mg/g)(L/mg)1/n
9.72
R2
0.9906
Temkin
BT (kJ)
61.24
AT (L/mg)
0.31
R2
0.9664
3.4 Adsorption kinetic
The kinetic plots of PFO and PSO are shown in Fig. 10(a) and (b), respectively, while Table 4 shows the summary of kinetic parameters. The analysis revealed that the adsorption system exhibited the strongest adherence to the PSO kinetic model, as evidenced by the highest R2 value of 0.9992 and a low error percentage of 4.74%. Adsorption of OXY onto hydroxyapatite (Harja and Ciobanu 2018) and alumina particles (Pham et al., 2019) were also best described by PSO kinetic model. Reaction rate, k2 dropped from 0.0991 to 0.0645 g mg−1 min−1 as the OXY starting concentration increased from 25 to 300 mg/L. At higher starting OXY concentration, higher mass transfer driving force was developed, thus enhancing the adsorption process to be faster, and vice versa.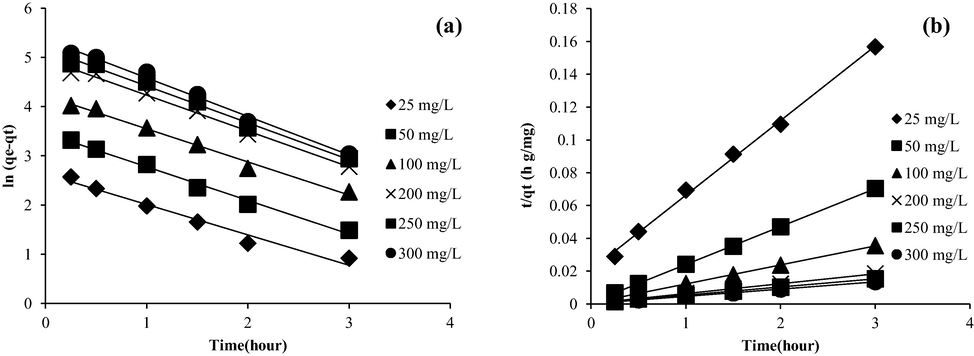
Kinetic plots of (a) PFO and (b) PSO for OXY-LBWAC adsorption system at 30 °C (weight of LWBAC was 0.2 g, volume solution of 200 mL and original pH were used).
Starting OXY concentration (mg/L)
qe, exp
(mg/g)
Pseudo-first order (PFO)
Pseudo-second order (PSO)
qe, cal (mg/g)
k1 (min−1)
R2
Error (%)
qe, cal (mg/g)
k2
(g mg−1 min−1)
R2
Error (%)
50
42.13
31.79
0.6826
0.9905
24.53
43.29
0.5929
0.9999
2.76
100
82.71
68.27
0.6738
0.9886
17.47
86.21
0.2243
0.9998
4.22
200
157.74
142.45
0.7281
0.992
9.69
166.67
0.0900
0.9994
5.66
250
186.09
174.78
0.7462
0.9875
6.08
200.00
0.0625
0.9993
7.47
300
212.79
214.22
0.7819
0.989
0.67
227.27
0.0645
0.9996
6.81
Average
0.9863
15.78
0.9992
4.74
Fig. 11 provides the intraparticle diffusion plot while Table 5 shows the summary for intraparticle diffusion parameters. The lines depicted in Fig. 11 did not pass through the origin of the graph. Hence, it can be inferred that the rate-limiting step was not solely governed by intraparticle diffusion (Björklund and Li 2017). Instead, the presence of multi-linear plots in Fig. 11 was observed, indicating the existence of three distinct mechanism pathways. The first region (t0.5 = 0 to t0.5 = 1) was predominantly influenced by film layer diffusion, characterized by electrical interactions between the outer surface of LBWAC and the OXY molecules (Sun et al., 2015). The second region (t0.5 = 1 to t0.5 = 2.5) corresponds to the slow adsorption stage, during which intraparticle diffusion emerged as the primary factor influencing the rate limiting step (Wang et al., 2015). The last stage (t0.5 = 2.5 to t0.5 = 5) signifies the attainment of the equilibrium stage, where the number of adsorbate molecules in the solution becomes minimal. During this phase, the intraparticle diffusion process gradually decelerates (Wang et al., 2010).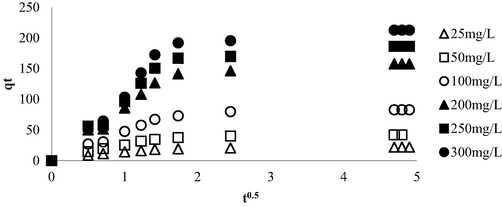
Intraparticle plot for OXY-LBWAC adsorption systems at 30 °C (weight of LWBAC was 0.2 g, volume solution of 200 mL and original pH were used).
Adsorption system
Adsorbates initial concentration (mg/L)
Kp1
(mg/g h1/2)
Kp2
(mg/g h1/2)
Kp3
(mg/g h1/2)
C1
C2
C3
R12
R22
R32
OXY-LBWAC
25
16.25
6.54
0.54
0.11
8.27
19.05
0.9968
0.9302
0.9948
50
27.53
16.51
0.83
0.17
10.15
38.13
0.9974
0.9290
0.9948
100
45.09
35.36
1.22
0.99
13.81
76.85
0.9672
0.9522
0.9948
200
77.71
76.43
4.84
2.49
12.89
134.53
0.9331
0.9662
0.9948
250
87.08
97.28
6.97
2.83
4.40
152.65
0.9314
0.9492
0.9948
300
93.54
120.86
7.34
1.14
9.59
177.57
0.9898
0.9394
0.9948
Fig. 12 presents the Boyd plots for the OXY-LBWAC adsorption system at 30 °C. It was observed that the rate-limiting step for all the OXY starting concentrations was governed by film diffusion. This conclusion was drawn based on the fact that these plots did not pass through the origin (Garba and Rahim 2016).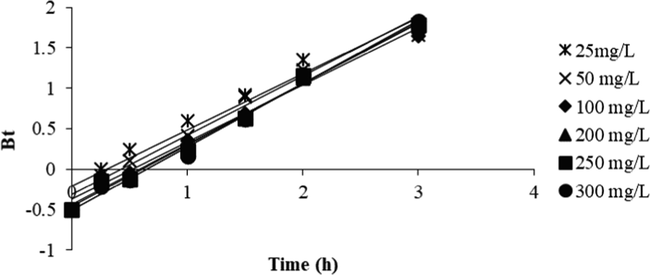
Boyd plot for OXY-LBWAC adsorption systems at 30 °C (weight of LWBAC was 0.2 g, volume solution of 200 mL and original pH were used).
3.5 Adsorption thermodynamic
Table 6 summarizes the thermodynamic parameters for the OXY-LBWAC adsorption system. The ΔH° for the OXY-LBWAC adsorption system was found to be 5.59 kJ/mol. The positive sign of ΔH° value signified the endothermic nature of the adsorption systems studied where higher adsorbate uptakes occurred at higher solution temperatures. This discovery was consistent with the finding in Section 3.2.2. The ΔS° was found to be 0.04 kJ/mol.K, and the positive value of this parameter implied the randomness level at solid–liquid interface had increased. The ΔG° values were between −5.73 and −6.85 kJ/mol. The negative sign of this parameter indicates that the adsorption process was spontaneous in nature. The Ea value was 20.01 kJ/mol and since it was below 42 kJ/mol, the adsorption process was dominated by physisorption (Hao et al., 2020).
ΔH° (kJ/mol)
ΔS° (kJ/mol.K)
ΔG° (kJ/mol)
Ea (kJ/mol)
303 K
318 K
333 K
5.59
0.04
−5.73
−6.29
−6.85
20.01
3.6 Continuous adsorption in bed column
3.6.1 Influence of influent starting concentration
The breakthrough curve for the OXY-LBWAC adsorption system under the influence of different influent starting concentrations is given in Fig. 13. The parameters extracted from Fig. 13 were tabulated in Table 7. From Table 7, when the influent starting concentration increased from 50 to 150 mg/L, the breakthrough time, Tb, and the exhaustion time, Tex had reduced from 11 to 5 h and 49 to 29 h, respectively. At lower influent starting concentrations, the number of OXY molecules to be adsorbed by LBWAC was lower. Therefore, a longer time was taken for OXY molecules to breakthrough the bed column and appeared in the effluent. Similarly, a longer time was needed by lower influent starting concentration to achieve Tex.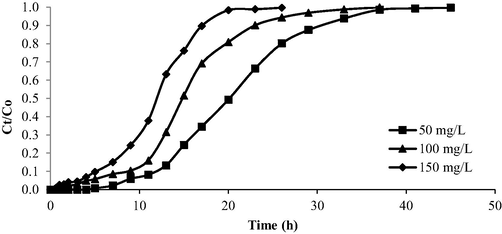
Breakthrough curve for OXY-LBWAC at different influent starting concentration (flow rate = 10 mL/min and bed height = 2 cm).
Inlet concentration, Co (mg/L)
Mass of adsorbent (g)
Breakthrough point, Tb(h)
Exhaustion time, Tex (h)
Total adsorption uptake, qT (mg)
Maximum adsorption uptake, qmax
(mg/g)
50
2.13
11
2940
906.60
425.63
100
3.47
7
2460
1470.00
423.63
150
3.58
5
1740
1498.80
418.65
3.6.2 Influence of influent flow rate
The breakthrough curve for the OXY-LBWAC adsorption system under the influence of different influent flow rates is given in Fig. 14. The parameters gathered from Fig. 14 were presented in Table 8. As the influent flow rate increased from 5 to 15 mL/min, the Tb and Tex declined from 15 h to 2 h and 35 h to 17 h, respectively. Hence, it concludes that a low influent flow rate prolonged Tb and Tex. At a high influent flow rate, the contact time between OXY molecules and the surface of LBWAC was limited, causing the OXY molecules to exit the bed column even before the adsorption process is complete. In addition, higher flow rates were found to cause increased turbulence, resulting in weak mass transfer and limited contact between OXY and LBWAC. Consequently, this led to poor adsorbate removal efficiency (Dwivedi et al., 2008).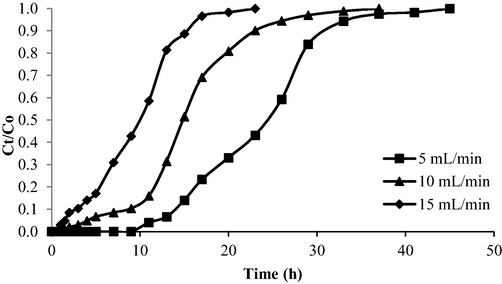
Breakthrough curve for OXY- LBWAC at different flow rate (influent starting concentration = 100 mg/L and column bed height = 2 cm).
Flow rate
(mL/min)
Mass of adsorbent (g)
Breakthrough time, Tb
Exhaustion time, Tex (h)
Total adsorption uptake, qT (mg)
Maximum adsorption uptake, qmax
(mg/g)
5
1.67
15
35
887.10
531.19
10
3.37
5
26
1446.00
429.08
15
2.7
2
17
790.20
292.67
3.6.3 Influence of bed column height
The breakthrough curve for the OXY-LBWAC adsorption system under the influence of different bed column heights is given in Fig. 15. The parameters obtained from Fig. 15 were showed in Table 9. As the bed height in the column increased, Tb and Tex increased from 5 h to 15 h and 26 h to 57 h, respectively. As the bed height increased, more surface area became accessible for the adsorption process to occur. Consequently, it took more time for the LBWAC to be exhausted (Kazemi et al., 2016). Moreover, higher bed height resulted in a longer contact time between OXY and LBWAC, thus improving the adsorption process. This justification supported the finding that higher maximum adsorption uptake, qmax was achieved at the highest column bed height.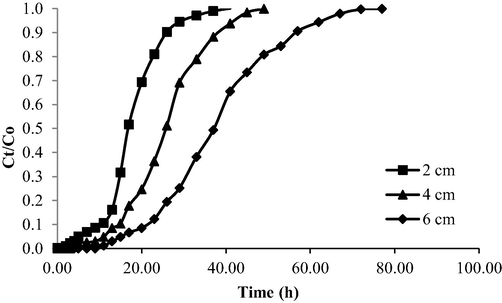
Breakthrough curve for OXY- LBWAC at different column bed height (influent starting concentration = 100 mg/L and influent flow rate = 10 mL/min).
Bed height (cm)
Mass of adsorbent (g)
Breakthrough time, Tb(h)
Exhaustion time, Tex (h)
Total adsorption uptake, qT (mg)
Maximum adsorption uptake, qmax
(mg/g)
2
3.37
5
26
1343.40
398.63
4
3.78
11
37
1991.40
526.82
6
4.92
15
57
3299.40
670.60
3.7 Breakthrough modelling
The data from the continuous bed column study were fitted to three models namely Adams-Bohart, Thomas, and Yoon-Nelson with constant. The parameters for these models were tabulated in Table 10. According to Table 10, the Adams-Bohart model exhibits the lowest R2 values for OXY adsorption, specifically measuring 0.7790. This suggests a weak correlation between the Adams-Bohart model and the experimental data, indicating that the model poorly represents the adsorption process. Consequently, it can be inferred that intraparticle diffusion is not the limiting factor in the rate of adsorption. This conclusion aligns with the findings from the investigation of the batch adsorption mechanism, which indicates that film diffusion serves as the rate-limiting phase (Section 3.4). From Table 10, Thomas model shows very good correlations for breakthrough data with R2 values of 0.9538 for OXY-LBWAC adsorption system. The Thomas model assumes that the adsorption process follows a PSO kinetic model. This was aligned with the finding obtained in batch kinetic study (Section 3.4). From Table 10, the R2 of Yoon-Nelson model was found to be relatively high too of 0.9380. This model predicts the 50% breakthrough time (t0.5) to be 1011 m. This value is relatively accurate with the actual t0.5 of 900 m (error 10.98%).
Adams-Bohart model
kA (L/mg min)
No (mg/L)
R2
0.00160
7370.08
0.7790
Thomas model
kTH (mL/min mg)
qTH (mg/g)
R2
0.0106
5181.73
0.9538
Yoon-Nelson model
t0.5 (min)
τ (min)
kY (1/min)
R2
1011
1188
0.0050
0.9380
4 Conclusion
LBWAC was successfully produced using KOH and CO2 activation, combined with microwave irradiation. LBWAC effectively removed OXY, with a maximum adsorption capacity, Qm of 344.83 mg/g. LBWAC exhibited a high BET surface area (973.21 m2/g), mesopores surface area (842.18 m2/g), and total pore volume (0.3911 cm3/g). In the equilibrium study, as the initial concentration of OXY increased from 25 to 300 mg/L, the adsorption uptake increased while the percentage removal decreased. The highest OXY removal was observed at pH 12 (63.22 mg/g), and a solution temperature of 60 °C (228.44 mg/g). The adsorption data of AMOX-LBWAC exhibited the best fit with the Langmuir isotherm model and PSO kinetic model. The Boyd plot analysis indicated that film diffusion was the rate-determining step in the adsorption process. The enhancement of the adsorption process was attributed to the formation of hydrogen bonds between OXY molecules and specific functional groups present in LBWAC, including primary amine, hydroxy, alkyl carbonate, and terminal alkyne groups. The thermodynamic analysis indicated that the adsorption process is characterized as endothermic, spontaneous, and governed by physical interactions. In bed column studies, the highest values for Tb, Tex, and qmax were obtained at 50 mg/L, 5 mL/min, and 6 cm of OXY influent starting concentration, influent flow rate and LBWAC bed height, respectively. The continuous adsorption data showed the best fit with the Thomas model. The LBWAC produced demonstrated favourable characteristics as an adsorbent, making it suitable for utilization in large-scale antibiotic treatment systems operating in a continuous mode.
Acknowledgments
Ministry of Higher Education Malaysia has supported this research under the Fundamental Research Grant Scheme (project code: FRGS/1/2021/TK0/USM/01/3).
Declaration of Competing Interest
The authors declare that they have no known competing financial interests or personal relationships that could have appeared to influence the work reported in this paper.
References
- Equilibrium, kinetic and thermodynamic studies on the adsorption of direct dye onto a novel green adsorbent developed from Uncaria gambir extract. J. Phys. Sci.. 2012;23:1-13.
- [Google Scholar]
- Statistical optimization of Remazol Brilliant Blue R dye adsorption onto activated carbon prepared from pomegranate fruit peel. Chem. Data Collect.. 2020;28:100426
- [CrossRef] [Google Scholar]
- A novel study on synthesis of egg shell based activated carbon for degradation of methylene blue via photocatalysis. Arab. J. Chem.. 2020;13:8717-8722.
- [CrossRef] [Google Scholar]
- Carbonization of sludge biomass of water treatment plant using continuous screw type conveyer pyrolyzer for methylene blue removal. IOP Conf. Ser.: Earth Environ. Sci.. 2021;765:012112
- [CrossRef] [Google Scholar]
- Electrochemical investigations on low cost KOH activated carbon derived from orange-peel and polyaniline for hybrid supercapacitors. Inorg. Chem. Commun.. 2021;127:108523
- [CrossRef] [Google Scholar]
- Response surface methodology approach of phenol removal study using high-quality activated carbon derived from H3PO4 activation of Acacia mangium wood. Diam. Relat. Mater.. 2023;132:109632
- [CrossRef] [Google Scholar]
- Two-stage batch adsorber design for methylene blue removal by coconut shell activated carbon. Malaysian J. Fundamental Appl. Sci.. 2021;17:768-775.
- [CrossRef] [Google Scholar]
- Optimization of phenol adsorption onto biochar from oil palm empty fruit bunch (EFB) Malaysian J. Fundamental Appl. Sci.. 2019;15:1-5.
- [CrossRef] [Google Scholar]
- The electrochemical behavior of silica and activated carbon materials derived from the rice husk waste for li-ion cells. Diam. Relat. Mater.. 2023;133:109759
- [CrossRef] [Google Scholar]
- Removal of trimethoprim, sulfamethoxazole, and triclosan by the green alga Nannochloris sp. J. Hazard. Mater.. 2016;315:70-75.
- [CrossRef] [Google Scholar]
- Synthesis and characterization of Ni-doped TiO2 activated carbon nanocomposite for the photocatalytic degradation of anthracene. Inorg. Chem. Commun.. 2022;144:109905
- [CrossRef] [Google Scholar]
- Investigation of adsorption properties of oxytetracycline hydrochloride on magnetic zeolite/Fe3O4 particles. Adv. Powder Technol.. 2022;33:103600
- [CrossRef] [Google Scholar]
- Adsorption of organic stormwater pollutants onto activated carbon from sewage sludge. J. Environ. Manage.. 2017;197:490-497.
- [CrossRef] [Google Scholar]
- Synthesis of multi-application activated carbon from oak seeds by KOH activation for methylene blue adsorption and electrochemical supercapacitor electrode. Arab. J. Chem.. 2021;14:102958
- [CrossRef] [Google Scholar]
- The exchange adsorption of ions from aqueous solutions by organic zeolites. Ion-exchange equilibria. J. Am. Chem. Soc.. 1947;69:2818-2829.
- [CrossRef] [Google Scholar]
- Surface modification of date palm activated carbonaceous materials for heavy metal removal and CO2 adsorption. Arab. J. Chem.. 2023;16:104403
- [CrossRef] [Google Scholar]
- Competitive adsorption of tetracycline, oxytetracycline and chlortetracycline on soils with different pH value and organic matter content. Environ. Res.. 2019;178
- [CrossRef] [Google Scholar]
- Advanced oxidation processes for the removal of antibiotics from water. An overview. Water (Switzerland). 2020;12
- [CrossRef] [Google Scholar]
- A review of metal organic framework (MOFs)-based materials for antibiotics removal via adsorption and photocatalysis. Chemosphere. 2021;272
- [CrossRef] [Google Scholar]
- Column performance of granular activated carbon packed bed for Pb(II) removal. J. Hazard. Mater.. 2008;156:596-603.
- [CrossRef] [Google Scholar]
- Hydrothermal synthesis of structurally variable binary CuAl, MnAl and ternary CuMnAl hydroxides for oxytetracycline antibiotic adsorption. J. Environ. Chem. Eng.. 2020;8:103535
- [CrossRef] [Google Scholar]
- Attenuation of nitrates, antibiotics and pesticides from groundwater using immobilised microalgae-based systems. Sci. Total Environ.. 2020;703
- [CrossRef] [Google Scholar]
- Conversion of teak wood waste into microwave-irradiated activated carbon for cationic methylene blue dye removal: optimization and batch studies. Arab. J. Chem.. 2022;15:104081
- [CrossRef] [Google Scholar]
- Evaluation of optimal activated carbon from an agricultural waste for the removal of para-chlorophenol and 2,4-dichlorophenol. Process Saf. Environ. Prot.. 2016;102:54-63.
- [CrossRef] [Google Scholar]
- Preparation, characterization, and dye removal study of activated carbon prepared from palm kernel shell. Environ. Sci. Pollut. Res.. 2018;25:5076-5085.
- [CrossRef] [Google Scholar]
- Northern green algae have the capacity to remove active pharmaceutical ingredients. Ecotoxicol. Environ. Saf.. 2019;170:644-656.
- [CrossRef] [Google Scholar]
- Functionalized diatomite/oyster shell powder doped electrospun polyacrylonitrile submicron fiber as a high-efficiency adsorbent for removing methylene blue from aqueous solution: thermodynamics, kinetics and isotherms. J. Mol. Liq.. 2020;298:112022
- [CrossRef] [Google Scholar]
- Studies on adsorption of oxytetracycline from aqueous solutions onto hydroxyapatite. Sci. Total Environ.. 2018;628–629:36-43.
- [CrossRef] [Google Scholar]
- Adsorption enhancement of Congo red dye from wastewater based on edamame shell originated activated carbon by the cations: experimental and theoretical studies. Diam. Relat. Mater.. 2023;136:109930
- [CrossRef] [Google Scholar]
- Sorption of dye from aqueous solution by peat. Chem. Eng. J.. 1998;70:115-124.
- [CrossRef] [Google Scholar]
- Mesoporous activated carbon from mangosteen (Garcinia mangostana) peels by H3PO4 assisted microwave: Optimization, characterization, and adsorption mechanism for methylene blue dye removal. Diam. Relat. Mater.. 2022;129:109389
- [CrossRef] [Google Scholar]
- Kinetics and isotherms of oxytetracycline adsorption on β-cyclodextrin/carboxymethylcellulose hydrogel films. Aquac. Res.. 2019;50:3412-3419.
- [CrossRef] [Google Scholar]
- Effects of one-step and two-step KOH activation method on the properties and supercapacitor performance of highly porous activated carbons prepared from Lycopodium clavatum spores. Diam. Relat. Mater.. 2023;135:109873
- [CrossRef] [Google Scholar]
- Thiol-incorporated activated carbon derived from fir wood sawdust as an efficient adsorbent for the removal of mercury ion: Batch and fixed-bed column studies. Process Saf. Environ. Prot.. 2016;100:22-35.
- [CrossRef] [Google Scholar]
- A facile calcination conversion of groundwater treatment sludge (GTS) as magnetic adsorbent for oxytetracycline adsorption. Sci. Rep.. 2021;11:5276.
- [CrossRef] [Google Scholar]
- Occurrence and toxicity of antibiotics in the aquatic environment: a review. Chemosphere. 2020;251:126351
- [CrossRef] [Google Scholar]
- About the theory of so-called adsorption of soluble substances. Sven. Vetenskapsakad. Handingarl.. 1898;24:1-39.
- [Google Scholar]
- The adsorption of gases on plane surfaces of glass, mica and platinum. J. Am. Chem. Soc.. 1918;40:1361-1403.
- [CrossRef] [Google Scholar]
- Use of microalgae based technology for the removal of antibiotics from wastewater: a review. Chemosphere. 2020;238
- [CrossRef] [Google Scholar]
- In-situ growing of metal-organic frameworks on three-dimensional iron network as an efficient adsorbent for antibiotics removal. Chem. Eng. J.. 2020;392
- [CrossRef] [Google Scholar]
- Simultaneous removal of tetracycline and oxytetracycline antibiotics from wastewater using a ZIF-8 metal organic-framework. J. Hazard. Mater.. 2019;366:563-572.
- [CrossRef] [Google Scholar]
- A critical review of the estimation of the thermodynamic parameters on adsorption equilibria. Wrong use of equilibrium constant in the Van't Hoof equation for calculation of thermodynamic parameters of adsorption. J. Mol. Liq.. 2019;273:425-434.
- [CrossRef] [Google Scholar]
- Nitric oxide removal by zinc chloride activated oil palm empty fruit bunch fibre. Malaysian J. Fundamental Appl. Sci.. 2021;17:84-89.
- [CrossRef] [Google Scholar]
- Combined effects of pore structure and surface chemistry on water vapor adsorption characteristics of coal: equilibrium, thermodynamic and kinetic studies. Arab. J. Chem.. 2023;16:104790
- [CrossRef] [Google Scholar]
- Steam-activated carbon from malt bagasse: optimization of preparation conditions and adsorption studies of sunset yellow food dye. Arab. J. Chem.. 2021;14:103001
- [CrossRef] [Google Scholar]
- FTIR study of the oxidation of amorphous carbon by ozone at 300 K — Direct COOH formation. Carbon. 2001;39:1167-1173.
- [CrossRef] [Google Scholar]
- Malachite green dye adsorption by jackfruit based activated carbon: Optimization, mass transfer simulation and surface area prediction. Diam. Relat. Mater.. 2023;136:109991
- [CrossRef] [Google Scholar]
- Mass transfer simulation on remazol brilliant blue R dye adsorption by optimized teak wood Based activated carbon. Arab. J. Chem.. 2023;16:104780
- [CrossRef] [Google Scholar]
- Optimization and mass transfer simulation of remazol brilliant blue R dye adsorption onto meranti wood based activated carbon. Arab. J. Chem.. 2023;16:104683
- [CrossRef] [Google Scholar]
- Molecular dynamics simulation of H2S adsorption behavior on the surface of activated carbon. Inorg. Chem. Commun.. 2020;118:108048
- [CrossRef] [Google Scholar]
- Box-Behnken design, kinetic, and isotherm models for oxytetracycline adsorption onto Co-based ZIF-67. Appl. Nanosci.. 2021;11:2347-2359.
- [CrossRef] [Google Scholar]
- Recent perspective of antibiotics remediation: a review of the principles, mechanisms, and chemistry controlling remediation from aqueous media. Sci. Total Environ.. 2023;881:163469
- [CrossRef] [Google Scholar]
- Nitrogen tailored activated carbon via microwave synthesis method for high removal of hydrogen sulfide. Malaysian J. Fundamental Appl. Sci.. 2021;17:794-804.
- [CrossRef] [Google Scholar]
- Preparation, characterization and Cr(VI) adsorption evaluation of NaOH-activated carbon produced from Date Press Cake; an agro-industrial waste. Bioresour. Technol.. 2018;258:48-56.
- [CrossRef] [Google Scholar]
- Determination of phenolic compounds from Tabebuia Rosea (USIM Sakura) trees extracted oil using fourier-transform infrared spectroscopy. Proceeding Insan Junior Researchers Int. Conf. 2014:73-81.
- [Google Scholar]
- Batch adsorption of activated coconut shell for the removal of zinc from palm oil mill effluent. Malaysian J. Fundamental Appl. Sci.. 2019;15:708-711.
- [CrossRef] [Google Scholar]
- Adsorption characteristics of molecular oxytetracycline onto alumina particles: the role of surface modification with an anionic surfactant. J. Mol. Liq.. 2019;287:110900
- [CrossRef] [Google Scholar]
- Nature's waste turned savior: optimizing pineapple peel–based activated carbon for effective Remazol Brilliant Violet dye adsorption using response surface methodology. Inorg. Chem. Commun.. 2023;153:110844
- [CrossRef] [Google Scholar]
- Activated carbon prepared by hydrothermal pretreatment-assisted chemical activation of date seeds for supercapacitor application. Inorg. Chem. Commun.. 2023;155:111012
- [CrossRef] [Google Scholar]
- Sulphur-doped carbon particles from almond shells as cheap adsorbent for efficient Cd(II) adsorption. Diam. Relat. Mater.. 2023;131:109542
- [CrossRef] [Google Scholar]
- Ni-Zn metal-organic framework based membranes for rejection of Pb(II) ions. Inorg. Chem. Commun.. 2022;146:110084
- [CrossRef] [Google Scholar]
- Activation of graphene aerogel with phosphoric acid for enhanced electrocapacitive performance. Carbon. 2015;92:1-10.
- [CrossRef] [Google Scholar]
- Kinetics of ammonia synthesis on promoted iron catalyst. J. Acta Phys. Chim. USSR.. 1940;12:327.
- [Google Scholar]
- Copper oxide nanoparticles modified activated carbon nanocomposite towards removal of tetracycline from waste water. Inorg. Chem. Commun.. 2023;152:110687
- [CrossRef] [Google Scholar]
- Global trends in antimicrobial use in food animals. Proc. Natl. Acad. Sci. U.S.A.. 2015;112:5649-5654.
- [CrossRef] [Google Scholar]
- Removal of Reactive Blue 21 onto magnetic chitosan microparticles functionalized with polyamidoamine dendrimers. React. Funct. Polym.. 2015;91–92:43-50.
- [CrossRef] [Google Scholar]
- Biochar as an enhancer of the stability, mesoporous structure and oxytetracycline adsorption capacity of ferrihydrite: role of the silicon component. Sci. Total Environ.. 2023;875:162652
- [CrossRef] [Google Scholar]
- Adsorption of basic dyes on activated carbon prepared from Polygonum orientale Linn: equilibrium, kinetic and thermodynamic studies. Desalination. 2010;254:68-74.
- [CrossRef] [Google Scholar]
- Microalgae-based technology for antibiotics removal: from mechanisms to application of innovational hybrid systems. Environ. Int.. 2021;155
- [CrossRef] [Google Scholar]
- Template-free preparation of nitrogen-doped activated carbon with porous architecture for high-performance supercapacitors. Microporous Mesoporous Mater.. 2019;276:280-291.
- [CrossRef] [Google Scholar]
- Scavenging malachite green dye from aqueous solution using durian peel based activated carbon. Malaysian J. Fundamental Appl. Sci.. 2021;17:95-103.
- [CrossRef] [Google Scholar]
- Single-stage microwave assisted coconut shell based activated carbon for removal of Zn(II) ions from aqueous solution – Optimization and batch studies. Arab. J. Chem.. 2022;15:104011
- [CrossRef] [Google Scholar]
- Single-Stage optimized microwave-induced activated carbon from coconut shell for cadmium adsorption. Chem. Eng. Technol.. 2022;45:1943-1951.
- [CrossRef] [Google Scholar]
- Facile synthesis of eco-friendly activated carbon from leaves of sugar beet waste as a superior nonconventional adsorbent for anionic and cationic dyes from aqueous solutions. Arab. J. Chem.. 2023;16:104900
- [CrossRef] [Google Scholar]
- Effect of graphitic carbon nitride powders on adsorption removal of antibiotic resistance genes from water. Chin. Chem. Lett.. 2020;31:2843-2848.
- [CrossRef] [Google Scholar]
- Soil oxytetracycline alters the effects of phosphate fertilisation and Bacillus amyloliquefaciens on the bacterial community of Medicago sativa rhizosphere. Appl. Soil Ecol.. 2023;187:104861
- [CrossRef] [Google Scholar]
- Deciphering of microbial community and antibiotic resistance genes in activated sludge reactors under high selective pressure of different antibiotics. Water Res.. 2019;151:388-402.
- [CrossRef] [Google Scholar]
- Preparation of Quercus mongolica leaf-derived porous carbon with a large specific surface area for highly effective removal of dye and antibiotic from water. Arab. J. Chem.. 2022;15:104031
- [CrossRef] [Google Scholar]


