

Translate this page into:
Enhancement of phenolic profile and antioxidant activity of black glutinous rice (Oryza sativa var. glutinosa) due to tape fermentation
⁎Corresponding author. widiastuti.setyaningsih@ugm.ac.id (Widiastuti Setyaningsih)
-
Received: ,
Accepted: ,
This article was originally published by Elsevier and was migrated to Scientific Scholar after the change of Publisher.
Peer review under responsibility of King Saud University.
Abstract
Black glutinous rice (BGR) naturally contains phenolic compounds in free and conjugated form or bound to the structural matrix, which may affect its bioactivity. The degradation of the matrix cell wall by microbial activity during fermentation may endorse the release of bound phenolic compounds and enhance the availability of the compounds. This study aimed to assess the impact of tape fermentation on the profile of individual phenolic compounds and the antioxidant activity of BGR. Fermentation up to 72 h at 30 °C was performed by adding the cooked BGR with a tape starter (0.3% w/w). The fermentation for over 48 h increased free phenolic compounds while altering the composition of free, free-conjugated, and bound phenolic compounds. In comparison to the initial material, significant enhancement in the level of protocatechuic aldehyde (13 × ), caffeic acid (2 × ), vanillic acid (1 × ), vanillin (1 × ), p-coumaric acid (1 × ), ferulic acid (1 × ), and isoferulic acid (1 × ) was acknowledged in the final fermented product while sinapic and 2,4,6-trihydroxybenzoic acid was merely detected after 24 h of fermentation. As a result, antioxidant activity was also increased notably (p < 0.05) starting from 48 h of fermentation, while principal component analysis revealed that the activity was strongly contributed by 2,4,6-trihydroxybenzoic acid. Henceforth, the resulting tape fermentation of BGR can be considered a source of phenolic compounds that provide high antioxidant activity.
Keywords
Tape fermentation
Antioxidants
Chemometrics
Free phenolic compounds
Sticky rice
Yeast

1 Introduction
There are several criteria to group the types of rice, such as pigmented and non-pigmented rice; glutinous and non-glutinous; aromatic and non-aromatic rice; or based on the length of the grain (short, semi-long, and long grain). Although the most consumed varieties of rice have a white pericarp, black-pigmented rice is widely known to provide better health properties (Min et al., 2010). The latter varieties are also present in nature as glutinous rice. Phenolic compounds are naturally present in rice commodities (Setyaningsih et al., 2016) and have been known to act as antioxidants by increasing cellular antioxidant and anti-inflammatory capacity (Bhat and Riar, 2017; Gong et al., 2020; Janarny and Gunathilake, 2020).
The natural compounds present in black glutinous rice (BGR) exhibit the antioxidant activity of 16 to 30% (radical scavenging activity) contributed by phenolic compounds (6.65 mg g−1) (Sompong et al., 2011), which may comprise protocatechuic acid, protocatechuic aldehyde, vanillic acid, vanillin, ferulic acid, p-coumaric acid, p-hydroxybenzoic acid, caffeic acid, and chlorogenic acid (Setyaningsih et al., 2016). Additionally, most of them have been also found in the BGR bran, including protocatechuic acid, p-hydroxybenzoic acid, vanillic acid, p-coumaric acid, ferulic acid, and sinapic acid in free and bound forms (Huang and Lai, 2016).
The availability of phenolic compounds in free, conjugated, or bound forms may affect their bioactivity (Gao et al., 2017; Santos-Zea et al., 2018). Phenolic compounds can be conjugated with other substances such as alcohols, fatty acids, sterols, and glucosides through ester, ether, and glycosidic bonds (Ramawat and Mérillon, 2013). In addition, the phenolic compounds can also bind to structural components of cell walls such as cellulose, hemicellulose, structural proteins, pectin, and lignin, resulting in compounds releasing process inhibition (Acosta-Estrada et al., 2014; Santos-Zea et al., 2018).
Rice, as many other cereals, contains higher amounts of bound phenolic compounds than free phenolic compounds (Zeng et al., 2016). However, the bound compounds provide less bioavailability and bioactivity (Zhang et al., 2020). Therefore, specific processing methods are needed to increase phenolic compounds that can be released from the food matrix to increase the level of those antioxidant compounds in the free form.
Several studies have shown the positive effect of biotechnological processes in increasing the availability of phenolic compounds, viz., tape fermentation, the fermentation of glutinous rice using ragi tape. This technique involves a controlled microbial growth process, which modifies the food components through a series of enzymatic reactions (Dimidi et al., 2019). Apart from increasing aglycone formation, the fermentation process can facilitate the release of phenolic compounds through enzymatic cell wall degradation and hydrolysis of glycosidic bonds (Huynh et al., 2014).
A former study on fermentation for cereals using lactic acid bacteria (Lactobacillus bulgaricus and Streptococcus thermophilus), fungi (Aspergillus oryzae and Rhizopus oryzae), and yeasts (Saccharomyces cerevisiae) disclosed some changes in the profile of free and bound phenolic compounds during the process (Sandhu et al., 2017). An increase of free phenolic acids in two folds was also reported during the fermentation of barley and oats using lactic acid bacteria of Lactobacillus acidophilus, Lactobacillus johnsonii, and Lactobacillus reuteri. As a result of the increase in free phenolic compounds, higher Bioaccessibility, and bioavailability were described (Hole et al., 2012). Furthermore, fermentation with the combination of Lactobacillus plantarum, Lactobacillus fermentum, and Saccharomyces cerevisiae cultures on extruded brown rice can double the amount of free and conjugated phenolic compounds, which was higher than applying single culture fermentation. The high release of phenolic compounds is related to the enzymatic hydrolysis by Saccharomyces cerevisiae which can emit several enzymes, including protease, esterase, xylanase, and cellobiohydrolase (Khan et al., 2020).
A mixed population of bacteria (Acetobacter and Pediococcus pentosaceus), fungi (Aspergillus oryzae, Rhizopus oryzae, and Mucor rouxii) and yeast (Saccharomyces cerevisiae, Candida, Endomycopsis burtonii, and Hansenula anomala), namely ragi tape was demonstrated to grow in synergy during the traditional rice fermentation in Indonesia (Aryanta, 2000; Harmayani et al., 2017). The common variety used for fermentation is white glutinous rice. However, BGR can be applied for developing fermented product that provides promising health benefits due to it showing a higher amount of phenolic compounds. Henceforth, this study aimed to assess the profile of free, free-conjugated, and bound phenolic compounds of BGR during fermentation by ragi tape. Additionally, individual phenolic compounds were also identified and quantified along with the measurement of the antioxidant activity of raw, intermediate, and finished fermented BGR. Finally, chemometrics was applied to determine the phenolic compounds produced during fermentation that mostly contribute to the antioxidant activities. Using this information, the specific conditions for the fermentation could be designed to increase the antioxidant level of the meal containing fermented rice. Our research offers a fresh perspective by using tape fermentation to create health-enhancing foods. Prior investigations into tape-fermented black glutinous rice have been scarce and often overlooked evaluating of essential bioactive compounds, including individual phenolic compounds and their antioxidant activities. Our study breaks new ground by investigating how tape fermentation can enrich bioactive compounds in black glutinous rice, particularly focusing on phenolic compounds and their associated antioxidant activities.
2 Materials and methods
2.1 Materials
The main ingredient used in the study was black glutinous rice (BGR) of YR02 Blitar variety from a local farmer in Blitar (Indonesia). Other ingredients were ragi tape produced by Na Kok Liong (NKL, Surakarta, Indonesia), and distilled water was provided by CV Megatama Mandiri (Jakarta, Indonesia). HPLC-grade methanol, acetic acid, and acetonitrile were purchased from Merck KGaA (Darmstadt, Germany). Analytical standards (2,4,6-trihydroxybenzoic acid (THB), protocatechuic acid (PRO), protocatechuic aldehyde (PRA), caffeic acid (CAF), vanillic acid (VAA), vanillin (VAN), p-coumaric acid (COU), ferulic acid (FER), isoferulic acid (IFA), sinapic acid (SIN), ascorbic acid, sodium hydroxide, hydrochloric acid, hexane, ethyl acetate, sodium carbonate, Folin-Ciocalteu, 2,2-diphenyl-1-picrylhydrazyl (DPPH), iron(III) chloride hexahydrate, and sodium nitrite were purchased from Sigma–Aldrich (St. Louis, MO, USA).
2.2 Sample preparation
BGR was weighed (1000 g) and soaked overnight (12 h) in 1500 mL of distilled water. After draining the water, BGR was then exposed to steaming for 120 min. During the process, 250 mL of water was added at 60 min of steaming. Subsequently, the sample was transferred aseptically into a container and inoculated with ragi tape 0.3% (w/w). The fermentation process was conducted for 0, 24, 48, and 72 h in dark conditions. Finally, the fermented samples were freeze-dried and stored in a closed, dark container for further processing.
2.3 Free phenolic extraction
The extraction of free phenolic compounds refers to Gao et al. (2017) method with modifications. Sample (2 g) was dissolved in 20 mL of methanol:water:ascorbic acid 80:19:1. The mixture was exposed to ultrasound cavitation with pulse duty cycle 0.5 s−1 for 30 min at ambient temperature. The resulting extract was separated with the solid material using 10 min of centrifugation at 4.000 rpm, and this experiment was repeated three times. The supernatant was then collected and evaporated using a vacuum rotary evaporator to retain the extract volume of 10 mL. Afterward, hexane (20 mL) was added to the extract and was agitated for 20 min. The hexane layer was then removed, and the remaining liquid was extracted using ethyl acetate (20 mL) in three cycles. Later, the supernatant was combined and dried using a rotary vacuum evaporator. The dried extract was then diluted in 50% methanol in ultrapure water (v/v), filtered through a 0.22 µm nylon filter, and subjected to further analysis.
2.4 Free-conjugated phenolic extraction
The first step to extract free-conjugated phenolic compounds was the former described method to determine the free phenolic compounds (section 2.3) to retain the 10 mL supernatant. Subsequently, the supernatant was hydrolyzed at 40 °C by 4 M sodium hydroxide for two h. The resulting liquid was adjusted to reach pH 2 using hydrochloric acid. Later, the oil was removed by adding 20 mL of hexane to the liquid sample and stirring for 20 min. The upper layer was discarded. The remaining sample was then extracted 3 × with 20 mL of ethyl acetate. Finally, the supernatant was combined and evaporated to dryness. The dried extract was then diluted in 5 mL of 50% methanol in ultrapure water (v/v), filtered through a 0.22 µm nylon filter, and subjected to further analysis.
2.5 Bound phenolic extraction
The solid residue remaining from the free phenolic extraction (described in section 2.3) was used to extract bound phenolic compounds. Formerly, the residue was hydrolyzed at 40 °C by 100 mL of sodium hydroxide (4 M) for 2 h and was adjusted using hydrochloric acid to reach pH 2. Then, hexane (20 mL) was added and stirred for 20 min for oil removal. The bound phenolic compounds were extracted 3 × using 20 mL of ethyl acetate from the liquid sample. The resulting supernatant was dried in a rotary vacuum evaporator prior to the dissolution in 5 mL of 50% methanol in ultrapure water (v/v). The sample was then filtered through a 0.22 µm nylon filter for further analysis.
2.6 Total phenolic content
Analysis of total phenolic compounds refers to Roy et al. (2009). The sample (125 µL) were diluted in 250 µL of distilled water and were combined with 125 µL of Folin-Ciocalteu reagent. The mixture was homogenized and left in the dark for 5 min at room temperature. Subsequently, sodium carbonate (1.25 mL, 7% w/v) and distilled water (1 mL) were added. The mixture was homogenized and kept in the dark for 90 min at room temperature. The absorbance at a wavelength of 760 nm was measured. The total phenolic content of the samples was expressed in mg GAE g−1 using a calibration curve obtained using standard solutions of gallic acid at a concentration range of 0 to 250 µg mL−1.
2.7 Total flavonoid content
The total flavonoid content was analyzed based on Roy et al. (2009). Quercetin was used to establish a calibration curve covering concentrations from 0 to 800 g mL−1. The sample (0.2 mL) was mixed with 0.8 mL distilled water and 50 µL sodium nitrite and left for 6 min. Then 100 µL of 10% aluminum chloride was added and left for another 6 min. Subsequently, sodium hydroxide (0.5 mL) was added, followed by 0.85 mL of distilled water to reach a volume of 2.5 mL. The mixture was homogenized, and the absorbance was immediately measured at 510 nm. The test results were expressed as mg QE g−1 sample.
2.8 Antioxidant activity assay
Antioxidant activity refers to Sompong et al. (2011) method, which was expressed as DPPH radical scavenging activity and the IC50 value. A total of 200 µL of the sample was mixed with 1 mL of 0.1 mM DPPH reagent and then homogenized. After being incubated in the dark for 60 min, the absorbance was measured at a wavelength of 515 nm. A control was performed following the same procedure, however, without adding the sample but water. The IC50 value (µg mL−1) was obtained from regression analysis, while the percentage of radical scavenging activity was calculated using the following formula.
2.9 Phenolic compound determination by UHPLC-PDA
Samples were analyzed using ultrahigh-performance liquid chromatography (UHPLC-PDA) system (Acquity UHPLC Waters Corporation, Milford, MA, USA). A C18 reversed-phase column (1.7 m, 2.1 m, 100 mm, Waters) was used for the chromatographic separation. The temperature in the column was fixed at 47 °C. Phase A (2% acetic acid in ultrapure water) and phase B (2% acetic acid in acetonitrile) were used as mobile phases. The gradient of elution was as follows (time (min) − solvent B (%)): 0–––0; 1–––0; 2–––0; 3–––5; 4–––10; 5–––30; 12–––100. The flow rate was 0.55 mL min−1, while the injection volume was 3.0 μL. For quantification, the PDA detector was set at a fixed wavelength at the maximum absorbance of the corresponding compounds for peak integrations, i.e., 260 nm for 2,4,6-trihydroxybenzoic acid, protocatechuic acid, protocatechuic aldehyde, and vanillic acid; and 320 nm for caffeic acid, vanillin, p-coumaric acid, ferulic acid, sinapic acid, and isoferulic acid.
The identification of phenolic compounds in the samples was achieved initially by comparison of retention times and UV–Vis spectra with those of standards. A series of standard solutions of phenolic compounds found in samples were prepared by dilution to establish a calibration curve that covered concentrations ranging from 1 to 50 mg/L. The standard deviation (σ) and the slope (a) from the regression analysis were then used to calculate the limit of detection (LOD) and limit of quantification (LOQ). Through regression analyses, the excellent linearity of calibration curves for the ten studied phenolic compounds was indicated by a high coefficient of determination (R2) of more than 0.9. According to AOAC guidelines, the acceptable limit of CV value for 1–100 ppm of analyte concentration is about 5.3 to 11% (AOAC, 2016). Therefore, the precision of the method to quantify the ten identified phenolic compounds met the requirements of AOAC.
2.10 Data analysis
The analysis of variance (ANOVA) for a completely randomized design was calculated using IBM SPSS Statistics Version 25.0 (SPSS Inc., Chicago, IL, USA). The fermentation was observed at 0, 24, 48, and 72 h with three experimental repetitions resulting in a total of 12 experimental run that were randomized performed. The dependent variables included the content of total phenolic, total flavonoid, and individual phenolic compounds determined using UHPLC-PDA as well as antioxidant activity. The difference was defined by Duncan's Multiple Range Test (DMRT) at a 5% level. Principal component analysis (PCA) was performed to observe data trends from the compositions of phenolic compounds in fermented samples and their antioxidant activities.
3 Results
3.1 Total phenolic compounds and flavonoids content in fermented black glutinous rice
The changes in the phenolic compounds content in black glutinous rice (BGR) during the fermentation process can be observed based on the evaluation of the total phenolic and flavonoid compounds. Fig. 1 shows the total phenolic and flavonoid content in free, free-conjugated, and bound phenolic extracts of BGR fermented with ragi tape.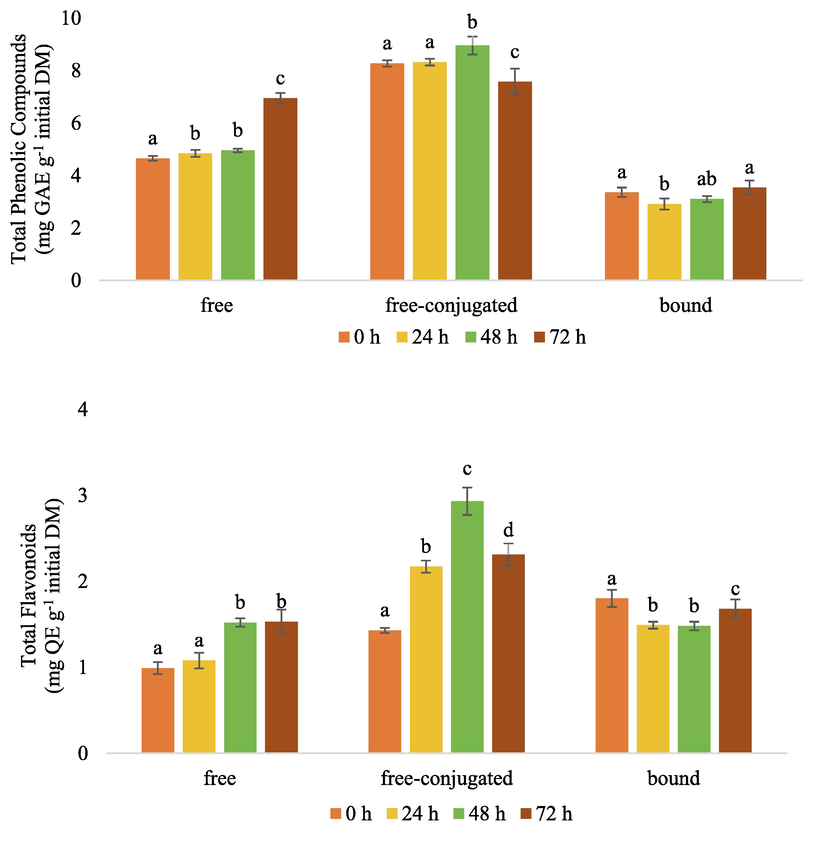
Total phenolic compound (mg GAE g−1 initial DM) and flavonoid contents (mg QE g−1 initial DM) in fermented black glutinous rice. GAE: gallic acid equivalent, QE: quercetin equivalent, DM: dry matter. For any specific type of phenolic compound, the same letters mean no significant differences, p < 0.05.
Phenolic compounds in food are generally found in free and bound forms. In cereal products, the compounds are mainly bound to structural components of cell walls, such as cellulose, pectin, arabinoxylan, and structural proteins (Santos-Zea et al., 2018; Shahidi and Yeo, 2016). However, the amount may alter through fermentation. This study revealed that the fermentation process using ragi tape significantly (p < 0.05) affected the total phenolic compound of BGR (Fig. 1). The free phenolic content increased from 4.65 to 6.94 mg GAE g−1 initial DM (+49%) after 72 h of fermentation. Similarly, the free-conjugated phenolic content increased from 8.27 to 8.95 mg GAE g−1 initial DM after 48 h of fermentation (+8%). In contrast, a non-significant alteration of the level of bound phenolic compounds was observed. This occurrence can be explained due to the activity of β-glucosidases, proteases, amylases, and xylanases produced during fermentation.
The β-glucosidases contribute to the hydrolysis of phenolic glycosides to release free phenolics, whilst proteases, amylases, and xylanases contribute to disintegrating the plant cell wall matrices, thus facilitating the distortion of chemical bonds to release the bound phenolics (Acosta-Estrada et al., 2014; Adebo and Medina-Meza, 2020). Consequently, bound phenolic compounds can be released as free and conjugated phenolic compounds. The enzymes responsible for this function can be produced by microorganisms during the tape fermentation process. Within ragi tape, there exists a diverse population of microorganisms, comprising a mixture of bacteria (Acetobacter, Pediococcus pentosaceus), fungi (Aspergillus oryzae, Rhizopus oryzae, Mucor rouxii), and yeast (Saccharomyces cerevisiae, Candida, Endomycopsis burtonii, Hansenula anomala) (Aryanta, 2000; Harmayani et al., 2017). Similar mechanism was also reported during the fermentation by Eurotium cristatum YL-1 for 15 days. There was a strong positive correlation (R2 greater than 0.95) between the release of phenolic compounds with the activity of α-amylase, β-glucosidase, and cellulase (Chen et al., 2020).
In addition, co-culture fermentation of Lactobacillus plantarum, Lactobacillus fermentum, and Saccharomyces cerevisiae for 24 h significantly increased free, conjugated, and bound phenolic and flavonoid compounds with a total increase of 93.3% and 61.3%, respectively (Khan et al., 2020). However, Wang et al. (2018) revealed that excessive fermentation time could reduce the content of phenolic compounds due to the degradation by enzymes produced during the fermentation.
BGR fermentation with ragi tape also significantly increased (p < 0.05) free and free-conjugated flavonoids after fermentation (Fig. 1). The free flavonoid content increased by 54% after 48 h fermentation, while free-conjugate flavonoid doubled. This finding agrees with a previously reported study on co-culture fermentation using yeast and lactic acid bacteria for 24 h that could increase the free and conjugated flavonoid content by 74 and 49%, respectively (Khan et al., 2020). During fermentation, microorganisms synthesize amino acids that are not only crucial components of protein biosynthesis, but they are also precursors of the diverse phenolic secondary metabolites, including flavonoid (Chrzanowski, 2020). Phenylalanine ammonia-lyase first catalyzes the deamination of phenylalanine to cinnamic acid, and cinnamate-4-hydroxylase catalyzes the hydroxylation of cinnamic acid to p-coumaric acid (Siddiqui et al., 2011), while chalcone synthase and chalcone-flavanone isomerase contribute to form flavonoid (Furumura et al., 2022; Seshime et al., 2005). The synthesized phenolic and flavonoid compounds may act as antioxidants, provide cell protection of the microbes against exposure to reactive oxygen species (ROS) and increase cell resistance to oxidation (Bayliak et al., 2016; Wu et al., 2011).
3.2 Identification of individual phenolic compounds in fermented black glutinous rice
The individual phenolic compounds in fermented BGR were identified and quantified using UHPLC-PDA by comparing the retention times and UV–Vis spectra (Fig. 2) between the compound and the corresponding standard. The performance of UHPLC-PDA is presented in Table 1. Ten phenolic compounds were identified, including 2,4,6-trihydroxybenzoic acid, protocatechuic acid, protocatechuic aldehyde, caffeic acid, vanillic acid, vanillin, p-coumaric acid, ferulic acid, sinapic acid, and isoferulic acid. y is the peak area (µV*sec) in the UPLC-PDA chromatogram; x is the corresponding analyte concentration in the injected sample; %CV, coefficient of variation; RT, retention time.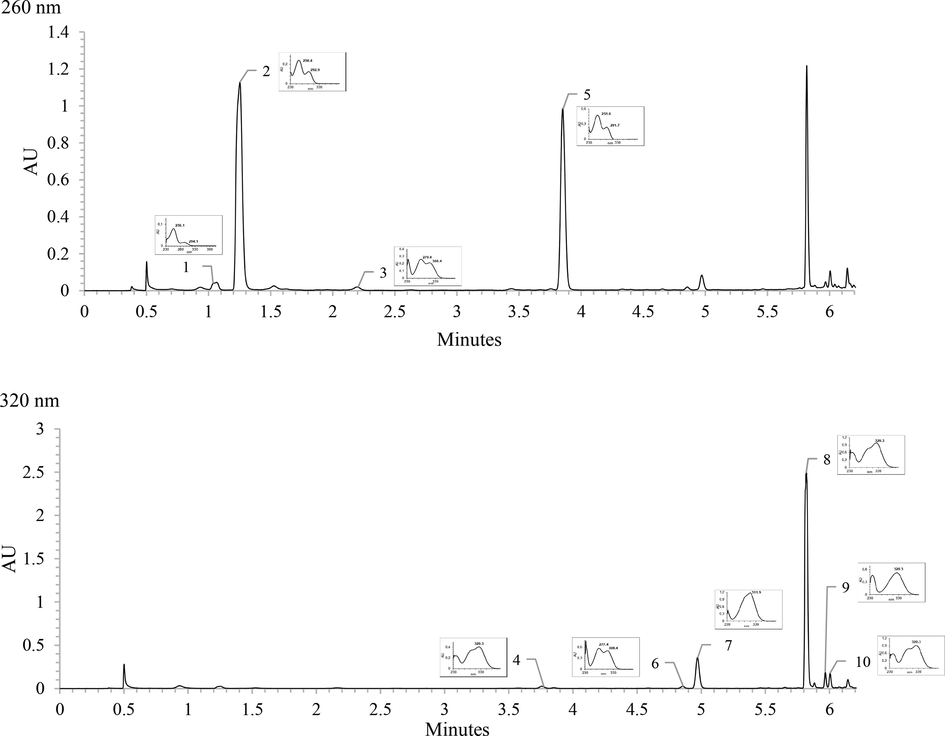
UV–Vis chromatogram and spectra of identified phenolic compounds in fermented BGR; (1) 2,4,6-trihydroxybenzoic acid, (2) protocatechuic acid, (3) protocatechuic aldehyde, (4) caffeic acid, (5) vanillic acid, (6) vanillin, (7) p-coumaric acid, (8) ferulic acid, (9) sinapic acid, (10) isoferulic acid.
Analytes
RT (min)
Concentration (mg L-1)
Intraday, %CV (n = 9)
Interday, %CV (n = 3 × 3)
Linear Equation
R2
LOD
LOQ
RT
Area
RT
Area
2,4,6 Trihydroxybenzoic acid
1.234
0.9785
0.52
1.58
0.87
0.40
5.14
0.29
Protocatechuic acid
1.360
0.9936
0.35
1.06
0.43
0.33
1.95
0.14
Protocatechuic aldehyde
2.601
0.9965
0.26
0.78
0.77
0.32
3.83
0.09
Caffeic acid
4.391
0.9627
0.36
1.10
0.38
0.74
0.39
0.18
Vanillic acid
4.563
0.9959
0.28
0.84
0.33
0.29
0.24
0.27
Vanillin
5.471
0.9632
1.57
4.76
0.44
1.62
0.98
1.82
p-Coumaric acid
5.514
0.9469
1.03
3.13
0.44
1,00
1.07
1.12
Ferulic acid
5.972
0.9888
0.46
1.41
0.21
0.54
0.51
0.50
Sinapic acid
6.023
0.9981
3.30
10.00
0.05
0.58
0.54
0.95
Iso-ferulic acid
6.118
0.9958
0.23
0.69
0.29
0.55
0.37
0.55
3.3 Phenolic compositions of fermented black glutinous rice
The content of individual phenolic compounds in three different fractions of fermented BGR is presented in Table 2. The different durations of fermentation showed different compositions, forms, and levels of phenolic compounds in fermented BGR. Ten studied phenolic compounds were detected in fermented BGR samples, which dominated with ferulic acid, protocatechuic acid, and vanillic acid that were found in free, free-conjugated, and bound forms during fermentation for up to 72 h. First, it must be noted that only three simple phenolic compounds were detected in the free fraction, whilst eight simple phenolic compounds were detected in the free-conjugated and bound fraction. These results support the interesting effect of the fermentation process. * Values are above the LOD and below the LOQ. nd: not detected (<LOD), DM: Dry matter, THB: 2,4,6-trihydroxybenzoic acid, PRO: protocatechuic acid, PRA: protocatechuic aldehyde, CAF: caffeic acid, VAA: vanillic acid, VAN: vanillin, COU: p-coumaric acid, FER: ferulic acid, SIN: sinapic acid, IFA: isoferulic acid. Initial DM values are expressed per Kg of dry matter present in sample at the start of the fermentation.
Phenolic Fraction
time
Phenolic concentration (mg Kg−1 initial DM)
THB
PRO
PRA
CAF
VAA
VAN
COU
FER
SIN
IFA
Free
0
nd
33.88 ± 0.11
nd
nd
12.94 ± 0.04
nd
nd
1.59 ± 0.01*
nd
nd
24
nd
22.54 ± 0.07
nd
nd
13.48 ± 0.04
nd
nd
nd
nd
nd
48
nd
15.70 ± 0.05
nd
nd
8.87 ± 0.03
nd
nd
nd
nd
nd
72
nd
20.27 ± 0.07
nd
nd
14.20 ± 0.04
nd
nd
nd
nd
nd
Free-conjugated
0
nd
74.08 ± 0.24
nd
0.56 ± 0.00*
35.49 ± 0.10
nd
nd
8.70 ± 0.05
nd
0.75 ± 0.00*
24
22.63 ± 0.09
54.05 ± 0.18
3.83 ± 0.01
nd
36.55 ± 0.11
nd
nd
7.32 ± 0.04
4.40 ± 0.03*
0.50 ± 0.00*
48
54.13 ± 0.22
56.63 ± 0.19
4.67 ± 0.01
0.59 ± 0.00*
40.57 ± 0.12
nd
nd
8.66 ± 0.05
5.74 ± 0.03*
0.81 ± 0.00
72
45.47 ± 0.18
43.72 ± 0.14
3.93 ± 0.01
0.70 ± 0.01*
39.05 ± 0.11
nd
nd
9.19 ± 0.05
5.78 ± 0.03*
0.53 ± 0.00*
Bound
0
nd
51.86 ± 0.17
0.41 ± 0.00*
0.54 ± 0.00*
27.23 ± 0.08
6.07 ± 0.10*
18.03 ± 0.18
60.34 ± 0.33
nd
1.89 ± 0.01
24
nd
64.76 ± 0.21
0.69 ± 0.00*
0.79 ± 0.01*
32.16 ± 0.09
6.76 ± 0.11
19.82 ± 0.20
69.51 ± 0.38
nd
2.40 ± 0.01
48
nd
57.28 ± 0.19
0.96 ± 0.00
0.84 ± 0.01*
30.06 ± 0.09
6.36 ± 0.10
20.71 ± 0.21
70.63 ± 0.38
nd
2.73 ± 0.02
72
nd
79.57 ± 0.26
1.36 ± 0.00
1.03 ± 0.01*
37.93 ± 0.11
7.56 ± 0.12
22.87 ± 0.23
80.21 ± 0.43
nd
3.03 ± 0.02
The notable increase in the total amount (free-conjugated and bound) of protocatechuic aldehyde (13 × ), caffeic acid (2 × ), vanillic acid (1 × ), vanillin (1 × ), p-coumaric acid (1 × ), ferulic acid (1 × ) and isoferulic acid (1 × ) was measured by comparing the initial BGR with the final product of 72 h fermentation. A similar result was reported due to an increase in the content of the bound form of phenolic compounds (Khan et al., 2020).
Vanillin and p-coumaric acid were only found in the bound phenolic fraction, as previously studied in fermented brown rice (Khan et al., 2020). It was also demonstrated that the brown rice fermentation by lactic acid bacteria and Saccharomyces cerevisiae increased the total phenolic compounds, especially in the fraction of bound compounds. Similarly, in our study, the bound fraction of phenolic compounds in BGR fermented for 72 h showed an increase in the quantity of the eight identified phenolic compounds (Table 2).
In the free fraction, protocatechuic acid (15.7 – 33.9 mg Kg−1), vanillic acid (8.9 – 14.2 mg Kg−1), and ferulic acid (0 – 1.6 mg Kg−1) were identified and quantified. The fermentation process decreased the content of protocatechuic and ferulic acid. Krastanov et al. (2013) stated that fermentation by Aspergillus sp. could degrade phenolic compounds and use them as a single carbon source. Aspergillus sp. produces phenol hydroxylase and catechol 1,2-dioxygenase enzymes that play a role in the degradation of phenolic compounds (Chenprakhon et al., 2020; Sivasubramanian and Namasivayam, 2015). Several other enzymes have also been studied to play a role in the degradation of phenolic compounds, including alpha phenyl phosphate synthase, beta phenyl phosphate synthase, beta phenyl phosphate carboxylase, and 4-hydroxy benzoyl-CoA and 4-hydroxy benzoyl-CoA reductase (Xie and Müller, 2018).
On the contrary, the level of vanillic acid increased (9.74%) after 72 h fermentation. Biotransformation of ferulic acid compounds during fermentation by decarboxylase or reductase enzymes from lactic acid bacteria and yeast can produce dihydroferulic and protocatechuic acid as well as other compounds (Leonard et al., 2021).
Fermentation technology also affected differently on each individual phenolic content in the free-conjugated fraction. Reaching 48 h fermentation, a maximum amount of 2,4,6-trihydroxy benzoic acid, protocatechuic acid, protocatechuic aldehyde, vanillic acid, and iso-ferulic acid compounds was achieved. Meanwhile, the other compounds — caffeic acid, ferulic acid, and sinapic acid — showed a maximum level at 72 h of fermentation. Bei et al. (2017) also reported that the increase of conjugated phenolic compounds caffeic acid (34 × ), vanillic acid (22 × ), ferulic acid (31 × ), and sinapic acid (4 × ) at 14 days of fermentation with Monascus anka. Apart from the disintegration of cell wall structure during the fermentation, a greater extractability of bound phenolic compounds was also endorsed by the variability of microbes and the length of fermentation. Several enzymes from microorganisms, including β-glucosidase, phenolic acid reductase, feruloyl esterase, and phenolic acid decarboxylase, may change the quantity and composition of phenolic compounds during fermentation (Adebo and Medina-Meza, 2020; Leonard et al., 2021).
3.4 Antioxidant activity of fermented black glutinous rice
The antioxidant activity of fermented BGR extract was evaluated by its ability to quench a purple-colored unstable organic nitrogen radical, namely DPPH•. The measurement was based on the decrease of DPPH• after reacting with the tested sample to form a yellowish color. The antioxidant activity was indicated by the IC50 value, which was calculated as the antioxidant concentration required to decrease the initial DPPH concentration by 50%. Thus, the lower the IC50 value, the higher the antioxidant activity (Rivero-Cruz et al., 2020). The initial IC50 values of the free (130.31 µg g−1), free-conjugated (113.39 µg g−1), and bound phenolic (188.74 µg g−1) fractions at 0 h fermentation lowered to 84.39, 45.33, and 132.95 µg g−1 after 72 h (Fig. 3). Hence, fermentation with ragi tape increased the antioxidant activity which was marked by a decrease in IC50 value of free (35.24%), free-conjugated (60.02%), and bound (29.56%) form, along with the increase of phenolic compounds.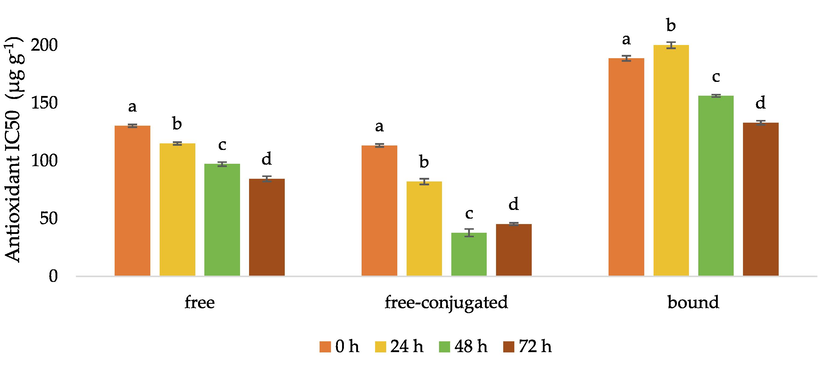
Antioxidant IC50 value (µg/g initial DM) for fermented black glutinous rice. DM: dry matter. For any specific type of phenolic compound, the same letters mean no significant differences, p < 0.05.
The increase in antioxidant activity of cereals through fermentation has also been previously reported (Janarny and Gunathilake, 2020; Khan et al., 2020; Ryu et al., 2019; Xu et al., 2015). The antioxidant activity of phenolic compounds is associated with the capacity to scavenge free radicals. The molecular structure, especially the number and position of hydroxyl groups, and the nature of the substitution on the aromatic ring provide a capacity of the compounds to deactivate free radicals, which is referred to as the structure–activity relationship (Minatel et al., 2017).
3.5 Principal component analysis
To provide an overview of the effects of fermentation time by describing the variations of phenolic compounds composition and the antioxidant activities on the characteristic of fermented BGR, a principal component analysis (PCA) was performed using the individual levels of all studied phenolic compounds and antioxidant activity as the variables. In addition, the three fraction (free, free-conjugated, and bound phenolic compounds) samples were used for PCA considering three regions in a scatterplot score (Fig. 4).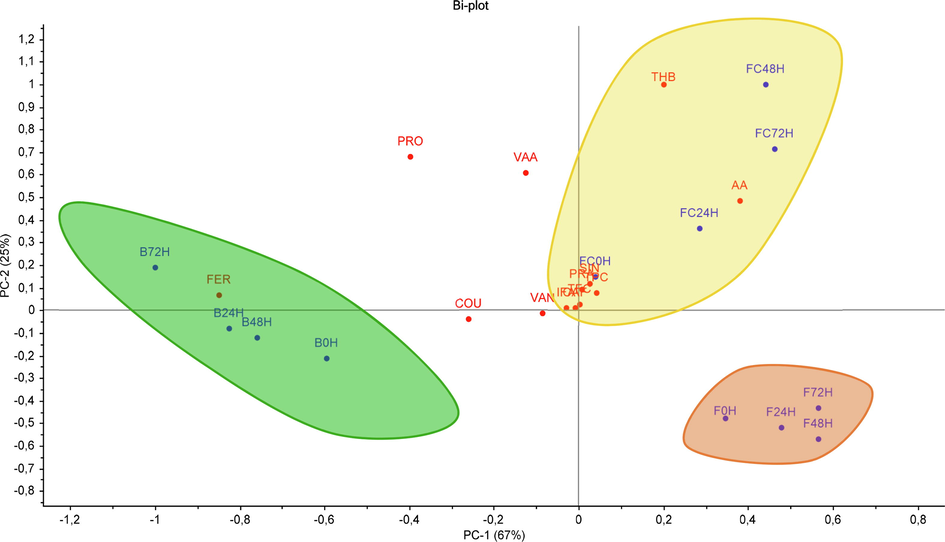
PCA score plot for individual phenolic compounds and antioxidant activity of fermented black glutinous rice.
The first principal component (PC1) accounted for about 67%, with the samples from the free and free-conjugated fraction distributed on the positive axis of PC1, whilst the samples from the bound fraction showed negative values for PC1. On the other hand, PC2 accounted for 25% of the total variance and contributing mainly to the distribution due to the extension of the fermentation process. For the three fractions, the one with the lowest antioxidant activity, i.e., the sample corresponding to the starting time of the fermentation, showed the lowest value for the PC2. These variations were affected by different extract fractions and the incubation time of fermentation. Free phenolics are contained in plant cell vacuoles in free form, whereas conjugated phenolic compounds are covalently bound or esterified with other low molecular weight components such as sugars or fatty acids. Bound phenolics, on the other hand, bind to insoluble polymeric matrices in the cell walls of plant food matrices via covalent chemical bonds, hydrogen bonds, and hydrophobic interactions (particularly with structural proteins) (Shahidi and Yeo, 2016; Zhang et al., 2020). The composition and concentration of phenolic compounds as well as antioxidant activity varied in these extract fractions throughout the fermentation.
The resulting PCA score plot shows the profile of phenolic compounds in three groups representing different types of BGR extracts: free, free-conjugated, and bound phenolic fractions. The latter fraction was characterized by ferulic acid as the major compound. On the other hand, the bound phenolic fraction was characterized by a high amount of 2,4,6-trihydroxybenzoic acid, protocatechuic aldehyde, and sinapic acid.
Antioxidant activity of free-conjugated phenolic fraction was highly correlated with total flavonoid content (r = 0.928) in addition to the individual phenolic compounds, viz., 2,4,6-trihydroxybenzoic acid (r = 0.998), protocatechuic aldehyde (r = 0.890), vanillic acid (r = 0.968), and sinapic acid (r = 0.938). The hydroxybenzoic acid derivatives, including 2,4,6-trihydroxybenzoic acid, are found in some plants and can also be obtained due to the enzymatic hydrolysis of unstable flavonoids. The strong relationship between 2,4,6-trihydroxybenzoic acid and antioxidant activity can be attributed to the fact that this compound has three hydroxyl groups in the benzene ring and consists of two ortho-hydroxy groups. Ortho- and para-dihydroxy phenols have high antioxidant activity due to their ability to donate hydrogen atoms and form easily delocalized semiquinone structures (Abrahams et al., 2022; Frankel, 2012). Meanwhile, the strong correlation between vanillic acid compounds and antioxidant capacity can also be attributed to the hydrogen atom donor from the hydroxyl group.
4 Conclusions
Fermentation with ragi tape is a practical approach to increase the free phenolic and flavonoid compounds in black glutinous rice. The free phenolic content increased during 0 to 72 h fermentation, reaching 6.94 mg GAE g−1 initial dry material (+49%). In contrast, the free-conjugated phenolic content reached the maximum at 48 h of fermentation (+8%). After a 72-h fermentation, the decreased IC50 value of free (35.24%), free-conjugated (60.02%), and bound (29.56%) phenolic fractions indicated a remarkable increase in antioxidant activity. The amount of individual phenolic compounds, namely 2,4,6 trihydroxybenzoic acid, protocatechuic aldehyde, caffeic acid, vanillic acid, vanillin, p-coumaric acid, ferulic acid, isoferulic acid, and sinapic acid increased during fermentation with ragi tape either in the free, free-conjugated, or bound fraction. Then the resulting fermented black glutinous rice is potentially developed as a source of increased phenolic antioxidant food product. These findings hold practical promise for promoting the consumption of health-enhancing ingredients. Fermented black glutinous rice tape emerges as a source of phenolic compounds and antioxidants, with the potential to enhance human health. These compounds can mitigate oxidative stress, combat inflammation, and lower the risk of degenerative diseases like cancer, hypercholesterolemia, and diabetes.
Acknowledgements
M.N.A. wishes to thank the Indonesian Endowment Fund for Education (LPDP Indonesia) from the Ministry of Finance of the Republic of Indonesia for granting the scholarship and supporting this research, with scholarship ID 202002213016065, also to the Universitas Gadjah Mada and the University of Cadiz for the research facility support.
Declaration of Competing Interest
The authors declare that they have no known competing financial interests or personal relationships that could have appeared to influence the work reported in this paper.
References
- Complexes of 2,4,6-trihydroxybenzoic acid : effects of intramolecular hydrogen bonding on ligand geometry and metal binding modes research papers. Acta Crystallogr. C. 2022;78:653-670.
- [CrossRef] [Google Scholar]
- Impact of fermentation on the phenolic compounds and antioxidant activity of whole cereal grains: A mini review. Molecules. 2020;25:1-19.
- [CrossRef] [Google Scholar]
- AOAC, 2016. Appendix F: Guidelines for Standard Method Performance Requirements Contents, Association of Official Analytical Chemists. Gaithersburg.
- Traditional fermented foods in Indonesia. Japanese J. Lact. Acid Bact.. 2000;10:90-102.
- [CrossRef] [Google Scholar]
- Quercetin increases stress resistance in the yeast Saccharomyces cerevisiae not only as an antioxidant. Ann. Microbiol.. 2016;66:569-576.
- [CrossRef] [Google Scholar]
- Improving free, conjugated, and bound phenolic fractions in fermented oats (Avena sativa L.) with Monascus anka and their antioxidant activity. J. Funct. Foods. 2017;32:185-194.
- [CrossRef] [Google Scholar]
- Characterizing the pigmented traditional rice cultivars grown in temperate regions of Kashmir (India) for free and bound phenolics compounds and in vitro antioxidant properties. J. Cereal Sci.. 2017;76:253-262.
- [CrossRef] [Google Scholar]
- Bioprocessing of soybeans (Glycine maxL.) by solid-state fermentation withEurotium cristatumYL-1 improves total phenolic content, isoflavone aglycones, and antioxidant activity. RSC Adv.. 2020;10:16928-16941.
- [CrossRef] [Google Scholar]
- Chenprakhon, P., Pimviriyakul, P., Tongsook, C., Chaiyen, P., 2020. Phenolic hydroxylases, in: The Enzymes. Elsevier Inc., pp. 283–326. https://doi.org/10.1016/bs.enz.2020.05.008.
- Saccharomyces cerevisiae—an interesting producer of bioactive plant polyphenolic metabolites. Int. J. Mol. Sci.. 2020;21:1-18.
- [CrossRef] [Google Scholar]
- Fermented foods : Definitions and characteristics, gastrointestinal health and disease. Nutrients. 2019;11:1-26.
- [CrossRef] [Google Scholar]
- Frankel, E., 2012. Antioxidants, in: Lipid Oxidation (Second Edition). Woodhead Publishing Limited, pp. 209–258. https://doi.org/10.1533/9780857097927.209.
- Identification and functional characterization of fungal chalcone synthase and chalcone isomerase. J. Nat. Prod. 2022
- [CrossRef] [Google Scholar]
- Characterization of free, conjugated, and bound phenolic acids in seven commonly consumed vegetables. Molecules. 2017;22:1-14.
- [CrossRef] [Google Scholar]
- Phytochemical profiles of rice and their cellular antioxidant activity against ABAP induced oxidative stress in human hepatocellular carcinoma HepG2 cells. Food Chem.. 2020;318:1-12.
- [CrossRef] [Google Scholar]
- Makanan tradisional Indonesia. Yogyakarta: UGM Press; 2017.
- Improved bioavailability of dietary phenolic acids in whole grain. J. Agric. Food Chem.. 2012;60:6369-6375.
- [Google Scholar]
- Bioactive compounds and antioxidative activity of colored rice bran. J. Food Drug Anal.. 2016;24:564-574.
- [CrossRef] [Google Scholar]
- Improved release and metabolism of flavonoids by steered fermentation processes: A review. Int. J. Mol. Sci.. 2014;15:19369-19388.
- [CrossRef] [Google Scholar]
- Changes in rice bran bioactives, their bioactivity, bioaccessibility and bioavailability with solid-state fermentation by Rhizopus oryzae. Biocatal. Agric. Biotechnol.. 2020;23:1-9.
- [CrossRef] [Google Scholar]
- Co-culture submerged fermentation by lactobacillus and yeast more effectively improved the profiles and bioaccessibility of phenolics in extruded brown rice than single-culture fermentation. Food Chem.. 2020;326:1-8.
- [CrossRef] [Google Scholar]
- Microbial degradation of phenol and phenolic derivatives. Eng. Life Sci.. 2013;13:76-87.
- [Google Scholar]
- Fermentation transforms the phenolic profiles and bioactivities of plant-based foods. Biotechnol. Adv.. 2021;49:1-16.
- [CrossRef] [Google Scholar]
- Anti-inflammatory effects of black rice, cyanidin-3-O-β-d-glycoside, and its metabolites, cyanidin and protocatechuic acid. Int. Immunopharmacol.. 2010;10:959-966.
- [CrossRef] [Google Scholar]
- Phenolic compounds: Functional properties, impact of processing and bioavailability, in: Phenolic compounds - biological activity. Intechopen 2017:1-24.
- [Google Scholar]
- Ramawat, K.G., Mérillon, J.M., 2013. Natural Products, Springer-Verlag Berlin Heidelberg. New York. https://doi.org/10.1007/978-3-642-22144-6.
- Phytochemical constituents, antioxidant, cytotoxic, and antimicrobial activities of the ethanolic extract of mexican brown propolis. Antioxidants. 2020;9:1-11.
- [CrossRef] [Google Scholar]
- Steam processed broccoli (Brassica oleracea) has higher antioxidant activity in chemical and cellular assay systems. Food Chem.. 2009;114:263-269.
- [CrossRef] [Google Scholar]
- Changes over the fermentation period in phenolic compounds and antioxidant and anticancer activities of blueberries fermented by Lactobacillus plantarum. J. Food Sci.. 2019;84:2347-2356.
- [CrossRef] [Google Scholar]
- Fermentation of cereals: A tool to enhance bioactive compounds Kawaljit. Plant Biotechnol.: Recent Adv. Develop. 2017:1-390.
- [CrossRef] [Google Scholar]
- Santos-Zea, L., Villela-Castrejón, J., Gutiérrez-Uribe, J.A., 2018. Bound Phenolics in Foods, in: Bioactive Molecules in Food. Springer, Cham, pp. 1–18. https://doi.org/10.1007/978-3-319-78030-6_13.
- Genomic evidences for the existence of a phenylpropanoid metabolic pathway in Aspergillus oryzae. Biochem. Biophys. Res. Commun.. 2005;337:747-751.
- [CrossRef] [Google Scholar]
- Pressurized liquid extraction of phenolic compounds from rice (Oryza sativa) grains. Food Chem.. 2016;192:452-459.
- [CrossRef] [Google Scholar]
- Advancing secondary metabolite biosynthesis in yeast with synthetic biology tools. FEMS Yeast Res.. 2011;12:144-170.
- [CrossRef] [Google Scholar]
- Phenol degradation studies using microbial consortium isolated from environmental sources. J. Environ. Chem. Eng.. 2015;3:243-252.
- [CrossRef] [Google Scholar]
- Physicochemical and antioxidative properties of red and black rice varieties from Thailand, China and Sri Lanka. Food Chem.. 2011;124:132-140.
- [CrossRef] [Google Scholar]
- Impact of fermentation degree on phenolic compositions and bioactivities during the fermentation of guava leaves with Monascus anka and Bacillus sp. J. Funct. Foods. 2018;41:183-190.
- [CrossRef] [Google Scholar]
- An antioxidant screening assay based on oxidant-induced growth arrest in Saccharomyces cerevisiae. FEMS Yeast Res.. 2011;11:379-387.
- [CrossRef] [Google Scholar]
- Enzymes involved in the anaerobic degradation of phenol by the sulfate-reducing bacterium Desulfatiglans anilini. BMC Microbiol.. 2018;18:1-10.
- [CrossRef] [Google Scholar]
- Improved bioaccessibility of phenolics and antioxidant activity of glutinous rice and its fermented Chinese rice wine by simultaneous extrusion and enzymatic hydrolysis. J. Funct. Foods. 2015;17:214-226.
- [CrossRef] [Google Scholar]
- The profile and bioaccessibility of phenolic compounds in cereals influenced by improved extrusion cooking treatment. PLoS One. 2016;11:1-11.
- [CrossRef] [Google Scholar]
- A review on insoluble-bound phenolics in plant-based food matrix and their contribution to human health with future perspectives. Trends Food Sci. Technol.. 2020;105:347-362.
- [CrossRef] [Google Scholar]


