

Translate this page into:
Kinetics of phosphorus desorption from soils using a modified DMT-HFAO technique and its relationship with phosphorus fractions and maize (Zea mays L.) yield
⁎Corresponding author. abi92003@yahoo.com (Abi M. Taddesse)
-
Received: ,
Accepted: ,
This article was originally published by Elsevier and was migrated to Scientific Scholar after the change of Publisher.
Abstract
This research investigated the kinetics of phosphorus (P) release from soils by employing an improved technique-hydrous ferric aluminium binary oxide in dialysis membrane tubes (DMT-HFAO). The as-synthesized adsorbents were characterized by x-ray diffraction (XRD), scanning electron microscope (SEM), Fourier transform infrared (FTIR), thermogravimetic (TGA/DTA) and Brunauer-Emmett-Teller (BET) techniques. The modified method, DMT-HFAO, was used in six soils equilibrated for a period from 1 to 42 days. Two component first order model was applied to estimate the cumulative P desorbed and P desorption indices and how these parameters are related to maize yield. The cumulative P-extracted by DMT-HFAO over 42 days significantly correlated (p < 0.01) with maize plant uptake; better than the reference single system (DMT-HFO). This indicated that DMT-HFAO is superior in mimicking plant mode of action as compared to the benchmark, DMT-HFO. Among the P fractions, HCO3-Pi, HCO3-Po and D/HCl significantly correlated with the yield parameters in both techniques. Our findings, therefore, provide some insights on the importance of this modified technique in estimating the residual P in soil. Accurate estimation of residual P is important not only from environmental perspective but also from the judicious use of this non-renewable fertilizer.
Keywords
Phosphate
Desorption
Binary oxides
Nanosorbent
Dialysis membrane tubes

- DMT
-
Dialysis membrane tubes
- HFAO
-
Hydrous ferric aluminium oxide
- HFO
-
Hydrous ferric oxide
- TGA
-
Thermal gravimetric analysis
- DTG
-
Derivative thermogravimetry
- D/HCl
-
Dilute Hydrochloric acid
- C/HCl
-
Concentrated hydrochloric acid
- C/H2SO4
-
Concentrated sulphuric acid
- KA
-
rate constant of pool A
- KB
-
rate constant of pool B
- KT
-
rate constant of P transport
- KR
-
rate constant of P release
- P
-
Phosphate
- PR
-
Phosphate release
- SPA
-
phosphate from pool A (labile pool)
- SPB
-
phosphate from pool B (less labile pool)
- Pi
-
inorganic P
- PO
-
Organic P
Abbreviations
1 Introduction
Phosphorus (P) is an important plant macronutrient, making up about 0.05–0.5% of a plant’s dry weight (Araujo et al., 2003; Johan et al., 2021). Although the total amount of P in the soil may be high, it is often present in unavailable forms or in forms that are only available in the long term. Therefore, few unfertilized soils release P fast enough to support the high growth rates of plants (Holford, 1997). On the other hand, soils receiving continual applications of fertilizer P over a long-term can possess large amounts of residual P. This represents not only an uneconomical practice, but also the high risk of P loss to water bodies with subsequent fresh water eutrophication (McDowell and Sharpley, 2002; Akinnawo, 2023).
Soil testing to determine P availability to crops is a well-established process. However, such soil tests do not measure the actual available P quantitatively but provide only a relative index of available P (Hedley et al., 1982; Tiessen and Moir, 1993). Plant available P is all P that is taken up by a plant during a specific period (Tiessen and Moir, 1993). Since the actual plant available P constitutes solution P and the P that enters the solution (as the result of desorption/dissolution from a solid phase), the routine soil test methods have been unsatisfactory in predicting the plant P uptake. A possible explanation is that P from the less labile pools not measured by the common soil tests also contribute to plant uptake (Tiessen and Moir, 1993) as these fractions are in equilibrium with the P fractions extracted by the soil P tests. This means, the non-labile P existing in equilibrium with labile P contributes to P in the soil solution (Freese et al., 1995; De Jager and Claassens, 2005; Santner et al. 2015; Liao et al, 2021). Thus, kinetic information is required to properly characterize the P supplying capacity of soils. Much progress has been made in the past to develop long term soil P extraction methods (Amer et al., 1955; Freese et al., 1995; Lookman et al., 1995; Santner et al., 2015; Reyhanitabar et al., 2018). However, few attempts have been made to relate the kinetic data generated to plant P uptake both in glass house and at field levels (Taddesse et al., 2008a).
A number of fractionation schemes (Hedley et al., 1982; Tiessen and Moir, 1993; Tiessen and Moir, 2007) based on chemical extractants have been proposed to measure the different soil’P forms’ or ‘P fractions’. These operationally defined forms exhibit disparate solubility resulting to incongruent rates of P desorption to the soil solution i.e., P desorption kinetics are likely to be related to the different P forms. In this work, we tried to identify which P pools relate to P desorption indices for the modified technique we employed.
The DMT-HFO technique has been employed to study long-term phosphorus desorption in acid soils. De Jager and Claassen, (2005), Ochwoh et al., (2005) and Yibrehu et al., (2022) used this technique on incubated soils to simulate soils fertilized for long-term. Taddesse et al., (2008b), used long-term fertilized soils to assess the potential of this technique to mimic plant mode of action both in green house and field levels. Recently, this method was used to study the phosphate desorption kinetics of ten calcareous soils (Reyhanitabar et al., 2018).
Numerous factors influence the P uptake by DMT-HFO such as soil type, pH, ionic strength, temperature and the nature of the sorbent that acts as P sink (Taddesse, 2008). The present work attempted to improve the nature of the sorbent that serves as P sink by employing Fe-Al binary composite that comprises more than one component. Mixed metal oxides demonstrate surface properties that imitate the actual plant uptake more closely than their individual counterparts (Harvey and Rhue, 2008). For example, doping alumina (Al2O3) in iron oxide systems such as Fe2O3 or FeO(OH) to form binary Fe-Al composites evidenced better phosphorus adsorption than the pristine iron oxide forms. The increased phosphate sorption could be attributed to induced defects because of Al3+ doping (owing to the smaller ionic radius and weaker electronegativity of Al3+ than Fe3+), restrained crystal growth that yield enhanced specific surface area, increased surface charge (Anion Exchange Capacity, AEC) and increase in the content of hydroxyl groups on the crystals surfaces (Li et al., 2016; Li, W., et al., 2015a; Li et al., 2015b; Gulshan et al; 2009; El-Sharkawy et al.. 2000). In view of this fact, we hypothesized that the performance of single component Fe-hydr(oxide) sorbent filled in dialysis membrane tubes hereafter termed as DMT-HFO can be improved by using the mixed Fe-Al hydr(oxide) sorbent filled in the same dialysis bags hereafter referred as DMT-HFAO. The objective of this study was, therefore, to evaluate the potential application of the modified technique (DMT-HFAO) to predicting P availability from soils and compare the performance of this technique against the bench mark (DMT-HFO).
Previously, synthesis and phosphate sorption behaviour of nanocrystaline Fe-Al binary oxide sorbent was reported by our group (Tofik et al., 2016). Following that work, we developed a modified technique to assess phosphate desorption kinetics from aqueous and soil solutions by placing the Fe-Al nanocomposite in a dialysis membrane bags (DMT-HFAO) (Ahmed et al., 2023). Desorption kinetics of the DMT-HFAO technique fitted fairly well with first order kinetics, intra-particle diffusion and two component first order models. In the present work, we employed this binary oxide system (DMT-HFAO) to assess its applicability to phosphate desorption from soil and relate the relevant desorption indices to P forms and plant yield parameters (green house trial). We selected the two-component first order model (See supplementary information for theoretical basis) in relating the kinetic parameters to plant yield due to its relatively better fit to the experimental data, and to make the comparison with DMT-HFO easier since previous reports are made using this model (Freese et al., 1995; Lookman et al., 1995; Taddesse et al., 2008; Ahmed et al., 2023).
2 Materials and methods
2.1 Description of the soil sampling areas
The soil samples were collected from six sites: Bako, Guto-gida, Bishoftu, and Mechara areas of Oromia National Regional State and Gununo and Hegere-selam areas in Southern Nations, Nationalities and Peoples' Region (SNNPR), Ethiopia (Fig. 1).The details for each site, on procedures related to determination of selected soil physical and chemical properties, synthesis of sorbents and characterization techniques for the as-obtained sorbents, is presented in the supplementary information.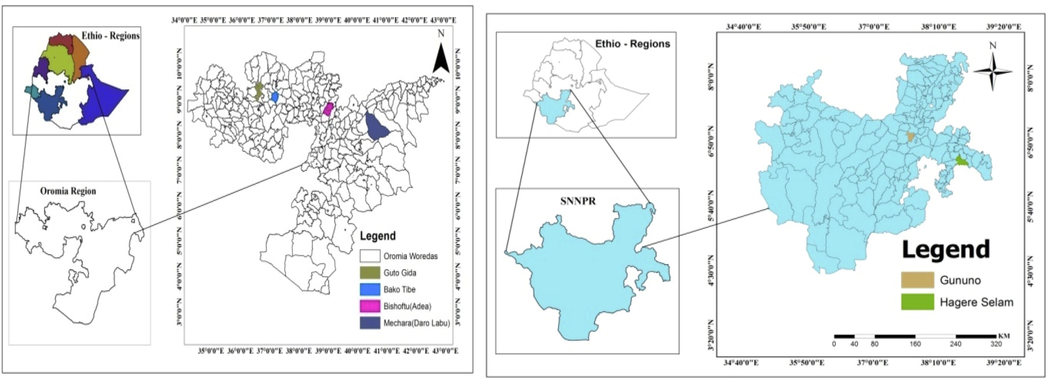
Geographical location of soil sampling sites.
2.2 Incubation study and pot trial
Top soil samples (0–20 cm) were collected by a random sampling technique using FAO guidelines for soil sampling procedure (FAO, 2008) from six sites: Bako, Bishoftu, Gununo, Guto-gida, Hagere-selam and Mechara. The samples were then air dried and ground to pass through a 2-mm sieve. A composite sample from each site was used for the experiment. A three kilogram composite soil sample from each site was taken and placed in plastic pot with three replicates. The soils were wetted at field capacity. Phosphorus was added into each soil sample at equivalent rates of 0, 50, 100 and 200 kg P2O5/ha in three replicates. Each P-treated soil sample was filled into a plastic pot and incubated for 90 days at 20 ± 4 °C in a glass house at Raree Research Station, Haramaya University, Ethiopia. After 90 days of incubation, the soil samples were taken from each pot for laboratory analysis. Then, five maize seeds of the improved Bako hybrid, BH 661 variety (Damte and Mekbib, 2022) were planted onto each soil in the pots on 20 June 2013 after adding 50 mg N/kg soil as urea before planting. Another 50 mg N/kg soil was added into the pots after the maize seedlings grew. The soils were also supplied with 150 mg K2O/kg soil as murate of potash (potassium chloride), to reduce possible growth limitation due to deficiency of the nutrient (potassium). A week after emergence, the five seedlings, in each pot, was thinned to three. The plants were grown for 56 days and shoot dry matter was determined after washing and drying the fresh shoot sample at 68 °C for 48 h in an oven. The dried shoot samples were ground to pass through a stainless steel mill. The content of phosphorus was determined from 0.3 g ground shoot with addition of 4 mL concentrated H2SO4 and heating it at 360 °C on digestion block with subsequent stepwise addition of H2O2 until the solution was clear after which P was determined spectrophotometrically according to Murphy and Riley (1962). Data for both shoot dry matter yield and tissue P of maize plant are shown in Table 1. Where, SDM = Shoot dry matter; the values are means of three replications. For each site, the means in the column with the same or common letters are not significantly different.
Site
P-rate
(Kg P2O5 ha)
SDM
P uptake
g plant−1
mg plant−1
Bako
BaT0
*6.8x
12.4a
BaT50
7.2y
14.5b
BaT100
7.5z
16.6c
BaT200
6.9x
13.5d
Bishoftu
BiT0
8.1x
25.3a
BiT50
8.9xy
27.7ac
BiT100
10.8y
30.9c
BiT200
14.6z
39.3d
Gununo
GN0
4.8x
5.6a
GN50
6.2y
16.1b
GN100
5.3xy
9.4c
GN200
5.6xy
11.7d
Guto gida
GGT0
3.5a
4.8x
GGT50
5.3b
6.2y
GGT100
2.3c
2.9z
GGT200
3.5a
4.1x
Heger selam
HS0
4.8q
9.4a
HS50
6.9x
14.1b
HS100
8.6y
16.6c
HS200
10.8z
21.1d
Mechara
MeT0
5.6a
16.2x
MeT50
9.9b
21.2y
MeT100
8.3c
18.6z
MeT200
7.3ac
18z
2.3 Preparation of the sorbent suspensions
Suspensions of as-synthesized powder samples (calcined at 300 °C) were prepared separately by adding 5 g powder to 1L volumetric flask and filling deionizer water to the mark. Equivalent amount of hydrous ferric oxide (HFO) (reference) was also prepared following the procedure described by Freese et al. (1995). The pH of the suspension was adjusted to the pH of soils of the six sites. Twenty-centimeter-length DMT strips (Medicell International Ltd., London; dialysis tubing: Visiting, size 320/32 in., approximate pore size 2.5–5.0 nm; membrane thickness 3 μm) were boiled two times in deionized water for 5 min and thoroughly rinsed. Twenty milliliter of suspensión for each site was filled in dialysis tube each in three replicates. During the filling of the DMTs, suspensions were stirred vigorously to obtain uniform quantities of HFAO, and HFO for each DMT strips.
2.4 Successive extraction followed by fractionation
We extracted P from the incubated soil samples using a dialysis membrane tube filled with nanocrystalline Fe-Al mixed oxide nanosorbent (HFAO-DMT) or the reference hydrous ferric oxide (HFO) followed by subsequent P-fractions in the order: (i) 0.5 M NaHCO3 at pH = 8.5 which extracts weakly adsorbed Pi (Hedley et al., 1982; Tiessen and Moir, 2007) and easily hydrolyzable organic Po (labile Pi and Po). (ii) 0.1 M NaOH which extracts Al and Fe oxihydroxide and clay minerals bound P and Po associated with organic compounds (slow labile Pi and Po). (iii) 1 M HCl extracts Ca bound Pi (represents slow labile). (iv) Hot concentrated HCl extracts Pi and Po from more stable pool (occluded Pi and Po). (v) Concentrated H2SO4 + H2O2 extracts recalcitrant Pi and Po. Two drops of chloroform was added to inhibit microbial activity. In each extraction procedure, the soil suspension was gently shaken for 16 h. The extracted P was determined spectrophotometrically as described by Murphy and Riely (1962). The data from the experiment was assessed for its relation with maize yield at glass house trial.
2.5 Data analysis
The data obtained were statistically analysed using Statistical Analysis System (SAS Institute 2009). Analysis of variance was done using the General Linear Model (GLM) procedure. The Tukey test was used to determine significant differences at α = 0.05. Correlations of the rate parameters and the cumulative amount of P released with plant yield were done using Pearson linear correlation, PROC CORR (SAS Institute, version 9.1.3, 2009).
3 Results and discussion
3.1 Soil physicochemical properties
Table S1 depicts the physical and chemical properties of the studied soils. The soils pH (H2O) (4.3–7.3) indicate the variation from very strongly acid to neutral soil (Tadese, 1991; Agure, 2022). The pH (KCl) was less than pH(H2O) and found to vary from 3.5 to 6.8 showing the presence of high potential acidity and high degree of weathering. Exchangeable Al increased while ammonium acetate extractable Ca and Mg decreased with decreasing pH. Bako soil is sandy clay (36%) while Bishoftu (15% clay) and Hegere selam (17% clay) soils are sandy loam in texture. Gununo and Guto-gida soils are sandy clay loams (28 and 30% clay respectively). Among them, Mechara soil has the highest clay content (46%). Organic carbon is low to medium and total N high to very high in all the soil considered (Tadese, 1991). Bray I P is low for the soils subjected to this study except Bishoftu soil which has medium level of P. Bray I P in general decreased with decreasing pH, the highest being recorded for Bishoftu and the lowest for Gununo soils. The soils used for this study were, therefore, found to have from low to high P fixing capacity as can be judged from their textural class and related properties. The rest of the differences and similarities in physical and chemical properties among the soils could be mainly ascribed to textural class and pH differences.
3.2 Characterization
X-ray diffraction (XRD) patterns of the calcined powder simple (CPS) and uncalcined Fe-Al amorphous powder simple (APS) of binary oxide systems are shown in Fig. 2. The calcined binary system (CPS) exhibited better crystallinity relative to its uncalcined (APS) counterpart, which is amorphous. Diffraction peaks shown by CPS correspond to the primitive cubic system of maghemite (γ-Fe2O3) (JCPDS, Joint Committee on Powder Diffraction Standards, no. 39–1346). The less intense diffraction peak observed at 35.47 for the amorphous APS could be attributed to maghemite phase. Our results concur with results from previous reports (AliAhmed and Moghaddam, 2013; Nazari et al., 2014; Tofik et al., 2016).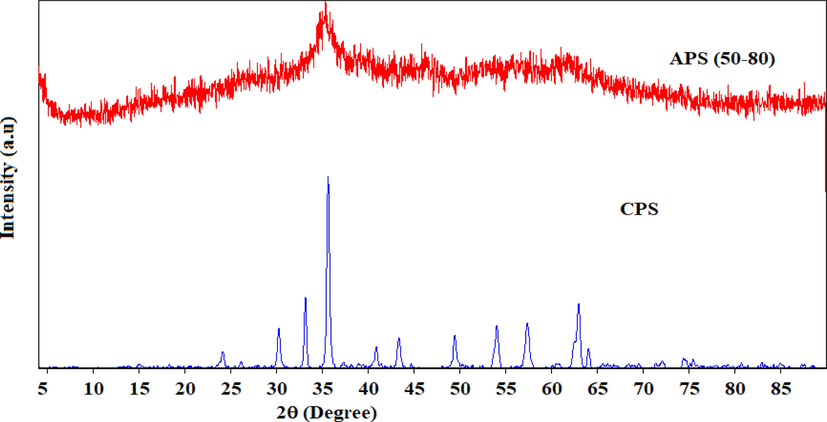
XRD patterns of uncalcined (APS) and calcined (CPS) Fe-Al binary oxide powder samples.
Diffraction peak attributable to alumina was not observed in CPS perhaps due to the amorphous nature of alumina under the calcinations temperature employed in this experiment (300 °C) (Buzuayehu et al., 2017; Nejat et al., 2018; Tofik et al., 2016). The average crystallite size of the crystalline Fe-Al binary oxide (CPS) is found to be 21.40 nm, quite similar with the finding of Tofik et al. (2016), the size of which was 20.94 nm for the sample of the same composition sintered at 300 °C.
BET (Brunauer Emmett Teller) method was employed to determine the specific surface area of the as-prepared samples (Table S2). The specific surface áreas (m2/g) of HFAO (CPS), HAFAO (APS) and HFO were found to be 48.7, 11.4, and 17.1 respectively. The smallest specific surface área registered by the amorphous binary system could be due to residual solvents (ethylene glicol) present in the uncalcined product as evidenced from the FTIR (Fig. 3) and TGA/DTA (Fig. 4b) results.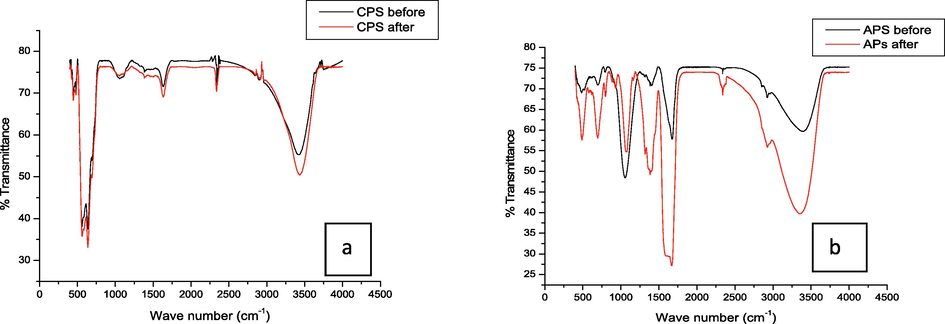
FTIR spectra of CPS (a) and APS (b) before and after phosphate sorption.
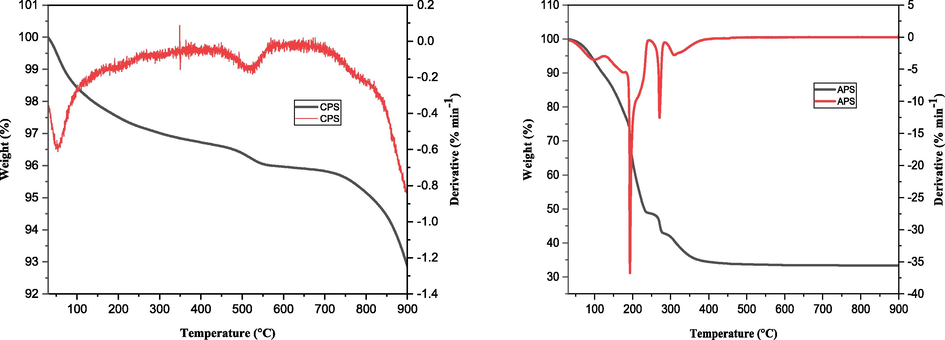
TGA/DTG plot of CPS and APS samples (TGA, thermal gravimetric analys; DTG, derivative thermogravimery).
Fig. 3(a) shows Fourier Transform Infrared (FTIR) spectra of CPS before and after sorption of phosphate. No discernible peak difference was shown in both cases. The broad bands at 3422 and 3430 cm−1 match to the stretching mode of O—H groups of adsorbed water molecule. The peak observed around 1636 cm−1 can be associated with bending mode of physically adsorbed water molecule. The peak shown at 2338 cm−1 can be assigned to carbonate due to CO2 adsorbed from air during preparation (Tofik et al., 2016). The peak at 1059 cm−1 observed on CPS is a characteristic of M—OH bending vibrations (Gagan et al., 2007). The peaks observed in the range from 550 to 640 cm−1 could be ascribed to M—O stretching frequencies.
On the other hand, Fig. 3(b) exhibited the FTIR spectra of APS before and after sorption. The major peaks seemed to be similar in both cases. The peaks around 3360–3382 cm−1 correspond the ʋOH stretching vibration while peaks portrayed in the range from 1655 to 1670 cm−1 could be ascribed to δH-OH bending vibration of adsorbed water molecules. The peaks around 2925, 2338, 1385 and 1052 cm−1 represent the C—H, C—O symmetric stretching vibrations, w(OC2H4) of the ethylene glycol used in the synthesis and ʋ3 asymmetric vibrations of adsorbed carbonate anions respectively. The peak shown at 1052 cm−1 indicates M—OH bending vibrations whereas peaks shown at 700 and 484 cm−1 could be ascribed to M—O stretching vibrations (Lu et al., 2015). 49We noticed the presence of peaks with enhanced intensity (2335 and 1385 cm−1) and (1320 and 933 cm−1) and peak shift (1068 and 797 cm−1) in the FTIR spectrum carried out after the virgin sorbent APS was exposed to phosphate sorption. The enhanced peaks exhibited could be due to asymmetric vibration of P-O26or P-OM modes of vibration50 and overlap of P—O with those of the COO− and —OH groups.51The shift in band position to either relatively lower or higher positions is commonly observed due to phosphate sorption.25,52,53Our findings indicate the sorption of P onto the as-synthesized phosphate binding materials.
The termal stability of amorphus phase of the adsorbent (APS) exhibited three distinct weight losses as shown in Fig. 4. The initial weight loss (≈23%) occurred between 100 and 150 °C as the result of external wáter adsorbed on the surface of the sorbent whereas pronounced loss (≈30%) was observed in the temperature range between 150 and 250 °C due to removal of trapped solvent such as ethylene glycol from the internal pore of the adsorbent. The third weight loss (≈ 5%) registered for a temperature range from 250 to 350 °C could be attributed to phase change from maghemite to heamatite form of the iron oxide. Above 350 °C, no change in weight was recorded evidencing the conversión of the adsorbent to its most stable oxide form.
Contrary to the above observation shown for the amorphus form, ≈2% weight loss was registered upto 200 °C accounting for the removal of physisorbed wáter and the remaining 2% loss exhbited between 200 and 550 °C corresponds to phase changes among the different iron oxide forms. The significantly larger loss from the amorphus sample justifies its smaller specific surface área compared with the crystalline counterpart (Table S2).
The scanning electron microspe (SEM) micrographs of amorphous (APS) and crystalline (CPS) as-synthesized binary Fe-Al mixed oxides are displayed in Figure S1. In both cases, no distinct morphology was observed. Energy dispesive x-ray, EDX (Data not shown) analyses confirmed the presence of both metals considered in the relatively wider range: 98–100 % (Fe), 0–2% (Al) revealing the heterogeneous nature of the sorbent. Despite the fact that APS exhibited those properties discussed in this section, it was not employed for desorption of P from soils due to leakage of APS suspensión through DMT.
3.3 Phosphate desorption from soil
The two components first order kinetic model for DMT-HFAO and DMT-HFO and cumulative P data fit into the curve are shown in Fig. 5a and b. The curve was obtained with the assumption that most of the phosphate released up to day 14 came predominantly from the pools with fast release kinetics, pool SPA as evidenced from Fig. 5c. The amount of P desorbed during this time was taken as SPAo and the amount released between 14 and 42 days was taken as SPBo..The model predicts the total P released at a given time. The trends in the curve of the model and data points were almost similar except that there was a positive deviation at the start of the extraction (Fig. 5a). This could be attributed to possibly faster removal of solution P as it was rapidly extracted with DMT-HFAO.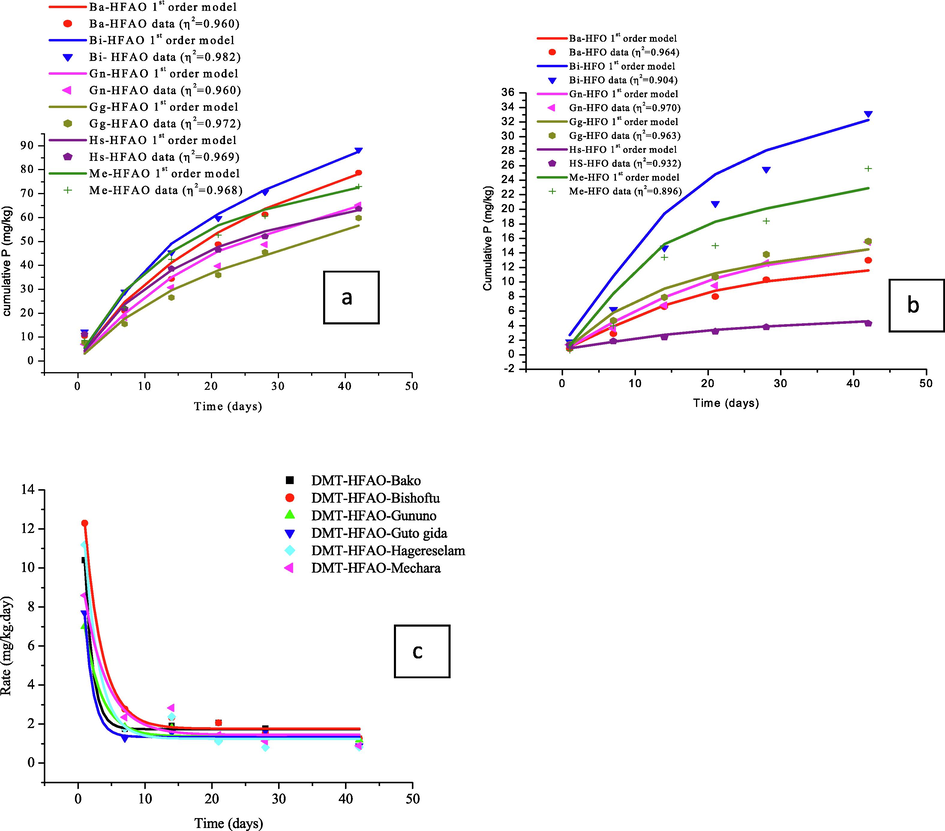
First order two components model and data fit of cumulative P extracted with DMT- HFAO (a) and DMT-HFO (b) and DMT-HFAO phosphate desorption rate from six sites soils (c).
The comparison of the actual data with the model was made using goodness-of-fit (Schulthessand Dey, 1996) which is defined as: η2 = 1- where yi is the y axis value of the ith datum point and ypred is the predicted y axis value based on the × axis value of the ith datum point xi. By convention the best goodness of fit is based on minimizing the vertical predicted error of the predicted values. Accordingly, η2 assumes that a “vertical squared minimum is better.” In general better value of η2 (0.960–0.982) was obtained for DMT-HFAO than DMT-HFO (0.896–0.970) revealing the higher level of adequacy of the former in describing the observed data compared with the reference method. The DMT-HFO curve model (Fig. 5b) showed relatively less level of adequacy in particular for Bishoftu and Hagereselam soils. This indicates inadequacy of the two components first order model to explain these soils. This could be due to high P status of these soils and limited sorption capacity of DMT-HFO.
The curve in Fig. 5a (evidenced on Fig. 5c) shows an inflection point at 14 days where the fast P desorption breaks and the slow step desorption starts to dominate. This indicated the prevailing contribution of the labile pool (SPA) in the early extraction period and the less labile pool (SPB) in the later extraction periods. The inflection is more pronounced for Bishoftu, Mechara and Hagere-selam soils (Fig. 5a). This may be attributed to high P status, low content of exchangeable Al, and the presence of more ammonium oxlate in dark (AOD) extractable amorphous aluminium and iron phosphate, which has a higher solubility than dithionite citrate bicarbonate (DCB) extractable crystalline aluminium and iron phosphate. This would evidently make more contribution of pool SPA to the total P release and the curve tends to attain a plateau. This indicated that as DMT-HFAO sorbed the available P rapidly, the slow labile pool was replenishing more P in the first course of desorption and slowed in the second course of desorption as compared to the remaining three sites soils.
The fact that P was released slowly overtime from Bako, Gununo and Guto-gida might have retarded the growth of maize plant for these soils during 56 days of growing period. However, as one could discern from the curve, the tendency of Bako, Gununo and Guto-gida soils to reach P desorption plateau is less and the model predicts the growth of maize plant would be improved if the growth time extended beyond 56 days. The extraction of P by DMT-HFAO was very similar to P uptake by maize plant. As shown in Fig. 5a, the cumulative P extracted with DMT-HFAO for the duration of 42 days varied from 59.9 to 88.3 mg/kg P. The highest cumulative P was extracted from Bishoftu soil (88.3 mg/kg) and the lowest from Guto-gida soil (59.9 mg/kg). This pattern of P extraction of the soils concured with maize plant P uptake pattern which was also highest for Bishoftu and lowest for Guto-gida (Table 1). From the curves, it can also be proposed that no desorption maxima was attained in the 42-day equilibration period.
3.4 Plant growth
Table 1 shows maize plant shoot dry matter and P uptake data. The highest shoot dry matter yield (14.6 g plant−1) and P uptake (39.3 mg P plant−1) was obtained for Bishoftu soil and the lowest dry matter (2.3 g plant−1) and P uptake (6.2 mg P plant−1) for Guto-gida soil. On average, the highest P uptake (30.8 mg plant−1) was found for maize plants grown on Bishoftu soil followed by those grown on Mechara (18.5 mg plant−1) and Hagere selam soils (15.3 mg plant−1). In these soils, both labile and less labile pools were evidently contributing to P desorbed appreciably and P uptake was relatively higher as evidenced from the desorption pattern described in Fig. 5a.
The highest phosphate fertilizer rate application was reflected by the highest P uptake and dry matter yield of maize plants grown on Bishoftu and Hegere selam soils. This could be due to low clay content and relatively higher pH (Table S1) of the soils from these two sites in which P immobilization was likely to be low. The highest P application resulting in lower P uptake and dry matter yield observed in the case of Bako, Gununo, Guto gida and Mechara could be explained by the effect of decreasing soil pH during incubation of the unlimed soils, high exchangeable Al and clay content of the soils resulting in higher immobilization of P (Table S1). Concurrent with this suggestion, Basta et al. (1995) reported that exchangeable Al decreased in a linear fashion with increase in P rate. These authors also proposed that reduction in P solution for the highest P rate occurred due to precipitation. It can, therefore, be proposed that applying P at higher rates may not be effective in increasing plant yield but can rather adversely affect it.
On the basis of observed yield of Bako, Gununo, Guto gida and Mechara, it can be recommended that applying P at rates higher than 100, 50, 50 and 50 kg P2O5/ha respectively, can have an adverse effect on the yield in these acidic soils if not limed. However, for Mechara soil, high clay, Fe and Al contents may be responsible for P immobilization (Table S1).
3.5 Correlation between plant yield and DMT-HFAO/DMT-HFO extracted P
Table 2 and Table S3 show Pearson’s correlation coefficients to assess the relationships between the cumulative P desorbed and maize yield, and desorption rate constants and P-fractions among the studied soils. Both DMT-HFAO and DMT-HFO (used as reference) showed significant (p < 0.01) correlation to shoot dry matter (SDM) and P uptake. Significant correlations were also observed between the cumulative P desorbed and desorption indices such as kA, kB and kA + kB for both DMT-HFAO and DMT-HFO techniques, the effect of kA and kA + KB on phosphorus pools (p-fractions) being more pronounced for the modified technique than the reference. Among the P fractions, HCO3-Pi, HCO3-Po and D/HCl are the ones evidencing highly significant correlations with the yield parameters in both techniques. In this study, the contribution of both the labile and non-labile Pi fractions in replenishing the solution Pi was significant whereas the organic fractions appeared to have limited contributions in replenishing the solution P except HCO3-Po. * significant at 0.05 probability level. ** significant at 0.01 probability level. No distinctive rate difference obtained.
Site
DMT-HFAO (Modified Method)
DMT-HFO (Reference)
Sorbent
SDM yield (g/plant)
P-uptake (mg/plant)
Sorbent
SDM yield (g/plant
P-uptake (mg/plant)
Bako
HFAO
0.99**
0.986*
HFO
0.984*
0.994**
kA
0.998**
0.99**
kA
0.899
0.817
kB
0.947
0.951*
kB
0.843
0.877
kA + kB
0.981*
0.981*
kA + kB
0.937
0.982*
Bishoftu
HFAO
0.996**
0.999**
HFO
0.871
0.880
kA
0.99**
0.993**
kA
0.823
0.855
kB
0.976*
0.969*
kB
0.974*
0.959*
kA + kB
0.987*
0.986*
kA + kB
0.976*
0.985*
Gununo
HFAO
0.994**
0.993**
HFO
0.956*
0.953*
kA
0.991**
0.992**
kA
0.987*
0.987*
kB
0.976*
0.977*
kB
–
–
kA + kB
0.987*
0.988*
kA + kB
0.987*
0.987*
Guto-Gida
HFAO
0.988*
0.996**
HFO
0.999**
0.967*
kA
0.983*
0.996**
kA
0.986*
0.957*
kB
0.968*
0.967*
kB
0.723
0.671
kA + kB
0.977*
0.999**
kA + kB
0.945
0.909
H.selam
HFAO
0.995**
0.990**
HFO
0.546
0.510
kA
0.988*
0.991**
kA
–
–
kB
0.985*
0.994**
kB
0.800
0.810
kA + kB
0.992*
0.995**
kA + kB
0.779
0.797
Mechara
HFAO
0.965*
0.983*
HFO
0.871
0.924
kA
0.988*
0.960*
kA
0.974*
0.990**
kB
0.786
0.855
kB
0.745
0.830
kA + kB
0.999**
0.990**
kA + kB
0.889
0.944
The stronger and highly significant correlation between plant yield parameters and P fractions such as HCO3-Pi+Po and d/HCl-Pi exhibited by the modified technique, DMT-HFAO, demonstrated the suitability of the modified technique in approximating the actual mode of plant P uptake as compared to the reference method. This outstanding performance of the modified approach is also evidenced on the indices kA and kB. Corroborating these results, Taddesse et al. (2008a) employed two component first order model and reported significant relationship between the rate indices and yield parameters (SDM and P uptake). The two rate constants are significantly different (p < 0.05) with mean values kA = 0.0046 ± 0.0002 h−1 (SE) and kB = 0.0008 ± 0.0000 h−1. These values concur with the values from previous reports on the rate constants (Lookman et al. 1995; Taddesse et al., 2008a). It can, therefore, be suggested that DMT-HFAO influenced the pool and correlated better to maize plant P-uptake and dry matter yield.
Table 2 depicts correlations between cumulative P extracted over 42 days by DMT-HFAO and DMT-HFO techniques with shoot dry matter yield, P-uptake by maize plant, and rate constants of P desorption. Highly significant and strong correlations were observed between DMT-HFAO, dry matter yield and P-uptake for almost all soils in this study. This indicates that the modified system simulates the plant P uptake from the soils very well. On the other hand, the reference DMT-HFO showed significant correlations with yield parameters only for soils of Bako, Gununo and Guto-Gida sites (Table 2). Moreover, no significant correlation was observed for Bishoftu, and Mechara soils by the reference method, evidencing the superior performance of the modified technique over the reference method. Despite some exceptions in the case of DMT-HFO for Hagere Selam and Mechara soils, shoot dry matter (SDM) showed better correlation than P- uptake for both approaches. This is an important finding since P-uptake over 56 days by maize plant goes parallel with cumulative P extracted over 42 days extraction. In contrast to this result, Taddesse et al. (2008b) reported better correlation between DMT-HFO and P-uptake of maize plant than dry matter yield. This might be due to differences in soil texture, which are clay, sandy clay loam and clay loam in our case unlike the sandy textural class in their study.
The desorption index, kA, showed better correlation with yield parameters compared to kB across the soils, In addition to this, highly significant correlation between the gross pools (kA + kB) and plant yield is observed revealing the presence of continuum desorbable P forms (Lookman et al., 1995).
3.6 Predicting time for phosphate depletion from slow labile pool
The cumulative P extracted with both DMT-HFAO and DMT-HFO is shown in Fig. 5a and b as data points. From the curve, no desorption maxima was reached in the extraction time of 1–42 days. For both DMT-HFAO and DMT-HFO sorption continued after 42 days but with the higher sorption capacity of DMT-HFAO. The rate was initially faster for two weeks and then slowed down indicating two distinct pools of soil P, one with rapid kinetics and the other with slower P desorption from soil (de Jager and Claassens, 2005). The rate constants of labile and slow labile pools of the soils were obtained from the slope of natural logarithm of P against time.
The average P desorption rate constants of pool A, pool B of the soils, an estimated half-life (t1/2) and time for depletion of slow labile pools are shown in Table S4. The critical assumption made here is that the rate constants do not change over time. Continuous cropping was also assumed although it may not happen in real cases of P depletion from soils. Accordingly, soil P depletion from slow labile pool B can stay longer than predicted here. The fact that the slow labile pool was considered here is because its contribution to the total P release in the beginning was little but increased gradually overtime and was not depleted in 42 days. Using DMT-HFAO data, depletion of phosphate from slow labile, pool B of Hagere-selam and Mechara soils would be longer time (461 days) followed by Bishoftu soil (Table S3). High DCB extractable Fe and low pH could be responsible for longer depletion time (461 days) due to mineral phosphate and phosphate diffused into occluded sorption site in these soils. Because of low solubility of the minerals strengite in acid soils (McDowell and Sharpley, 2003; de Jager and Claassens, 2005), it will take a longer time to replenish phosphate removed from solution. The time required for the depletion of pool B for the remaining three soils parallels the DCB extractable Fe exhibited by these soils.
4 Conclusion
The modified technique, DMT-HFAO enabled us to study changes in phosphate pools of soils over time and how these changes relate to maize plant growth on soils from six sites. The results of this study have demonstrated that DMT-HFAO had strong and highly significant correlations with maize plant P uptake and shoot dry matter yield for all soils studied. The technique simulated maize plant to take up P from strongly acidic to slightly neutral soils much more than DMT-HFO which showed significant correlations only for soils from three sites. The correlation was on average better between DMT-HFAO and P-uptake than shoot dry matter yield. This is an important finding since P-uptake over 56 days maize plant goes in parallel with cumulative P extracted by DMT-HFAO over a 42- day extraction. The technique we employed also shortened the reported extraction time of 56 days by 14 days while steady state was not still achieved. In general, a better correlation of P uptake with gross P release (kA + kB) was obtained when DMT-HFAO was used instead of DMT-HFO. This confirms that the modified system copes well with labile and slow labile pools and can be assumed to monitor continuum P release of soils. DMT-HFAO can, therefore, help as a tool for predicting soil P desorption rate over long period of time from acid to slightly neutral pH range of soils. For the soils studied, DMT-HFAO technique predicts 300–461 days for phosphorus depletion from slow labile pools. On the basis of this finding, it can be suggested that the improved technique DMT-HFAO could be employed for a long-term P desorption study. Accurate estimation of residual P is important from environmental perspective. In addition, it helps on the judicious use of this non-renewable fertilizer. However, further research is required considering differentially P treated soils at field level and for soils of wider pH to validate the universality of this technique.
Acknowledgements
The authors thank Haramaya University for providing a financial grant for the research (HURG-2016-03-02 and HURG-2020–03–02–75). I.D. acknowledges funding from PID2022-136321OB-C21, MCIN/AEI/10.13039/501100011033 and European Union “NextGenerationEU”/PRTR through the project TED2021-131143B-I00.
Declaration of Competing Interest
The authors declare that they have no known competing financial interests or personal relationships that could have appeared to influence the work reported in this paper.
References
- Status of soil acidity under different and use types and soil depths: the case of Hojje watershed of Gomibora district, Hadiya Zone, Southern Ethiopia. Appl. Environ. Soil Sci. 2022
- [CrossRef] [Google Scholar]
- Ahmed, K., Taddesse, A.M., Dechassa N., Isabel D., Nejat, R. H., 2023. Fe-Al binary composite filled dialysis membrane tubes (DMT-HFAO): A modified method for assessment of phosphate desorption from aqueous and soil solutions, RSC. Adv. 13, 22346.
- Eutrophication: causes, consequences, physical, chemical and biological techniques for mitigation strategies. Environ. Challenges. 2023;12:100733
- [Google Scholar]
- Synthesis of maghemite (γ-Fe2O3) nanoparticles by thermal decomposition of magnetite(Fe3O4) nanoparticles. Mater. Sci.-Poland. 2013;31:264.
- [Google Scholar]
- Characterization of soil phosphorus by anion exchange resin adsorption and P32-equilibration. Plant Soil. 1955;6:391.
- [Google Scholar]
- Plant phosphorus availability in Latosols and Luvisols from Northeastern Semi arid Brazil. Commun. Soil Sci. Plant Anal.. 2003;34:407.
- [Google Scholar]
- Aluminum transformation and solution equilibria induced by banded phosphorus fertilizer in acid soil. Soil Sci. Soc. Am. J.. 1995;59:357.
- [Google Scholar]
- Fe-Al-Mn ternary oxide nanosorbent: synthesis, characterization and phosphate sorption property. J. Environ. Chem. Eng.. 2017;5:1330.
- [Google Scholar]
- Evaluation of Acidic Soil Tolerance Indices in Maize (Zea mays L.) Varieties in Assosa, Ethiopia. Intern. J. Environ. Sci.. 2022;8
- [CrossRef] [Google Scholar]
- Long-term phosphate desorption kinetics of an acid sandysoil from Mpumalanga, South Africa. Commun. Soil Sci. Plant Anal.. 2005;36:309.
- [Google Scholar]
- Effect of thermal treatment on the various properties of iron (III) –aluminum (III) coprecipitated hydroxide system. Mater. Lett.. 2000;42:331.
- [Google Scholar]
- FAO, 2008. Guide to laboratory establishment for plant nutrient analysis, Rome.
- New method for assessment of long term phosphate desorption from soils. Soil Sci. Soc. Am. J.. 1995;59:1295.
- [Google Scholar]
- Magnetic nanoparticle-supported proline as a recyclable and recoverable ligand for the CuI catalyzed arylation of nitrogen nucleophiles Supplementary Material (ESI) for Chemical Communications. Roy. Soc. Chem. 2007
- [Google Scholar]
- Preparation of alumina-iron oxide compounds by gel evaporation method and its simultaneous uptake properties for Ni2+, NH4+ and H2PO4-. J. Hazard. Mater.. 2009;169:697.
- [Google Scholar]
- Kinetics and Energetics of Phosphate sorption in a multi- componet Al (III)-Fe(III) hydr(oxide) sorbent system. J. Colloid and Interface Sci.. 2008;322:384.
- [Google Scholar]
- Changes in inorganic phosphorus fractionation induced by caltivation practice and by laboratory incubation. Soil Sci. Soc. Am. J.. 1982;46:970.
- [Google Scholar]
- Soil phosphorus: its measurement, and its uptake by plants. Aust. J. Soil Res.. 1997;35:227.
- [Google Scholar]
- Phosphorus transformation in Soils following co-application of charcoal and wood Ash. Agronomy. 2021;11:2010.
- [CrossRef] [Google Scholar]
- Effects of Al3+ doping on the structure and properties of goethite and its adsorption behaviour towards phosphate. J. Environ. Sci.. 2015;45:18.
- [Google Scholar]
- Iron oxide with different crystal phases (α- and γ-Fe2O3) in electroanalysis and ultra-sensitive and selective detection of Lead (II): an advancing approach using XPS and EXAFS. Anal. Chem. 2015
- [CrossRef] [Google Scholar]
- Mechanisms on the morphology variation of hematite crystals by Al substitution: the modification of Fe and O reticular densities. Sci. Rep.. 2016;6:35960.
- [Google Scholar]
- Changes in soil phosphorus fraction in response to long-term phosphate fertilization under sole cropping and intercropping of maize and faba bean on a calcareous soil. Plant and Soil. 2021;463:589.
- [Google Scholar]
- Long-term kinetics of phosphate release from soil. Environ. Sci. Tech.. 1995;29:1569.
- [Google Scholar]
- Phosphate removal from aqueous solutions by a nano-structured Fe–Ti bimetal oxide sorbent. Chem. Eng. Res. Des.. 2015;93:652.
- [Google Scholar]
- Phosphorus transport in overland flow in response to position of manure application. J. Environ. Qual.. 2002;31:217.
- [Google Scholar]
- Phosphorus solubility and release kinetics as a function of soil test P concentration. Geoderma. 2003;112:143.
- [Google Scholar]
- A modified single solution method for the determination of phosphate in natural waters. Anal. Chem. Acta.. 1962;27:31.
- [Google Scholar]
- Synthesis and characterization of maghemite nanopowders by chemical precipitation method. J. Nanostruct. Chem.. 2014;4:99.
- [Google Scholar]
- Synthesis, characterization and photocatalytic activity of Mn2O3/Al2O3/Fe2O3 nanocomposite for degradation of malachite green Bull. Chem. Soc. Ethiop.. 2018;32:101.
- [Google Scholar]
- Chemical changes of applied and nativephosphorus during incubation and distribution into different soil phosphorus. Commun. Soil Sci. Plant Anal.. 2005;36:535.
- [Google Scholar]
- modified DMT-HFO technique for investigating the kinetics of phosphorus desorption from calcareous soils and its relationship with maizegrowth. Commun. Soil Sci. Plant Anal.. 2018.A;49:1281.
- [Google Scholar]
- Phosphorus uptake by Zea mays L. is quantitatively predicted by infinite sink extraction of soil P. Plant and Soil. 2015;386(371)
- [Google Scholar]
- Estimation of langmuir constants using linear and nonlinear least squares regression analyses. Soil Sci. Soc. Am. J... 1996;60:433.
- [Google Scholar]
- Long-term kinetics of phosphate desorption from soil and its relationship with plant growth. S. Afr. J. Plant Soil. 2008;25(3):131.
- [Google Scholar]
- Long-term phosphorus desorption using dialysis membrane tubes filled with iron hydroxide and its effect on phosphorus pools. J. Plant Nutr.. 2008;31:1507.
- [Google Scholar]
- Taddesse, A.M., 2008 Characterizing phosphate desorption kinetics from soil: An approach to predicting plant available phosphorus, PhD Dissertation, University of Pretoria.
- Tadese, T., 1991. Soil, plant, water, fertilizer, animal manure and compost analysis. Working Document No. 13. International Livestock Research Center forAfrica, Addis Ababa, Ethiopia.
- Tiessen, H., Moir, J.O.,1993. Characterization of available P by sequential extraction. In: Soil sampling and method of analysis. Caster, M., Ed.; Canadian Society of Soil Science Lewis Publisher.
- Characterization of Available P by Sequential Extraction. In: Carter M.R., Gregorich E.G., eds. Soil Sampling and Methods of Analysis (2nd ed.). Boca Raton: CRC Press; 2007. p. :293-306.
- [Google Scholar]
- Fe-Al binary oxide nanosorbent: synthesis, characterization and phosphate sorption property. J. Environ. Chem. Eng.. 2016;4:2458.
- [Google Scholar]
- Hydrous Fe-Al-Zr oxide composite filled dialysis membrane tubes for phosphate desorption study from acidic soils. Environ. Nanotechnol. Monit. Manage.. 2022;18:100723
- [Google Scholar]
Appendix A
Supplementary material
Supplementary data to this article can be found online at https://doi.org/10.1016/j.arabjc.2023.105283.
Appendix A
Supplementary material
The following are the Supplementary data to this article:Supplementary data 1
Supplementary data 1
Kinetics of phosphorus desorption from soils using a modified DMT-HFAO technique


