

Translate this page into:
Characterization of groundwater in Quaternary aquifer of the Yanbu Al-Nakhl Basin, Al-Madinah Al-Munawarah Province using pumping tests and hydrochemical techniques
⁎Corresponding author. aalqaraawi@kau.edu.sa (Abdulaziz Alqarawy)
-
Received: ,
Accepted: ,
This article was originally published by Elsevier and was migrated to Scientific Scholar after the change of Publisher.
Peer review under responsibility of King Saud University. Production and hosting by Elsevier.
Abstract
In the Yanbu Al-Nakhl Basin, Quaternary aquifer is the main source of groundwater supply for different uses. The groundwater wells that have been drilled in this area are now not subject to local government regulation in terms of distances and daily pumping rates. This may lead to declines in groundwater levels and deterioration of its quality. The primary goal of this research is to characterize the Quaternary aquifer using measurements of hydraulic parameters and groundwater quality. To achieve this purpose, all aquifer parameters such as thickness, lithology, depth to water, water table, well loss, formation loss, well efficiency, transmissivity and hydraulic conductivity were measured. Moreover, chemical analysis for major ions as well as minor and trace elements of 14 samples were carried out to determine the physicochemical properties, groundwater facies, controlling mechanisms and five irrigation water quality indices (IWQIs). The results revealed that, groundwater originates mainly from highly permeable Quaternary alluvial sediments of (60 m thickness), and flows generally from north to south. The calculated hydraulic parameters indicated that, the average of well efficiency (γ) ranges from 42.21% to 72.2%, transmissivity (T ) varies between 88.2 and 105.4 m2/day, and hydraulic conductivity (K in m/day) ranges from 4.41 to 9.3. In hydrochemical point of view, there are various types for groundwater in the study area including Ca - HCO3, Na - Cl, mixed Ca – Mg – Cl - SO4, and Na – Ca - HCO3. The processes of evaporation and rock – groundwater interaction were significantly influenced the groundwater quality in the Wadi. The computed IWQIs (TDS, TH, SAR, PS, MH, and RSC) had mean values of 1537.685, 678.31, 3.940625, 2.140625, 25.85687 and −10.8068 respectively, indicated that no restriction range for agriculture uses characterizes the majority of groundwater in Wadi Yanbu Al-Nakhl basin.
Keywords
Quaternary aquifer
Pumping tests
Hydraulic parameters
Hydrochemical characteristics
Irrigation quality indices
GIS

1 Introduction
Water scarcity is recognized as a major problem, especially in developing countries, due to poor exploration methods and insufficient water supplies to meet the needs of the population (Shandu and Atif, 2023). Groundwater is usually defined as the water present in the pore spaces of rocks and soils, accounts for approximately 30% of the earth's fresh water, and has particularly important functions in the water cycle (Bekele, 2021; Abdalla et al., 2020; Moodley et al., 2022). Among the countries in the arid regions, Saudi Arabia has limited water resources, making groundwater a necessary supply for different uses. As the kingdom has developed rapidly during the past few decades, both agricultural and anthropogenic activities have affected groundwater quality and accessibility. There are two main water-bearing formations (groundwater aquifers) in Saudi Arabia (Al-Shaibani 2008): (1) deep, non-renewable aquifer under sedimentation that covering the Arabian Shield, and (2) shallow, renewable aquifer under fractured Precambrian basements and alluvial deposits in West and Southwest Saudi Arabia. Western Saudi Arabia gets its water primarily from shallow alluvial Quaternary aquifer found in the major Wadies. Therefore, the shallow aquifer is relatively close to cities with a high population density and is sensitive to human activity. Thus, shallow alluvial aquifer near major cities are always at risk of water level decline and contamination. Due to urbanization, industry, and intensive farming, groundwater resources in desert areas like Saudi Arabia have experienced increased demand (Tayfur et al., 2008; Aghazadeh and Moghaddam 2010; Alqarawy et al, 2022; Alqarawy 2023). Therefore, in order to effectively use, safeguard, and predict the alteration in groundwater behaviors, it is vital to define the characterizations of groundwater in terms of hydrogeological and hydrochemical aspects (Edmunds et al. 2006; Bozda and Gömez 2013; El-Rawy et al., 2021).
Characterizing the groundwater aquifers in semi-arid and arid regions like Saudi Arabia (KSA) is essential for agricultural, domestic, industrial, and economic sustainability. The rapid growth of the world population, which may reach 9.5 billion by 2050, poses a serious challenge to sustainable groundwater resource development (Hiscock et al., 2002; Gleeson et al., 2012; United Nations, 2012). In the Middle East and North Africa, limited water resources are the primary cause of fresh water shortages, rather than decreased rainfall, according to the National Meeting on Hydrogeology (Italy, 2017). Schaible (1999) recommends water resources management plans for handling issues such as decline in groundwater level, salinity increasing, and saltwater intrusion under the aquifer stress. Groundwater characterization relies on a huge hydrogeological dataset of aquifers and hydrochemical characteristics, which provides reliable results to do unusual management strategies that will prevent the undesirable impacts of random drilling of wells and high exploitation of groundwater, as well as the degradation of water quality. In the Al Madinah Al Munawarah province, groundwater is derived from different water bearing formations include Precambrian fractured basement rocks, Paleozoic sedimentary rocks, and alluvial deposits in dry Wadies (Khashogji and El Maghraby, 2013). The majority of groundwater in this region is meteoric, and its chemical components are created through water–rock interactions, in which weak CO2-charged precipitation at low pH attacks various silicates and further minerals to form major, minor and trace elements (El Maghraby, 2014). Agricultural activities are predominant in the Wadies courses near Al Madinah Al Munawarah city and industrial activities are concentrated in Wadi Al Aqiq (El Maghraby, 2013 and 2014). Water from this area and other areas is pumped into an unlined landfill approximately 3 km from the Wadi Al Aqiq. Trace metals such as Fe, As, Ba, V, and Al are released into the groundwater at the site.
In the Yanbu Al-Nakhl Basin, there is a lack of hydrogeological and hydrogeochemical studies. Because of mismanagement of groundwater system in this area, water levels have declined and salinity has increased. Farm owners drilled unlicensed groundwater wells and discharged water at random, resulting in overexploitation of the aquifer, thereby depleting it qualitatively and quantitatively. In this research, we have carried out a regional-scale quantitative and qualitative study of the Quaternary aquifer system to define the hydrogeological parameters, to characterize the hydrogeochemistry of groundwater, to identify the areas prone to be affected by declining in water levels and the increasing salinity and to evaluate the groundwater suitability for agricultural use, based on different techniques such as pumping tests and hydrochemistry as well as irrigation water quality indices (IWQIs). The obtained results could be used as a tool to help evaluate the best locations for groundwater extraction and to determine how vulnerable aquifers are to pollution, allowing for the protection and management of the most vulnerable aquifer places to be contaminated by saltwater intrusion and other sources.
2 Study area
Wadi Yanbu Al-Nakhl selected for this study is considered one of the most important Wadies of Al-Madinah Al-Munawarah, KSA. It is situated between latitudes 23° 45′ − 25° 00′ N and longitudes 370 45′ - 390 00′ E with a total area of 8300 Km2 (Fig. 1a&b). The main activity in this Wadi is agriculture, using unlicensed, unregulated drilled wells. Where surface water is scarce, irrigation water have been exploited from the Quaternary aquifer (Delgado et al. 2010; Li et al. 2013; El Maghraby et al. 2013). Climatically, the studied Wadi is characterized by an arid to the hyper-arid condition, like other parts of KSA. High temperatures and low rainfall are characteristic of this region. Rainfall distribution map of (Fig. 2a) indicated that the precipitation ranging from 5 to 40 mm. Rainfall generally increases from west to east and there is rarely any rainfall, sometimes it is stormy, and it lasts for a few minutes. The most frequent months for rain to occur in sporadic storms are November to December and March to April, while some years may be entirely dry. In July and August, the average daily temperatures range from 28 to 42°Celsius, and in December and January, they range from 11 to 24°Celsius.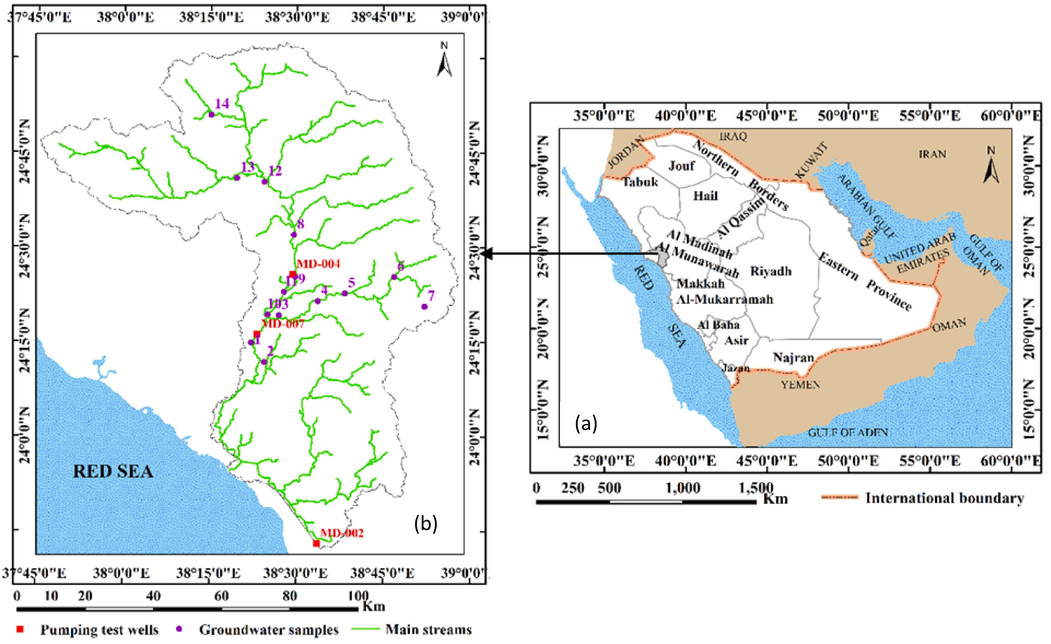
(a) Key map of Wadi Yanbu Al-Nakhl, Al-Madinah Al-Munawarah Province and (b) locations of groundwater wells.
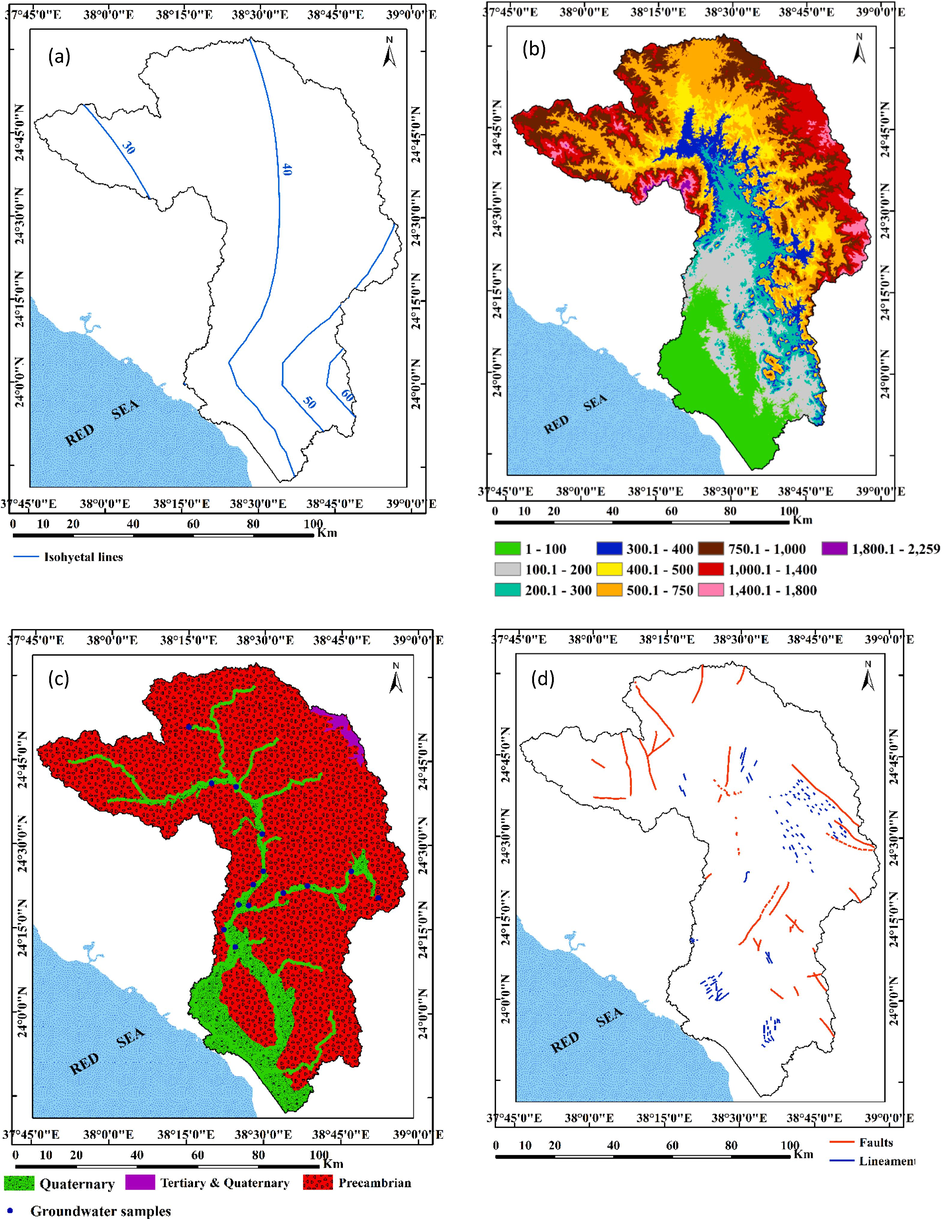
Distribution of annual rainfall (a), Digital Elevation Model (DEM) in meter (b), geological map (c) and a complex network of fractures and faults (d) of Wadi Yanbu Al-Nakhl, Al-Madinah Al-Munawarah Province.
Topographically, the studied Wadi is characterized by a wide range of elevations, which is ranging between > 100 m in the south at the Red Sea coast and 2259 m at the Hijaz Mountains in the northern portion of the region (Fig. 2b). Coastal plains (lowlands) are located between the sabkhas and the foothills and are normally inundated by flash floods as they cross the drainage basins. These low lands are characterized by alluvial deposits, which are suitable for groundwater recharge. From the coastal plain to the mountainous range, the foothills (hilly areas) rise to about 400 m above sea level. This area is gently sloping and partly plateaued, and it is made up of boulders and alluvial deposits with high permeability for water infiltration. Stream networks mostly originate from Hijaz mountainous series crossing hilly regions to the coastal plain. The Hijaz Mountains (highland areas) extend east and north of the hilly areas parallel to the Red Sea and are marked by steep elevations that reach about 2259 m (amsl).
Geologically, Wadi Yanbu Al-Nakhl composed of a wide range of geological periods extending from Precambrian to Quaternary times. The main geologic formations are extending from fractured igneous and metamorphic rock (basements), sedimentary, Wadi deposits and lava flows (Harrat) in the northeastern sides as shown in Fig. 2c. Most of the studied Wadi is composed of Precambrian basement rocks that were folded, metamorphosed, granitized, and intruded prior to the Cambrian (Pellaton, 1981). A complex network of fractures and faults, mostly planar and highly variable in density, characterizes the basement rocks. Faults often appear as conjugate structures with normal kinematics, often associated with ductile deformation (Fig. 2d). This area contains small exposures of hugely schistose rhyolitic tuff and breccia that dates from the Tertiary Period (El Maghraby et al., 2013). Alluvial deposits, sabkhahs and khabras, and Wadi fill deposits of the Quaternary period form the bedrock of the main Wadi channel (Pellaton, 1981).
3 Field trips and methodology
In order to reach the goal of this study, which is to define the characteristics of groundwater for the purpose of management and sustainable development, based on the assessment of aquifer, pumping tests and physiochemical parameters, we used a variety of field works and methods including:
3.1 Field trips
During the field trips between 2021 and 2022, the following activities and data acquisition are performed:
-
The hand-held Magellan GPS-315 was used to conduct a comprehensive survey of 14 production groundwater wells during (Fig. 1b).
-
The static groundwater levels are measured from the ground surface to construct a water table map for groundwater flow in the Wadi,
-
Fourteen groundwater samples were collected from the Quaternary aquifer (600 ml) to study the physicochemical parameters (major, minor, and trace elements) of the groundwater. Prior to sampling, groundwater was pumped for approximately 15 min to remove standing water to ensure accuracy. In addition, duplicate samples were collected to consider analysis of both major and trace elements. The collected water samples were scientifically sealed and stored at a temperature below 4 °C before being transported to the laboratory for chemical analysis.
-
Field-based water parameters including electrical conductivity (EC), temperature, and pH.
-
In collaboration with the Ministry of Environment, Water & Agriculture (MEWA), data on pumping tests was obtained for three wells.
3.2 Methodology
To achieve the aim of this study, we used the following methods due to the above collected data:
-
By integrating the Geographic Information System (GIS 10.2) and Surfer (v14), some thematic maps are created based on hydrogeological data, including, depth to water, water level and flow direction as well as total dissolved solids (TDS).
-
Using the AQUIFER TEST (2016), three pumping tests data (long duration and step drawdown) had been analyzed in this study for the purpose to determine both aquifer and well hydraulic parameters as follows:
-
Step drawdown pumping tests analysis:
A step drawdown-pumping test is essential for determining the efficiency of a well and determining its discharge (Rotzoll, 2007; Masoud, 2020). Laminar flow in the formation (formation loss) and turbulent flow through the well screen and casing (well loss) are the two most common causes of well drawdown (El Osta, 2012). In this study, step drawdown test data for three wells have been analyzed using the following equation of Rorabaugh, 1953 (Kruseman and de Ridder, 1990):
In this equation: S indicates the expected drawdown (m), Q is the rate of discharge (m3/h), B is the formation loss factor (h/m2), and C indicates the well loss factor (h2/m5).
During a pumped well operation, the drawdown (S) is the sum of the loss in the formation (BQ) and the well loss (CQ2). In the above equation, the drawdown is divided by the rate of discharge, so the equation is as follows:
Well S/Q measures the specific drawdown. Furthermore, well efficiency can also be calculated by applying the equation below at any pumping rate:
-
-
Long duration pumping tests analysis:
Long duration pumping tests are a common method for determining hydraulic parameters, such as transmissivity and hydraulic conductivity. The following methods of analysis are applied to the data collected from three constant discharge tests in the study area (Jacob, 1950). In this method, the drawdown (s) is schemed against the corresponding time (t) on a single logarithmic paper, and the best-fit straight line was drawn between them. Transmission (T) values in m2/day were considered by using the following equation:
In which: Q = the discharge rate (m3/h) and Δs = slope of a straight line per log cycle.
Through dividing Transmission (T) values in m2/day by the aquifer thickness (H) in meter, the Hydraulic conductivity (K) in m/day can be obtained as follows:
-
Chemical analysis for 14 groundwater samples were done in an accredited and dedicated laboratory (DRCL, Egypt). The American Society for Testing Materials (ASTM, 2002), Fishman and Friedman (1985), and Rainwater and Thatcher (1960) have all used the measuring methodologies. Major ions (Ca2+, Mg2+, K+, Na+, CO3–, HCO3–, SO42-, and Cl-), some minor and trace elements (SiO2, F, Br, I, NO3, PO4, Al, Cu, Fe, Mn, Pb, Si and Sr) were obtained by these analyses. Ion chromatography was used to measure the parameters' concentrations (Cl, NO3, and SO42-, Ca2+, Mg2+, K+, and Na+) (ICS-1100 systems). By titrating against 0.01 N H2SO4 and utilizing phenolphthalein and methyl orange as indicators, CO3– and HCO3– contents were calculated. Trace and heavy elements were detected using the Thermo-Jarrell Elemental Company's inductively coupled plasma-optical emission spectroscopy (ICP-OES).
-
To detect groundwater recharge and salinization as well as the primary mechanism affecting groundwater chemistry, the datasets were graphically represented using Piper (Piper, 1944), Gibbs (Gibbs, 1970) and HEF diagrams. The primary goal of the Gibbs graph is to emphasize the critical elements that affect the quality of the groundwater. Instead, other, more complex diagrams (like the Piper plot) will improve our comprehension of the hydrogeochemical mechanisms governing the features of groundwater.
-
Analysis of groundwater quality indices for irrigation (IWQIs).
The suitability of irrigation groundwater was assessed utilizing a standard formula for the following water quality parameters (Table 1): All parameters are considered in meq/L excluding TDS and TH in mg/L.
Parameter
Symbol
Formula
References
Total dissolves solids
TDS
(Ca2+ + Mg2+ + Na+ + K+ +Cl− + SO42−+ HCO32- + CO3- + NO3-)
(Ayers and Westcot, 1994)
Total hardness
TH
(2.5 × Ca2+) + (4.2 × Mg2+)
Todd and Mays 2005
Sodium adsorption ratio
SAR
(Richards, 1954)
Potential salinity
PS
Cl−+ (SO42−/2)
(Doneen, 1964)
Magnesium hazard
MH
[Mg+/(Ca2++ Mg+2)] × 100
(Raghunath, 1987)
Residual Sodium Carbonate
RSC
(HCO32-+ CO3-) - (Ca2+ + Mg2+)
(Eaton, 1950)
4 Results and discussions of the observations
4.1 Groundwater aquifer
Nowadays, many agricultural projects rely on the renewable groundwater aquifers in the western part of the KSA. The infiltration of precipitation from the soil area of Wadies into the aquifers is the main source of groundwater recharge in this region. The studied Wadi is located west Al-Madinah Al-Munawarah city by about 70 km and characterized by drainage lines that flow to the south (Fig. 1b). Groundwater of this Wadi originates in the alluvium highly permeable sediments of the Quaternary period. The Lithological description of the Quaternary alluvial deposits is that from 0 to 21 m, there is gravel consisting mainly of polymictic gravel, sand traces, and silt traces, and from 21 m to about 60 m, mainly indicate the presence of dark gray basaltic conglomerates (40% unrounded). The groundwater wells as shown in Fig. 1b were haphazardly drilled by the owner without strategic plan for drilling. This may cause decline in water levels in the Wadi. Initial depth to groundwater in 2022 ranges from 1.85 m to 28.8 with below the ground surface (BGS). The depth to water increases from west to east as shown in Fig. 3a. Based on the water depth measurements and elevation data of ground surface, water table was calculated the distribution map and flow direction were constructed (Fig. 3b). It appears from this map that the groundwater movement is generally directed from north to south in the northern part and from east to west and southwest in the other parts of the study area. This flow direction is similar to the prevailing direction of the Wadi's drainage network. According to closely spaced contour lines as shown in Fig. 3b, the hydraulic gradient of groundwater generally runs east–west. Faults and fractures that dissect the basement rocks with different magnitudes are mainly responsible for such steep gradients. This reflects that, the essential source of recharging the Quaternary aquifer is from the rainfall, which falls on the Wadi, as well as the upward leakage from the dissected basement rocks especially in the upstream portion. The study area receives an average annual rainfall of 25 mm (Fig. 2a). According to Bazuhair and Wood (1996) and Al-Shaibani (2008), precipitation-weighted chloride concentrations for regions along the western border of KSA range between 6 and 12 mg/L. Accordingly, precipitation recharge to groundwater in this region is about 6.58%, depending on the equation of chloride mass balance (Al-Shaibani 2008). Therefore, an optimal management of groundwater in Wadi Yanbu Al-Nakhl involves not over-extracting of groundwater and maintaining a safe distance between drilled wells to avoid interference between wells due to limited amount of recharge from rainfall.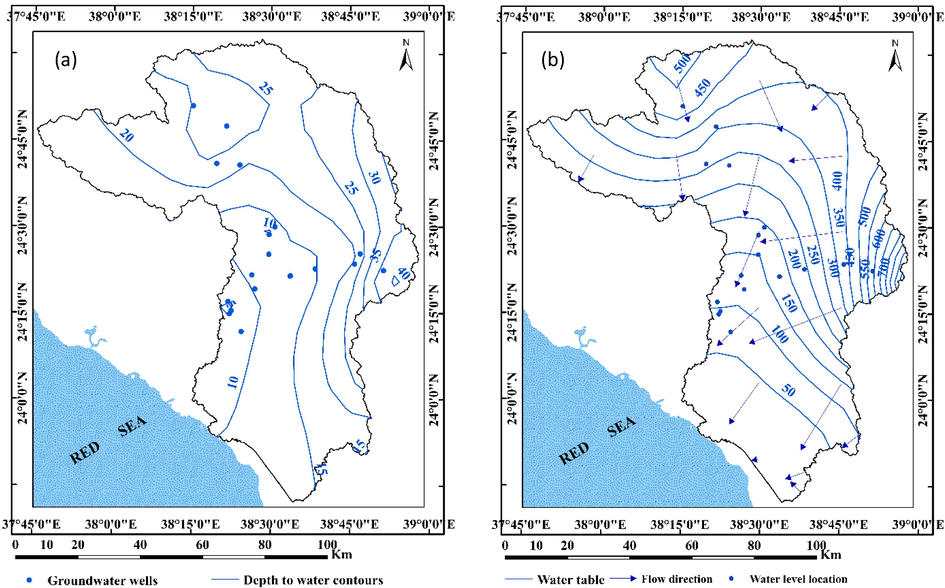
Distribution maps of depth to water (a) and water table (b) in Wadi Yanbu Al-Nakhl, Al-Madinah Al-Munawarah Province.
4.2 Hydraulic parameters
In the context of groundwater management and especially in light of surface water scarcity, rules on land are crucial, for example, those related to well location, spacing between wells, groundwater withdrawal. In addition, another factor is the interaction between the water bearing formation and the drilled well represented by the hydraulic parameters that govern this relationship. In this work, more and more attention has been paid for determining of these parameters depending on the results obtained from the analysis of step and constant pumping tests analyses, since the problem in most groundwater legislation lies in its implementation and manageability. Therefore, hydraulic parameters play an important role in managing and sustaining groundwater resources (Uhl, 1986). There are several parameters to predict hydraulic head drawdown in aquifer under proposed pumping tests, including, well loss, formation loss, well efficiency, transmissivity, hydraulic conductivity. These parameters were determined using Aquifer test 2016 software (Fig. 4 and Table 2) as follows: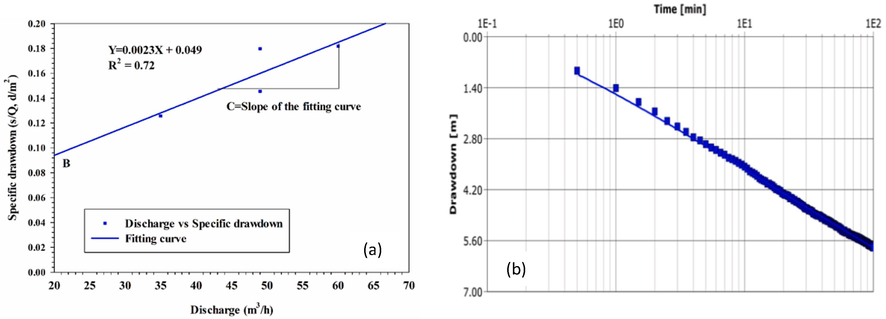
Example of step (a) and long duration (b) pumping tests of the study well no. MD002.
Well No
Step test analysis
Long-duration test analysis
Step
No.
Draw-down
S
(m)
Discharge
Q
(m3/d)
Formation loss coef.
B
(h/m2)
Well loss coef.
C
(h2/m5)
Aquifer loss
(BQ)
Well loss (CQ2)
Well Efficiency
(γ)
%
Aver. of
(γ)
%
Transm-issivity
T
(m2/day)
Hydraulic cond.
K
(m/day)
MD 002
1
4.4
35.00
0.088
0.002
3.08
2.45
55.70
50.11
88.2
4.41
2
7.13
49.00
0.088
0.002
4.312
4.80
47.32
3
8.81
49.00
0.088
0.002
4.312
4.80
47.327
4
10.91
60.00
0.088
0.002
5.28
7.20
42.31
MD 004
1
16.41
1137.02
0.01475
0.000005
16.77
6.46
72.20
66.60
105.4
9.3
2
20.97
1338.34
0.01475
0.000005
19.74
8.96
68.80
3
27.32
1637.28
0.01475
0.000005
24.15
13.40
64.30
4
31.74
1882.66
0.01475
0.000005
27.77
17.72
61.05
MD 007
1
0.98
599.16
0.00163
0.0000014
0.976631
0.50
66.14
61.8
95.4
8.3
2
1.29
719.00
0.00163
0.0000014
1.17197
0.72
61.94
3
1.69
864.00
0.00163
0.0000014
1.40832
1.05
57.29
As shown in Table 2, the results of the step pumping tests indicated that the well loss coefficients range from 1.4 × 10⁻⁶ to 0.002 (h2/m5) for well nos. MD007 and MD002 respectively, while the formation loss coefficients vary between 0.00163 in h/m2 (well no. MD007) and 0.088 (h/m2) (well no. Md002). Additionally, graphical method estimates the total drawdown (well loss + formation loss) very closely to the actual drawdown. The average of well efficiency (γ) ranges from 42.21% (well no. MD002) to 72.2% (well no. MD004). In contrast, average well loss percentages range from 27.8 % (well no. MD004) to 57.79 % (well no. MD002). Based on these results, it appears that well losses are relatively high in Wadi Yanbu Al-Nakhl. The clogging of well screens or the degradation of well screens can lead to an increase in well losses especially in old wells as well as most of existing wells are drilled by the people, not the companies.
On the other hand, obtained results of long duration pumping test analysis (transmissivity and hydraulic conductivity) show the Quaternary aquifer in Wadi Yanbu Al-Nakhl have relatively low values of transmissivity (T) between 88.2 and 105.4 m2/day (Table 2). Based on the classification of Gheorghe (1979) for aquifer potentiality depending on T values, it can be decided that the Quaternary aquifer is low to moderate in potential. According to calculated data of the hydraulic conductivity (K), the Quaternary aquifer has moderate values of K vary from 4.41 to 9.3 m/day (Table 2). These hydraulic parameters confirmed that large quantities of groundwater should not be withdrawn by reducing the well operating hours, along with the recommendation to avoid drilling new wells with many wells in order to prevent interference between them and the sharp drop in water levels.
4.3 Hydrochemistry of groundwater
Within the present research, the hydrogeochemistry of groundwater in Wadi Yanbu Al-Nakhl had been studied through the following sections:
4.3.1 Physiochemical parameters
The Physiochemical characteristics of groundwater in Wadi Yanbu Al-Nakhl are listed in Table 3. It has been shown that the pH values in the analyzed samples ranged between 7.37 and 7.68 with a mean value of 7.55 (pH > 6.5) and they are suited to agricultural use (Ayers and Westcot, 1994; Elhaddad and Al-Zyoud). The average EC value was 2446 µS/cm, with values ranging from 776 µS/cm in the eastern upstream portion of the Wadi (Well no. 6) to 7300 µS/cm in the downstream area close to the Red Sea (Well no. 1). These findings showed that 21% of samples (well nos. 1, 2, and 3) were not appropriate for irrigation (EC > 3000 S/cm) due to high solute dissolution, with the exception of few plant species that, according to FAO 1994, can survive high salinity of water. Groundwater quality ranges from fresh to brackish, with levels of TDS ranging from 408 mg/L in the eastern to 4583 mg/L in the southwestern portions of the Wadi. The concentrations of the main dissolved constituents (major cations and anions), as indicated in Table 3, were likewise quite varied. The fact that there are such vast variations in ionic concentrations reflect many hydrochemical processes altering the groundwater quality. - TDS (Total Dissolved Solids) and EC (Electric Conductivity) are calculated in mg/L and µS/cm respectively. - Alk. means alkalinity and TH means total hardness.
Well
No.
pH
EC
TDS
Cations in mg/L
Anions in mg/L
Alk.
mg/L
TH
mg/L
Ca
Mg
Na
K
CO3
HCO3
SO4
Cl
1
7.37
7300
4583
546.29
135.22
872.91
22.66
12.00
97.60
2064.52
880.61
99.98
1919.04
2
7.41
4590
2790
311.71
149.53
434.66
8.87
12.00
82.35
1055.51
776.29
87.48
1392.59
3
7.52
3980
2466
293.53
81.02
400.19
10.85
6.00
100.65
940.97
683.29
92.48
1065.53
4
7.43
2680
1579
262.60
64.32
200.54
7.43
6.00
152.50
478.41
483.85
134.97
919.67
5
7.68
1036
561
95.73
15.26
86.46
4.20
12.00
176.90
117.50
141.63
164.97
301.61
6
7.66
776
408
80.30
10.96
56.33
3.69
6.00
155.55
80.61
91.98
137.47
245.39
7
7.65
1192
654
68.94
1.99
172.37
2.52
0.00
91.50
186.34
175.94
74.98
180.20
8
7.61
1135
661
92.16
20.15
116.07
4.66
15.00
122.00
209.04
142.87
124.98
312.80
9
7.59
1347
810
121.15
25.98
128.68
5.03
12.00
134.20
278.36
171.91
129.97
409.10
10
7.48
2020
1421
183.10
46.17
225.15
5.89
6.00
152.50
488.74
389.66
134.97
646.69
11
7.61
1505
956
139.79
28.15
145.74
5.44
21.00
140.30
343.66
201.98
149.97
464.54
12
7.54
1084
629
81.51
21.65
107.78
3.70
30.00
106.75
194.70
136.71
137.48
292.38
13
7.48
1077
592
77.82
24.01
107.71
5.86
15.00
280.60
132.15
88.97
254.95
292.89
14
7.68
1332
783
103.43
12.94
148.48
4.74
12.00
268.40
208.94
158.22
239.95
311.27
Min.
7.37
776
408
68.94
1.99
56.33
2.52
0.00
82.35
80.61
88.97
74.98
180.20
Max.
7.68
7300
4583
546.29
149.53
872.91
22.66
30.00
280.60
2064.52
880.61
254.95
1919.04
Average
7.55
2446
2810
192.08
49.31
258.27
7.55
12.19
151.55
557.79
343.34
143.41
678.31
Well No.
Minor and trace elements in mg/L
SiO2
F
Br
I
NO3
PO4
Al
Cu
Fe
Mn
Pb
Si
Sr
1
20.28
1.07
1.79
0.078
104.58
0.18
<0.01
<0.006
<0.02
<0.002
0.234
9.478
6.338
2
29.40
1.92
1.30
0.057
67.50
1.16
<0.01
<0.006
0.245
<0.002
0.147
13.74
4.331
3
13.90
1.95
0.78
0.204
0.02
0.03
0.305
0.011
<0.02
0.07
<0.008
6.496
4.775
4
40.55
0.50
0.69
0.046
62.42
0.31
<0.01
0.032
0.114
0.029
0.213
18.95
3.233
5
33.93
0.08
0.16
0.027
34.95
0.05
<0.01
0.049
0.272
<0.002
0.022
15.86
0.8005
6
26.38
0.25
0.12
0.021
36.34
0.04
<0.01
0.05
<0.02
<0.002
<0.008
12.33
0.4607
7
15.49
3.12
0.18
0.073
0.75
0.04
<0.01
<0.006
<0.02
<0.002
<0.008
7.238
1.269
8
29.40
0.46
0.16
0.018
38.04
0.11
<0.01
<0.006
<0.02
<0.002
0.018
13.74
0.9519
9
22.44
0.36
0.16
0.018
33.93
0.13
<0.01
<0.006
<0.02
0.024
<0.008
10.49
0.9638
10
30.23
1.04
0.23
0.023
58.02
0.14
0.099
<0.006
<0.02
0.006
<0.008
14.13
1.78
11
21.89
0.11
0.18
0.018
48.43
0.18
0.144
<0.006
<0.02
0.049
<0.008
10.23
1.174
12
21.72
0.75
0.14
0.015
39.83
0.09
<0.01
<0.006
0.034
0.019
0.155
10.15
0.6691
13
16.96
0.66
0.11
0.013
18.47
0.11
0.035
<0.006
0.237
0.005
0.196
7.926
0.4898
14
20.54
0.18
0.14
0.013
34.77
0.16
<0.01
<0.006
<0.02
<0.002
0.01
9.6
0.6971
Min.
13.90
0.08
0.11
0.013
0.02
0.03
0.035
0.011
0.034
0.005
0.01
6.496
0.4607
Max.
40.55
3.12
1.79
0.204
104.6
1.16
0.305
0.05
0.272
0.07
0.234
18.95
6.338
Average
24.85
0.98
0.50
0.052
42.66
0.25
0.1538
0.0338
0.1725
0.03077
0.124
11.61
2.17
The concentration of major cations and anions in water samples showed the following ranges: Na+ is 56.33–258.27 mg/L, Ca+2 is 68.94–546.29 mg/L, Mg+2 is 1.99–149.53 mg/L, K+ is 2.52 – 22.66 mg/L, Cl- is 88.97–880.61 mg/L, SO4-2 is 80.61–2064.52 mg/L, CO3-2 is 0.00 – 30.00 and HCO3– is 82.35–280.60 mg/L. Therefore, the ionic dominance of groundwater in the study area indicates Na+ > Ca2+ > Mg2+ > K+; SO42- > Cl- > HCO3– > CO32– (11 samples), and Ca2+ > Na+ > Mg2+ > K+; Cl- > SO42- > HCO3– > CO32– (three samples). In 78% of the analyzed groundwater samples Na+ was the predominant cation due to cation exchange of Ca2+ for Na+ on Na-rich minerals (El Maghraby et al., 2013). An increase in dissolved sodium is caused by the substitution of calcium for sodium, which also causes more carbonate minerals to dissolve in water. Groundwater samples with high calcium concentrations (22%) may be attributed to the existence of calcium-rich silicate minerals and gypsum in the alluvium deposits of the Quaternary aquifer in the region (El Maghraby et al. 2013; El Osta et al. 2020; El Osta et al., 2022 a, b). With the exception of three wells (4, 8, and 6), where chloride concentration only slightly exceeded sulphate concentrations; sulphate was the major anion in 78% of the analyzed water samples. The influence of the industrial wastewater disposal site and dissolution of gypsum in the soil zone could both be responsible for the high SO42- level in the Quaternary aquifer (El Maghraby, 2014). With an average value of 143.41 mg/L, alkalinity values varied from 74.98 to 254.95 mg/L, which is within acceptable limits for irrigation (FAO, 1994).
The average concentrations of minor and trace elements SiO2, F, Br, I, NO3, PO4, Al, Cu, Fe, Mn, Pb, Si and Sr of the analyzed groundwater was 24.85, 0.98, 0.50, 0.052, 42.66, 0.25, 0.1538, 0.0338, 0.1725, 0.03077, 0.124, 11.61 and 2.17 respectively. A variety of sources contributes to the presence of these elements in groundwater, including weathering, dissolution, soil leaching, and human activity. Low amounts of metal contamination in the groundwater samples, such as Br, I, PO4, Al, Cu, Fe, Mn, and Pb were found to be below statutory drinking standards. On the other hand, silicates (SiO2) and Silicon (Si) have relatively moderate concentration in the groundwater of the studied area. These elements were evenly distributed within the aquifer matrix, indicating that silicate mineral dissolution was their primary source (El Maghraby et al. 2013; Alqarawy 2023). Due to the use of nitrogen fertilizers in agricultural and/or contamination by human or animal waste, nitrate concentrations in groundwater can reach high levels (WHO, 2008). A wide range of nitrates (NO3) concentrations was observed between 0.02 mg/L and 104.6 mg/L. This is mainly due to the complex hydrochemical processes as well as soil drainage (Silva and Williams 2001; Bujnovský et al., 2022; She et al., 2022).
4.3.2 Groundwater chemical facies and controlling mechanisms
The hydrochemical analysis of groundwater in relation to water-bearing formations exposes the quality of groundwater in its undisturbed state. Different hydrochemical facies can show differences in groundwater chemistry both within and between aquifers (Gad and El Osta, 2020). In this research, Piper (1944), Gibbs (1970) and HFE diagrams were utilized to classify water types of groundwater and their governing processes. Fourteen groundwater samples were plotted on a Piper-diagram, which depends upon the concentration (in meq %) for the major ions (cations and anions) as shown in Fig. 5. The distribution of cations and anions in the plot determines the type of groundwater. As a result, there are four groundwater types: (1) Ca-HCO3; (2) Na-Cl; (3) mixed Ca-Mg-Cl-SO4, and (4) Na-Ca-HCO3 in most locations (Fig. 5). The present chemical content is strongly impacted by weathering and the aquifer's matrix. Gibbs diagrams are frequently used to illustrate the connection between the groundwater component and aquifer formation. In this diagram, TDS is plotted against (Na + K)/(Na + K + Ca) and Cl/(Cl + HCO3) in order to show the basic regulatory processes that control groundwater geochemistry. The distribution of the groundwater points throughout evaporation and rock-water dominance areas, two key factors influencing groundwater quality. Fig. 6a illustrates how evaporation dominates the majority of the samples, leading to a major rise in Na+, Cl-, and TDS (Gad and El Osta, 2020; Alqarawy, 2023). This result also suggests that the processes of evaporation and rock – groundwater interaction were significantly influence groundwater quality in Wadi Yanbu Al-Nakhl basin. According to the HFE plot results (Fig. 6b), evaporite dissolves in aquifer materials rich in sulphate and chloride. The most of groundwater samples indicate a mixed water type (Ca-Mg-HCO3 and Na-Cl), which contained significant levels of calcium and sodium contents. This is due to sodium-rich clays in aquifer sediments and the surrounding volcanic rock sequences in the Wadi. As well, groundwater samples collected within the downstream area of the Wadi are believed to be affected by seawater intrusion. Because of shallow groundwater depths, salinization of groundwater and soils in the concerned area is mainly caused by high evaporation rates (Alqarawy, 2023).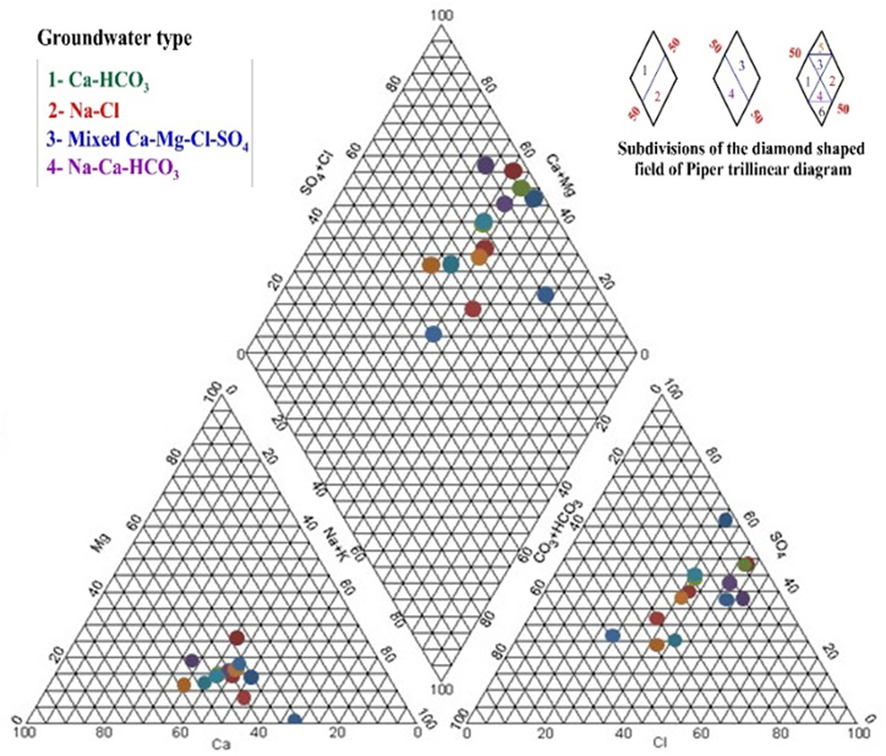
Piper trilinear diagram for Groundwater facies in Wadi Yanbu Al-Nakhl basin.
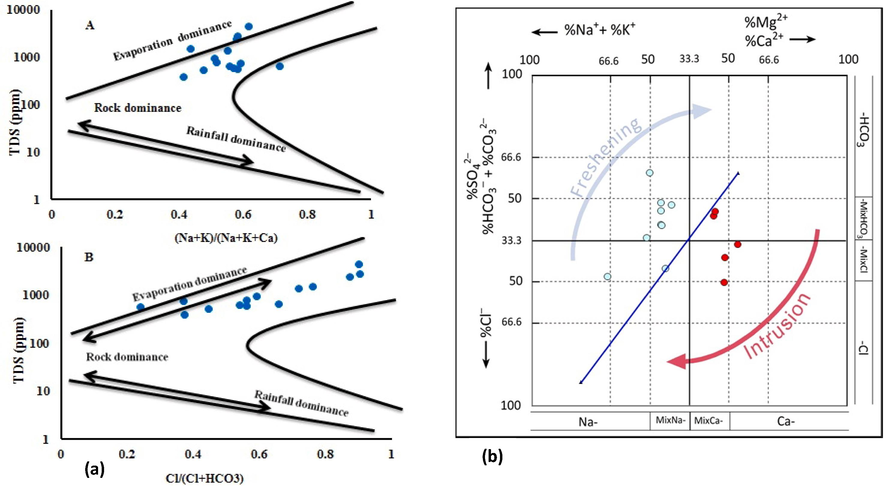
Geochemical controlling mechanisms for groundwater in Wadi Yanbu Al-Nakhl basin: (a) Gibbs diagram and (b) Hydrochemical facies evolution diagram (HFE).
4.4 Evaluation of groundwater for agriculture
Agriculture is the main objective of groundwater exploitation in Wadi Yanbu Al-Nakhl. In this study, water quality index parameters; TDS, TH, SAR, PS, MH and RSC were calculated based on the equations listed Table 1 to determine the suitability of groundwater for irrigation purposes. The results and classification of these indices are presented in Table 4. The calculated TDS of all the samples ranged widely from 444 to 4688 mg/L (Table 4). It showed that 93% of wells (13 samples) have salinity values > 3000 mg/L, which indicates no restriction for irrigation in six samples and slight to moderate restriction in seven samples. In contrast, agriculture is required to follow severe restriction great sensitivity crops adapted to salt-water that grow in loose soil without compacting, particularly in 7 % of the totals samples, which have a salt level of>3000 mg/L. Fig. 7 indicates that TDS increases towards the southwest of the study area. The recharge from rainfall in the upstream of the Wadi, lithologic characteristics and facies variations of the water-bearing formation, as well as salt-water intrusion, notably in the downstream of the Wadi, are the causes of differences in salinity as showed in the TDS distribution map (Fig. 7).
Irrigation Water quality indices (IWQIs)
Min.
Max.
Average
Range
Water category
Number of Samples (%)
Total dissolves solids (TDS)
444
4688
1537.685< 700
No restriction
6 (43.0%)
700–3000
Slight to moderate restriction
7 (50.0%)
>3000
Severe restriction
1 (7.0%)
Total hardness (TH)
180.20
1919.04
678.310–60
Soft
0 (0.0%)
60–120
Moderate
0 (0.0%)
120–180
Hard
0 (0.0%)
> 180
Very hard
14 (100.0%)
Sodium adsorption ratio (SAR)
1.56
8.67
3.940625< 10
Excellent
14 (100.0%)
10–18
Good
0 (0.0%)
18–26
Doubtful or Fairly poor
0 (0.0%)
> 26
Unsuitable
0 (0.0%)
Potential salinity (PS)
1.16
3.27
2.140625< 3
Excellent to good
12 (86.0%)
3 to 5
Good to Injurious
2 (14.0%)
> 5
Injurious to Unsatisfactory
0 (0.0%)
Magnesium hazard (MH)
4.55
44.15
25.85687> 50%
Unsuitable
0 (0.0%)
< 50%
Suitable
14(100.0%)
Residual sodium carbonate (RSC)
−36.38
−0.76
−10.8068< 1.25
Safe
14 (100.0%)
1.25–2.5
Marginal
0 (0.0%)
> 2.5
Unsuitable
0 (0.0%)
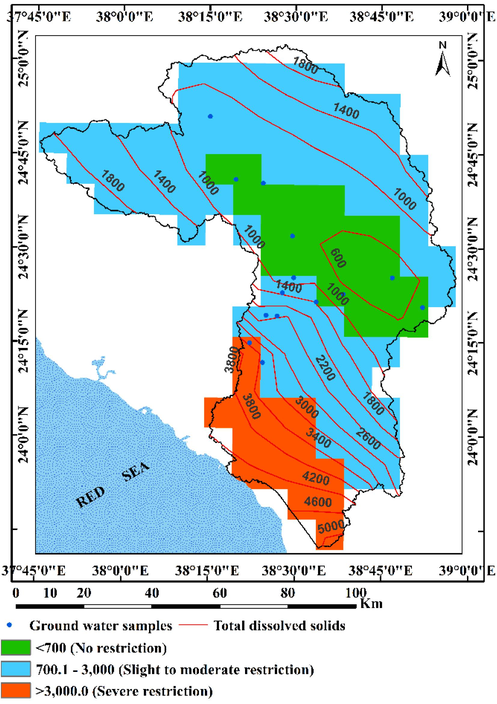
Spatial distribution map of TDS in Wadi Yanbu Al-Nakhl basin.
The total hardness (TH) in groundwater samples ranged between 180.20 and 1919.04 mg/L. These results indicated that all groundwater samples fell into high to very high hardness (USEPA, 1986). The lithology of the aquifer matrix, which is predominantly made up of weathering products of surrounding basic and intermediate igneous rocks as well as the anthropogenic activity are often responsible for the relatively high TH values in the area (Alqarawy, 2023). In addition, during the dissolution of rocks, calcium and magnesium are released into the groundwater, which increases its TH (Giri et al., 2022). Accordingly, all these influences lead to high irrigation water hardness, which is harmful to forage and vegetable crops as high hardness inhibits plant growth (Singh et al. 2013; Giri et al., 2022).
The sodium adsorption ratio (SAR) is a critical index since groundwater with a high sodium level may affect the soil to become harder and less permeable (low rate of soil water percolation). It contrasts the proportions of calcium and magnesium ions to sodium ions in water. The Richards' (1954) equation as shown in Table 1, which represents all ion concentrations in meq/L, can be used to calculate the sodium adsorption ratio in groundwater samples. In Wadi Yanbu Al-Nakhl, all groundwater samples (approximately 100%) were rated excellent irrigation suitability throughout the SAR results, with a mean value of 3.940625. Fig. 8 shows the representation of samples on the US Salinity Laboratory Staff, (USSL, 1954). The findings showed that 10 samples were located inside C3S1 field indicating a high salinity hazard and a low sodium hazard. On clay soil, these groundwater wells can be used for irrigation; however, particular crops should be chosen based on their salt acceptance behaviors (El Maghraby et al., 2013). Meanwhile, four groundwater samples were collected within C4S1 (one samples) and C4S2 (three samples) fields specify high -salinity hazards and low to medium - sodium hazards respectively. Groundwater from these fields should only be used to irrigate salt-tolerant crops, especially the three samples located in C4S2.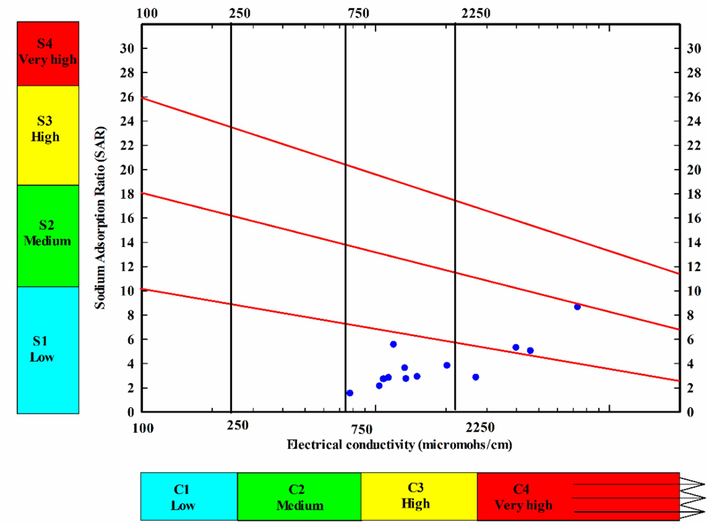
US salinity diagram of the groundwater samples in Wadi Yanbu Al-Nakhl basin.
Moreover, chloride (Cl-) and half of sulphate (SO4-2) contents in groundwater have been used to determine the PS value (Doneen, 1964). This gives a logic of the appropriateness of irrigation water. In this study, there was a range of PS values from 1.16 to 3.27, with a mean value of 2.140625. These results mean that 86% (12 samples) are excellent to good candidates for irrigation, while 14% (2 samples) are good to damaging (Table 4).
The Magnesium hazard (MH) represents the magnesium absorption rate (Giri et al., 2022). There is usually a greater value of magnesium ions in groundwater due to higher exchangeability of sodium ions in irrigated soils. As a result of high magnesium concentrations in agricultural water, the soil becomes alkaline, resulting in low crop yields (Sundaray et al. 2009; Cymes et al., 2022). The magnesium ratio measures the opposing effects of magnesium in irrigated water. Raghunath (1987) introduced an index called “Magnesium Hazard”, which is considered as magnesium ratio (MH) by the formula listed in Table 1. MH values in Wadi Yanbu Al-Nakhl range from 4.55 to 44.15% with an average value of 25.85687%. All MH values (14 samples) are below 50% and groundwater can be used for agriculture.
Irrigating water suitability is highly dependent on the carbonate and bicarbonate concentrations. In the presence of excess carbonate (residual) concentrations, carbonate and calcium ions combine to form scales, solid materials that settle out of water when carbonate concentrations exceed calcium and magnesium concentrations. Due to calcium and magnesium settling out of the water, sodium levels increase, which results in deteriorating effects on plants. Residual sodium carbonate (RSC) is an excess of carbonates and bicarbonates of the alkaline earth metals (Ca2+ and Mg2+) (Sundaray et al. 2009; Elhaddad and Al-zyoud, 2017; Santacruz-De León, et al., 2022). Table 1 lists the method Eaton (1950) proposed for determining RSC. This study found RSC values ranging from −36.38 to −0.761 meq/L in groundwater samples. All samples had RSC values below 1.25 meq/L, indicating that groundwater quality is at a “safe” level for irrigation in the study area. Groundwater samples had negative RSC values, indicating that calcium and magnesium are not precipitated (Sundaray et al. 2009; Srinivasamoorthy et al. 2014). According to the results of this work, optimal groundwater management in the study area requires controlling the daily withdrawals from the productions wells (optimum safe yield), the proposed drilled wells in the Wadi should subject to local government regulation in terms of distances and daily pumping rates in addition to the periodic measurements of the groundwater levels and quality.
5 Conclusion
Groundwater of the Quaternary aquifer is the main source of irrigation in the Wadi Yanbu Al-Nakhl. No strategic plan has been developed for drilling wells. As a result, groundwater quality deteriorates and water levels drop. The aim of this research is to characterize this groundwater resource focusing mainly on all aquifer parameters, physicochemical properties, groundwater facies, controlling mechanisms and the irrigation water quality indices. In light of the obtained results, groundwater occurs under unconfined condition and moves generally from north to south in the northern part, and from east to west and southwest (toward the Red Sea). Aquifer hydraulic parameters indicated that, the average of well efficiency (γ) ranges from 42.21% to 72.2%, and the aquifer have relatively low values of transmissivity and hydraulic conductivity. Therefore, large quantities of groundwater should not be withdrawn from this aquifer by reducing the well operating hours, along with the recommendation to avoid drilling new wells in order to prevent interference between them and the sharp drop in water levels. In addition, the processes of evaporation and rock – groundwater interaction were significantly influenced the groundwater quality in Wadi Yanbu Al-Nakhl basin. A variety of sources contributes to the presence of minor and trace elements, including weathering, dissolution, soil leaching, and human activity. The suitability of groundwater for irrigation was determined based on TDS, TH, SAR, PS, MH, and RSC indices. The computed mean values of these indices were 1537.685, 678.31, 3.940625, 2.140625, 25.85687 and −10.8068 respectively, indicated that most of groundwater samples located within the no restriction class for agriculture uses in Wadi Yanbu Al-Nakhl.
Therefore, the following future directions and recommendations can be summarized in the following points:
-
New piezometers are being drilled in the concerned area for monitoring groundwater levels.
-
Groundwater quality must be continuously monitored.
-
Maintain an interval spacing of at least 500 m between succeeding new drilled wells to reduce interference drawdown, especially when running them simultaneously.
-
Since human activity is the primary cause of groundwater pollution, public knowledge is the most effective instrument for protecting it.
Institutional review board Statement
Not applicable.
Informed consent Statement
Not applicable.
Authors contributions
Not applicable (I am a sole author).
Funding
“This research work was funded by Institutional Fund Project under grant no. (IFPIP: 1698–155-1443) The authors gratefully acknowledge technical and financial support provided by the Ministry of Education and King Abdulaziz University, DSR, Jeddah, Saudi Arabia”.
Acknowledgments
“This research work was funded by Institutional Fund Project under grant no. (IFPIP: 1698-155-1443) The authors gratefully acknowledge technical and financial support provided by the Ministry of Education and King Abdulaziz University, DSR, Jeddah, Saudi Arabia”.
Declaration of competing interest
The authors declare that they have no known competing financial interests or personal relationships that could have appeared to influence the work reported in this paper.
References
- Groundwater Potential Mapping Using GIS, Linear Weighted Combination Techniques and Geochemical Processes Identification, West of the Qena Area, Upper Egypt. J. Taibah Univ. Sci.. 2020;14:1350-1362.
- [Google Scholar]
- Investigation of hydrochemical characteristics of groundwater in the Harzandat aquifer, Northwest of Iran. Environ Monit Assess. 2010;176:183-195.
- [Google Scholar]
- Assessment of shallow groundwater aquifer in an arid environment, Western Saudi Arabia. Journal of African Earth Sciences. 2023;200
- [CrossRef] [Google Scholar]
- Use of Hyperspectral Reflectance and Water Quality Indices to Assess Groundwater Quality for Drinking in Arid Regions, Saudi Arabia. Water. 2022;14:2311.
- [Google Scholar]
- Hydrogeology and hydrochemistry of a shallow alluvial aquifer, western Saudi Arabia. Hydrogeology Journal. 2008;16:155-165.
- [Google Scholar]
- American Society for Testing and Materials (ASTM). “Water and Environmental technology”. Annual book of ASTM. Standards, U.S.A. Sec. 11, 2002,Vol. 11.01, and 11.02, West Conshohocken.
- Ayers, R., Westcot, D. 1994. Water Quality for Agriculture; FAO Irrigation and Drainage Paper 29 Rev. 1; Food and Agriculture Organization of the United Nations, Rome, Italy.
- Chloride mass balance method for estimating groundwater recharge in arid areas: examples from western Saudi Arabia. Journal of Hydrology. 1996;186:153-159.
- [Google Scholar]
- Groundwater Potential Zone Delineation Using GIS and Remote Sensing Techniques in Sululta and Surrounding Watershed. Ethiopia. Int. J. Sci. Res. Eng. Dev.. 2021;4:263-286.
- [Google Scholar]
- Evaluation of groundwater quality in the Cihanbeyli basin, Konya. Central Anatolia. Turk Environ Earth Sci. 2013;69:921-937.
- [Google Scholar]
- Bujnovský, R., Koco, Š., Cibulka, R., Vranovská, A., Vrablíková, D. 2022. Nitrate Concentration in Leachate—Essential Information for Reducing Nitrogen Surplus and Groundwater Pollution from Agricultural Land in Slovakia. Agriculture 12, 493. https://doi.org/10.3390/agriculture 12040493.
- Potential Possibilities of Using Groundwater for Crop Irrigation in the Context of Climate Change. Agriculture. 2022;12:739.
- [CrossRef] [Google Scholar]
- Quality of groundwater for irrigation in tropical karst environment: the case of Yucata’n. Mexico. Agric Water Management. 2010;97:1423-1433.
- [Google Scholar]
- Doneen, L.D. 1964. Notes on Water Quality in Agriculture; Published as a Water Science and Engineering, Paper 4001; Department of Water Science and Engineering, University of California: Oakland, CA, USA.
- Groundwater recharge history and hydrogeochemical evolution in the Minqin basin, North West China. Applied Geochemistry. 2006;21:2148-2170.
- [Google Scholar]
- Hydrogeochemical characterization of groundwater aquifer in Al-Madinah Al-Munawarah City, Saudi Arabia. Arabian Journal of Geosciences. 2014;8:4191-4206.
- [CrossRef] [Google Scholar]
- El Maghraby, M.M.S., Abu El Nasr, A.Kh.O., Hamouda, M.S.A. 2013. Quality assessment of groundwater at south Al Madinah Al Munawarah area, Saudi Arabia. Environ Earth Sci, 70, 1525–1538. doi 10.1007/s12665-013-2239-9.
- Relationships between Hydraulic Parameters of the Nubian Aquifer and Wells in El Shab Area, South Western Desert, Egypt (A Case Study) International Journal of Geosciences 2012
- [Google Scholar]
- El Osta, M., Masoud, M., Ezzeldin, H. 2020. Assessment of the geochemical evolution of groundwater quality near the El Kharga Oasis, Egypt using NETPATH and water quality indices. Environmental Earth Sciences 79(2). doi: 10.1007/s12665-019-8793-z.
- Groundwater Suitability for Drinking and Irrigation Using Water Quality Indices and Multivariate Modeling in Makkah Al-Mukarramah Province. Saudi Arabia. Water. 2022;14:483.
- [CrossRef] [Google Scholar]
- Groundwater evolution and vulnerability in semi-arid regions using modeling and GIS tools for sustainable development: case study of Wadi Fatimah. Saudi Arabia. Environ Earth Sci. 2022;81:248.
- [CrossRef] [Google Scholar]
- The quality assessment of pollution of Rosetta branch, Nile River. Egypt. Arab J Geosci. 2017;10:97.
- [CrossRef] [Google Scholar]
- Groundwater management of quaternary aquifer of the Nile Valley under different recharge and discharge scenarios: A case study Assiut governorate. Egypt Ain Shams Eng J. 2021;12:2563-2574.
- [CrossRef] [Google Scholar]
- Food and Agriculture Organization (FAO). The state of food and agriculture. Rome, Italy, 1994, pages #125.
- Fishman, J., and Friedman, C. 1985. Methods for determination of inorganic substances in water and fluvial sediments. U.S. Geol. Surv. Book 5, Chapter A1. Open File Report, 1985, 85-495, Denver, Colorado, U.S.A. (84).
- Geochemical controlling mechanisms and quality of the groundwater resources in El Fayoum Depression, Egypt. Arab J Geosci. 2020;13:861.
- [Google Scholar]
- Processing and synthesis of hydrogeological data. Abacus Press; 1979. p. :390.
- Hydrochemical and quality assessment of irrigation water at the trans-himalayan high-altitude regions of Leh, Ladakh, India. Appl Water Sci. 2022;12:197.
- [CrossRef] [Google Scholar]
- Towards sustainable groundwater use: setting long-term goals, back casting, and managing adaptively. Ground Water. 2012;50(1):19-26.
- [Google Scholar]
- Sustainable groundwater development. In: Geological Society. London: Special Publications; 2002. p. :1-14.
- [Google Scholar]
- Flow of groundwater in engineering hydraulic. New York: John. Wiley and Sons; 1950. p. :321-386.
- Evaluation of groundwater resources for drinking and agricultural purposes, Abar Al Mashi area, south Al Madinah Al Munawarah City, Saudi Arabia. Arab. J. Geosci.. 2013;6:3929-3942.
- [Google Scholar]
- Kruseman, G.P. de Ridder, N.A. 1990. “Analysis and evaluation of pumping test data”. Inter. Instit. For Land Recl. Improv, (ILRI) Second Edition, Netherlands, 337p.
- Assessment of groundwater quality for irrigation purposes and identification of hydrogeochemical evolution mechanisms in Pengyang County, China. Environ Earth Sci. 2013;69:2211-2225.
- [Google Scholar]
- Groundwater Resources Management of the Shallow Groundwater Aquifer in the Desert Fringes of El Beheira Governorate, Egypt. Earth Systems and Environment. 2020;4:147-165.
- [CrossRef] [Google Scholar]
- Delineation of Groundwater Potential Zones in KwaZulu-Natal, South Africa Using Remote Sensing, GIS and AHP. Journal of African Earth Sciences. 2022;193:104571
- [Google Scholar]
- Pellaton, C. 1981. Explanatory noted to the geologic map of the AlMadinah Quadrangl. Sheet 24D, Kingdom of Saudi Arabia, Geologic Map GM-52C, DGMR, Government of the Kingdom of Saudi Arabia.
- A graphical procedure in the geochemical interpretation of water analysis. American Geophysical Union Transaction. 1944;25:914-928.
- [Google Scholar]
- Raghunath, H.M. 1987. Groundwater. Wiley Eastern Ltd., Delhi, 563.
- Methods for collection and analysis of water samples. U.S. Geol. Surv. Water supply 1960:301.
- [Google Scholar]
- Richards, L.A. 1954. Diagnosis and Improvement of Saline and Alkali Soils [Handbook]. Soil Science; United States Department of Agriculture: Washington, DC, USA, 78p.
- Rorabaugh, M.J. 1953. “Graphical and theoretical analysis of step drawdown test of artesian well”. Proc. Amer. Soc. Civil Engrs., 79.
- Estimating Hydraulic Properties of Volcanic Aquifers Using Constant-Rate and Variable-Rate Aquifer Tests. Journal of the American Water Resources Association 2007
- [Google Scholar]
- Impact of Drought and Groundwater Quality on Agriculture in a Semi-Arid Zone of Mexico. Agriculture. 2022;12:1379.
- [CrossRef] [Google Scholar]
- Schaible, G.D. 1999. The Edwards Aquifer water resource conflict: USDA farm program resource-use incentives. Water Resource Res 35, 3171-3183 United Nations Development Program Report (2001) World Resources.
- An Integration of Geospatial Modelling and Machine Learning Techniques for Mapping Groundwater Potential Zones in Nelson Mandela Bay, South Africa. Water. 2023;15(19):3447.
- [CrossRef] [Google Scholar]
- Effects of Shallow Groundwater Depth and Nitrogen Application Level on Soil Water and Nitrate Content, Growth and Yield of Winter Wheat. Agriculture. 2022;12:311.
- [CrossRef] [Google Scholar]
- Buffer area versus whole catchment approaches to studying land-use impact on river water quality. Water Research. 2001;35:3462-3472.
- [Google Scholar]
- Integrated assessment of groundwater infuenced by a confluence river system: concurrence with remote sensing and geochemical modelling. Water Resources Management. 2013;27:4291-4313.
- [CrossRef] [Google Scholar]
- Hydrochemical characterization and quality appraisal of groundwater from Pungar sub basin, Tamilnadu, India. J King Saud Univ Sci. 2014;26:37-52.
- [CrossRef] [Google Scholar]
- Environmental studies on river water quality with reference to suitability for agricultural purposes: Mahanadi river estuarine system, India—a case study. Environmental Monitoring and Assessment. 2009;155:227-243.
- [CrossRef] [Google Scholar]
- Groundwater quality and hydrogeochemical properties of Torbali region, Izmir. Turkey. Environ Monit Assess. 2008;146:157-169.
- [Google Scholar]
- Groundwater hydrology (3rd edn.). John Wiley and Sons; 2005. Inc.
- Results of pumping tests in the Deccan Trap Basalts of Central India. Journal of Hydrology. 1986;86:14-168.
- [Google Scholar]
- United Nations. 2012. World Population Prospects: 2012 Revision Population Database online. http://www.un.org/esa/population/unpop.htm, [Accessed on 19th July 2013].
- United States Environmental Protection Agency (USEPA). Quality criteria for water (Gold Book). 1986, EPA, USA. https://www.epa.gov/sites/production/fles/2018-10/documents/quality-criteria-water-1986. Pdf.
- US Salinity Laboratory Staff (USSL). 1954. Diagnosis and improvement of saline and alkali soils. US Department of Agricultural Hand Book 60, p. 160.
- World Health Organization (WHO). 2008. Guidelines for drinking-water quality, 3rd edn. Incorporating the first and second addenda V 1 recommendations, p. 668 (electronic resource).


