

Translate this page into:
Electroflocculation of indigo dyeing wastewater from industrial production: Flocs growth and adsorption mechanism
⁎Corresponding author at: College of Textile and Garments, Hebei University of Science and Technology, NO.26 Yuxiang Street, Yuhua District, Shijiazhuang 050018, China. weizhang2999@163.com (Wei Zhang) weizhang@hebust.edu.cn (Wei Zhang)
-
Received: ,
Accepted: ,
This article was originally published by Elsevier and was migrated to Scientific Scholar after the change of Publisher.
Peer review under responsibility of King Saud University.
Abstract
During the electrocoagulation of indigo wastewater, the growth and morphology of flocs are greatly affected by the electrolytic time, with flocs morphology directly related to the adsorption of indigo dye. Therefore, understanding the morphology, structure and growth of flocs is important for the effective treatment of indigo dyeing wastewater. In this study, we investigated the relationship between flocs morphology and indigo dye adsorption capacity using aluminum as anode, graphite as cathode and a plate spacing of 3 cm at 180 r/min stirring and 240 mA constant current as the basic parameters for electrocoagulation. Microscopically, the floc morphology was characterized by fractal dimension and average particle size. Next, we assessed the kinetics and thermodynamics of the adsorption process. The results showed that floc growth could aggregate, fragmentate and recombine with an increase in electrolysis time. When the flocs grew and aggregated to the maximum particle size, they were loose in shape and large in size, which was most conducive to the adsorption of indigo dye. According to the results of kinetics and thermodynamics, flocs adsorped indigo dye via a monolayer physical adsorption process, with Van Der Waals force as its binding force. Due to the weak adsorption power, the dye dissolved again when the flocs were broken, suggesting that the growth of flocs should be controlled before the crushing stage during the electrocoagulation process of indigo dyeing wastewater.
Keywords
Electrocoagulation treatment
Industrial indigo wastewater
Floc growth process
Changes in floc morphology
Adsorption kinetics
Thermodynamics

1 Introduction
Indigo is a major dye used for the warp dyeing of denim fabrics (Avinash et al., 2023). In actual production plants, 3 ∼ 12 g of indigo dye is used to dye one pair of jeans, which was provided by the plant in China. However, since the utilization rate of the indigo dye is only 80 %, a considerable amount of dye is left in the dyeing wastewater (Julia et al., 2022). In addition, excessive amounts of reducing agents under alkaline conditions are also used in the dyeing process, rendering the indigo dyeing wastewater not only dark in color but also characterized by high alkalinity and chemical oxygen demand with complex composition (Huangfu et al., 2021). Further, indigo is difficult to biodegrade due to its complex aromatic molecular structure and high stability (Nguyen and Juang 2013), and the use of chemical flocculation in dyeing plants to treat indigo dyeing wastewater has led to issues such as high chemicals dosage, flocculation rate and several difficult-to-be-controlled effects, urging the need for newer alternative processes.
As one of the most promising water treatment processes, electrocoagulation is widely used in the treatment of automotive paint wastewater, textile printing and dyeing wastewater and laundry wastewater (Mohtashami and Shang 2019; Naje et al., 2017; Cestarolli et al., 2019; Dimoglo et al., 2019). During electrocoagulation, the metal ions produced by electrolysis are good coagulants that hydrolyze near the anode to form a series of reactive intermediates (Shahedi et al., 2020), destabilizing the dispersed particles in the wastewater and causing the unstable particles to aggregate and form flocs (Bener et al., 2019). At the same time, the bubbles generated by the cathode make the flocs float up and can be removed from the wastewater (Kamel et al., 2018). Compared to chemical flocculation, the advantages of electrocoagulation include no additional need for flocculants, good decolorization, less sludge production, etc. (Aljaberi et al., 2022; Kumar et al., 2003; Nidheesh et al., 2021; Singh et al., 2021).
Up to now, most studies on the treatment of textile printing and dyeing wastewater by electrocoagulation technology have focused on optimizing different wastewater types. Özyonar et al. (Özyonar et al., 2022) evaluated dye decolorization at current densities between 50 ∼ 100 A/m2 and achieved 97 % decolorization when the current density exceeded 50 A/m2, and found that the high current densities increased anode losses and electrical energy consumption. Merzouk et al. (Merzouk et al., 2011) reported that the initial pH affected not only the types of metal hydrolysis products but also the cathodic hydrogen bubble size. The generation of minimal bubbles from hydrogen bubbles near the neutral pH favors particle aggregation and air flotation. Khorram et al. (Khorram et al., 2018) showed that the optimal decolorization time for electrocoagulation was about 20 min, and similar to the initial pH, the electrolysis time also impacted the yield and morphology of flocs. Hendaoui et al. (Hendaoui et al., 2021) optimized the parameters of electrocoagulation using the response surface method and revealed that the decolorization rate after treatment was 93.97 % at a dye concentration of 60 mg/L, pH of 7.5, voltage of 47 V and an inlet flow rate of 2 L/min. Zhang et al. (Zhang et al., 2023) constructed a coupled system of peroxi-alternating current (AC) electrocoagulation, which enhanced the floc adsorption capacity and the COD removal rate, as well as less energy consumption and uniform corrosion of the electrode.
The adsorption performance of flocs determines the flocculation efficiency (Liu et al., 2021). Their size, shape, structure and other morphological characteristics also play an important role in transporting and removing impurity particles from water. The types of hydrolysis products and floc morphology during electrocoagulation vary depending on water quality and operating conditions (Nasrullah et al., 2020), and optimizing the operating conditions could improve the flocs’ structure. Harif et al. (Harif et al., 2012) compared the effects of electrocoagulation and chemical flocculation on the structural change and growth of flocs and found that flocs formed by electrocoagulation had a porous structure that could be easily broken. A pH of 6.5 was found to be favorable for the recombination of crushed floc. Lee et al. (Lee et al., 2016) studied floc growth and structural changes using salt water for electrocoagulation and showed that high current density caused floc growth to reach a stable state faster by promoting anode dissolution to produce more flocs but did not affect structural progress.
In this study, we investigated the influence of floc morphology on indigo adsorption by analyzing the structural changes of flocs with time in actual indigo-dyeing wastewater using fixed parameters such as electrode material, current density, plate spacing and initial pH value. General-purpose microscopy was used to observe and record the floc growth process. Zeta potential changes were monitored using a Zeta potential meter, and fractal dimension and mean particle size were used to characterize the changes in floc structure. Further, X-ray Diffraction (XRD) and Energy Dispersive Spectrometer-mapping (EDS-mapping) analyses of floc sediments were performed to clarify the relationship between floc morphological characteristics and indigo dye removal during electrocoagulation. Kinetic and thermodynamic studies were also conducted to explore the adsorption characteristics of flocs on indigo dye and the underlying adsorption mechanism to provide a theoretical basis and technical reference for the electrocoagulation process of indigo dyes.
2 Materials and methods
2.1 Materials
Samples of indigo dyeing wastewater were obtained from Xindadong Textile Co., located in Hebei, China. All aluminum plates and graphite plates (40 mm × 40 mm × 1 mm) were purchased from Shanghai Chuxi Industrial Co., Ltd (China). In addition, hydrochloric acid (HCl, AR), sodium hydroxide (NaOH, AR) and sulfuric acid (H2SO4, AR) were provided by Tianjin Zhengcheng Chemical Co., Ltd (China).
2.2 Experimental methods
Here, we used an electrode combination of aluminum as the anode and graphite as the cathode. The electrolysis cell (Cylindrical, 75 mm in diameter and height) was filled with 250 mL of wastewater, and the initial pH was adjusted to 7. The electrodes were inserted into the wastewater, parallel with the distance between electrode plates fixed at 3 cm. The electrocoagulation reaction was performed at a stirring speed of 180 r/min using a 240 mA current with a DC power supply (RXN-1503, Zhaoxin Electronics Co., Ltd., China). Based on the preliminary study, other experimental parameters were selected here according to this reference (Zhang et al., 2023).
Due to the high chromaticity of the raw wastewater, it was diluted by a factor of 2 to examine the effects of electrolysis time on dye removal and floc growth. To assess the effects of the initial dye concentration, the raw wastewater was diluted to 1, 1.2, 1.5, 2 and 3 times and the reaction was conducted for 30 min. To examine the impact of temperature on the adsorption effects, the reactions were conducted at 25, 30, 35, 40 and 45℃ for 30 min, focusing on the changes in dye removal rate at 25, 35 and 45℃ (298, 308 and 318 K) for 30 min.
2.3 Testing and characterization
Standard curve of indigo dyeing wastewater
The content of indigo dye in raw wastewater was calculated using the HG/T 2750–2012 “Indigo” determination method. The absorbance of wastewater with different dye concentrations (raw wastewater diluted 10, 20, 30, 40 and 50 times) was measured using a UV–visible spectrophotometer (JH756, Shanghai Jinhua Technology Co., Ltd., China) at the maximum absorption wavelength of 670 nm of indigo dyeing wastewater. Fig. 1 shows the dye concentration-absorbance standard curve of indigo dyeing wastewater.
Removal rate of indigo dye
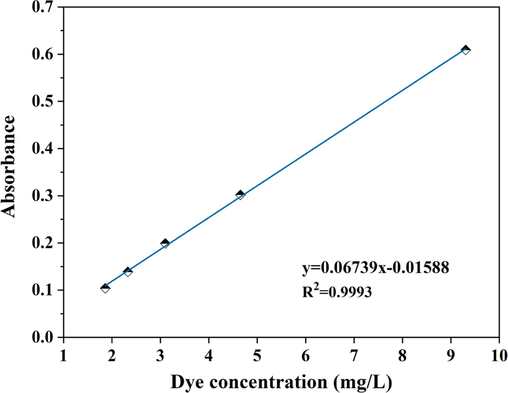
- Standard curve of dye concentration and absorbance.
The absorbance of the supernatant of the wastewater before and after treatment was measured using a UV–visible spectrophotometer, the dye concentration was calculated according to the standard curve of indigo dyeing wastewater, and the dye removal rate was calculated according to the following formula.
Here, C0 represents the initial concentration of indigo wastewater dye, mg/L and C1 indicates the concentration of indigo dye in the supernatant after the reaction, mg/L.
Microscopic observation of flocs
A plastic dropper with a larger diameter (to avoid damaging the structure of larger flocs) was used. An appropriate amount of solution containing flocs was taken from the wastewater system and dropped onto the center of the glass slide. The morphological structure of flocs was observed under an optical microscope (XP-202E, Shanghai Bimu Instruments Co., Ltd, China), magnified 100 times. The images were processed using the Image-Pro Plus image processing software to calculate the average particle size and fractal dimension of the flocs (Liu et al., 2021).
Determination of Zeta potential
Five sets of samples were taken immediately at different locations in the 3 cm plane below the liquid surface after the electrocoagulation reaction, and their average Zeta potential was measured using a microelectrophoresis instrument (JS94K, Shanghai Zhongchen Digital Technology Equipment Co., Ltd.).
Average particle size of flocs
Due to the irregularity of the floc morphology, 15 positions were observed for each sample for statistical analysis. Equivalent circles of equal-area flocs obtained by two-dimensional planar projection were used to directly represent the average particle size of individual flocs, which was calculated as follows.
Fractal dimension of flocs
The fractal dimension Df of the floc was calculated based on the relationship between the projected area A and the perimeter P of the floc, as shown in Equation (3). The slope of the two-dimensional fractal dimension of the flocs was obtained according to the double logarithm of the projected area and perimeter.
Floc settling process
At the end of the reaction, the solution was transferred from the electrolysis cell to a 100 mL measuring cylinder and allowed to stand for 15 min. The settling process of the flocs was recorded by photographing.
Analysis of sediments
The sediments formed by electrolysis at different times were measured using an X-Ray Diffraction (XRD, D/MAX-2500, Rigaku, Japan) to obtain information on the composition and relative content of the flocculent sediments. The sediment’s elements, such as C, O, S and Al, were measured using Bruker energy spectrometer (EDS-mapping, QUANTAX, Beijing Bruker Technology Co., Ltd., China) to show the distribution status of the sediment elements and the main adsorbed substances.
3 Results and discussion
3.1 Effect of electrolysis time on the removal rate of indigo dye
It was reported that electrolysis time affects the dye removal effect by influencing the floc yield (Asfaha et al., 2022). Other conditions were set to the same, and we conducted multiple sets of experiments with different electrolysis times to study the effect of electrolysis time on dye removal. As shown in Fig. 2, our results showed that within 30 min of electrolysis, the dye removal rate increased significantly with increasing electrolysis time and reached maximum (95.28 %) at 30 min. Although extending the electrolysis time to 50 min showed a decrease in the dye removal rate, a continuous increase in electrolysis time re-increased the dye removal rate. The floc yield increased with the increase of electrolysis time, while the dye removal rate decreased and then increased, indicating that the change in floc morphology during the electrocoagulation process also had a certain degree of influence on the removal rate.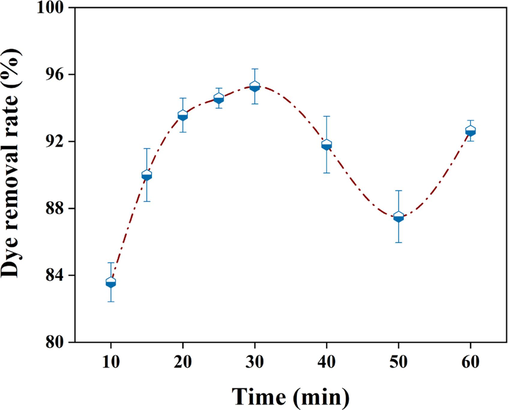
Effects of electrolysis time on dye removal rate.
3.2 Growth process of flocs
To understand the changes in floc morphology during electrocoagulation, they were observed microscopically at different reaction times (Fig. 3). Based on the observed results, the floc growth process could be divided into three stages: aggregate growth, fragmentation, and reorganization (Nasrullah et al., 2020). In the first 30 min of the reaction, with the prolongation of electrolysis time, the flocs were continuously adsorbed and aggregated to form larger and more irregular flocs. Following 30 ∼ 50 min of electrolysis, the flocs were broken, their size was abruptly reduced, the floc branches were also reduced, and the flocs became more regular. When the electrolysis time exceeded 50 min, the flocs gathered together to form newer and larger-sized flocs. The pollutant removal was better with larger floc sizes (Chen et al., 2020). The electrocoagulation reaction time was controlled at about 30 min to obtain a higher dye removal rate.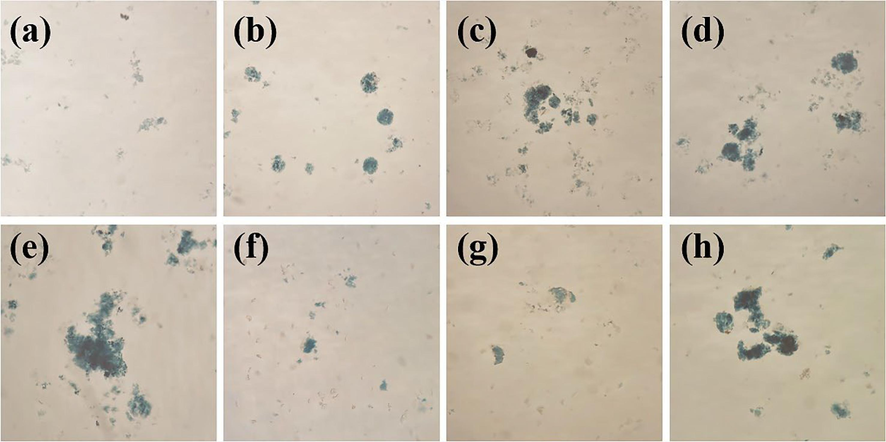
Flocs growth process: (a) 10 min; (b) 15 min; (c) 20 min; (d) 25 min; (e) 30 min; (f) 40 min; (g) 50 min; and (h) 60 min.
3.3 Zeta potential and floc morphology at different electrolysis times
Flocculation is a complex physicochemical process that can be broadly classified into the following four aspects: compressed double layer, charge neutralization, adsorption bridging, and net-trap sweeping (Wang et al., 2002). The formation of bridges between suspended particles by the electrostatic attraction of flocculant or coagulant polymers helps agglomerate the particles into larger flocs. On the other hand, net-trap sweeping involves capturing smaller particles within the growing floc structure, effectively removing them from the wastewater (Wang et al., 2020). During the electroflocculation, the negative of Zeta potential indicates the flocculation mainly depends on charge neutralization; the closer the zeta potential is to 0, the more favorable it is for the coagulation of floc particles and the higher the flocculation efficiency (López-Maldonado et al., 2014). The effect of electrolysis time on the absolute value of Zeta potential in Fig. 4 shows that the Zeta potential of the solution continuously tended to become closer to zero as the electrolysis time increased, indicating that the initial stage of the reaction relied mainly on charge neutralization for flocculation. After an electrolysis time of > 25 min, the Zeta potential changed little and fluctuated between −10 ∼ -15 mV. At this point, a large number of flocs were observed in the solution, and the flocculation in the system mainly relied on adsorption bridging and net-trap sweeping.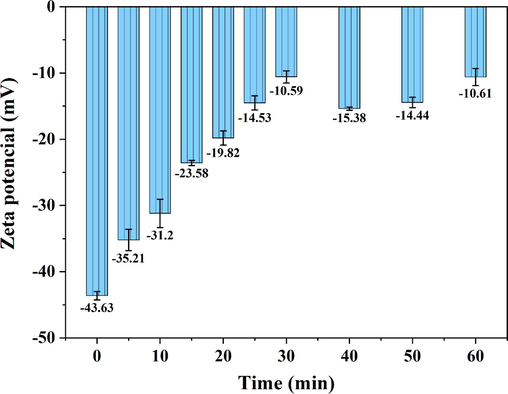
Effects of electrolysis time on the absolute value of Zeta potential.
A larger fractal dimension of flocs usually indicates a more compact floc structure and vice versa (Lee et al., 2016). Fig. 5 illustrates the effects of electrolysis time on the fractal dimension of flocs. In the initial 15 min, the fractal dimension of the flocs was larger because the electric neutralization occurred mainly at the beginning of the reaction, indicating that the flocs were smaller in size and denser in structure at this time. As the electrolysis time increased, the system mainly underwent adsorption bridging and webbing sweeping. When the morphological irregularity of the floc increased and the structure became looser, a gradual decrease in fractal dimension was observed. At 30 ∼ 50 min, the flocs were broken, the overall structure was more compact than before, and the fractal dimension tended to increase. At 60 min, the fractal dimension of the flocs was larger than at 30 min because the structure of the broken flocs was denser and less branched than before. In addition, Fig. 5 also shows the effects of electrolysis time on the average floc size, which showed an opposite trend to the fractal dimension. In the initial stage of the electrocoagulation reaction, the charge neutralization destabilized the system, and the metal hydrolysis salts generated by electrolysis collided with the pollutants to rapidly form flocs; thus, the floc size increased significantly in the first 30 min, and the average floc size was larger. When the reaction time exceeded 30 min, the floc structure was looser, and under the condition of external agitation, the water shear destroyed the floc, causing the flocs to break and decrease in size rapidly (Yu et al., 2022). When the reaction continued, the new flocs would take the broken flocs as the nuclei, which increased the average size of the flocs again at 50 ∼ 60 min.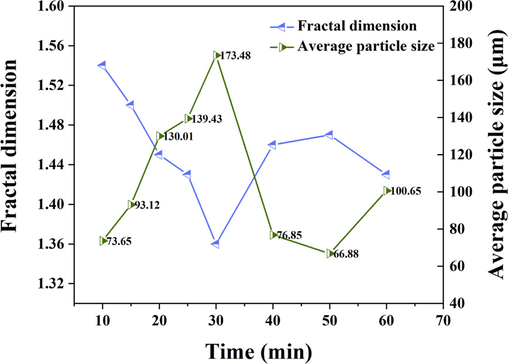
Effect of electrolysis time on the fractal dimension and average particle size of flocs.
3.4 Analysis of floc settling process and sediments
The floc structure also affected the floc settling process. Fig. 6 shows the flocs for settling of 15 min after different electrolysis times. At the beginning of the reaction, due to the small particle size of the flocs, some flocs floated on the surface of the solution with the gas generated by the system.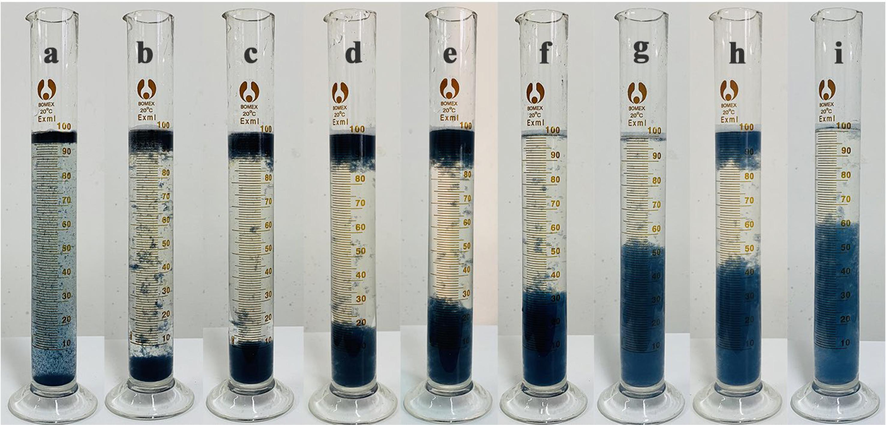
Effects of floc settling at different electrolysis times: (a) 5 min (b) 10 min; (c) 15 min; (d) 20 min; (e) 25 min; (f) 30 min; (g) 40 min; (h) 50 min; and (i) 60 min.
The particle size of the flocs increased continuously with the reaction, and at 30 ∼ 40 min of electrolysis, the flocs were in a precipitated state after settling (Fig. 6(f), 6(g)). At 50 min of electrolysis, the system was in the floc fragmentation stage, whereby the particle size was small, with some of the flocs floating under the action of air. After extending the electrolysis time to 60 min, the flocs underwent reorganization, the particle size increased again, and all precipitated after settling. It was also noticed that the flocs produced by electrolysis at 30 min or less were darker in color than those produced by electrolysis at 40 ∼ 60 min, possibly related to the adsorption of the broken flocs by the newly generated flocs when they reorganized.
Based on the above experiments and obtained results, it was clear that there was a strong correlation between floc morphology and electrolysis time. Fig. 7 illustrates the XRD spectra of floc sediments at different electrolysis times and shows that the diffraction peak positions and morphologies of the floc sediments formed under different times did not differ significantly, indicating that the structures of the formed substances were similar. Compared with the identified standard spectra, the flocs were aluminum-based oxides, but the intensity of the diffraction peaks varied considerably between the flocs at different electrolysis times.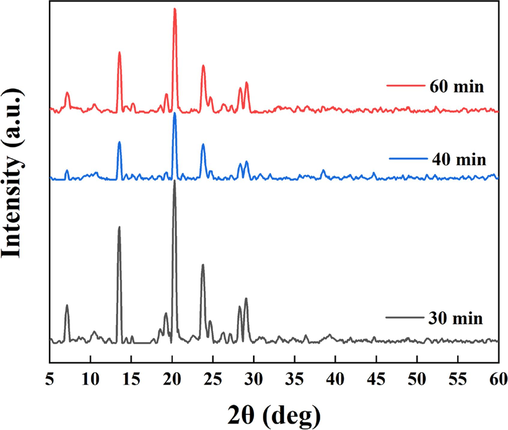
XRD spectra of sediments at different electrolysis times.
A stronger diffraction peak intensity of the same substance is associated with better crystallinity, suggesting a better selective orientation (Doumeng et al., 2021). We found that the crystallinity of the floc sediments formed by electrolysis at 30 min was better, decreased during the floc fragmentation phase and increased again after reorganization.
XRD analysis further confirmed that electrolysis at 30 min was more beneficial for floc generation. Combined with the EDS-mapping results in Fig. 8 at 40 min and 60 min, the floc particle size formed after 30 min electrolysis was larger and contained more C-element (purple color), indicating greater adsorption of indigo dye. In contrast, at 40 min of electrolysis, there was a significant decrease in the C- element, which could be due to a drop in adsorption capacity as a result of floc fragmentation and size reduction. After fragmentation and reorganization, the floc size increased again, the adsorption effect was enhanced, and the amount of dye adsorbed increased (Fig. 8).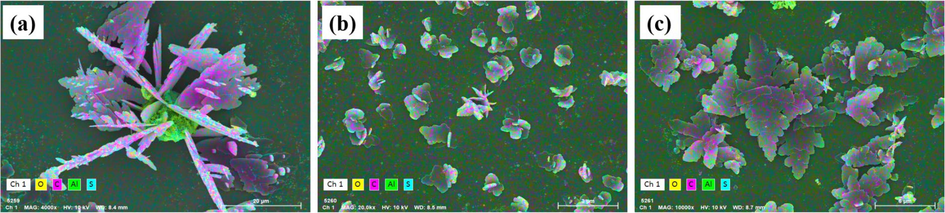
EDS-Mapping plots of sediments at different electrolysis times: (a) 30 min; (b) 40 min; and (c) 60 min.
3.5 Effects of initial concentration on dye removal rate
The effects of the initial dye concentration on the removal effects of indigo were investigated by diluting the wastewater at different multiples for an electrolysis time of 30 min (Fig. 9). When the initial dye concentration in the wastewater was lower than 60 mg/L, the dye removal rate was maintained at about 95 %, indicating that when the number of flocs produced by the electrocoagulation reaction was certain, it could create an effective adsorption effect to remove dyes from the wastewater. When the initial concentration of the wastewater continued to increase, the dye removal rate began to decrease, and the dye removal rate was only 75.29 % under the original wastewater conditions, suggesting that the initial dye concentration of the wastewater was too high for the removal of dyes. The amount of flocs produced by the electric device within a certain period of time is limited, which is determined by the theoretical Faraday efficiency of the electric unit. Additionally, there is also an upper limit to the adsorption capacity of the flocs (Markus et al., 2020). When the initial concentration of wastewater is too high, the amount of flocs generated during the experiment is insufficient to adsorb all pollutants, resulting in a lower removal rate of pollutants.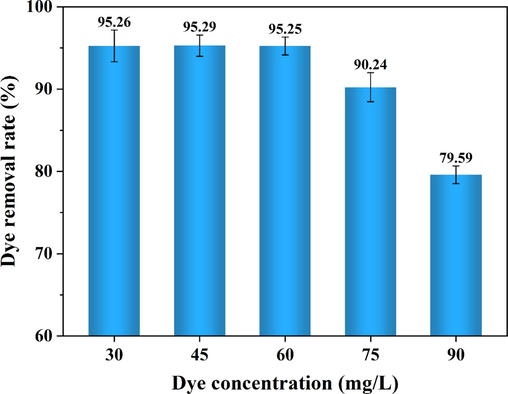
Effects of initial concentration on dye removal rate.
3.6 Effect of reaction temperature on dye removal rate
Fig. 10 shows the effect of reaction temperature on the removal rate of indigo dye. When the reaction temperature was increased from 25℃ to 45℃, the removal rate of indigo dye decreased from 95.28 % to 94.62 %, indicating that an increase in temperature was not favorable to dye removal. The removal rates of dyes were further determined at an electrolysis time of 30 min at 25, 35 and 45℃, as shown in Fig. 11. Within 15 min of electrolysis, the increase in temperature was favorable to the dye removal, possibly because charge neutralization mainly occurred in the early stage of the reaction, and the increase in temperature accelerated the thermal movement of particles in the system and increased the chance of collision between pollutants and flocs removal rate. When the reaction proceeded for 15 ∼ 30 min, the dye removal rate decreased slightly with the increase in temperature. At this time, there were more flocs in the system, and the structure was relatively loose. At higher temperatures, the shearing effect of the thermal movement of water molecules destroyed the net-catching and sweeping action, which broken the flocs and resulted in the suspension of microflocs.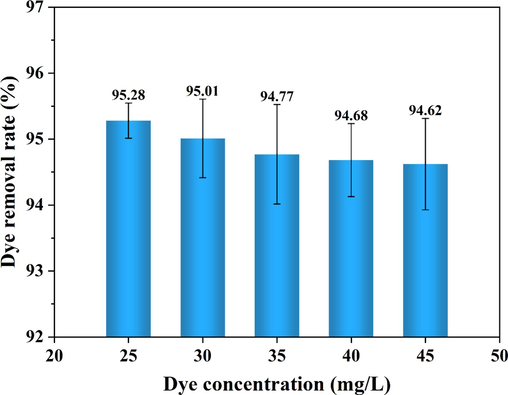
Effects of reaction temperature on dye removal rate.
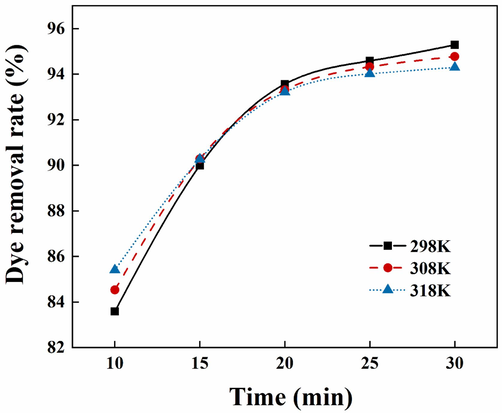
Adsorption curves at different reaction temperatures.
3.7 Kinetic process of indigo dye removal by electrocoagulation
To further reveal the mechanism of dye adsorption by flocs and investigate the kinetic properties of indigo dye adsorption by flocs, three classical kinetic models, first-order, second-order and quasi-first-order, were used to simulate the changes in dye removal at different initial dye concentrations using equations (4) to (6) (Singh et al., 2017; Gong et al., 2022).
First-order kinetic model:
Second-order kinetic model:
Quasi-first-order kinetic model:
Where, Ct represents the dye concentration at time t of electrocoagulation, measured in mg/L; C0 indicates the initial dye concentration, measured in mg/L; t is the reaction time, measured in min; k1 is the first-order rate constant, measured in min−1; k2 is the second-order rate constant, measured in mg·L-1·min−1; kp is the apparent quasi-first-order rate constant, measured in min−1; and Ce is the dye concentration at equilibrium, measured in mg/L.
The first-order kinetic model suggests that there is a surface reaction, where the adsorption process is only related to the adsorbent concentration and is limited by the diffusion rate of the adsorbed substance into the adsorbent. The second-order kinetic model indicates that chemical adsorption is a rate limiting step in the adsorption process. The quasi-first-order kinetic model is similar to the first-order kinetic model, and its rate equation is generally applicable to situations where the concentration of one reactant is much larger than that of another reactant, while indigo dye was the main substance in this experiment, and its concentration is much greater than other chemical substances (João. 2023; Lagoa et al., 2009; Ricardo et al., 2022). According to the fitted curves of the three kinetic models corresponding to different initial dye concentrations in Fig. 12 and the results of the fitted parameters of the kinetic equations in Table 1, we found that the quasi-first-order kinetic equations had the highest fit, and the fitted correlation coefficients R2 were all greater than 0.999 when the initial dye concentration was below 62.05 mg/L, and the accuracy of the fit increased as the concentration decreased. The quasi-first-order rate constant was the largest for the initial concentration of dye at 62.05 mg/L, indicating a faster adsorption rate and greatest dye adsorption efficiency under this condition. The above analysis showed that the adsorption behavior of flocs in indigo dyeing wastewater using aluminum as an anode was theoretically non-primary kinetic but could be equivalent to the kinetic behavior of primary reactions. In this experiment, the adsorption of indigo dyes mainly relied on flocs. Therefore, the transfer rate of indigo dyes from wastewater to flocs directly determined the overall adsorption rate, and the effect of wastewater concentration on the adsorption rate proved that diffusion rate was a limiting factor in the adsorption process.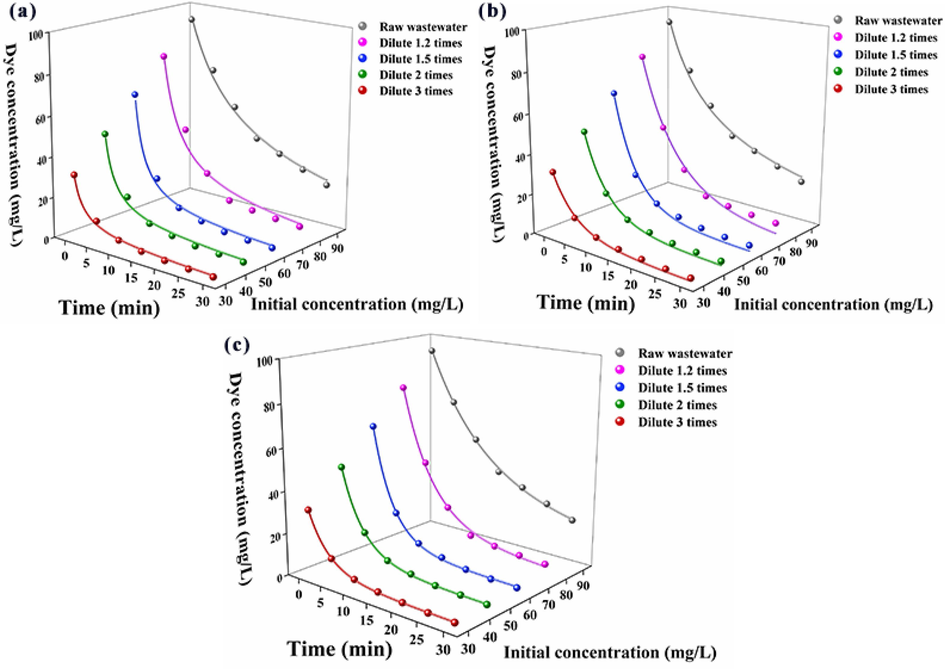
Three kinetic models for indigo dye removal by electrocoagulation: (a) first-order kinetic fitting curve; (b) second-order kinetic fitting curve; and (c) quasi-first-order kinetic fitting curve.
Initial concentration (mg/L)
First-order kinetic
Second-order kinetic
Quasi-first-order kinetic
k1
R2
k2
R2
Ce
kp
R2
31.03
0.1840
0.9894
0.0149
0.9906
1.62
0.2217
0.9998
46.54
0.1774
0.9906
0.0095
0.9876
2.34
0.2114
0.9998
62.05
0.1857
0.9878
0.0076
0.9922
3.41
0.2267
0.9994
77.57
0.1159
0.9864
0.0032
0.9740
5.63
0.1459
0.9973
93.08
0.0511
0.9879
0.0009
0.9913
15.93
0.0774
0.9986
3.8 Adsorption isotherms
The common isothermal adsorption models were of the Langmuir, Freundlich and Redlich-Peterson types. The Langmuir isothermal adsorption model usually assumes the adsorption of molecules on the adsorbent surface as a single molecular layer adsorption. The Freundlich type represents an empirical model where the adsorption constants are related to the surface coverage but have no practical significance. The Redlich-Peterson type was developed by combining the Langmuir adsorption model and the Freundlich adsorption model to explain the adsorption process between physical and chemical adsorption. It should be clear that these adsorption isothermal models were derived at equilibrium. The adsorption process of indigo dye by flocs was a dynamic process and it was difficult to reach a true equilibrium, therefore, in order to investigate the adsorption mechanism of indigo dye by flocs, the Langmuir, Freundlich and Redlich-Peterson equations were used to fit the experimental results. The three isothermal adsorption equations are shown in Equations (7) to (9) (Moneer et al., 2021; Yasmine et al., 2014; Wu et al., 2021).
Langmuir isothermal adsorption equation:
Freundlich isothermal adsorption equation:
Redlich-Peterson isothermal adsorption equation:
According to the fitted curves of the three isothermal adsorption equations in Fig. 13 and the results of the correlation coefficients in Table 2, the fits using the Langmuir, Freundlich and Redlich-Peterson isothermal adsorption models were 0.9073, 0.7691, and 0.9534, respectively. The fits using the Langmuir and Redlich-Peterson isothermal adsorption models were relatively good, while the Freundlich isothermal adsorption model was less well-fitted. Although the Redlich-Peterson isothermal adsorption model had the best fit, the value of β had already exceeded the range of values, suggesting that the equation had been transformed into the Langmuir equation. Therefore, the Langmuir isothermal adsorption model could more accurately describe the adsorption process of indigo dye by flocs, indicating that the adsorption of indigo by flocs was single molecular layer adsorption.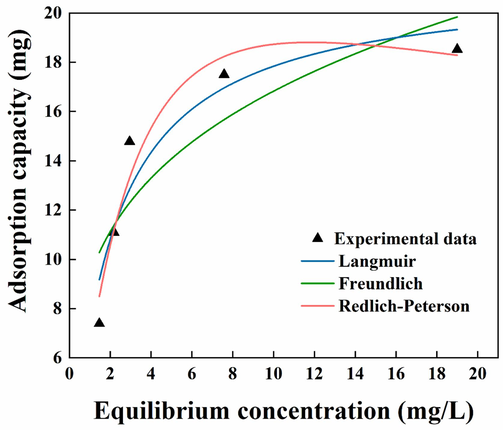
Fitting of adsorption isotherm.
Isothermal adsorption model
Constants
Langmuir
qm/(mg)
Ka/(L·mg−1)
R2
21.3074
0.5139
0.9073
Freundlich
KF/(mg·(L·mg -1)1/n)
1/n
R2
9.3085
0.25702
0.7691
Redlich-Peterson
KR/L
α/(L·mg−1) β
β
R2
7.1679
0.1467
1.2848
0.9534
3.9 Adsorption thermodynamics
Since the variation of temperature affects the adsorption process of indigo dye, we analyzed the thermodynamic parameters of adsorption (Gibbs free energy [ΔG0], enthalpy change [ΔH0]and entropy change [ΔS0)]) based on the equations shown below (Velyana et al., 2020; Şahin et al., 2022; Widodo et al., 2022):
The raw wastewater was diluted at different multiples to investigate the thermodynamic process of indigo dye adsorption by flocs. Based on the fitting results of Fig. 14 and the thermodynamic parameters of adsorption in Table 3, we found that the enthalpy change ΔH0 of adsorption during the reaction was negative, indicating that the adsorption process of indigo dye was exothermic and increasing the temperature was not conducive to the adsorption. This finding is consistent with the trend shown by the effect of temperature on dye removal in 3.6. The absolute value of ΔH0 was between 4 ∼ 10 kJ/mol, which indicated that the adsorption force between indigo dye and floc was van der Waals force. Both adsorption and desorption were present in the adsorption system, and ΔS0 was the sum of both (Hussain, et al., 2021). As the initial concentration of the dye increased, ΔS0 gradually decreased, indicating a gradual decrease in the disorder of the adsorption system. A larger absolute value of ΔG0 suggested a greater adsorption driving force (Jayakumar et al., 2021). The ΔG0 < 0 of the adsorption process proved that the adsorption of indigo dye by flocs was spontaneous. The absolute value of ΔG0 decreased with increasing temperature, confirming that warming was not favorable for the adsorption of indigo dye. ΔG0 was in the range of −20 ∼ 0 kJ/mol for physical adsorption and ranged between −400 and −80 kJ/mol for chemisorption (Politano et al., 2018). The ΔG0 ranged between −20 and 0 kJ/mol at the experimental temperature, suggesting that the process of indigo dye adsorption by flocs was physical adsorption.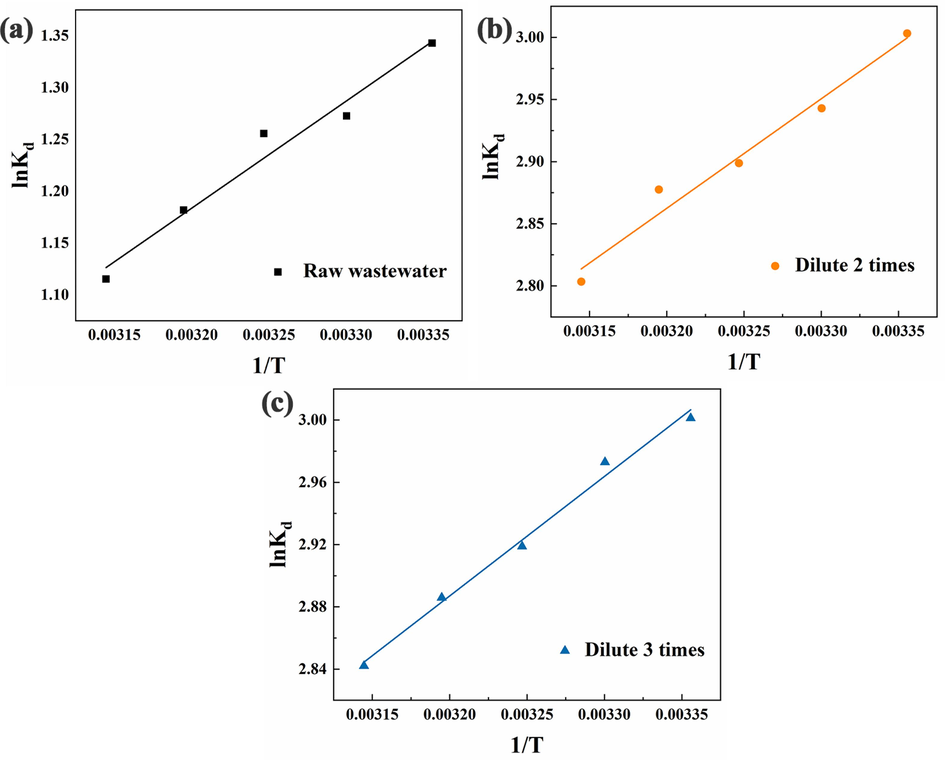
Plot of lnKd versus 1/T: (a) raw wastewater; (b) dilution 2 times; and (c) dilution 3 times.
Initial concentration (mg/L)
ΔH0/(kJ·mol−1)
ΔS0/(J·K−1·mol−1)
ΔG0/(kJ·mol−1)
R2
298 K
308 K
318 K
31.03
−6.3855
3.5696
−7.4357
−7.4261
−7.4027
0.9916
46.54
−7.3253
0.3570
−7.4406
−7.4226
−7.4116
0.9734
93.08
−8.5938
−17.6605
−3.3217
−3.2153
−2.9483
0.9700
4 Conclusion
We investigated the effects of floc structure on dye removal rate by observing the floc growth process in indigo dyeing wastewater treated with electrocoagulation. As the electrolysis time progressed, the flocs underwent the following processes: aggregation, adsorption, fragmentation, and reorganization. When the flocs reached their maximum average particle size, their structure was relatively loose, and the removal rate of indigo reached the maximum of 95.28 %. In addition, the flocs formed under such conditions had a higher density and tended to sink rather than float after the reaction. The kinetic and thermodynamic results showed that the adsorption of indigo dye by floc conformed to the quasi-first-order kinetics, and the adsorption rate was affected by diffusion. When the initial dye concentration was 62.05 mg/L, the adsorption rate and efficiency were the highest. The adsorption of indigo dye on the floc occurred through the physical adsorption of a monolayer, with van der Waals force as the binding force. Due to this weak adsorption, dye redissolution occurred when the flocs were broken and recombined. Therefore, controlling the flocs growth at the limit of the aggregation and adsorption stage could yield larger and looser flocs, which was beneficial for the flocculation effect. Theoretically, the relationship between the electrocoagulation effect of indigo dyeing wastewater and main parameters of the electrochemical process has been fully confirmed, which showed important guiding significance for promoting the industrial application of electrocoagulation technology in the field of dyeing wastewater.
Acknowledgment
We acknowledge financial support from the Natural Science Foundation of Hebei Province (Grant number: B2022208014), Fundamental Research Funds for the Hebei Universities (Grant number: 2021YWF17) and Hebei Province Graduate Student Innovation Funding Project (Grant number: CXZZSS2022086).
Declaration of Competing Interest
The authors declare that they have no known competing financial interests or personal relationships that could have appeared to influence the work reported in this paper.
References
- Can electrocoagulation technology be integrated with wastewater treatment systems to improve treatment efficiency? Environ. Res.. 2022;214:113890
- [Google Scholar]
- Application of hybrid electrocoagulation and electrooxidation process for treatment of wastewater from the cotton textile industry. Chemosphere. 2022;302:134706
- [Google Scholar]
- Quantification of indigo on denim textiles as basis for jeans recycling. Dyes Pigm.. 2023;216:111327
- [Google Scholar]
- Electrocoagulation process for the efficient removal of total organic carbon from real textile wastewater: Effect of conditions and kinetic study. Process Saf. Environ.. 2019;129:47-49.
- [Google Scholar]
- Removal of Eriochrome Black textile dye from aqueous solution by combined electrocoagulation–electroflotation methodology. Appl. Water Sci.. 2019;9(4):1-5.
- [Google Scholar]
- Quantitative contribution study and comparison between electrocoagulation, anode-electrocoagulation and chemical coagulation using polymer-flooding sewage. Chemosphere. 2020;250:126128
- [Google Scholar]
- Electrocoagulation/electroflotation as a combined process for the laundry wastewater purification and reuse. J. Water Process Eng.. 2019;31:100877
- [Google Scholar]
- A comparative study of the crystallinity of polyetheretherketone by using density, DSC, XRD, and Raman spectroscopy techniques. Polym. Test.. 2021;93:106878
- [Google Scholar]
- Preparation of microporous carbon materials using residual coal from oxidative degradation of lignite as the carbon source and the mechanism and dynamics of its methyl orange adsorption. Colloid Surf. A. 2022;636:128138
- [Google Scholar]
- Electrocoagulation versus chemical coagulation: Coagulation/flocculation mechanisms and resulting floc characteristics. Water Res.. 2012;46(10):3177-3188.
- [Google Scholar]
- Optimization and mechanisms analysis of indigo dye removal using continuous electrocoagulation. Chinese J. Chem. Eng.. 2021;29:242-253.
- [Google Scholar]
- Construction of novel electrochemical treatment systems for indigo wastewater and their performance. Pigm. Resin Technol.. 2021;50(3):264-267.
- [Google Scholar]
- Adsorption, kinetics and thermodynamics studies of methyl orange dye sequestration through chitosan composites films. Int. J. Biol. Macromol.. 2021;168:383-394.
- [Google Scholar]
- Efficient adsorptive removal of Zinc by green marine macro alga Caulerpa scalpelliformis -characterization, optimization, modeling, isotherm, kinetic, thermodynamic, desorption and regeneration studies. Surf. Interfaces. 2021;22:100798
- [Google Scholar]
- On validity, physical meaning, mechanism insights and regression of adsorption kinetic models. J. Mol. Liq.. 2023;376:121416
- [Google Scholar]
- Indigo dyeing from Isatis tinctoria L.: From medieval to modern use. Dyes Pigm.. 2022;207:110675
- [Google Scholar]
- Real indigol dyeing effluent decontamination using continuous electrocoagulation cell: study and optimization using Response Surface Methodology. Process Saf. Environ.. 2018;116:578-589.
- [Google Scholar]
- Treatment of textile dyeing factory wastewater by electrocoagulation with low sludge settling time: Optimization of operating parameters by RSM. J. Environ. Chem. Eng.. 2018;6(1):635-642.
- [Google Scholar]
- Removal of arsenic from water by electrocoagulation. Chemosphere. 2003;55:1245-1252.
- [Google Scholar]
- Kinetic analysis of metal uptake by dry and gel alginate particles. Biochem. Eng. J.. 2009;46:320-326.
- [Google Scholar]
- Growth and structure of flocs following electrocoagulation. Sep. Purif. Technol.. 2016;163:162-168.
- [Google Scholar]
- Comprehensive review of floc growth and structure using electrocoagulation: Characterization, measurement, and influencing factors. Chem. Eng. J.. 2021;417:129310
- [Google Scholar]
- Coagulation-flocculation mechanisms in wastewater treatment plants through Zeta potential measurements. J. Hazard. Mater.. 2014;279:1-10.
- [Google Scholar]
- Electrode passivation, faradaic efficiency, and performance enhancement strategies in electrocoagulation—a review. Water Res.. 2020;187:116433
- [Google Scholar]
- Effect of modification of textile wastewater composition on electrocoagulation efficiency. Desalination. 2011;275(1–3):181-186.
- [Google Scholar]
- Treatment of automotive paint wastewater in continuous-flow electroflotation reactor. J. Clean. Prod.. 2019;218:335-346.
- [Google Scholar]
- Kinetics, thermodynamics, isotherm modeling for removal of reactive Red 35 and disperse yellow 56 dyes using batch bi-polar aluminum electrocoagulation. Alex. Eng. J.. 2021;60(4):4139-4154.
- [Google Scholar]
- A review of electrocoagulation technology for the treatment of textile wastewater. Rev. Chem. Eng.. 2017;33(3):263-292.
- [Google Scholar]
- Electrocoagulation treatment of raw palm oil mill effluent: Effect of operating parameters on floc growth and structure. J. Water Process Eng.. 2020;33:101114
- [Google Scholar]
- Treatment of waters and wastewaters containing sulfur dyes: a review. Chem. Eng. J.. 2013;219:109-117.
- [Google Scholar]
- An overview on combined electrocoagulation/degradation processes for the effective treatment of water and wastewater. Chemosphere. 2021;263:127907
- [Google Scholar]
- Sequential use of the electrocoagulation-electrooxidation processes for domestic wastewater treatment. Chemosphere. 2022;290:133172
- [Google Scholar]
- Tailoring the surface chemical reactivity of transition-metal dichalcogenide PtTe2 crystals. Adv. Funct. Mater.. 2018;28:1706504.
- [Google Scholar]
- Vanadium removal by electrocoagulation with anodes of zinc. J. Environ. Chem. Eng.. 2022;10(4):108082
- [Google Scholar]
- Adsorption of rutin from olive mill wastewater using copolymeric hydrogels based on N-vinylimidazole: Kinetic, equilibrium, and thermodynamics assessments. Environ. Res.. 2022;212:113306
- [Google Scholar]
- A review on industrial wastewater treatment via electrocoagulation processes. Curr. Opin. Electroche.. 2020;22:154-169.
- [Google Scholar]
- Singh, Mishra, B.K., 2017. Assessment of kinetics behavior of electrocoagulation process for the removal of suspended solids and metals from synthetic water. Environ Eng Res 22, 141-148.
- Biological remediation technologies for dyes and heavy metals in wastewater treatment: New insight. Bioresour. Technol.. 2021;343:126154
- [Google Scholar]
- Thermodynamics and kinetics of the removal of nickel (II) ions from aqueous solutions by biochar adsorbent made from agro-waste walnut shells. J. Mol. Liq.. 2020;312:112788
- [Google Scholar]
- Relative importance of charge neutralization and precipitation on coagulation of kaolin with PACI: Effect of sulfate ion. Environ. Sci. Tech.. 2002;36(8):1815-1820.
- [Google Scholar]
- Roles of functional microbial flocculant in dyeing wastewater treatment: Bridging and adsorption. J. Hazard. Mater.. 2020;384:121506
- [Google Scholar]
- Widodo, B., Indrajit, P., Shaymaa, A.H., Alimuddin, Ahmed, B.M., Samar, E.I., Dhuha, M.A., Ahmed, K.O.A., Rosario, M.R.P., Luis, A.B.A., Yasser, F.M., 2022. Phosphate ion removal from synthetic and real wastewater using MnFe2O4 nanoparticles: a reusable adsorbent. Acta Chim Slov 69(3), 681-693.
- Continuous flowing electrocoagulation reactor for efficient removal of azo dyes: Kinetic and isotherm studies of adsorption. Environ. Technol. Inno.. 2021;22:101448
- [Google Scholar]
- Removal of tetracycline by electrocoagulation: Kinetic and isotherm modeling through adsorption. J. Environ. Chem. Eng.. 2014;2(1):177-184.
- [Google Scholar]
- Floc formation and growth during coagulation removing humic acid: Effect of stirring condition. Sep. Purif. Technol.. 2022;302:122084
- [Google Scholar]
- Zhang, M.D., Zhang, W., Yao, J.M., 2023. Analysis of aluminum electrode dissolution and electrochemical behavior in inorganic salt environment of indigo wastewater. Fine Chem 40(5), 1123-1129, 1148.
- Industrial indigo dyeing wastewater purification: Effective COD removal with peroxi-AC electrocoagulation system. Arab. J. Chem.. 2023;16(4):104607
- [Google Scholar]


