

Translate this page into:
HPLC-PDA analysis of ACE-inhibitors, hydrochlorothiazide and indapamide utilizing design of experiments
⁎Corresponding author. Tel.: +962 79 5065060. ashokshakya@hotmail.com (Ashok K. Shakya) ak_shakya@ammanu.edu.jo (Ashok K. Shakya)
-
Received: ,
Accepted: ,
This article was originally published by Elsevier and was migrated to Scientific Scholar after the change of Publisher.
Peer review under responsibility of King Saud University.
Abstract
A simple, rapid, precise, accurate and sensitive high performance liquid chromatographic method has been developed for simultaneous determination of ACE inhibitors with hydrochlorothiazide and indapamide in pharmaceutical formulations. ‘Design of Experiments’ (DoE) using ‘central composite design’ (CCD) was applied to facilitate method development and optimization. Mobile phase was optimized utilizing response surface methodology using Design Expert software. Chromatographic separation was achieved on Hypersil®-Gold C18 (100 × 4.6 mm, 3 μm, Thermo Fisher Scientific, USA), column at 25 °C. The mobile phase was 58% buffer (5 mM KH2PO4, containing triethylamine 0.25 ml/L), 25% acetonitrile and 17% methanol (pH adjusted to 2.8 ± 0.1). The analysis was performed at 215 nm. The mobile phase flow rate was 1.0 ml/min and injection volume 10 μl. The method was validated for linearity, limits of quantitation and detection, accuracy, precision, ruggedness and robustness as per the International Conference on Harmonization (ICH) guidelines. Calibration curves (for lisinopril, hydrochlorothiazide, captopril, imidapril, perindopril, indapamide and trandolapril) were linear in the concentration range of 5–35 μg/ml. The limit of detection and limit of quantitation for experimental drugs ranged from 0.03 to 0.61 and 0.08–1.84 μg/ml respectively.
Keywords
HPLC
ACE inhibitors
Hydrochlorothiazide
Indapamide
Design of experiments (DoE)
Central composite design

1 Introduction
Angiotensin converting enzyme (ACE) inhibitors are the current first-line therapy for heart failure, as recommended by the European society of cardiology, due to the fact that they reduce mortality by up to 26% (Ezzati et al., 2002). More than 40 million people worldwide currently receive angiotensin converting enzyme inhibitors (ACEIs) for the management of hypertension and heart failure. Heart failure care studies conducted in the developing countries between 1 January 1995 and 30 March 2014 reveals that 57% of patients were treated with ACEIs, 34% with beta-blockers and 32% with mineralocorticoid receptor antagonists (Callender et al., 2014; Sánchez-Borges, 2014). ACEIs block the active site of angiotensin-converting enzymes and decrease angiotensin-II levels, thereby lowering blood pressure. The action of angiotensin-II are mediated by angiotensin-II receptor type I, which may cause the major biological action of angiotensin-II, including vascular contraction, pressure responses, renal tubular sodium transport and aldosterone secretion (Roy, 2007; Su et al., 2007). ACE inhibitors are effective for control of blood pressure, congestive heart failure, and prevention of stroke and hypertension, or diabetes-related kidney damage. As antihypertensive agents they are administered alone, or in binary combination with the diuretic hydrochlorothiazide and/or indapamide in order to increase the antihypertensive effects. Currently, there are 11 ACE inhibitors approved for therapeutic use in United States (Harrold, 2013). Several HPLC methods for the estimation of ACE-inhibitor along with HCT or indapamide were reported during last two decades. Lisinopril along with other compounds has been analysed by HPLC (Beasley et al. 2005; Khomushku et al., 2011; Sultana et al., 2012; Raju and Rao, 2012). Several new methods have been reported for the analysis of perindopril along with indapamide (Jogia et al., 2010; Pathak et al., 2011; Jain et al., 2012; Tiwari et al., 2012). Stanisz et al. (2011) have reported the RP-HPLC method for determination of imidapril in formulation. So far as the simultaneous detection is concerned, literature survey reveals that seven angiotensin converting enzyme inhibitors (benazepril, enalapril, fosinopril, lisinopril, ramipril and metabolite captopril disulphide and enalaprilate) together with hydrochlorothiazide in pharmaceutical dosage forms are analysed by fast gradient high performance liquid chromatography utilizing UV detector (Elsebaei and Zhu, 2011). Harlikar et al. (2003) have reported simultaneous determination of a few ACE-inhibitors like perindopril, ramipril and trandolapril along with indapamide. Sultana et al. (2010, 2011) and El-Gindy et al. (2013) reported the analysis of captopril, indapamide and related compounds using HPLC. Other methods utilizing HPLC for simultaneous determination of ACE-Inhibitors were reported by Bonazzi et al. (1997) and Manna et al. (2001). Simultaneous determination of ACE-I utilizing capillary electrophoresis (Gotti et al., 2000; Hillaert and Bossche, 2000a, 2001b, Hillaert et al., 2001c), voltammetric (Prieto et al., 2003) and LC-MS-MS (Gupta et al., 2011) are documented. Analytical methods for ACEIs were developed on the basis of modification of ‘One factor at a time’ (OFAT) requires either gradient elution or ion pairing reagent. Design of experiments (DoE) and software assisted methods can be extrapolated or further modified and improved according to the need using the present experimental data. Pharmacopoeial methods describe the determination of ACE-inhibitors either alone or along with their active metabolites. Khamanga and Walker (2011) reported the use of experimental design in the development of an HPLC-ECD method for the analysis of captopril in formulation. Quality by design (QbD) is well established in the development and manufacture of pharmaceutical drug substance and drug product processes as described in ICH Q8, Q9 and Q11. At a high level, the aim of QbD is to design a quality product that consistently delivers the intended performance. Analogous to process QbD, the aim of AQbD is to design a quality, robust method that consistently delivers the intended performance (Reid et al., 2013). Design of experiments (DoE) is the simple method to optimize the experimental condition with two or more variables (Anderson and Patrick, 2004; Krull et al., 2009; Monks et al., 2011). Different mobile phases and chromatographic conditions are required for the analysis of different ACE-I in pharmaceutical formulation, which reduces the work efficiency in pharmaceutical companies, manufacturing similar product with different active pharmaceutical ingredients. The aim of present study was to develop, optimize and validate a simple, isocratic, economical, efficient and rapid high performance liquid chromatographic method for the estimation of lisinopril, captopril, imidapril, perindopril and trandolapril with or without HCT/indapamide (Fig. 1) in formulation utilizing design of experiment. Hence ACEIs were selected on the basis of their similar nature having problem in separation on ODS column due to their lipophilicity and ionization.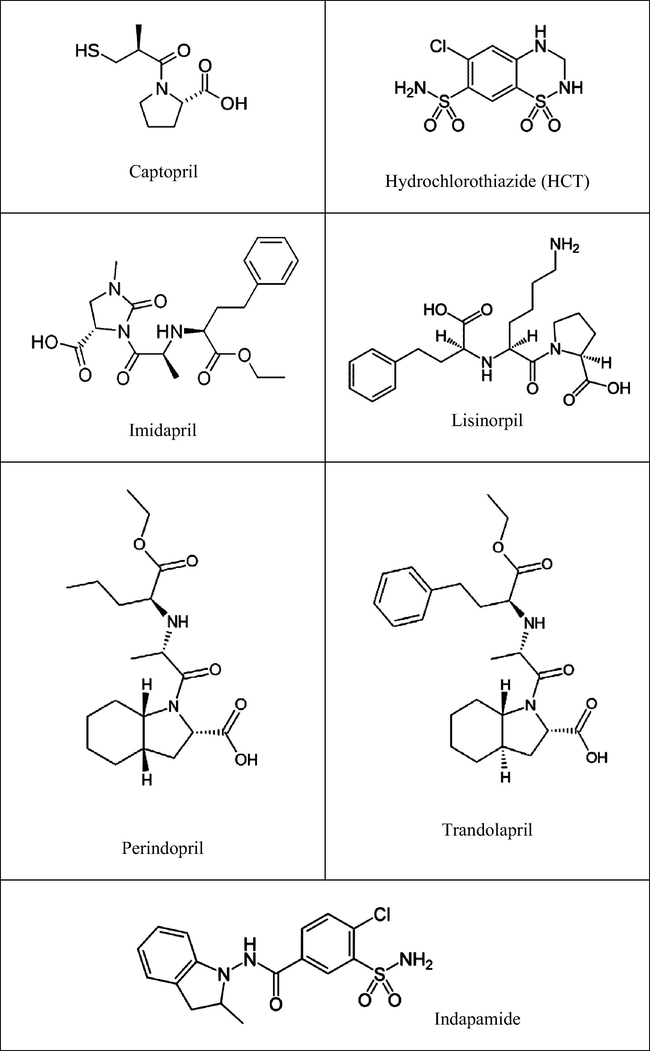
Chemical structure of drugs studied.
2 Experimental
2.1 Chemical and reagents
Trandolapril (99.8%) and perindopril (99.2%) were obtained as a gift from Hetero Pharmaceutical Ltd, Hyderabad, India. Indapamide (98.9%), imidapril (99.6%), captopril (99.7%), hydrochlorothiazide (99.5%) and lisinopril (97.8%) were received as a gift from Tabuk Pharmaceuticals, Tabuk, KSA. Acetonitrile and methanol (HPLC grade) were purchased from Tedia Company (Fairfield, USA). Double distilled and deionized water was used throughout the analysis.
2.2 Chromatographic system and conditions
A prominence UFLC system consisted of a 20-AD UFLC pump, DGU-20A3 degasser, SIL-20A auto-sampler, SPD-M20A photo diode array detector and a CBM-20A communication bus module (All from Shimadzu, Kyoto, Japan). The signals were captured using LC-solution version 1.25 (2009-2010) work station (Shimadzu, Japan) operating under Microsoft Windows 7 (32 bit) platform. The pH measurements were carried out using WTW 720 pH metre equipped with a combined electrode (with ATC probe) calibrated using standard buffer solution of pH 4.0, 7.0 and 9.0. Chromatographic separation was achieved on Hypersil®-Gold C18 (100 × 4.6 mm, 3 μm, Thermo Fisher Scientific, USA), column at 25 °C using optimized mobile phase consisting of 58% buffer (5 mM KH2PO4, containing triethylamine 0.25 ml/L), 25% acetonitrile and 17% methanol (pH 2.8 ± 0.1). The mobile phase flow rate was 1.0 ml/min and injection volume 10 μl. The analysis was performed at 215 nm, while the signals were captured from 200 to 320 nm.
2.3 Preparation of stock solutions, calibration standards and quality control samples
Standard stock solution of each drug were prepared separately as 1 mg/ml in acetonitrile and water (1:1, v/v) and stored at 4 °C. Working solutions, calibration standards (5–35 μg/ml) and quality control samples (LQC, 5.0 μg/ml; MQC, 22 μg/ml and HQC, 30 μg/ml) were prepared separately as required and stored at 4 °C in amber coloured glass-wares.
2.4 Software aided method optimization
Central composite and Box-Behnken design are used in method development and optimization. Selection of appropriate mobile phase is essential in method development. Various factors were considered for method development including, volume fraction of organic solvents in mobile phase and buffer. Central composite design (CCD) was selected as it required only 20 runs with 3 variables gives complete response under extreme conditions (lowest or highest levels of independent variables) which is not possible in Box-Behnken design. A 3-factorial design used is suitable for exploring response surface and constructing different models with Design Expert® (Version 8.0.6, Stat-Ease Inc., Minneapolis, MN USA). Twenty experiments were constructed using the conditions and observed responses are described in Table 1 and levels described in Table 2. Computer generated linear (Eq. (1)), 2 factor interaction (Eq. (2)) and non-linear quadratic models (Eq. (3)) are given as:
Experiment (Run)
Std Run
Type
Buffer A (%)
Acetonitrile B (%)
Methanol C (%)
Rs1
Rs2
Rs3
Rs4
Rs5
Rs6
1
19
Centre
0
0
0
1.411
1.756
2.769
1.431
4.532
10.673
2
3
Factorial
−1
1
−1
1.798
1.125
1.088
0.401
0.399
4.551
3
4
Factorial
1
1
−1
2.007
1.454
2.430
0.843
6.110
8.464
4
10
Axial
1.68
0
0
1.684
2.229
4.652
1.417
5.078
15.566
5
9
Axial
−1.68
0
0
1.384
1.549
1.685
0.559
3.662
7.862
6
20
Centre
0
0
0
1.405
1.769
2.801
1.455
4.542
11.125
7
2
Factorial
1
−1
−1
1.843
2.739
7.387
0.650
8.001
21.701
8
16
Centre
0
0
0
1.453
1.747
2.724
1.412
4.541
10.415
9
7
Factorial
−1
1
1
1.253
1.495
1.219
0.650
3.650
6.484
10
6
Factorial
1
-1
1
1.138
2.726
5.609
1.969
3.938
19.001
11
1
Factorial
−1
−1
−1
1.716
2.179
4.721
1.641
5.888
15.458
12
14
Axial
0
0
1.68
0.978
1.754
1.853
0.870
3.325
9.076
13
5
Factorial
−1
−1
1
1.018
2.176
3.348
1.461
3.990
13.896
14
12
Axial
0
1.68
0
1.655
1.216
1.101
0.550
4.983
4.656
15
18
Centre
0
0
0
1.401
1.750
2.751
1.381
4.512
10.515
16
8
Factorial
1
1
1
1.344
1.642
2.006
0.779
4.117
8.838
17
11
Axial
0
−1.68
0
1.650
2.001
3.998
1.501
5.998
24.700
18
13
Axial
0
0
−1.68
2.249
1.640
3.731
1.318
7.861
11.063
19
17
Centre
0
0
0
1.527
1.842
2.918
1.270
4.648
11.363
20
15
Centre
0
0
0
1.402
1.660
2.750
1.488
4.525
11.011
Factor
Low (−1)
Medium (0)
High (+1)
Independent
A = Buffer,
55
60
65
B = Acetonitrile
20
25
30
C = Methanol
15
20
25
Dependent
Rs1 = Resolution between Lisinopril and HCT
Rs2 = Resolution between HCT and captopril
Rs3 = Resolution between captopril and imidapril
Rs4 = Resolution between Imidapril and perindopril
Rs5 = Resolution between perindopril and indapamide
Rs6 = Resolution between indapamide and trandolapril
2.5 Preparation of mobile phase
The measured amount of acetonitrile (250 ml), potassium dihydrogen phosphate buffer (580 ml, 5 mM, containing 0.25 ml/L TEA) and methanol (170 ml each) were transferred in HPLC bottle separately. The final pH was adjusted to 2.8 ± 0.1, using 25% orthophosphoric acid. Prepared mobile phase was filtered through 0.22 μm nylon filters and degassed using ultrasonic bath (Branson, Model 3210, USA).
2.6 Method validation
The analytical method was validated for accuracy, precision, limit of detection (LOD), limit of quantitation (LOQ), specificity, robustness and ruggedness as per recommendation of International Conference on Harmonisation (International Conference on Harmonization, 2005).
2.6.1 Calibration, linearity, limit of detection (LOD) and limit of quantitation (LOQ)
The linearity of the method was established by fitting calibration data to a least squares linear regression model using internal features of LC solution software. Different calibration standards (5–35 μg/ml, n = 5) were analysed and area response was calculated. The calibration curves were constructed by plotting peak area against concentration using weighting factor x. The method was evaluated by determination of the correlation coefficient and intercept values. LOD and LOQ were determined from the calibration function. LOD and LOQ were calculate as 3.3 × σn-1/S and 10 × σn-1/S, where σn-1 is the standard deviation of the intercept and S is the slope of the calibration cure.
2.6.2 Precision and accuracy
To judge the quality of the method, precision and accuracy were determined. The precision of the method, expressed as CV (%), was determined by analysis of three different concentrations within the linearity range for different drug in the dosage form. Precision was measured using triplicate determination of quality control samples of 5 μg/ml (LQC), 22 μg/ml (MQC) and 35 μg/ml (HQC) of API on three different occasion on same day (intra-day) and three different days (inter-day precision). The precision (% CV) determined as each concentration level were required not to exceed 2% at each level on different occasions and different days. Accuracy of method was measured by spiking standard drug in predetermined tablet solution at concentration level of 80, 100 and 120% and calculating the percent recovery of active ingredient. In the present study, the mean recovery of the target concentration was set to 100 ± 2% for acceptance.
2.6.3 Specificity
The specificity of the method was assessed by comparing chromatographs obtained from the analysis of the standard solution of drug and samples produced by dissolving commercial formulation. The peaks observed in the chromatograms were well separated from the solvent front and there were no apparent co-eluting peak at the retention time of drug. It was evaluated by inspection of the two dimensional contour plot and three-dimensional chromatograms. Peak purity index (purity angle, purity threshold, match angle and match threshold) was checked using the tools of the LC-solution software. If the purity angle is smaller than the purity threshold and the match angle is smaller than the match threshold, no significant differences between spectra can be detected. As a result no spectroscopic evidence for co-elution is evident and the peak is considered to be pure (Ira and Michael, 2001).
2.6.4 System suitability
System suitability parameters were tested with six replicate injections of working standards at the start of the validation. The parameters were calculated by mean value according to “USP”. The parameters were retention time, peak area and peak height, width at half peak height, tailing factor, efficiency and height equivalent to the theoretical plate (HETP). System suitability was measured on the basis of precision (% CV or RSD). The precision, as measured by coefficient of variation was determined at each set parameters and it should be less than 2%.
2.6.5 Robustness and ruggedness
Robustness of the method was investigated by injecting the system suitability solution by deliberately changing the chromatographic parameters (flow rate e.g. 0.90–1.10 ml/min or wave-length 210, 215 or 220). Robustness was measured on the basis of precision (measures by % CV or RSD). The precision determined at each concentration/parameters and it should be less than 2%. The ruggedness of method was investigated by comparing the intra-, inter and overall precision result for the assay of drug performed by two different analysts.
2.6.6 Assay of marketed formulations
Ten tablets of different drugs were accurately weighed and powdered separately. A portion of powder equivalent to 10 mg was transferred to 100 ml volumetric flask and dissolved in about 25 ml of mobile phase. Sample solutions were sonicated for 20 min using ultrasonic bath and diluted to the mark with mobile phase. The resulting solution was filtered using 0.22 μm nylon membrane filter. Working solution containing concentrations lying in the linear range of regressed equation were prepared by dilution with mobile phase and 10 μl were injected to the system. Same dilutes were used for the preparation of samples. The content of the drug samples was calculated by using linear regression equation using weighting factor ‘x’.
3 Result and discussion
3.1 Design of experiment and method optimization
A three factorial, central composite design was performed using 20 experimental runs. The independent and dependent variables for all 20 trial experiments are given in Table 1. The proposed models for different dependent (response) variable along with the regression equation are given in Table 2. Only statistically significant (p < 0.05) coefficient are included in the regressed equation after model reduction (insignificant model terms are removed to improve the model). A positive value in the equation indicates the favourable response while a negative value indicates an inverse relationship between the factor and the response. It is clear from the equations that the factor buffer (A) has a positive effect on the resolution factor, while acetonitrile (B) and methanol (C) are having mixed type of response on different resolution factor. Two dimensional contour plot and 3D response surface plots are presented as Fig. 3a–f which are very useful for studying the interaction effects of the factors on the responses. The coefficients for the model were estimated by least squares regression. The relationship between the response factors (Rs1–Rs4) and independent factors is linear, while in case of response factor Rs6 it is quadratic. Two factor interactions (2FI, Eq. (2)) were observed in case of resolution factor Rs5 and factors. An independent factor can produce different degree of response when the different factors (A, B or C) are changed simultaneously. Interaction of A and B, as well as B and C produce positive impact on response, while A and C have negative impact on resolution factor Rs5. In case of resolution factor Rs6, interaction of A and B, as well as A and C, produce negative impact on response, while B and C have positive impact. The squares of factor A2 and B2 are having positive impact, while C2 is giving negative impact on the dependent response (Table 3).
Parameter
Parameter
Regressed equation
RS-1
Regressed equation (linear model)
Rs1 = 1.52 + 0.077A + 0.051B − 0.35C
Regressed equation (After model reduction)
Rs1 = 1.52 + 0.077A − 0.35C
RS-2
Regressed equation (Linear model)
Rs2 = 1.82 + 0.20A − 0.40B + 0.054C
Regressed equation (After model reduction)
Rs2 = 1.82 + 0.20A − 0.40B
RS-3
Regressed equation (Linear model)
Rs3 = 3.08 + 0.88A − 1.41B − 0.48C
Regressed equation (After model reduction)
Rs3 = 3.08 + 0.88A − 1.41B − 0.48C
RS-4
Regressed equation (Linear model)
Rs4 = 1.15 + 0.11A − 0.34B + 0.042C
Regressed equation (After model reduction)
Rs4 = 1.15 − 0.34B
RS-5
Regressed equation (2FI model)
Rs5 = 4.72 + 0.78A − 0.68 B − 0.90C + 0.51AB − 0.93AC + 0.90BC
Regressed equation (After model reduction)
Rs5 = 4.72 + 0.78A − 0.68B − 0.90C − 0.93AC + 0.90BC
RS-6
Regressed equation (Quadratic model)
Rs6 = 10.89 + 2.24A − 5.52B − 0.39C − 0.63AB − 0.34AC + 0.82BC + 0.32A2 + 1.37B2 − 0.26C2
Regressed equation (After model reduction)
Rs6 = 10.84 + 2.24A − 5.52B − 0.39C − 0.63AB + 0.82BC + 1.37B2
As observed, an increase in buffer (%) at constant methanol and acetonitrile (v/v) content, increases the resolution factor (Rs1). It is evident from the steepness of the curve that at constant buffer and acetonitrile content, methanol has significant influence on the resolution factor Rs1 (Fig. 3a). Since lisinopril is a water soluble drug (log Po/w = −1.22, Moffat et al., 2011), the high buffer content in mobile phase increases its retainability. Keeping these observations in knowledge the resolution factor Rs1 was considered during method optimization and mobile phase selection step. The resolution factor between HCT and captopril (Rs2) depends on the acetonitrile and buffer. Rs2 decreases as the acetonitrile (%) content in the mobile phase increases (Fig. 3b). Similar pattern (steepness) was observed for resolution factor between captopril and imidapril (Rs3). The resolution of imidapril and perindopril (Rs4), solely depends on the acetonitrile (%) in mobile phase. At a constant methanol content (20%), buffer is not having significant impact on the separation of these two drugs (Table 3 and Fig. 3d). So far as, resolution factor Rs5 (Resolution factor between perindopril and indapamide) is concerned, it depends on the methanol and acetonitrile content in the mobile phase. It is evident from Fig. 3e, that an increase in methanol or acetonitrile content decreases the resolution factor at constant buffer content. The interaction of buffer (A) and methanol (C), AC is having negative impact while BC is having positive impact on resolution factor. Steepness of the response surface plot (Fig. 3f) demonstrates that when methanol (C) was kept constant at a 20%, the acetonitrile (B) is having negative impact while buffer (A) has positive impact on resolution factor (Rs6). The resolution of indapamide and trandolapril depends on the acetonitrile and buffer content in mobile phase.
The final composition of the mobile phase for simultaneous determination of these compounds was selected using Design Expert® software (Version 8.0.6, Stat-Ease, USA) after studying the 2D contour and 3D response surface plots. In the optimization step, resolution factor Rs1, Rs4 and Rs6 were kept constant to 1.70, 1.20 and 10.50 respectively. The desirability plot (Fig. 3g) and several different mobile phase compositions were generated by the software. Using desirability plot, the optimized mobile phase (having desirability factor 0.954) was selected for analysis. Different drug combinations were analysed and the resolution factors were calculated. The observed resolution factors (Rs1–Rs6) were 1.68, 1.75, 3.01, 1.18, 4.65 and 10.4. The results indicate that the present method is capable of separating simultaneously five closely related ACEIs, indapamide and HCT which were not studied earlier (Table 6). The developed and optimized mobile phase exhibit good resolution and reproducible results. The typical chromatogram and 2-D contour plot obtained during the analysis are given in Fig. 2.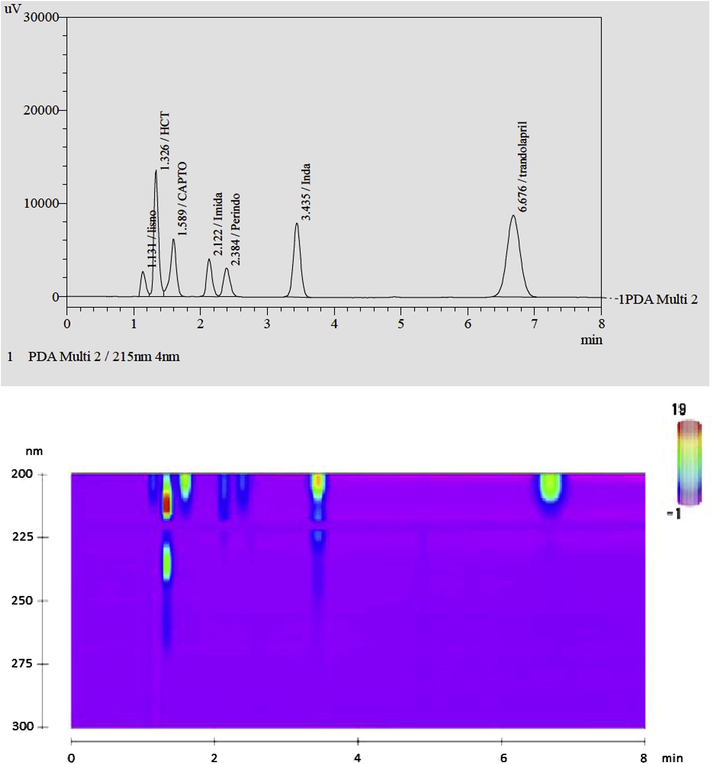
Representative chromatographs of ACE inhibitors, HCT and indapamide using optimized mobile phase. (a) HPLC chromatogram and (b) contour plot.
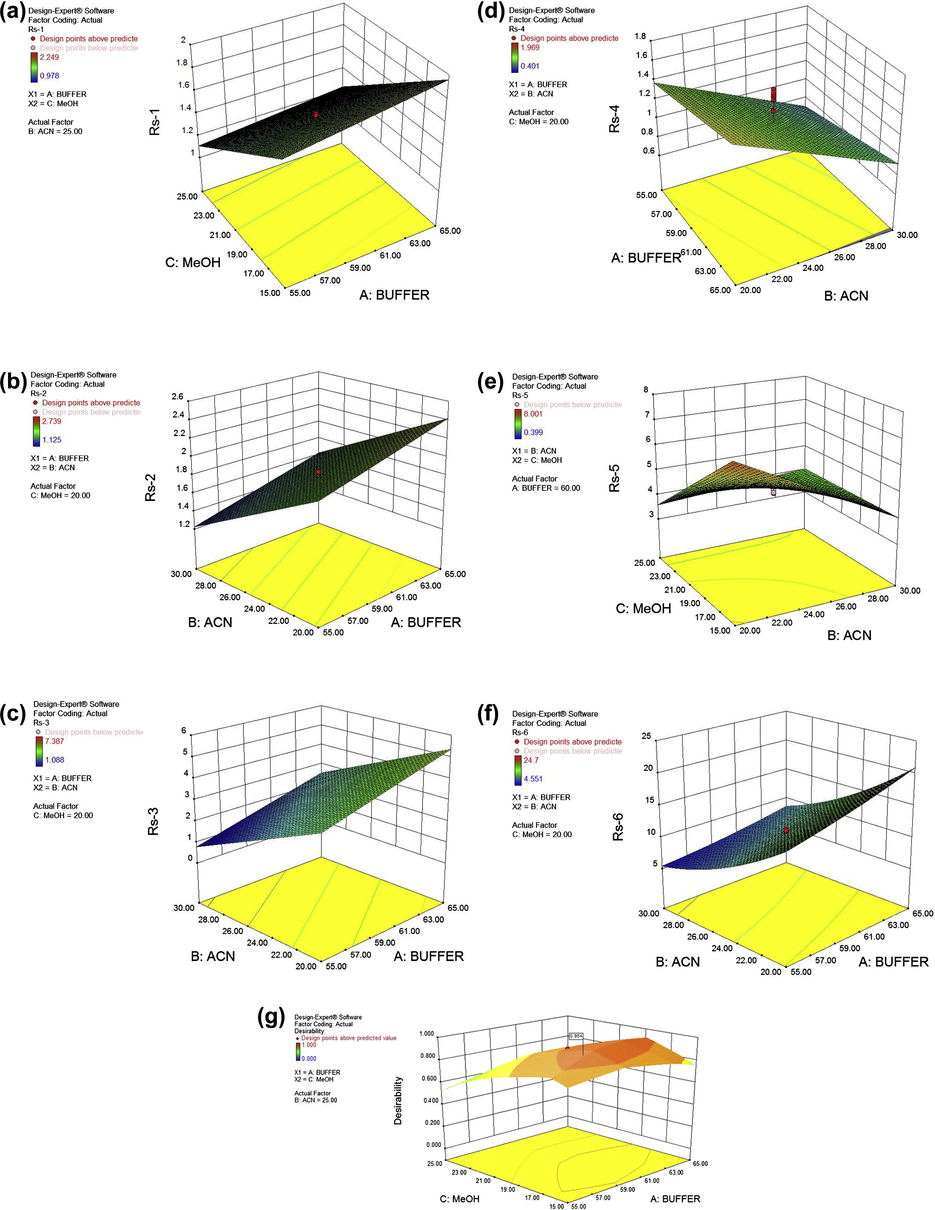
3-D surface plots for resolution factor (a) Rs-1; (b) Rs-2; (c) Rs-3; (d) Rs-4; (e) Rs-5; (f) Rs-6 versus independent factor (A-buffer, B-acetonitrile or C-methanol); (g) Desirability plot for optimization as function of A-buffer and C-methanol concentration.
3.2 System suitability
The system suitability parameters were calculated according to “USP”. The parameters were retention time, peak area, peak height, width, tailing factor, theoretical plate and HETP. The precision (% CV or RSD) of peak area, peak height and peak width, tailing factor, HETP and retention time for the drugs were less than 1.6%, indicating the suitability of the system. Representative data for the system suitability parameters are given in Table 4.
Drug (μg/ml)
Ret. time Mean ± SD (RSD)
Area Mean ± SD (RSD)
Height Mean ± SD (RSD)
Tailing Factor. Mean ± SD (RSD)
T.Plate Mean ± SD (RSD)
USP width Mean ± SD (RSD)
HETP Mean ± SD (RSD)
Lisinopril (5)
1.16 ± 0.00 (0.22)
77,380 ± 130.2 (0.17)
12,603 ± 33.5 (0.27)
1.14 ± 0.00 (0.45)
661 ± 0.92 (0.14)
0.18 ± 0.00 (0.65)
151.20 ± 1.39 (0.92)
HCT (8)
1.39 ± 0.00 (0.22)
426,524 ± 517.9 (0.12)
87,493 ± 263.2 (0.30)
1.23 ± 0.01 (0.81)
1500 ± 23.6 (1.57)
0.14 ± 0.00 (0.62)
66.69 ± 1.07 (1.60)
Captopril (5)
1.70 ± 0.00 (0.18)
44,120 ± 253.9 (0.56)
6538 ± 54.5 (0.30)
0.95 ± 0.00 (0.33)
1366 ± 24.8 (1.81)
0.19 ± 0.00 (1.57)
71.49 ± 0.42 (0.59)
Imidapril (5)
2.25 ± 0.00 (0.17)
118,139 ± 141.9 (0.12)
19,185 ± 61.5 (0.32)
1.22 ± 0.00 (0.35)
3189 ± 14.2 (0.45)
0.18 ± 0.0 (0.35)
31.36 ± 0.14 (0.45)
Perindopril (5)
2.45 ± 0.00 (0.09)
47,005 ± 80.18 (0.17)
6788 ± 16.17 (0.24)
1.09 ± 0.00 (0.33)
3297 ± 9.11 (0.28)
0.20 ± 0.0 (0.00)
30.33 ± 0.08 (0.28)
Indapamide (5)
3.55 ± 0.01 (0.28)
27,385 ± 428.12 (0.16)
29,647 ± 124.8 (0.42)
1.10 ± 0.00 (0.24)
4739 ± 16.5 (0.35)
0.26 ± 0.0 (0.38)
21.10 ± 0.07 (0.35)
Trandolapril (17.5)
6.75 ± 0.05 (0.77)
230,261 ± 455.5 (0.20)
35,770 ± 95.6 (0.26)
1.05 ± 0.00 (0.28)
8305 ± 85.0 (1.02)
0.19 ± 0.00 (0.94)
30.11 ± 0.30 (0.99)
3.3 Calibration, linearity, limit of detection (LOD) and limit of quantitation (LOQ)
Regression parameters for pure drug standard including the slope, intercept and regression coefficient are given in Table 5. These parameters are used for the calculation of drug concentration in pharmaceutical tablets. The calibration curves were linear from 5 to 35 μg/ml. The regression coefficients ranged from 0.9901 to 0.9999 for experimental drugs. The limit of detection and limit of quantitation for ACEIs were ranged from 0.026 to 0.609 and 0.079–1.845 respectively. The LOD for HCT and indapamide were 0.345 and 0.279 μg/ml respectively; while the LOQ were 1.045 and 0.848 μg/ml.
S.N
Parameter
Drug
Lisinopril
HCT
Captopril
Imidapril
Perindopril
Indapamide
Trandolapril
1
Linearity Range (μg/ml)
5–35
5–35
5–35
5–35
5–35
5–35
5–35
2
Slope (mean)
12,376
57,801
13,179
20,426
8320
56,340
14,312
3
Intercept (mean)
−2936
−41,612
−28,039
−11,988
−8617
−47,177
−8981
4
Correlation coefficient (r2)
0.9985–0.9995
0.9921–0.9922
0.9909–0.9913
0.9996–0.9999
0.9901–0.9990
0.9957–0.9964
0.9978–0.9985
5
Accuracy (%)
100.2–101.6
99.5–101.5
100.9–101.3
98.7–99.0
98.1–99.6
98.0–98.8
99.2–100.6
6
Intra-day Precision (%)
0.07–0.14
0.07–0.37
0.33–0.79
0.10–0.19
0.08–1.04
0.21–0.28
0.15–0.22
7
Inter-day precision (%)
0.07–2.09
0.07–0.60
0.33–0.79
0.10–1.86
0.08–1.04
0.21–1.44
0.15–0.62
8
Overall precision (%)
0.54–1.72
0.64–1.29
0.78–1.99
1.07–1.95
0.99–1.10
1.05–1.70
0.90–0.93
9
Limit of quantitation (μg/ml)
0.7015
1.0447
1.4434
0.0790
1.8454
0.8484
0.4285
10
Limit of detection (μg/ml)
0.2315
0.3447
0.4763
0.0261
0.6090
0.2799
0.1410
11
Assay (mean ± SD) (%)
104.0 ± 0.5 (0.51)
96.9 ± 0.8 (0.83)
104.4 ± 0.6 (0.57)
94.7 ± 0.4 (0.42)
102.5 ± 0.4 (0.39)
99.1 ± 1.9 (1.92)
98.9 ± 0.7 (0.72)
S.N.
Analytical Method (Reference)
Drugs
Column
Detection (λmax)
Salient features
Advantage
Disadvantage
1
HPLC (Elsebaei and Zhu, 2011)
Benazepril, enalapril, fosinopril, lisinopril, ramipril, captopril disulphide, enalaprilate, hydrochlorothiazide (HCT)
Extend RP-C18 (25 μm particle size, 4.6 mm × 250 mm)
215 nm
LOQ 17–64 ng/ml LOD 56–212 ng/ml
Simple, convenient, fast and effective sample preparation
Gradient elution, long run time
2
HPLC (Manna et al., 2001)
Benazepril hydrochloride, fosinopril sodium, ramipril, HCT
LC-8 (5 μm particle size, 125 × 4.0 mm)
220 nm
LOQ 1–8 ng/ml
Rapid and accurate
Analysis limited to binary mixture, requires ion pair reagent
3.
HPLC (Jogia et al., 2010)
Perindopril, indapamide and degradation product
XTerra LiChrosorb RP18 column (5 μm, 150 × 4.6 mm)
215 nm
Linearity range 24–56 μg/ml (Perindopril) and 7.5–17.5 μg/ml (Indapamide).
Stability indicating
Analysis performed at 55° C
4.
HPLC (Harlikar et al., 2003)
Perindopril, Indapamide, Ramipril, Trandolapril
Supelco C-18, (3μ, 30 × 4.6 mm)
215 nm
–
Sensitive, accurate, and precise
–
5
HPLC (El-Gindy et al., 2013)
Captopril (CP), Indapamide (ID), and their related compounds
Xterra RP8 column (5 μm particle size, 250 × 4.6 mm)
210 nm
–
Stability indicating
Requires ion pair reagent
6
HPLC (Beasley et al., 2005)
Lisinopril, lisinopril degraded product paraben
–
–
LOD (0.0075 μg/ml)
Lisinopril in presence of degraded product and excipients
–
7.
CE (Hillaert et al., 2001)
Enalapril, lisinopril, quinapril, fosinopril, ramipril, cilazapril and HCT
Fused-silica capillary (52 cm × 75 μm I.D.)
–
Varied
–
Run time 20 min, with 2 different buffers
8.
HPLC (Bonazzi et al., 1997)
ramipril, benazepril , enalapril maleate , lisinopril and quinapril
ODS column
–
Varied
Gradient method
Run time 25 min
9.
Present HPLC method
Lisinopril, captopril, imidapril, perindopril, indapamide, trandolapril and HCT
Hypersil-Gold C-18 (3 μm, 100 × 4.6 mm)
215 nm
LOD (0.03–0.61 μg/ml), Linearity (5–35 μg/ml)
Isocratic, economical (less organic waste), efficient and rapid analytical method for analysis of different combination of drugs without changing conditions. Method developed using DoE and software which can be further extrapolated or modified using current experiment data.
Limited to enlisted drugs only
3.4 Precision and accuracy
The intra-day, inter-day and overall precision following analysis of different QC samples and resultant data are given in Table 5. The precision values were less than 2%, indicating that the method is repeatable and precise. The accuracy studies indicate that the present method is accurate as the greatest bias was 1.6%. No value for bias deviated by more than 2%.
3.5 Specificity
The present HPLC method is specific and selective. No interfering peaks were observed at the retention of different compounds. The peak purity was more than 0.9999, indicating absence of co-eluting substance along with experimental drugs.
3.6 Ruggedness and robustness
The present method is robust and rugged, minor changes (flow rate, detection wavelength or analyst) in the method do not affect the result. The precision was less than 2% in different experimental condition (data on file).
3.7 Assay
The average drug content of different formulations is mentioned in Table 5. The drug content for lisinopril, HCT, captopril, imidapril, perindopril, indapamide and trandolapril were 104.0, 96.9, 104.4, 94.7, 102.5, 99.1 and 98.9 % respectively. No interfering peaks were observed in the chromatogram indicating that there was no interference from the excipients used in tablets. Peak purity parameters were checked utilizing internal features presents in LC-solution software. The precision (% CV or RSD) was less than 2% in all case.
4 Conclusion
A simple, isocratic, rapid, accurate and precise HPLC-PDA method has been developed and optimized utilizing design of experiment for the determination of five ACE inhibitors alone or in combination with HCT or indapamide in tablets. DoE and CCD were used effectively for the optimization of the method and separation of ACEIs, indapamide and HCT (having almost similar nature). As the method is developed and optimized using DoE and software program, it can be further exploited to optimize for the analysis of different combined dosage forms of these drugs. The developed method is suitable for high throughput analysis of quality control samples of API and formulations in the pharmaceutical industry. Simple isocratic chromatographic conditions, sample preparation and rapid analysis making it more suitable for routine analysis of samples in large companies or quality control labs.
Acknowledgements
We wish to thank the Deanship of Research and Higher Education and Faculty of Pharmacy, Al-Ahliyya Amman University, Amman Jordan, for funding this research through research projects and for providing necessary facilities.
References
- RSM Simplified: Optimizing Processes Using Response Surface Methods for Design of Experiments. New York: CRC Press Taylor and Francis Group; 2004.
- Development and validation of a stability indicating HPLC method for determination of lisinopril, lisinopril degradation product and parabens in the lisinopril extemporaneous formulation. J. Pharm. Biomed. Anal.. 2005;37:559-567.
- [Google Scholar]
- Analysis of ACE inhibitors in pharmaceutical dosage forms by derivative UV spectroscopy and liquid chromatography (HPLC) J. Pharm. Biomed. Anal.. 1997;16:431-438.
- [Google Scholar]
- Heart failure care in low- and middle-income countries: a systematic review and meta-analysis. PLoS Med.. 2014;11(8):e1001699.
- [CrossRef] [Google Scholar]
- Stability-indicating HPLC method for determination of captopril, indapamide and their related compounds. J. Liq. Chromatogr. Related Technol. 2013
- [CrossRef] [Google Scholar]
- Fast gradient high performance liquid chromatography method with UV detection for simultaneous determination of seven angiotensin converting enzyme inhibitors together with hydrochlorothiazide in pharmaceutical dosage forms and spiked human plasma and urine. Talanta. 2011;85:123-129.
- [Google Scholar]
- Comparative risk assessment collaborating G. Selected major risk factors and global and regional burden of disease. Lancet. 2002;360:1347-1360.
- [Google Scholar]
- Analysis of ACE-inhibitors by CE using alkylsulfonic additives. J. Pharm. Biomed. Anal.. 2000;22:423-431.
- [Google Scholar]
- Simultaneous determination of ramipril, ramiprilat and telmisartan in human plasma using liquid chromatography tandem mass spectrometry. Talanta. 2011;83:709-716.
- [Google Scholar]
- Simultaneous determination of perindopril, indapamide, ramipril, trandolapril in pharmaceutical formulations using reverse phase liquid chromatography. Res. J. Chem. Environ.. 2003;7:59-62.
- [Google Scholar]
- Agents affecting the renin-angiotensin pathway and calcium blockers. In: Lemke T.L., Williams D.A., Roche V.F., Zito S.W., eds. Foye’s Principles of Medicinal Chemistry (7th ed.). Philadelphia: Wolters Kluwer (Health)/Lippincott Williams & Wilkins; 2013. p. :753-760.
- [Google Scholar]
- Optimization of capillary electrophoretic separation of several inhibitors of the angiotensin-converting enzyme. J. Chromatogr. A. 2000;895:33-42.
- [Google Scholar]
- The quantitative determination of several inhibitors of the angiotensin-converting enzyme by CE. J. Pharm. Biomed. Anal.. 2001;25:775-783.
- [Google Scholar]
- Simultaneous determination of hydrochlorothiazide and several inhibitors of angiotensin-converting enzyme by capillary electrophoresis. J. Chromatogr. A. 2001;924:439-449.
- [Google Scholar]
- International Conference on Harmonization, 2005. Q2 (R1), validation of analytical procedures: text and methodology. In: International Conference on Harmonization, Geneva. Available from: <http://www.ich.org/products/guidelines/quality/quality-single/article/validation-of-analytical-procedures-text-and-methodology.html>.
- Validation of a dissolution method with RP-HPLC analysis for perindopril erbumine and indapamide combination tablet. Chem. Ind. Chem. Eng. Q. 2012;18:19-25.
- [Google Scholar]
- Development and validation of a stability-indicating assay method for simultaneous determination of perindopril and indapamide in combined dosage form by reversed-phase high-performance liquid chromatography. J. AOAC Int.. 2010;93:108-115.
- [Google Scholar]
- The use of experimental design in the development of an HPLC-ECD method for the analysis of captopril. Talanta. 2011;83:1037-1049.
- [Google Scholar]
- Analysis of the angiotensin-converting enzyme inhibitors perindopril, lisinopril, and quinapril by HPLC. Pharm. Chem. J.. 2011;44:619-623.
- [Google Scholar]
- A quality-by-design methodology for rapid LC method development, part II. LC-GC N. Am.. 2009;27:48-61.
- [Google Scholar]
- A liquid chromatographic ion-pairing method for simultaneous determination of benazepril hydrochloride, fosinopril sodium, ramipril and hydrochlorothiazide in pharmaceutical formulations. Chromatographia. 2001;53:S271-S275.
- [Google Scholar]
- Moffat A.C., Osselton M.D., Widdop B., eds. Clarke’s Analysis of Drugs and Poisons (fourth ed.). London: Pharmaceutical Press; 2011. (pp. 1105; 1493–1494(1579–1580), 1995, pp. 1327–1328–1996)
- Expanding the term “Design Space” in high performance liquid chromatography (I) J. Pharm. Biomed. Anal.. 2011;56:874-879.
- [Google Scholar]
- A selective reverse phase HPLC method for simultaneous determination of perindopril and indapamide in solid dosage form and bulk drug. J. Pharm. Res.. 2011;4:2512-2513.
- [Google Scholar]
- Square wave voltammetric determination of the angiotensin-converting enzyme inhibitors cilazapril, quinapril and ramipril in pharmaceutical formulations. II Farmaco.. 2003;58:343-350.
- [Google Scholar]
- Development, estimation and validation of lisinopril in bulk and its pharmaceutical formulation by HPLC method. E-J. Chem.. 2012;9:340-344.
- [Google Scholar]
- Reversed phase liquid chromatographic method development in analytical quality by design frame work. J. Liq. Chromatogr. Related Technol. 2013
- [CrossRef] [Google Scholar]
- Roy, V., 2007. Autacoids: angiotensin, plasma kinins (Online). Available from: <http://nsdl.niscair.res.in/bitstream/123456789/743/1/revised+autacoids+angiotensin.pdf>.
- Sánchez-Borges, M., 2014. World allergy organization. Discussion on ACEI. Available from: <http://www.worldallergy.org/ask-the-expert/answers/ace-inhibitors-mario-sanchez-borges>.
- UV derivative spectrophotometric and RP-HPLC methods for determination of imidapril hydrochloride in tablets and for its stability assessment in solid state. Acta Pol. Pharm.. 2011;68:645-651.
- [Google Scholar]
- Association between angiotensinogen, angiotensin-II receptor genes, and blood pressure response to an angiotensin-converting enzyme inhibitor. Circulation. 2007;115:725-732.
- [Google Scholar]
- Simultaneous determination of captopril and statins in API, pharmaceutical formulations and in human serum by RP-HPLC. J. Chin. Chem. Soc. (Taipei, Taiwan).. 2010;57:378-383.
- [Google Scholar]
- RP-HPLC method for simultaneous determination of captopril and diuretics: application in pharmaceutical dosage forms and human serum. J. Chromatogr. Sep. Techn.. 2011;2:109.
- [Google Scholar]
- RP-HPLC method for the simultaneous determination of lisinopril and NSAIDs in API, pharmaceutical formulations and human serum. Am. J. Anal. Chem.. 2012;3:147-152.
- [Google Scholar]
- Multicriteria optimization methodology in development of HPLC method for simultaneous estimation of Indapamide and Perindopril in bulk drug and its combined dosage form. Asian J. Pharm. Clin. Res.. 2012;5(Suppl. 2):50-53.
- [Google Scholar]


