

Translate this page into:
Elimination of crystal violet from aqueous solution by adsorption on naturel polysaccharide: Kinetic, isotherm, thermodynamic studies and mechanism analysis
⁎Corresponding author. f.boukhlifi@umi.ac.ma (Fatima Boukhlifi)
-
Received: ,
Accepted: ,
This article was originally published by Elsevier and was migrated to Scientific Scholar after the change of Publisher.
Peer review under responsibility of King Saud University.
Abstract
The colored discharges from certain tanning industries into aquatic environments are too heavy with violet crystal; these discharges have recently become a significant environmental problem. The objective of this work is to find an effective method to stop the propagation of these micropollutants in water. Although various treatment techniques have been tested, they are often ineffective in treating these micropollutants. This study focuses on optimizing the parameters involved in the adsorption process of crystal violet (CV) using crude chitin (RC). It was found that a mass of 0.08 g of RC can effectively retain CV. Modeling of the experimental results indicated that the adsorption kinetics of CV onto raw chitin follows pseudo-second-order kinetics at the temperatures studied, and the intra-particle diffusion was not only the rate controlling step. After 80 min of contact, a saturation of the surface is obtained. The Freundlich model describes adsorption isotherms. The adsorbed quantities increase when the pH goes from 4 to 12. The thermodynamic study showed that the adsorption of CV on RC is spontaneous (ΔG° < 0) and endothermic (ΔH° > 0). The value of pHpzc is located at pHpzc = 8.4. Characterization of the raw chitin surface by FTIR, XRD, DTA/TGA and SEM/EDS before and after contact with CV shed light on the nature of interactions between CV and RC.
Keywords
Adsorption
Raw chitin
Crystal violet
Wastewater

1 Introduction
Dyes play a significant role in water contamination, their presence in the ecosystem generating an aesthetic pollution. The dyes are little biodegradable, their discharge in the aquatic system reduces the penetration of the light and therefore caused a harmful effect on the photosynthesis (Hernández-Zamora and Martínez-Jerónimo, 2019), moreover the soft dyes degrading and gives carcinogenic (Hisaindee et al., 2013), teratogenic and mitogenic products (Ma et al., 2022). Consequently, the elimination of these organic substances from the aqueous environment will be necessary for the treatment of the water as well as for the eventual reuse of these non-conventional waters.
The treatments carried out to remove the dyes include filtration (Kali et al., 2022a, 2022b; 2022c; Laasri et al., 2007), oxidation (Nidheesh et al., 2018) coagulation-flocculation (Le et al., 2020), precipitation chemical (Lee et al., 2011), ion exchange (Erdem et al., 2004), catalysis (Abd El-Monaem et al., 2023; Eltaweil et al., 2023a)and adsorption, this adsorption is the subject of our work, it is an effective method for the removal of dyes from aqueous phases due to its ease of use, low cost, insensitivity to toxic substances (Sheibani et al., 2021), handling of dyes in concentrated form, and the possibility of reusing used sorbents by regeneration (Leiviskä et al., 2019). However, research in recent years has focused on the use of environmentally friendly materials as potential adsorbents (Boukhlifi and Bencheikh, 2000; Hammou et al., 2014; Varghese et al., 2019). For these reasons, in the present work, we have chosen the potentiality of raw chitin in the depollution of water loaded with dyes. The raw chitin is produced from the waste coming from the consumption of shellfish and from the industrial transformation of mushrooms (Iber et al., 2022). This polymer knows a considerable development today thanks to its structure which offers them the quality of biodegradable and biocompatible material and not toxic what allowed to widen their use in various fields such as the, medicine (Ahmad et al., 2020; Hossin et al., 2021), the pharmaceutical industry (Hossin et al., 2021), the treatment of water and the development of nanomaterials (Hossin et al., 2021).
Crystal violet, also known as gentian violet, is a cationic dye that provides a violet hue in aqueous solution (Haki et al., 2022; Rehman and Majeed, 2022). It has various applications in the textile industry, as well as in the creation of paints and printing inks (Mittal et al., 2010; Senthilkumaar et al., 2006). Unfortunately, crystal violet has carcinogenic properties and is considered a difficult molecule to manage due to its resistance to degradation by microbes and its ability to persist in various environments (Chakraborty et al., 2011). This dye is toxic to mammalian cells (Franco et al., 2020), and has been proven to be a mutagen, a mitotic poison, and a potent carcinogen. In addition, it causes moderate eye irritation and can lead to permanent damage to the cornea and conjunctiva. Breathing in crystal violet can result in respiratory tract irritation, along with symptoms such as vomiting, diarrhea, headache, dizziness, and pain. Prolonged exposure can harm mucous membranes and the gastrointestinal tract.
In the present work, raw chitin was used to remove CV from aqueous solutions in batch experiments. The effects of contact time, initial pH value of the solution, the quantity of raw chitin, and temperature on the adsorption of this pollutant were studied to identify both the kinetic models and the adsorption isotherm models of CV on raw chitin. It was characterized by Fourier transform infrared (FTIR) spectroscopy, X-ray diffraction (XRD), Differential Thermal and Gravimetric Analysis (DTA/TGA), and Scanning Electron Microscopy (SEM/EDS).
2 Materials and methods
2.1 Preparation and characterization of raw chitin
The preparation of raw chitin was performed from shrimp shells that are collected from fish markets. The raw material underwent multiple washing cycles using distilled water at 60 °C to eliminate the impurities. It was then dried in an oven at 80 °C for an entire night and finely ground and sieved to a particle size smaller than 160 µm.
2.2 Characterization of the adsorbent
To analyze and characterize the solid resulting from the various preparations and experiments, carried out during this work, several instrumental techniques were used namely FTIR, XRD and SEM for the observation of the surface morphology of the raw chitin.
The chemical groups present on the surface are determined by Fourier transform infrared spectroscopy (FTIR). The samples were prepared from a mass m = 5 mg of the solid diluted in 95 mg KBr. The mixture (solid/KBr) is finely ground by an agate mortar and then pressed under a pressure of 4 tons with a pelletizer to form a fine pellet. This is then placed in the path of the IR beam. Potassium bromide being transparent in the infrared range (4000 to 400 cm−1), the absorption bands recorded are due only to the solid analyzed. All the spectra are recorded with a resolution of 4 cm−1 and a number of scans equal to 64 using a Schimadzu JASCO 4100 instrument.
The surface morphology and chemical composition of the raw chitin were analyzed by scanning electron microscopy (SEM) combined with an energy dispersive analysis (EDS) system (FEI Quanta 200 Brand). energy dispersive analysis (EDS) system (FEI Quanta 200 brand).
The pHPZC was determined by the solid addition method (Bakatula et al., 2018). 50 ml of 0.01 M NaCl solution was placed in bécher and the initial pH was adjusted to a value between 2 and 12 with HCl (0.1 M) or NaOH solutions. 1 g of the solid was then added to each vial and the final pH of the solutions was measured after 24 h. The pH value of PZC can be determined from the curve of pHf - pHi f(pHi) (with pHf as the final pH value) that intersects the initial pH line (pHi).
2.3 Preparation of the adsorbate
The adsorption experiments are performed at a temperature (T = 25 °C) and pH = 10 and in batch mode. Introduce 0.08 g of raw chitin in a bottle containing 20 ml of CV solution of initial concentration C0 of 30 mg/l. the mixture is placed in a thermostat bath to stabilize the temperature. After each contact time the mixture was centrifuged at 3000 rpm for 10 min, then the solid was separated from the solution by filtration through a microporous filter. The filtrate was analyzed by UV–visible spectrophotometry (Shimadzu, UV-1800) at λ = 590 nm. The concentration of the dye in contact time with the solid was calculated using a calibration curve prepared from known concentrations of CV. The removal rate (Rt(%)) of CV and the amount adsorbed onto the surface of raw chitin (qt (mg/g)) were determined using the following equations:
Qt: adsorption capacity (mg/g)
C0: initial concentration of CV (mg/L)
Ce: residual concentration of CV (mg/ L)
m: mass of adsorbent (g)
V: volume of the solution of CV (L)
2.4 Modeling of adsorption
2.4.1 Kinetics of adsorption
Several models were used to analyze the adsorption process in the instance of CV/raw chitin contact since they gave data on the adsorption rate, utilizing three models, the adsorption kinetics of CV on raw chitin was investigated, namely the pseudo-first order (PFO) model (Loulidi et al., 2021), the pseudo-second order (PSO) model (Wang and Guo, 2020), and intraparticle diffusion (Weber and Morris, 1963):
qe: the estimated amount of adsorption that has reached an equilibrium is measured in (mg/g)
K1: the constant rate of adsorption for PFO, measured in (min−1)
K2: the constant rate of adsorption for PSO, measured in (g/mg-min)
Kint: the constant rat of intraparticle diffusion
Ci: thickness of the boundary layer in (mg/g).
2.4.2 Adsorption isotherm
Adsorption isotherms are curves that represent the adsorbed quantity (qe) as a function of the residual concentration of the adsorbate (Cres) at the adsorption equilibrium and at a constant temperature. The curves obtained depend on several parameters, linked to both the texture of the solid and the both to the texture of the solid and to the nature of the adsorbate. The adsorption isotherms have been studied using the following isothermal models: Langmuir equation (Al-Mulla and Al-Sagheer, 2013; de Britto and Campana-Filho, 2007), and the Freundlich equation (Kumar et al., 2019):
KL: The constant that represents the adsorption at equilibrium, also known as the Langmuir constant, is represented in (L/mg).
qe: The estimated amount of adsorption that has reached an equilibrium is measured in (mg/g)
Ce: The level of the adsorbent in the liquid phase at the point of balance (mg/l).
qm: The maximum adsorption capacity for a monolayer (mg/g).
KF: Freundlich constant characterizing the adsorbent power of the solid in (mg.g−1) (L.mg−1)1/n.
2.4.3 Thermodynamic study
The determination of the thermodynamic parameters is very important, as it provides information about the energetic changes that occur in the adsorption process. The values of the standard thermodynamic parameters such as: free energy (ΔG°), enthalpy (ΔH°) and entropy (ΔS°), were determined from the effect of temperature on the adsorption, using the Van't Hoff equation (Anastopoulos and Kyzas, 2014). The applied equations are as follows.
ΔG°: variation of the standard free enthalpy (kJ/mol):
ΔH°: variation of the standard enthalpy (kJ/mol)
ΔS°): variation of the standard entropy (J/mol.K)
With Kc = Cads/Crés
Kc: equilibrium constant; Cads and Ce (mg/L) are respectively the adsorbed and the residual concentrations at equilibrium.
R: the perfect gas constant (8.314 J/mol K)
3 Results and discussion
3.1 Absorbent characterization
3.1.1 Analysis using Fourier transform infrared spectrometry (FTIR)
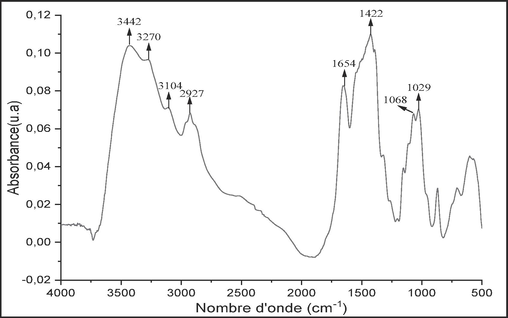
The spectrum in Fig. 1 represents the different bands detected in raw chitin. The distinct bands shown are attributed to vibrations of (C—H), (C⚌O) and (O—H) groups, indicating that raw chitin is composed of acetylated hydrocarbon chains, calcite and proteins. The specific chemical groups of raw chitin are listed below.
-
The peaks at 3442, 3270 and 3104 cm−1 correspond to the —NH2 and —OH stretches involving hydrogen bonding to raw chitin (Wang et al., 2013).
-
The peak at 2927 cm−1 corresponds to the —CH and —CH2 stretches (Zaku et al., 2011).
-
The peak at 1654 cm−1 is characteristic of amide I (Wang et al., 2010).
-
Peak at 1422 cm−1 corresponds to the —CH variant.
-
Peaks at 1068 cm−1, at 1029 corresponding to the C—O—C elongation vibration of the glycosidic ring (Zaku et al., 2011).
- FTIR spectrum of raw chitin.
3.1.2 X-ray diffraction analysis
X-ray diffraction analysis of raw chitin, shown in Fig. 2, indicates the presence of a crystalline phase by the presence of characteristic peaks.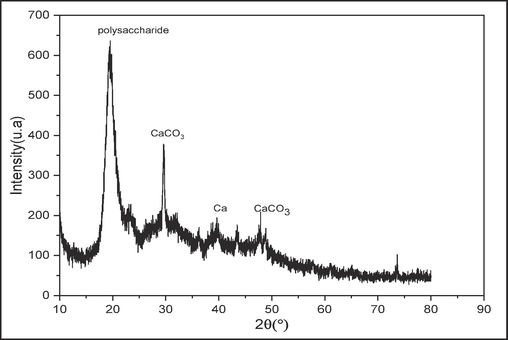
X-ray diffractogram of raw chitin.
The figure shows two major crystalline peaks at 2θ = 19.4° and 29.5° and a minor peak consistent with published data (Altıntıg et al., 2022; Kumari et al., 2017). These peaks were attributed to the GlcNAc (acetylglucosamine) and GlcN (glucosamine) sequences in raw chitin and planar reflections [1 1 0] and [1 3 0], respectively, confirming the partial crystallinity of this polymer. We also note the presence of a mineral part consisting of calcite crystallized in the form of calcite and syn calcite at 2θ = 30° and at 2θ = 50°.
3.1.3 Differential thermal and Gravimetric analysis (DTA/TGA)
The thermogravimetric analysis of raw chitin is presented in Fig. 3. The thermogram shows three decomposition stages where the sample experiences mass losses. In the temperature range of 30 °C to 100 °C, a 10 % mass loss is attributed to the evaporation of physisorbed water. The second mass loss, observed between 227 °C and 436 °C, accounts for 56 % and is attributed to the degradation of polymer chains and glycosidic bond breakdown. The third stage, occurring between 436 °C and 600 °C with a 28.7 % mass loss, is attributed to the thermal degradation of the pyranose ring and the decomposition of residual carbon.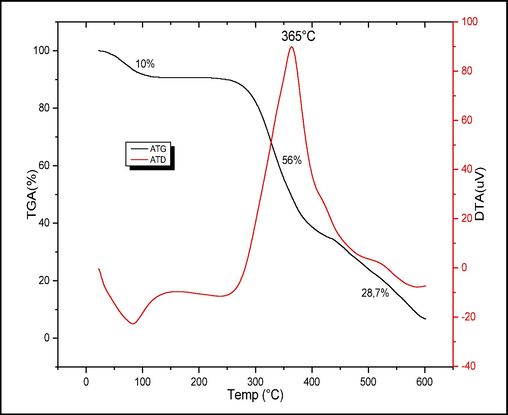
Analysis (DTA/TGA) of raw chitin.
A previous study on the kinetics and mechanism of thermal degradation of biopolymers chitin and chitosan through thermogravimetric analysis also revealed weight losses in three stages, which is consistent with the results of our work (Moussout et al., 2016).
The corresponding DTA (Differential Thermal Analysis) curve (Fig. 3) exhibits an exothermic peak appearing at 365 °C, corresponding to the degradation of amine (GlcN) and acetyl (GlcNAc) groups.
3.1.4 Scanning electron microscopy SEM/EDS
Scanning electron microscopy analysis of the prepared raw chitin in Fig. 4 was performed to obtain additional information about its morphology. The surface of RC, as seen in the SEM image, is composed of layered fibers and noticeable rods. Fig. 4 shows that the surface is smooth and without pores where the adsorbate can insert, indicating that adsorption on the surface takes place through chemical interactions between the surface functionalities of the adsorbent and the adsorbate.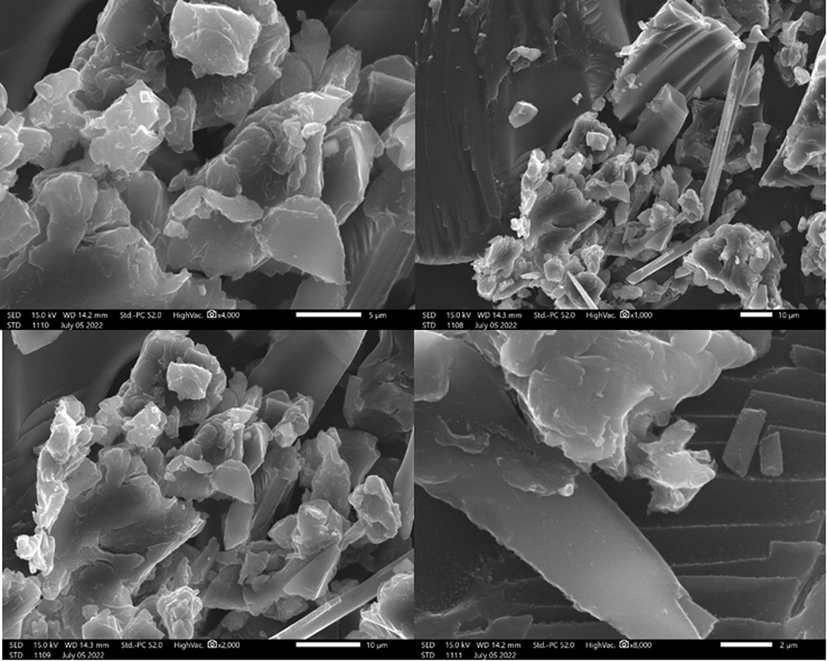
SEM images of raw chitin.
Simultaneous chemical analysis, in energy dispersion (EDX), Fig. 5 shows the appearance in the spectrum of raw chitin, taken as an example, of intense peaks of C, Ca and Al. This chemical composition confirms that the polymer used is raw, and contains a mineral part which is CaCO3 in the form of two varieties: calcite and syn,calcite.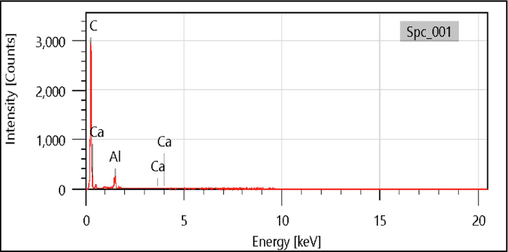
EDS spectrum of raw chitin.
3.1.5 Determination the pH at the point of zero charge (pHPZC)
The curve in Fig. 6 shows the evolution of pHi-pHf as a function of pHi for raw chitin. The pH point of zero charge is determined by the point where the curve intersects with the linear line pHi-pHf = pHi. The value of pHpzc is located at pHpzc = 8.4 which indicates that the net charge of the surface of raw chitin is positive for pH below pHpzc and negative for pH above pHpzc.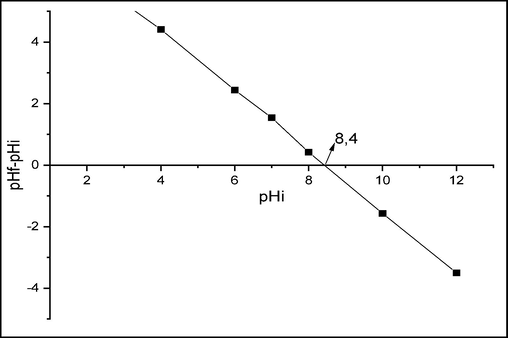
Point zero charge for raw chitin.
3.2 Adsorption of CV on raw chitin
3.2.1 Effect of adsorbent mass
The impact of the adsorbent amount was studied within the range of 0.01 g to 0.09 g, for an initial CV concentration of 9.10-5 mol/L. The graph in Fig. 7 demonstrates that using 0.08 g of raw chitin leads to the removal of 80 % of the dye. These results are in good agreement with a previous study concerning the effect of raw chitin mass on malachite green adsorption (Jabri et al., 2023). On the other hand, increasing the adsorbent quantity while keeping the volume and CV concentration constant results in the non-saturation of adsorption sites, leading to a reduction in the equilibrium adsorption capacity, decreasing from 32.6 to 7.3 mg/g. Furthermore, the increased accumulation of the adsorbent, causing a decrease in the exposed surface area, also leads to a reduction in the adsorption capacity value (Eltaweil et al., 2023b).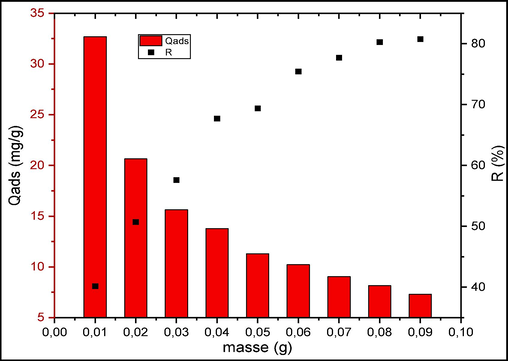
Effect of adsorbent mass on CV adsorption.
3.2.2 Effect of pH
Fig. 8 shows the evolution of pollutant removal as a function of pH. The experimental results show that the quantities of CV adsorbed by raw chitin depend on the pH of the solution. Indeed, the adsorbed quantities increase when the pH goes from 4 to 12. To better understand the effect of pH on the surface charge of the adsorbent, the pH point of zero charge (pHPZC) was determined. The pHPZC for raw chitin was found to be 8.4, which means that the overall surface charge is positive for solutions with pH below 8,4 and negative for those with pH above 8,4.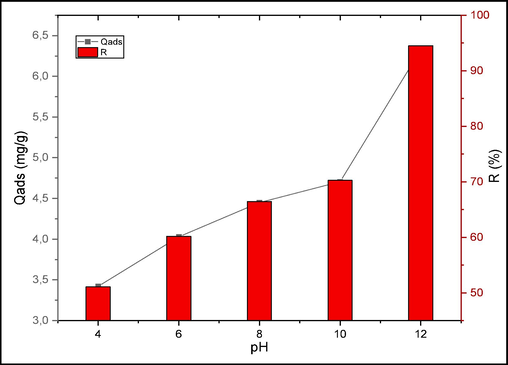
Effect of pH on CV adsorption.
3.2.3 Adsorption kinetics of CV on raw chitin
The plot in Fig. 9 demonstrates the kinetic of CV adsorption onto raw chitin. The adsorption amount increases significantly within the first 30 min of contact. This is related to the existence of available active sites on the solid at the start of the experiment. After 80 min of contact, a saturation of the surface is obtained.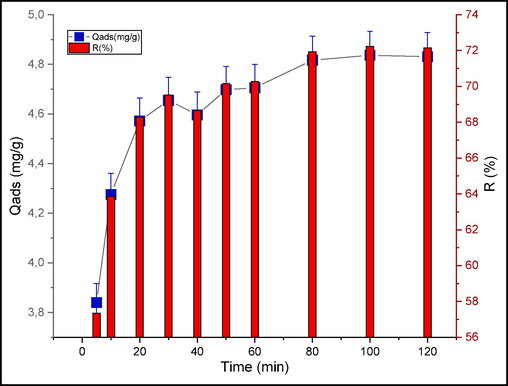
Impact of contact time on CV adsorption.
3.2.3.1 Modeling of adsorption kinetics
Several kinetic models were used to interpret the experimental data. This modeling allows to determine information on the kinetic parameters involved in the adsorption process. Thus, three kinetic models were employed: pseudo-first-order (PFO), pseudo-second-order (PSO) and intraparticle diffusion.
The best model established for the study of adsorption kinetics is chosen according to the correlation factor. The closer this factor is to 1 the more favorable the model is to validate the adsorption process.
The models performed are shown in Figs. 10 to 12 and the kinetic parameters obtained from the different models are collected in Tables 1 and 2.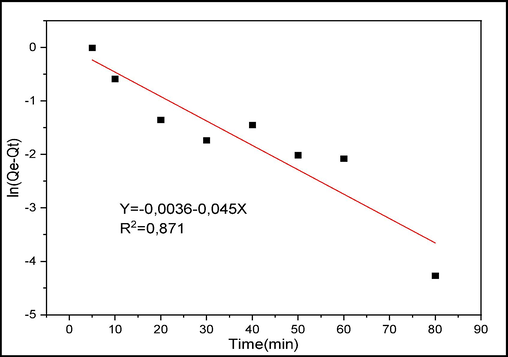
PFO model for CV adsorption.
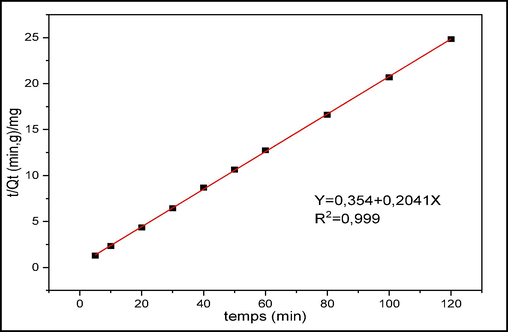
PSO model for CV adsorption.
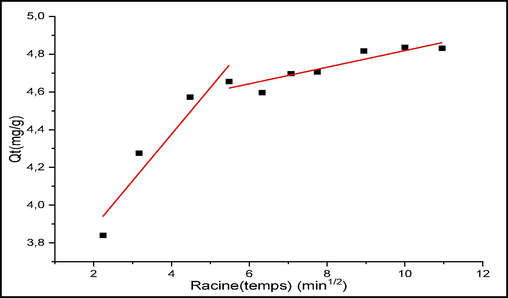
Intra-particle diffusion model for CV adsorption.
Solid
Qexp
Lagergren
Ho and Coll
K1
Qcal
R2
K2
Qcal
R2
(mg/g)
(min−1)
(mg/g)
–
(g/mg.min)
(mg/g)
–
Raw Chitin
4,830
−0,045
0,996
0,871
0,204
4,898
0,999
Solid
Weber et Morris
1st right
2nd right
Kint
C1
R2
Kint
C2
R2
(mg/g.min1/2)
--
--
(mg/g.min1/2)
--
--
Raw chitin
0,246
3,388
0,913
0,043
4,379
0,845
3.2.3.1.1 Pseudo first order kinetic models
The first model studied is the pseudo first order model described by Lagergren. Table 1 shows that the amount of adsorption calculated from this model differs from that obtained experimentally and the correlation coefficient is far from 1, which shows that this model cannot be used to describe the kinetics of adsorption of CV on raw chitin.
3.2.3.1.2 Pseudo-second order model
The experimental data are treated according to the pseudo second order model. This model corresponds to two steps in the adsorption process. Fig. 11 represents the linear regression of this model. Table 1 shows the parameters deduced from this kinetic model. We note that this model leads to a straight line with a correlation factor R2≈1. Thus, this pseudo-second order model better describes the adsorption process of CV on raw chitin. The analysis of the kinetic data shows that the adsorbed amount calculated by this model is closer to the experimentally adsorbed amount. This result is comparable to what has been found in other studies (Streit et al., 2019; Zhou et al., 2018).
3.2.3.1.3 Intra-particle diffusion model
The Fig. 12 showed intra-particle diffusion model for CV adsorption. The transfer of a solute from an aqueous solution to a solid surface typically consists of four steps, which can occur independently or simultaneously. The first step is the movement of the solute from the aqueous phase to the solid surface. The second step involves diffusion through the spaces between particles (external diffusion). The third step includes intraparticle diffusion, and finally, the adsorption of the solute onto the surface of the adsorbent and its active groups. Agitation can control the first step, while the last stage is relatively rapid, suggesting that diffusion processes are the most likely limiting factors that control the adsorption process (Aboua et al., 2015; Annadurai et al., 2008).
From Fig. 12, it can be seen that there are two different steps in the process of diffusion of CV to sites on the surfaces of the raw chitin. The first part of the curve, which is fast, corresponds to the movement of the molecules to the outer surface of the solid. The second step (slow) signifies the adsorption balance where the interaction occurs.
If intra-particle diffusion were the determining step in the adsorption process, then the corresponding line should pass through the origin. This case is not verified on the plots of Fig. 12, thus, the intra-particle diffusion is not the only step among the above mentioned steps that controls the adsorption rate of CV on raw chitin (Fabbricino and Pontoni, 2016; Loulidi et al., 2023). The various parameters deduced from this modeling are grouped in Table 2.
3.2.4 Adsorption isotherm of CV on raw chitin
In order to complete the study of the adsorption of CV on raw chitin, adsorption isotherms were determined at T = 25 for different concentrations of CV. The interest of using Freundlich and Langmuir models is to obtain information on the nature of the isotherm, the maximum adsorption capacity, the possible interactions between the adsorbate and the polymer. These isotherms are represented by Fig. 13. They show that the adsorption isotherms of CV on raw chitin are different. Their modelling from the linear equations of the following Langmuir and Freundlich models, confirm this difference. Indeed, the experimental points are approximately reproduced by the Freundlich model. On the other hand, the representation of the Langmuir model considered leads to a curve that does not pass through the majority of the experimental points. The parameters deduced from these models are collected in Table 3. The values in Table 3 show that the correlation coefficient R2 for the Freundlich model is closer to 1. This leads to the conclusion that the Freundlich model describes the experimental results of the adsorption equilibrium of CV on raw chitin in a better way, which is consistent with studies by Arumugam et al, and Salamat et al. (Arumugam et al., 2019; Salamat et al., 2019).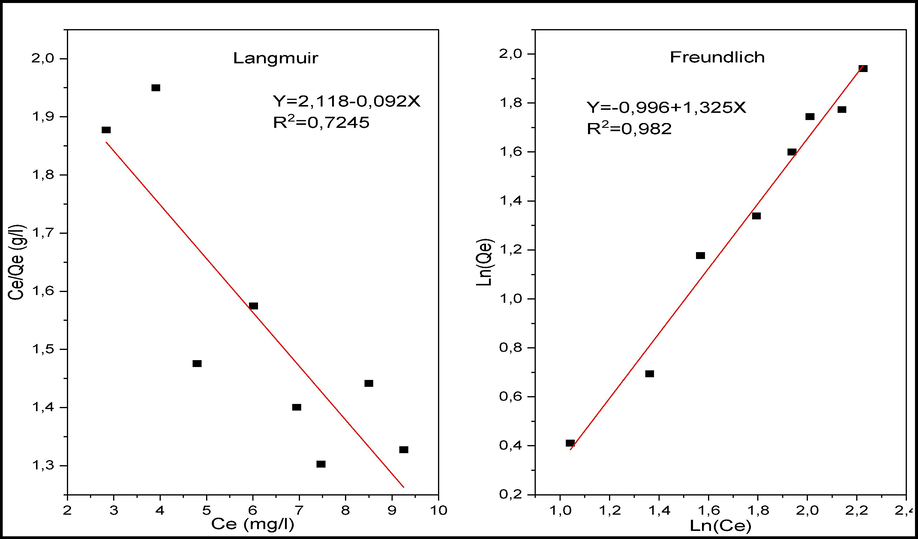
Linear regression of CV adsorption isotherms on raw chitin: Langmuir and Freundlich models.
Parameters
Langmuir
Freundlich
qm
KL
R2
KF
N
R2
Values
−10,80
−0,196
0.724
0,368
0,754
0,982
3.2.5 Thermodynamic study
The thermodynamic study is shown as a plot of Ln(K) against 1/T, where T represents temperature (Fig. 14). The Table 4 groups the thermodynamic parameters. The exothermic nature of the adsorption process on raw chitin is indicated by the negative value of ΔH°. The spontaneous nature of the CV adsorption process is indicated by the negative values of ΔG°. The positive value of ΔS° signifies that the CV adsorption at the solid/liquid interface is disordered. Identical results to those found by Daneshvar et al for adsorption of acid blue 25 dye by shrimp shell (Daneshvar et al., 2014), and by Streit et al in their work on the removal of CV on activated carbon (Streit et al., 2019).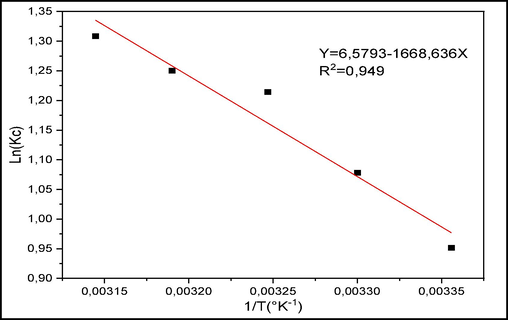
Right of the Van't Hoff equation for CV adsorption.
Solid
T (K−1)
ΔS° (J/K.mol)
ΔH° (kJ/mol)
ΔG° (kJ/mol)
Raw Chitin
298
0,791
−200,702
−436.420
303
−440.375
308
−444.330
313
−448.285
318
−452,240
3.3 Mechanism of crystal violet adsorption
In order to understand the adsorption mechanism of crystal violet on raw chitin, FTIR analyses of the solid before and after FTIR analyses of the solid before and after their contacts with the crystal violet were performed. Fig. 15 presents the FTIR spectra obtained in the case of raw chitin and raw chitin loaded with CV. Fig. 16 presented proposed mechanism for CV adsorption on raw chitin. The comparison between the two FTIR spectra reveals no new bands nor the disappearance of previously detected bands in raw chitin alone. The only change noticed is the variation in the strength of certain absorption bands. Indeed, the decrease of the broad band located between 3442 and 3104 cm−1 corresponds to the elongation vibration of the (OH) and (—NH—) bands, which suggests the implication of the hydrogen bond, between the hydroxyl groups of the surface of the raw chitin and the nitrogen atoms of the CV, in the adsorption mechanism. On the other hand, the bands at 1654 cm−1 (Amide1), 1422 cm−1 (—CH—) are decreasing after CV adsorption, which indicates that the CV ions adsorb onto the amide sites by means of weak binding. Indeed, at acidic pH, the amide (—CH3CONH—) and OH groups, initially neutral in CS, become positively charged in the (—CH3CONH+3) and (OH2+) forms, which favors their electrostatic interaction with the negatively charged CV species (Loulidi et al., 2020a; Loulidi et al., 2020b; Loulidi et al., 2023).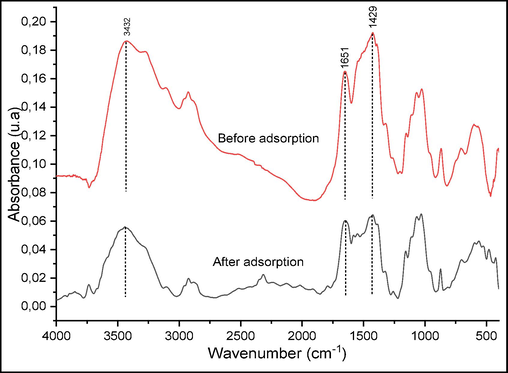
FTIR spectra of raw chitin before and after CV adsorption.
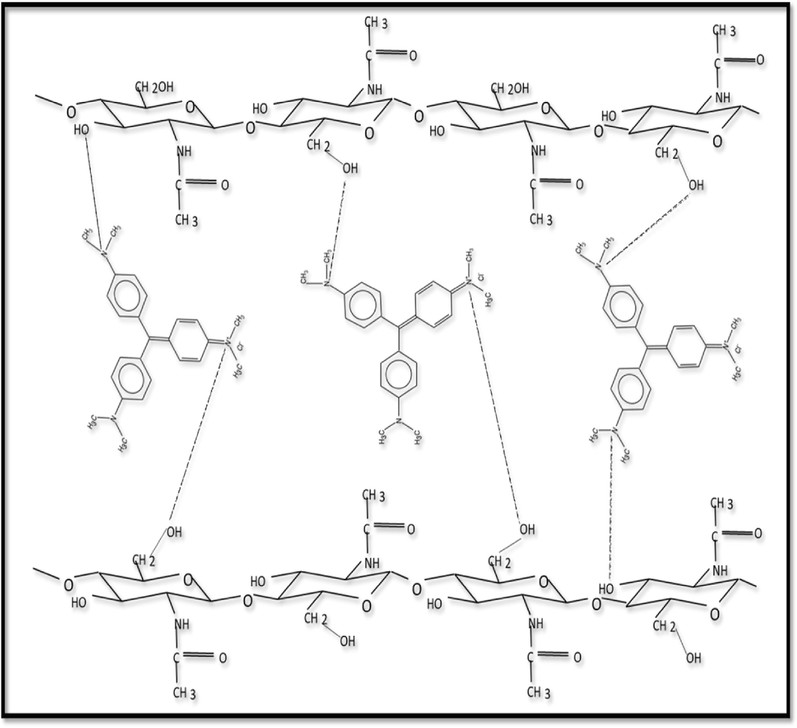
proposed mechanism for CV adsorption on raw chitin.
On the other hand, at acidic pH, the amide groups (—COONH2) and OH, initially neutral in raw chitin, become positively charged as (—COONH3+) and (OH2+), respectively, which promotes their electrostatic interaction with the nitrogen atoms of CV, negatively charged in the adsorption mechanism.
Fig. 17 shows the XRD diffractograms of the raw chitin before and after adsorption of the crystal violet. It is observed that the major peaks originally present in the uncharged solid undergo a substantial decrease in their intensities. In addition, new low intensity lines appeared in the diffractogram of crystal violet charged chitin, indicating a CV adsorption process on the surface of raw chitin with a modification of its structure. The mineral part does not contribute to the adsorption of CV because the peak positions remain unchanged.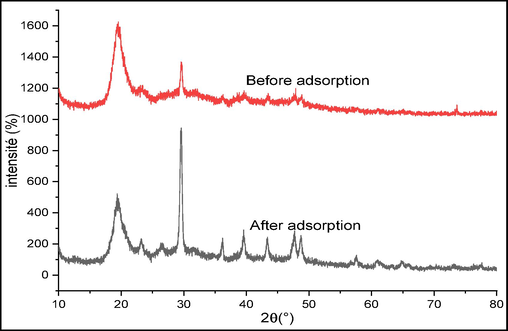
Diffractograms of raw chitin before and after CV adsorption.
4 Conclusions
In this study, raw chitin derived from shrimp shells was evaluated to determine its ability to eliminate CV from aqueous solutions. The results of the study on the impact of operating conditions showed that 0.08 g/20 ml of raw chitin was able to remove 80 % of CV from a solution with an initial concentration of 9.10-5 mol/L at a pH of 10. The equilibrium time was achieved after 80 min. The Freundlich isotherm model was used to accurately depict the equilibrium adsorption data, and the kinetic data were well fitted by the pseudo-second order model.
Furthermore, the results of the intraparticle diffusion model analysis showed that the adsorption of crystal violet is not solely limited by intraparticle diffusion and involves two steps.
The free energy (ΔG°), enthalpy (ΔH°) values being negative indicate that the adsorption process is spontaneous and exothermic, while the positive value of entropy (ΔS°) shows a random and disordered character of the adsorption of the crystal violet on the surface of the raw chitin without any modification of its structure, the pHpzc value is located at pHpzc = 8,4. Hence, raw chitin has the potential for effective use in various adsorption applications such as adsorption of cationic and anionic dyes.
Among the perspectives we plan to investigate to develop this research work, we mention:
Study of potential reusability of this adsorbent material.
Testing of this material used in the photocatalytic degradation of certain dyes in the presence of lamps and solar radiation.
Declaration of competing interest
The authors declare that they have no known competing financial interests or personal relationships that could have appeared to influence the work reported in this paper.
References
- A comprehensive review on LDH-based catalysts to activate persulfates for the degradation of organic pollutants. NPJ Clean Water 2023
- [CrossRef] [Google Scholar]
- Investigation of dye adsorption onto activated carbon from the shells of Macoré fruit. J. Environ. Manage.. 2015;156
- [CrossRef] [Google Scholar]
- Chitin and its derivatives: Structural properties and biomedical applications. Int. J. Biol. Macromol. 2020
- [CrossRef] [Google Scholar]
- Determination of kinetic parameters for the degradation of chitosan/silica hybrid nano composites. J. Polym. Environ.. 2013;21
- [CrossRef] [Google Scholar]
- Artificial neural network mathematical modeling of methyl violet removal with chitosan-coated clinoptilolite. Desalination Water Treat. 2022;250
- [CrossRef] [Google Scholar]
- Agricultural peels for dye adsorption: a review of recent literature. J. Mol. Liq. 2014
- [CrossRef] [Google Scholar]
- Adsorption of reactive dye from an aqueous solution by chitosan: isotherm, kinetic and thermodynamic analysis. J. Hazard. Mater.. 2008;152
- [CrossRef] [Google Scholar]
- Removal of malachite green from aqueous solutions using a modified chitosan composite. Int. J. Biol. Macromol.. 2019;128
- [CrossRef] [Google Scholar]
- Determination of point of zero charge of natural organic materials. Environ. Sci. Pollut. Res.. 2018;25
- [CrossRef] [Google Scholar]
- Caracterisation des biosorbants naturels utilises pour la depollution des eaux usees. Ann. Chim. Sci. Mat.. 2000;25:153-160.
- [CrossRef] [Google Scholar]
- Adsorption of Crystal Violet from aqueous solution onto NaOH-modified rice husk. Carbohydr. Polym.. 2011;86
- [CrossRef] [Google Scholar]
- Shrimp shell as an efficient bioadsorbent for Acid Blue 25 dye removal from aqueous solution. J. Taiwan Inst. Chem. Eng.. 2014;45
- [CrossRef] [Google Scholar]
- Kinetics of the thermal degradation of chitosan. Thermochim Acta. 2007;465
- [CrossRef] [Google Scholar]
- Magnetic hierarchical flower-like Fe3O4@ZIF-67/CuNiMn-LDH catalyst with enhanced redox cycle for Fenton-like degradation of Congo red: optimization and mechanism. Environ. Sci. Pollut. Res.. 2023;30
- [CrossRef] [Google Scholar]
- Phosphate removal by Lanthanum-doped aminated graphene oxide@aminated chitosan microspheres: Insights into the adsorption mechanism. J. Clean. Prod.. 2023;385
- [CrossRef] [Google Scholar]
- The removal of heavy metal cations by natural zeolites. J. Colloid Interface Sci.. 2004;280
- [CrossRef] [Google Scholar]
- Use of non-treated shrimp-shells for textile dye removal from wastewater. J. Environ. Chem. Eng.. 2016;4
- [CrossRef] [Google Scholar]
- A mass transfer study considering intraparticle diffusion and axial dispersion for fixed-bed adsorption of crystal violet on pecan pericarp (Carya illinoensis) Chem. Eng. J.. 2020;397
- [CrossRef] [Google Scholar]
- Efficient removal of crystal violet dye from aqueous solutions using sodium hydroxidemodified avocado shells: kinetics and isotherms modeling. Water Sci. Technol.. 2022;85
- [CrossRef] [Google Scholar]
- Bentonite/chitosan biocomposite as an adsorbent for hexavalent chromium from aqueous solutions. J. Adv. Chem.. 2014;10:2786-2795.
- [CrossRef] [Google Scholar]
- Congo red dye diversely affects organisms of different trophic levels: a comparative study with microalgae, cladocerans, and zebrafish embryos. Environ. Sci. Pollut. Res.. 2019;26
- [CrossRef] [Google Scholar]
- Application of LC-MS to the analysis of advanced oxidation process (AOP) degradation of dye products and reaction mechanisms. TrAC - Trends Analytical Chem. 2013
- [CrossRef] [Google Scholar]
- A review of polymeric chitin extraction, characterization, and applications. Arabian J. Geosci. 2021
- [CrossRef] [Google Scholar]
- A review of various sources of chitin and chitosan in nature. J. Renew. Mater. 2022
- [CrossRef] [Google Scholar]
- Valorization of lignocellulosic wastes material for efficient adsorption of a cationic azo dye and sludge recycling as a reinforcement of thermoplastic composite. Fluids. 2023;8:37.
- [CrossRef] [Google Scholar]
- Efficient adsorption removal of an anionic azo dye by lignocellulosic waste material and sludge recycling into combustible briquettes. Colloids Interfaces. 2022;6
- [CrossRef] [Google Scholar]
- Characterization and adsorption capacity of four low-cost adsorbents based on coconut, almond, walnut, and peanut shells for copper removal. Biomass Convers. Biorefin. 2022
- [CrossRef] [Google Scholar]
- Study of the adsorption properties of an almond shell in the elimination of methylene blue in an aquatic. Moroccan J. Chem.. 2022;10:509-522.
- [CrossRef] [Google Scholar]
- Characterization of the adsorption site energies and heterogeneous surfaces of porous materials. J. Mater. Chem. A Mater. 2019
- [CrossRef] [Google Scholar]
- Physicochemical properties and characterization of chitosan synthesized from fish scales, crab and shrimp shells. Int. J. Biol. Macromol.. 2017;104
- [CrossRef] [Google Scholar]
- Removal of two cationic dyes from a textile effluent by filtration-adsorption on wood sawdust. Environ. Sci. Pollut. Res. 2007
- [CrossRef] [Google Scholar]
- Mucilage extracted from dragon fruit peel (Hylocereus undatus) as flocculant for treatment of dye wastewater by coagulation and flocculation process. Int. J. Polym. Sci. 2020
- [CrossRef] [Google Scholar]
- Removal of malachite green by adsorption and precipitation using aminopropyl functionalized magnesium phyllosilicate. J. Hazard. Mater.. 2011;192
- [CrossRef] [Google Scholar]
- Effect of alkali regeneration on pore characteristics and performance of ferric oxyhydroxide and akaganéite sorbents. J. Water Process Eng.. 2019;31
- [CrossRef] [Google Scholar]
- Kinetic, Isotherm and mechanism investigations of the removal of basic violet 3 from water by raw spent coffee grounds. Phys. Chem. Res.. 2020;8:569-584.
- [CrossRef] [Google Scholar]
- Adsorption of crystal violet onto an agricultural waste residue: kinetics, isotherm, thermodynamics, and mechanism of adsorption. Sci. World J.. 2020;2020
- [CrossRef] [Google Scholar]
- Assessment of untreated coffee wastes for the removal of Chromium (VI) from aqueous medium. Int. J. Chem. Eng.. 2021;2021
- [CrossRef] [Google Scholar]
- Comparative study on adsorption of crystal violet and Chromium (VI) by activated carbon derived from spent coffee grounds. Appl. Sci. (Switzerland). 2023;13
- [CrossRef] [Google Scholar]
- A polysaccharide-based bioflocculant BP50-2 from banana peel waste: purification, structure and flocculation performance. Int. J. Biol. Macromol.. 2022;205
- [CrossRef] [Google Scholar]
- Adsorption of hazardous dye crystal violet from wastewater by waste materials. J. Colloid Interface Sci.. 2010;343
- [CrossRef] [Google Scholar]
- Kinetics and mechanism of the thermal degradation of biopolymers chitin and chitosan using thermogravimetric analysis. Polym. Degrad. Stab.. 2016;130
- [CrossRef] [Google Scholar]
- An overview on the removal of synthetic dyes from water by electrochemical advanced oxidation processes. Chemosphere. 2018;197
- [CrossRef] [Google Scholar]
- Biosorptive removal of crystal violet dye from aqueous solutions by Ficus religiosa leaves and Daucus carota pomace in ecofriendly way. Int. J. Phytorem.. 2022;24
- [CrossRef] [Google Scholar]
- Preparation of nanochitosan-STP from shrimp shell and its application in removing of malachite green from aqueous solutions. J. Environ. Chem. Eng.. 2019;7
- [CrossRef] [Google Scholar]
- Liquid phase adsorption of Crystal violet onto activated carbons derived from male flowers of coconut tree. J. Hazard Mater.. 2006;136
- [CrossRef] [Google Scholar]
- Designing, modelling, and optimising amido black and Eosin B dyes adsorption on MWCNT/ZrO2/Pb nanocomposites from aqueous solution by response surface methodology. Int. J. Environ. Anal. Chem. 2021
- [CrossRef] [Google Scholar]
- Development of high quality activated carbon from biological sludge and its application for dyes removal from aqueous solutions. Sci. Total Environ.. 2019;660
- [CrossRef] [Google Scholar]
- Remediation of heavy metals and dyes from wastewater using cellulose-based adsorbents. Environ. Chem. Lett. 2019
- [CrossRef] [Google Scholar]
- Crystalline structure and thermal property characterization of chitin from Antarctic krill (Euphausia superba) Carbohydr. Polym.. 2013;92
- [CrossRef] [Google Scholar]
- Adsorption kinetic models: Physical meanings, applications, and solving methods. J. Hazard. Mater. 2020
- [CrossRef] [Google Scholar]
- Cross-linking enzyme aggregates in the macropores of silica gel: a practical and efficient method for enzyme stabilization. Biochem. Eng. J.. 2010;52
- [CrossRef] [Google Scholar]
- Closure to “Kinetics of Adsorption on Carbon from Solution”. J. Sanit. Eng. Div.. 1963;89
- [CrossRef] [Google Scholar]
- Extraction and characterization of chitin; a functional biopolymer obtained from scales of common carp fish (Cyprinus carpio l.): A lesser known source. Afr. J. Food Sci.. 2011;5
- [Google Scholar]
- Adsorption of Congo red from aqueous solution onto shrimp shell powder. Adsorpt. Sci. Technol.. 2018;36
- [CrossRef] [Google Scholar]


