

Translate this page into:
The investigation of crystal structure, thermodynamic properties, and fluorescence properties of three new rare earth coordination compounds
⁎Corresponding authors. zhaojinjin@hebtu.edu.cn (Jin-Jin Zhao), ningren9@163.com (Ning Ren), jjzhang6@126.com (Jian-Jun Zhang)
-
Received: ,
Accepted: ,
This article was originally published by Elsevier and was migrated to Scientific Scholar after the change of Publisher.
Abstract
Abstract
Three new rare earth metal compounds are synthesized and single crystals are obtained. 1D and 2D structures of compounds are formed by different types of hydrogen bonds. The thermal behavior of the compounds is studied by TG/DSC-FTIR. Compound 3 can emit orange-red light and has outstanding fluorescence properties.
Abstract
Three new rare earth coordination compounds [REL3Ph]2(RE = Pr(1), Sm(2)); [ErL3Ph]2·4C2H5OH(3); (L = 2,6-dimethylbenzoate, Ph = o-phenanthroline) were synthesized. The crystal structures of the three compounds were measured by X-ray single-crystal diffraction. From the results, we made out that compounds 1–3 were binuclear structures, and 1D chain-like structures could be formed by hydrogen bonding. The thermal degradation data of the compounds and the three-dimentional infrared cumulative spectra of the gaseous decomposed products were obtained by TG/DSC-FTIR technique, and the thermal degradation patterns were explained. The isobaric molar heat capacity of compounds 1 and 2 in the low-temperature region was obtained by the DSC technique and the thermodynamic parameters were derived. The fluorescence spectrum of compound 2 was determined, showing that it had potential application value in the orange-red luminescence region.
Keywords
Rare earth
Crystal structure
Thermodynamics
Fluorescence

1 Introduction
In recent years, coordination compounds synthesized with rare earth metal ions had attracted more and more interest due to their copious and diverse structures and extensive application prospects. The 4f electrons in rare earth metals made these coordination compounds exhibit unique magnetic properties (Gao et al., 2018; Dias et al., 2020; Osada et al., 2021), luminescence (Komatsu et al., 2018; Kang et al., 2019; Li et al., 2017), electronics (Been et al., 2021), and chemistry (Zheng et al., 2022; Martynov et al., 2022). Therefore, rare earth coordination compounds had become a hot topic in the research and development of fluorescence probes (Niu et al., 2020), sensors (Hossain et al., 2021; Paderni et al., 2021), luminescence materials (Zhang and Zhang, 2022; Zhang et al., 2021), magnetism materials (Li and Yan, 2020; Popov et al., 2018), cell imaging (Zhong et al., 2019; Zhang et al., 2020; Skripka et al., 2019), gas storage (Zhao et al., 2018; Hashim et al., 2018; MiREer et al., 2017) and other fields (Coronado, 2020; Kim et al., 2018; Hermassi et al., 2021).The radius of rare earth elements was large, the coordination number was various (Ye et al., 2008; Cotton, 2005), and the coordination mode was diverse and multidentate (Bünzli, 2006; Peters et al., 2020; Luo et al., 2020; Bünzli et al., 2000). The usage of aromatic organic ligands containing oxygen and nitrogen atoms in the construction of coordination compounds could not only provide a variety of binding sites but also help the metal to establish extensible structures and form different dimensions of expansion (Feng et al., 2018; Wang et al., 2019; Chai et al., 2010). At the same time, the polyatomic ring in the ligand had a large π-π conjugated system, which can help the rare earth metal improve its luminescence performance and stability (Yin et al., 2020; Younis et al., 2021; Dong et al., 2015). Based on the above analysis, we intended to choose 2,6-dimethylbenzoate and o-phenanthroline ligands to combine with rare earth metals. The ligands were expected to coordinate with rare earth metal ions, and the abundant aromatic rings in the ligands could provide more possibilities for constructing multidimensional structures. The thermal decomposition mode and heat capacity of the compound could be determined by TG-DSC technology, and the thermal properties of the compound at different temperatures could be analyzed more deeply. In addition, the entropy and enthalpy of the compound could be further derived by using the heat capacity, which was of great help to understanding lattice vibration, structural transformation, nuclear magnetism and superconductivity (Bespyatov, 2020; Rosen et al.,2020; Smith et al.,2017; Wei et al.,2007; Zou, et al.,2016).
Finally, we prepared three compounds [REL3Ph]2(RE = Pr(1), Sm(2)); [ErL3Ph]2·4C2H5OH(3); (L = 2,6-dimethylbenzoate, Ph = o-phenanthroline). The crystal structures were measured by X-ray single-crystal diffraction. At the same time, the three compounds were analyzed by elemental analysis, infrared, and Raman detection. In addition, the thermal degradation patterns and isobaric molar heat capacity of the compounds were analyzed and discussed by TG and DSC techniques. Finally, the fluorescence data of compound 2 were determined, which provided data support for the potential application of the compounds.
2 Experimental
2.1 Materials and chemicals
The raw materials were purchased from reagent manufacturers and used directly, and the Ph ligand was sourced from the Alfa Esha Chemical Co. LTD; the L ligand was sourced from Comeio Chemical Reagent Co. LTD; RE(NO3)3⋅6H2O (RE = Pr, Sm, Er) were sourced from Beijing Yinokai Technology Co., LTD.
2.2 Instruments and test conditions
The elements contents of carbon, hydrogen, and nitrogen in compounds 1–3 were measured by Vario EL-III elemental analyzer manufactured by Elementar and the results were shown in Table 1. The X-ray single-crystal diffraction data were obtained by the Smart-1000single crystal diffractometer manufactured by Bruker AXS, Germany at 298 K, and the derived structures were modified and improved by the program of SHELXS-97. The IR and Raman spectra of two ligands and compounds 1–3 were measured by Fourier transform infrared spectrometer (BRUKER TENSOR27) and FTIR-RAMANII instrument (BRUKER VERTEX-70) with a scanning range of 4000–50 cm−1. The TG-DSC curves of the compounds 1–3 and the three-dimentional infrared cumulative spectra of the gaseous decomposed products were measured using the STA 449 F3 synchronous analyzer of NETZSCH company and the fourier transform infrared spectrometer (BRUKER TENSOR27) under mimicked air medium conditions with a heating speed of 10 K/min. The heat capacities of compounds 1 and 2 were surveyed by differential scanning calorimeter (NETZSCH DSC 200 F3) with a heating speed of 10 K/min and in a pure nitrogen ambience. Compounds 1 and 2 were compared with the reference sample (25.14 mg) in a lower temperature range. The fluorescence spectra of compound 2 were measured by FS5 fluorescence spectrometer at 298 K.
Compound
C
H
N
1
Found(%)
60.84
4.68
3.71
Calcd(%)
60.89
4.55
3.64
2
Found(%)
59.68
4.55
3.60
Calcd(%)
60.15
4.49
3.59
3
Found(%)
52.73
3.96
3.14
Calcd(%)
52.75
3.94
3.16
2.3 Preparation methods
The L ligands and Ph ligands (molar ratio of 3:1) were completely dissolved in ethanol solution (95 %), and NaOH solution (1 mol/L) was dripped while stirring to adjust the pH value to 5–7. The above solution was mixed with RE(NO3)3 solution and stirred continuously for 6–8 h. After standing for 12 h, the upper mother liquor was extracted and filtered. Crystals were obtained after standing for 1–2 weeks.
3 Results and discussion
3.1 Crystal structures
The single-crystal diffraction data of compounds 1–3 were listed in Table 2. Atomic coordinates and equivalent isotropic displacement parameters for compounds 1–3 were listed in supplementary materials Tables S1-3. Bond length (Å) of the organic group in compounds 1–3 were listed in supplementary materials Table S4. Three compounds had two different crystal structures. The central ion and ligands in coordination compounds 1 and 2 had the same coordination mode and coordination environment. Therefore, the structures of compounds 1 and 3 would be introduced as an example below.
Compound
1
2
3
Empirical formula
C78H70N4O12Pr2
C78H70N4O12Sm2
C86H94Er2N4O16
Formula weight
1537.2
1556.08
1774.17
Temperature/K
293(2)
293(2)
298(2) K
Wavelength/ Å
0.71073
0.71073
0.71073
Crystal system
Triclinic
Triclinic
Triclinic
Space group
Pī
Pī
Pī
a/Å
12.7611(11)
12.2374(11)
12.6390(15)
b/Å
13.4218(12)
13.1250(12)
12.6459(14)
c/Å
13.7488(13)
14.1344(14)
15.8527(18)
α/°
63.1020(10)
65.1000(10)
78.916(3)
β/°
84.443(3)
74.157(2)
75.930(3)
γ/°
71.574(2)
76.879(2)
71.0110(10)
Volume/Å3
1989.5(3)
1964.6(3)
2306.3(5)
Z,Calculated density/Mg·m−3
2,1.283
1,1.315
1,1.277
Absorption coefficient/mm−1
1.267
1.538
1.866
F(0 0 0)
780
786
902
Crystal size/mm
0.21 × 0.14 × 0.11
0.35 × 0.10 × 0.07
0.17 × 0.15 × 0.07
Theta range for data collection /°
1.82 to 25.02
1.86 to 25.02
1.97 to 25.02
Limiting indices
−15 ≤ h ≤ 14
−13 ≤ h ≤ 14
−15 ≤ h ≤ 15
−15 ≤ k ≤ 15
−15 ≤ k ≤ 15
−13 ≤ k ≤ 15
−16 ≤ l ≤ 14
−16 ≤ l ≤ 16
−18 ≤ l ≤ 18
Reflections collected/unique
10004/6913
9769/6811
11147/7848
[R(int) = 0.0513]
[R(int) = 0.0434]
[R(int) = 0.1240]
Completeness to theta = 25.02°
98.5%
98.2%
96.5%
Max. and min. transmission
0.8732 and 0.7767
0.9000 and 0.6151
0.8804 and 0.7420
Data/restraints/parameters
6913/0/433
6811/0/439
7848/251/488
Goodness-of-fit on F2
1.064
1.054
1.090
Final R indices [I > 2σ(I)]
R1 = 0.0500
R1 = 0.0529
R1 = 0.1444
wR2 = 0.1188
wR2 = 0.1116
wR2 = 0.3232
R indices (all data)
R1 = 0.0620
R1 = 0.0700
R1 = 0.1874
wR2 = 0.1241
wR2 = 0.1189
wR2 = 0.3470
Largest diff. peak and hole(e Å−3)
1.127and-1.483
1.212 and −1.297
4.003and-2.356
CCDC
2,262,923
2,262,928
2,262,922
3.1.1 [REL3Ph]2(RE = Pr, Sm)
As shown in Fig. 1(a), compound 1 was a binuclear molecule containing two Pr3+ ions, six L ligands, and two Ph ligands. Two central metal ions Pr3+ were combined by oxygen atoms in four acidic ligands L. Thereinto, two L ligands (O3 and O4′, O4 and O3′) were bridge-linked bidentate; two L ligands (O1 and O2′, O2 and O1′) were bridge-linked tridentate. One Ph ligand (N1 and N2) and one L ligand (O5 and O6) formed coordinated bonds with the central metal ions Pr3+ in the form of bidentate chelation. The central metal ion Pr3+ and the surrounding nitrogen and oxygen atoms formed a twisted mono-capped tetragonal antiprism geometry. The geometric shape could be viewed in Fig. 1 (b). The Pr3+ion had a coordination number of 9.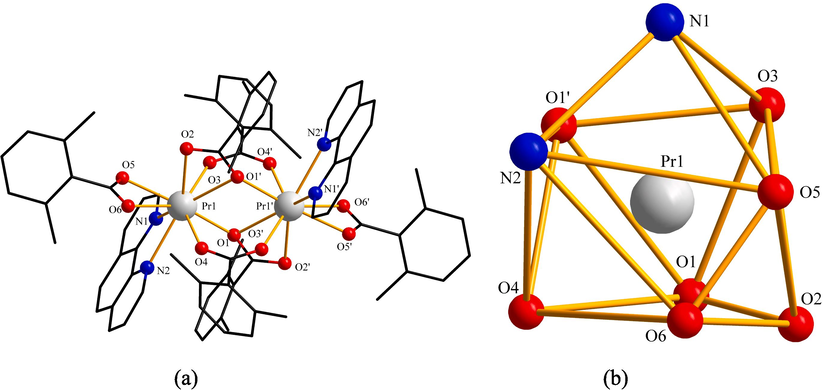
(a) Symmetric unit of compound 1. (b) Coordination environment geometric shape of Pr3+ ion.
From the Fig. 2 (a), we could see that two adjacent symmetric units formed a 1D chain-like structure on the b-axis by C–H…O hydrogen bonding(2.6015 Å) (Balashova et al., 2022; Itoh et al., 2019). They were the C–H bond in the Ph ligand and the O atom in the L ligand (bidentate chelation with the metal) in the adjacent symmetric unit. Then the adjacent 1D chain formed 2D network structure on the bc planum by C–H…π stacking action (Rubí et al.,2023) in Fig. 2 (b). The distance between the centroid of the aromatic ring in the L ligand (bridge-linked bidentate with the metal) and the C–H bond of the methyl group in the L ligand (bidentate chelation with the metal) in the adjacent 1D chain was 3.3085 Å.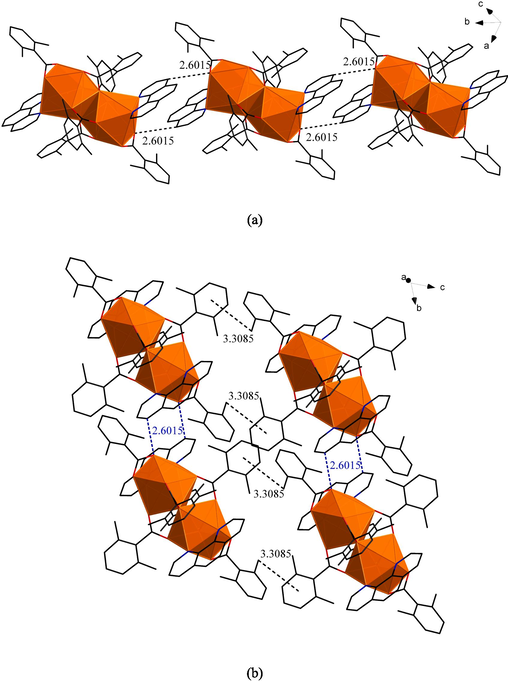
(a)1D chain-like structure of compound 1 on the b-axis. (b)The 2D network structure of compound 1 on the bc planum.
The symmetric unit of compound 2 and the coordination environment geometric shape of Sm3+ ion were shown in Fig. 3. In Fig. 4(a), two adjacent symmetric units formed a 1D chain-like structure on the b-axis by C–H…O hydrogen bonding(2.6051 Å). All of them were bonded in the same way as compound 1. Then the adjacent 1D chain formed 2D network structure on the ab planum by C–H…π stacking action in Fig. 4 (b). The distance between the centroid of the aromatic ring in the L ligand (bridge-linked tridentate with the metal) and the C–H bond of the methyl group in the L ligand (bridge-linked bidentate with the metal) in the adjacent 1D chain was 3.9747 Å.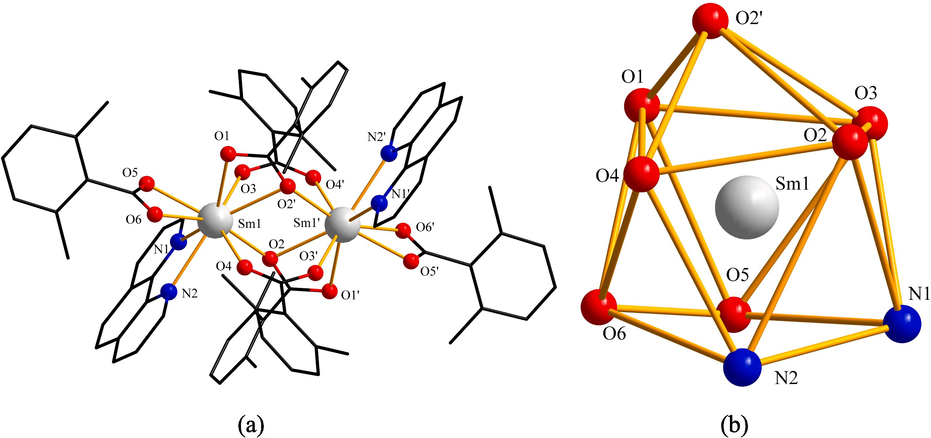
(a) Symmetric unit of compound 2. (b) Coordination environment geometric shape of Sm3+ ion.
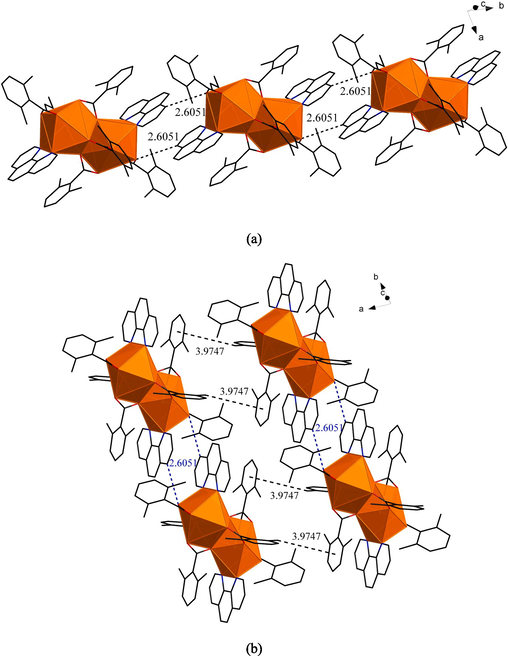
(a)1D chain-like structure of compound 2 on the b-axis. (b)The 2D network structure of compound 2 on the ab planum.
3.1.2 [ErL3Ph]2·4C2H5OH
Compound 3 had the identical crystal system and space group as compound 1, which was a dinuclear molecule composed of two Er3+ ions, six L ligands, and two Ph ligands. At the same time, compound 3 also contained four uncoordinated ethanol molecules as shown in Fig. 5 (a). The two central metal ions Er3+ were connected together by the bridge-linked bidentate of two acidic ligands L (O2 and O3′, O3 and O2′). One Ph ligand (N1 and N2) and one L ligand (O5 and O6) formed coordinated bonds with the central metal ions Er 3+ in the form of bidentate chelation. So, the central metal ion Er3+ and two kinds of ligands formed eight coordinated bonds. Four uncoordinated ethanol molecules were distributed around the symmetric unit. The coordinated nitrogen and oxygen atoms formed a distorted square antiprism centered (Shrestha and Shakya, 2020) on the central metal ion Er3+. The geometric shape could be viewed in Fig. 5 (b).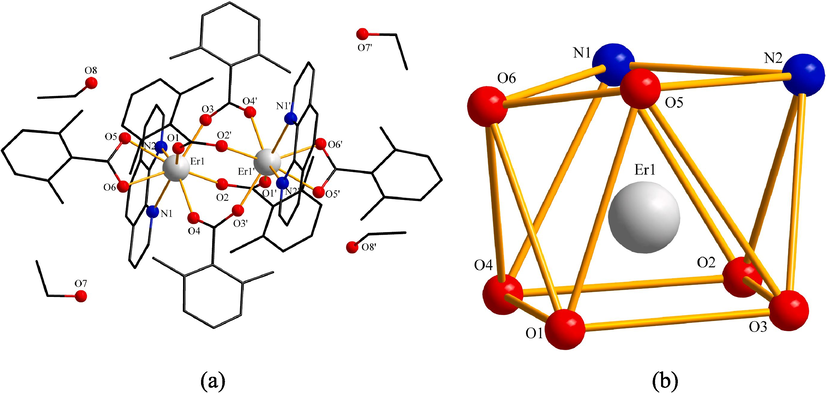
(a) Symmetric unit of compound 3 (b) Coordination environment geometric shape of Er3+ ion.
As shown in Fig. 6 (a), the adjacent symmetric units were joined together on the a-axis by three hydrogen bonding. Firstly, the O atom in the ethanol molecule (named ET1) and the C–H bond in the Ph ligand in the same symmetric unit formed the intramolecular C–H…O hydrogen bonding(2.5904 Å). Secondly, the hydroxyl group in another ethanol molecule (named ET2) formed an intramolecular O–H…O (Avagyan et al., 2023) hydrogen bonding(2.1148 Å) with the O atom in the L ligand (bidentate chelation with the metal)in the same symmetric unit. ET1 and ET2 belonged to two adjacent but different symmetric units. Finally, the hydroxyl group in ET1 formed an extramolecular O–H…O hydrogen bonding(2.0293 Å) with the O atom in ET2. The shorter the bond length of hydrogen bonding, the stronger the intermolecular force and the stronger the thermal stability. It could be seen from Fig. 6(a) that all uncoordinated ethanol molecules participated in the construction of 1D chains and had strong interactions, so it was inferred that the thermal stability of these ethanol molecules would be improved to a certain extent. This conclusion was also reflected in the thermal decomposition process of the compound (Feng et al.,2022). Then the adjacent 1D chain formed 2D network structure on the ac planum by C–H…π stacking action in Fig. 6 (b). The distance between the centroid of the aromatic ring in the L ligand (bidentate chelation with the metal) and the C–H bond of the methyl group in the L ligand (bidentate chelation with the metal) in the adjacent 1D chain was 3.3819 Å. Table 3 showed the hydrogen bonding length (Å) data of compound 3.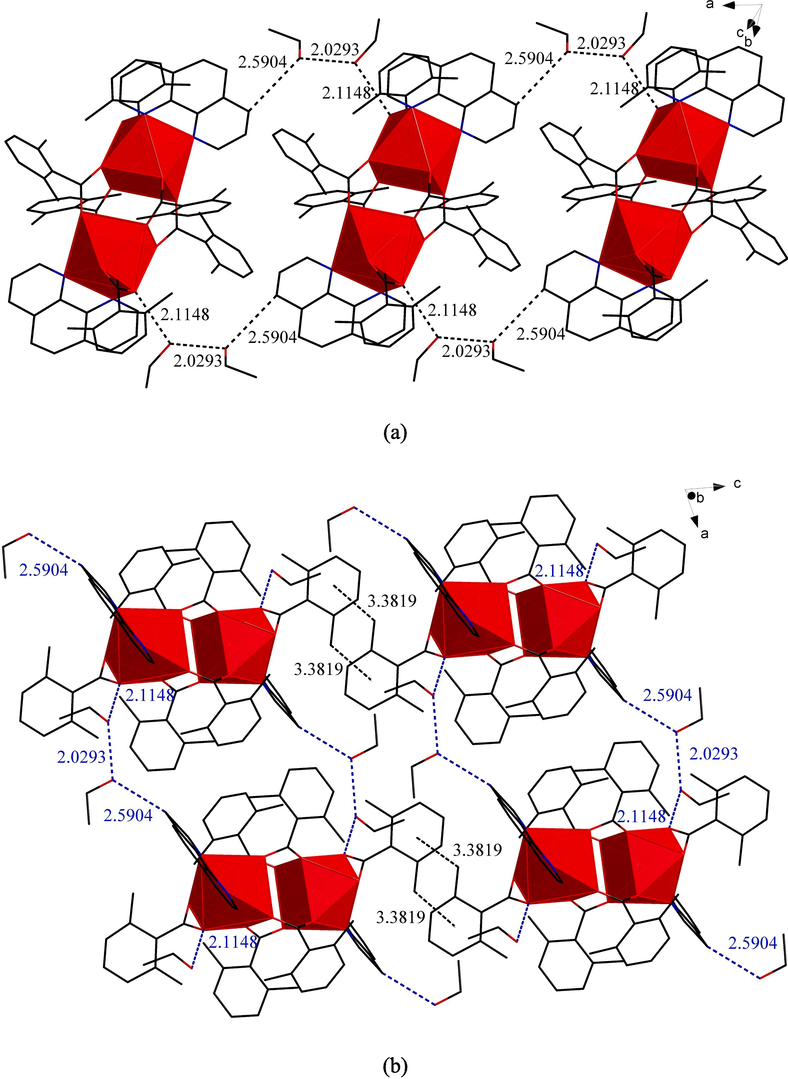
(a)1D chain-like structure of compound 3 on the a-axis. (b)The 2D network structure of compound 3 on the ac planum.
Compound
D-H…A
d(D-H)
d(H…A)
d(D…A)
<(DHA)
3
O7-H7…O8
0.820
2.033
2.850
174.58
O8-H8…O5
0.820
2.115
2.931
173.8
In Table 4, the data on the bond length of the three compounds were listed. The mean value of bond lengths of RE-O were 2.52 Å(Pr-O)、2.50 Å(Sm-O)、2.42 Å(Er-O), respectively. This decreasing law could be mainly imputed to the gradual decrease of the radius of metal ions in the shrinkage of the system, so that the bond length decreased (Wei et al., 2016). This also leaded to the same change rule of the RE-N bond in the same way. In addition, it was found that RE-N was generally longer in the comparison of RE-O and RE-N data. It showed that the coordinated ability of O atoms was better than that of N atoms, which made the coordinated bond more stable (Cheng et al., 2022). This conclusion was also verified in the thermal decomposition process. Symmetry transformations used to generate equivalent atoms: #1 -x + 1,-y + 1,-z + 1.
Compound 1
Bond length
Compound 2
Bond length
Compound 3
Bond length
Pr(1)-O(1)#1
2.405(4)
Sm(1)-O(2)#1
2.387(4)
Er(1)-O(1)
2.356(12)
Pr(1)-O(1)
2.641(3)
Sm(1)-O(1)
2.590(4)
Er(1)-O(2)#1
2.407(15)
Pr(1)-O(2)
2.618(4)
Sm(1)-O(2)
2.658(4)
Er(1)-O(3)
2.347(14)
Pr(1)-O(3)
2.433(4)
Sm(1)-O(3)
2.396(4)
Er(1)-O(4)#1
2.447(19)
Pr(1)-O(4)#1
2.459(4)
Sm(1)-O(4)#1
2.431(4)
Er(1)-O(5)
2.457(17)
Pr(1)-O(5)
2.464(4)
Sm(1)-O(5)
2.445(4)
Er(1)-O(6)
2.51(2)
Pr(1)-O(6)
2.586(4)
Sm(1)-O(6)
2.606(4)
Er(1)-N(1)
2.597(16)
Pr(1)-N(1)
2.734(4)
Sm(1)-N(1)
2.711(5)
Er(1)-N(2)
2.658(14)
Pr(1)-N(2)
2.701(4)
Sm(1)-N(2)
2.670(5)
3.2 Infrared spectroscopy
The composition of compound synthesis could be verified by infrared spectroscopy from the vibration absorption of chemical bonds. For better comparative analysis, infrared absorption spectra of L ligand, Ph ligand, and three compounds were determined respectively. The characteristic absorption spectra were summarized in Fig. 7, and the characteristic absorption peak data were listed in Table 5. By comparison, it was found that the characteristic absorption peak of νC=O in L ligand did not appear in compounds 1–3 (Novak and GrdadoREik, 2021). Instead, the characteristic absorption peaks of νas and νs of COO– (Ali et al., 2019; Zehra et al., 2021) were replaced. It could be inferred that the C=O bond in L ligand was broken, and the oxygen atom was coupled with the central metal ion (Zhang et al., 2008). This was also confirmed by the RE-O characteristic absorption peak near 418 cm−1 (Lu et al., 2019) in compounds 1–3. The absorption peaks of C=N bond and C–H bond in Ph ligand had obvious shifts in compounds 1–3, pointing to the nitrogen atoms were successfully coupled with the central metal ions (Stables, 2021; Lakshmiprasanna et al., 2019). The peak near 1250 cm−1 could be considered C–O bond stretching vibration (Gigante et al.,2014). The double peak at 2300 cm−1 was likely due to a trace amount of CO2 mixed in with the test. We also noticed that compound 3 had a wide peak around 3500 cm−1, which was attributed to the hydroxyl group in the uncoordinated ethanol molecule (Łyszczek, 2009).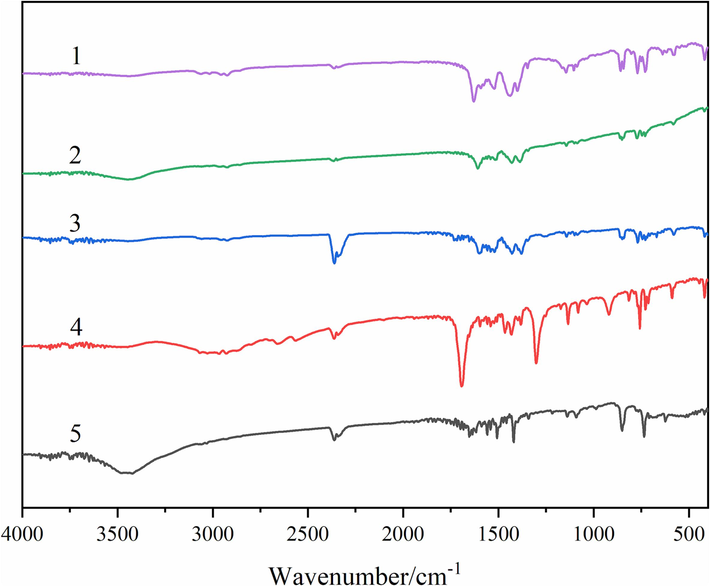
The IR characteristic absorption spectra of ligands and compounds. (1 = L, 2 = Ph, 3 = compound 1, 4 = compound 2, 5 = compound 3).
Ligands/compound
νC=N
δC-H
νC=O
νas(COO–)
νs(COO–)
ν(RE-O)
L
1690
Ph
1602
909
806
1
1582
855
772
1615
1454
416
2
1580
856
773
1618
1457
418
3
1582
854
771
1618
1457
416
3.3 Raman spectroscopy
To verify the formation of coordinated bonds more comprehensively, the Raman spectroscopy of two kinds of ligands and three compounds were measured. The spectrums and data were listed in Fig. 8 and Table 6, respectively. The same as the information obtained by IR spectra, the absorption peak of νC=O in L ligand (Hajam et al., 2022) disappeared, and the absorption peak of νCOO- appeared in the compounds 1–3. The absorption peaks of C=N bond and C–H bond in Ph ligand also had a certain degree of displacement (Attia et al., 2012). More importantly, the absorption peaks of ν(RE-O) and ν(RE-N) appeared, indicating that both ligands composed coordinated bonds with the central metal ions (Tsaryuk et al., 2020).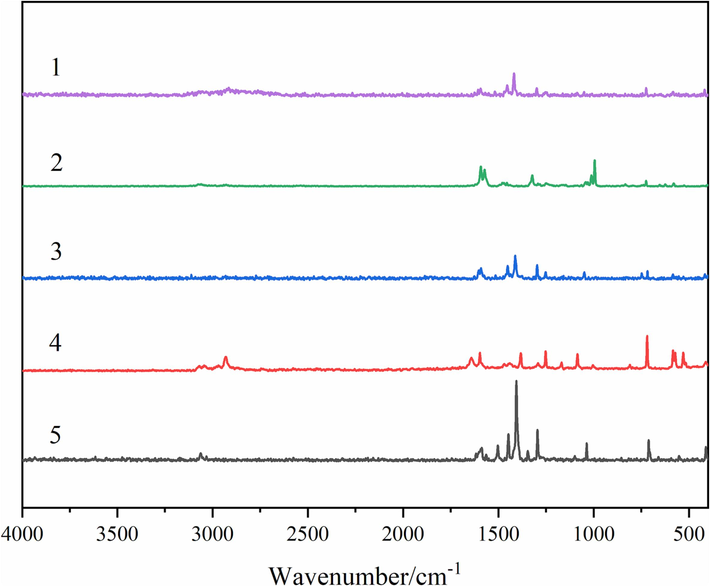
The Raman characteristic absorption spectra of ligands and compounds. (1 = L, 2 = Ph, 3 = compound 1, 4 = compound 2, 5 = compound 3).
Ligands/compound
νC=N
δC-H
νC=O
νas(COO–)
νs(COO–)
ν(RE-O)
ν(RE-N)
L
1639
Ph
1564
707
1
1583
732
1587
1449
405
278
2
1583
732
1588
1450
405
279
3
1583
736
1590
1450
411
273
3.4 Thermal degradation patterns and gaseous decomposition products analyses
To learn about the thermal stability of compounds, the thermal degradation patterns of compounds 1–3 were measured respectively. The performance test was measured in a simulated air medium with a temperature range of 300–1050 K and a heating speed of 10 K/min. The thermal degradation data were recorded by TG-DTG-DSC curves and plotted in Fig. 9. At the same time, the infrared spectrums of the gaseous decomposition products produced in time of the thermal degradation pattern were measured online. The three-dimentional infrared cumulative spectra formed were listed in Fig. 10, and the strong absorption peaks were intercepted as 2D infrared spectra in Fig. 11. The thermal degradation patterns of compounds 1 and 2 were the same. Therefore, only the thermal degradation patterns of compounds 1 and 3 were discussed below.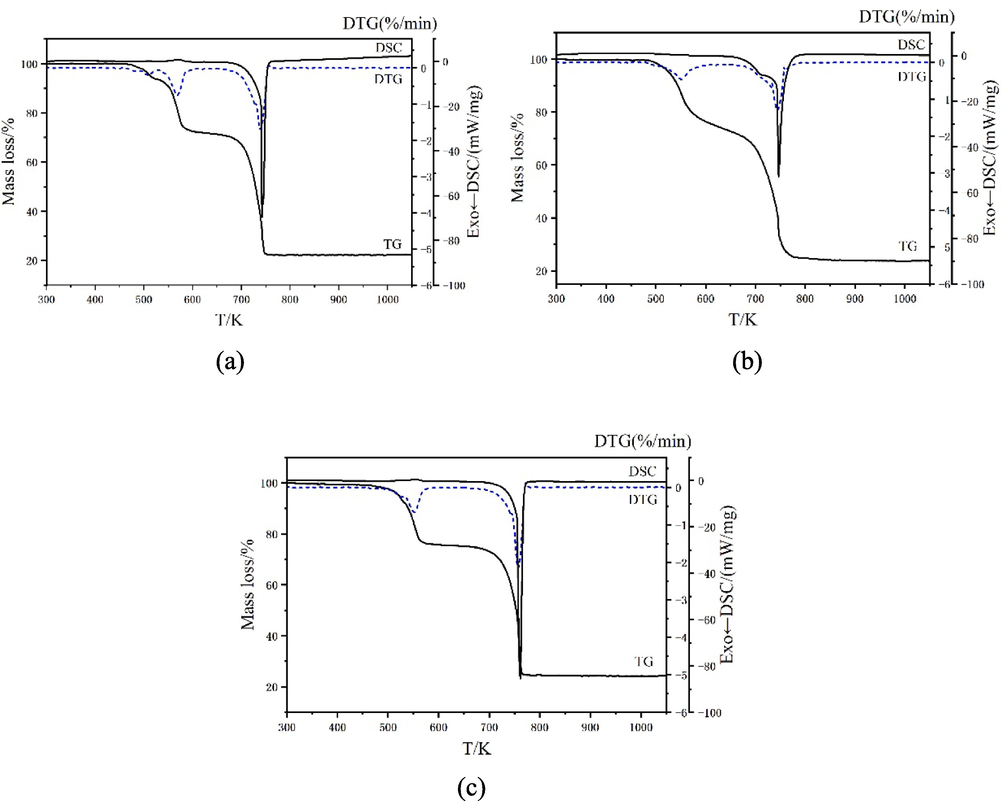
TG-DTG-DSC curves of the compounds. (a = compound 1, b = compound 2, c = compound 3).
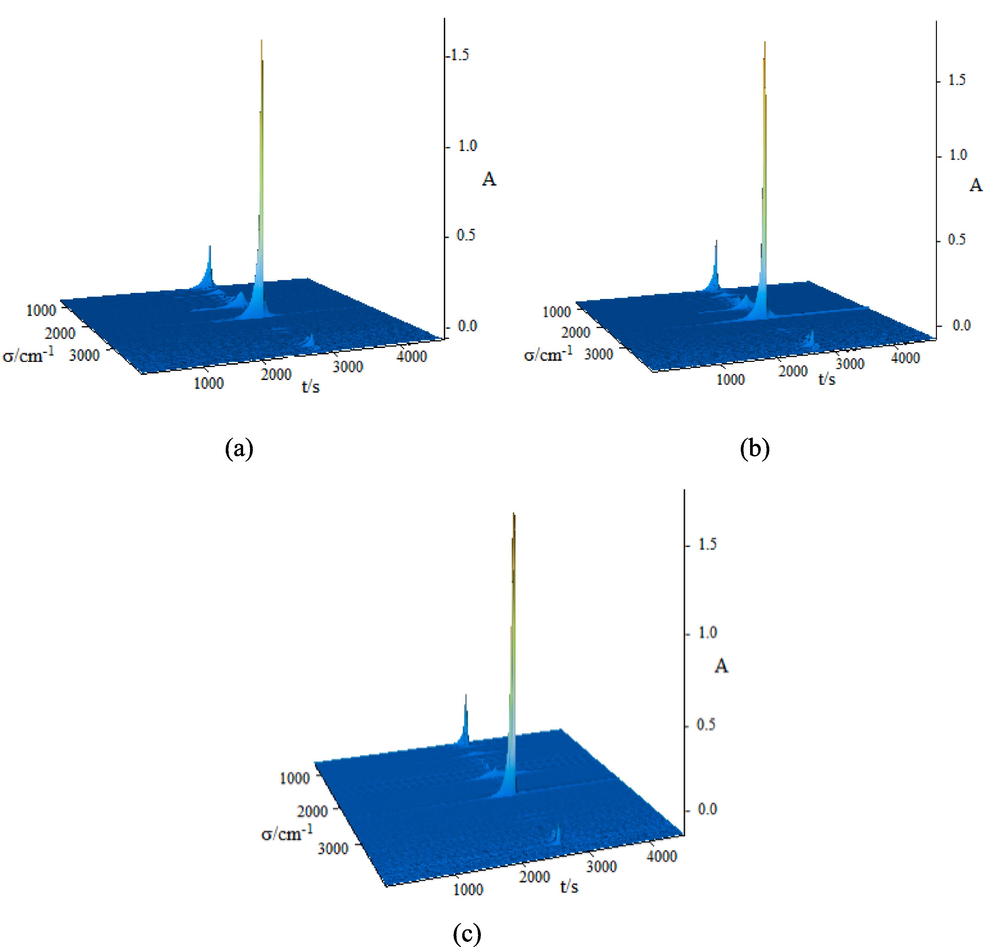
Three-dimentional infrared cumulative spectra of the gaseous decomposition products of the compounds. (a = compound 1, b = compound 2, c = compound 3).
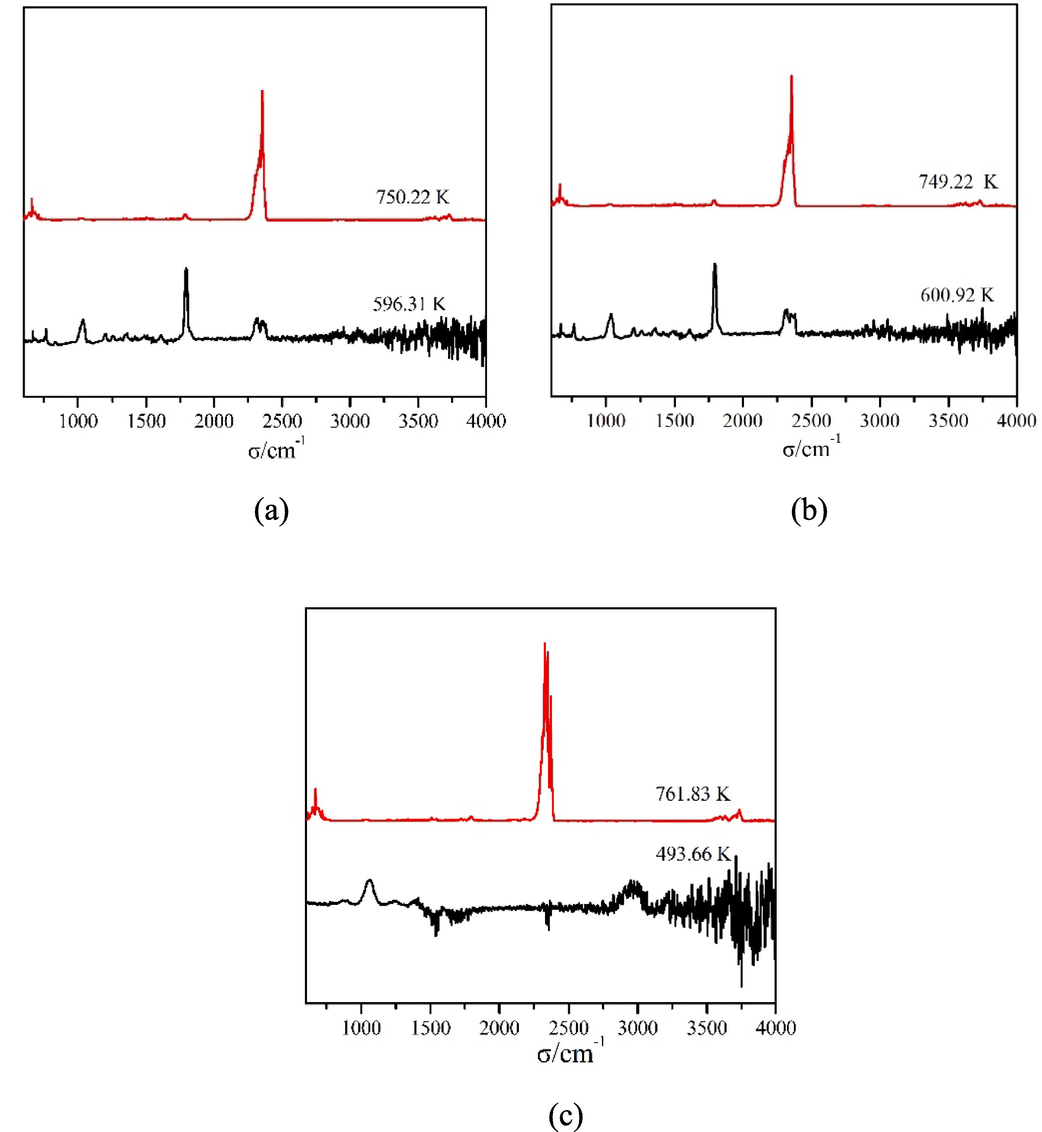
2D infrared spectra of the gaseous decomposition products of the compounds. (a = compound 1, b = compound 2, c = compound 3).
The TG curve in Fig. 9 (a) showed that the thermal degradation pattern of compound 1 could be subdivided into two phases, and two corresponding minimum values appeared in the DTG curve (Qiao et al., 2019; Zabiszak et al., 2020; Zhao et al., 2021; Du et al., 2023). The first mass lost occurred between 503 K and 636 K with measured mass loss of 23.14%. This was approaching the mass ratio of Ph ligands (23.45%) in compound 1. It was assumed that compound 1 lost 2 molecules of Ph ligand (Dağlı et al., 2019; Nnabuike et al., 2020). Moreover, a series of strong absorption peaks were found at 596 K in the infrared spectrum of gaseous decomposed products. It included the infrared spectrums of CO2 (2318–2367 cm−1, 683 cm−1) and H2O (3563–3874 cm−1), the absorption peaks of νC=N (1589 cm−1), νC-N (1191 cm−1), νC-H (3083–3401 cm−1), νC=C (1569 cm−1) and γC-H(764, 865 cm−1, 1062 cm−1) (Wang et al., 2023). It was also confirmed that compound 1 had lost Ph ligand in the first mass lost (Zapała et al., 2019). When analyzing the DSC curve, there was an endothermic peak (ΔH = 139.5 J/mol) appearing near 570 K, indicating that the first mass lost process was an endothermic process (Müsellim et al., 2018). The second mass lost occurred between 636 K and 947 K with measured mass loss of 55.09%. This was approaching the mass ratio of L ligands (54.41%) in compound 1. It was hypothesized that compound 1 removed 6 molecules of L ligand during this heating process, and eventually formed metal oxide Pr6O11. Compared with the infrared spectra of gaseous decomposed products in this temperature range, strong absorption peaks appeared at 668 cm−1, 2163–2291 cm−1, 3566–3776 cm−1, which could boil down to the characteristic absorption of CO2 and H2O (Xing et al., 2021). Comprehensive analysis showed that L ligands were completely oxidized in the second mass lost. This process corresponded to an exothermic peak (ΔH = −4939 J/mol) in the DSC curve. The total mass lost ratio of compound 1 in thermal degradation was 78.23%, which was consistent with the assumption that the end-product was Pr6O11. Finally, the thermal degradation pattern of compound 1 was speculated as below: [PrL3Ph]2 → Pr2L6 → Pr6O11
The TG-DTG-DSC curves of compound 3 were plotted in Fig. 9 (c). In Fig. 9 (c), the thermal degradation of compound 3 could be subdivided into two phases. The first mass lost occurred between 462 K and 651 K with measured mass loss of 23.44%. This was different from the mass ratio of four uncoordinated ethanol molecules (12.89%) in the compound. From the three-dimentional infrared cumulative spectra of gaseous decomposed products, it was found that there was a strong absorption peak near 499 K. The infrared spectrums of CO2 (2324–2381 cm−1) and H2O (3654–3960 cm−1), νC=N (1590 cm−1), νC-N (1211 cm−1), νC-H (3052–3401 cm−1), νC=C (1547 cm−1) and γC-H (779 cm−1, 882 cm−1, 1058 cm−1) were found from the 2D infrared spectra. From the above data, it was speculated that compound 3 might have lost four uncoordinated ethanol molecules and fractional Ph ligands in the first mass lost. In the meantime, an endothermic peak (ΔH = 66.43 J/mol) was found near 555 K in the DSC curve. The uncoordinated ethanol molecules decomposed at a temperature slightly higher than their own decomposition temperature. We attributed this phenomenon to the hydrogen bonding formed by ethanol in 1D chain structure. We discussed this conclusion before. The second mass lost occurred between 651 K and 1003 K with measured mass loss of 52.75%. The two mass lost ratios were 76.19 % in total, which was slightly different from the total mass lost ratio of ethanol molecules, Ph ligands, and L ligands (78.43 %). It was inferred that compound 3 removed all ligands in the second mass lost, and finally formed metal oxide Er2O3. Only the infrared absorption peaks of CO2 (2304–2381 cm−1) and H2O (3604–3744 cm−1) were detected in the gaseous decomposed products, indicating that the residuary ligands underwent complete oxidation during the second thermal degradation. This process corresponded to an exothermic peak (ΔH = −4829 J/mol) in the DSC curve. Finally, the thermal degradation pattern of compound 3 was speculated as below: [ErL3Ph]2·4C2H5OH → [Er2L6(1-x)Ph2] → Er2O3
The thermal degradation data of compounds 1–3 were listed in Table 7. It was found from the thermal degradation pattern that the Ph ligands in the compounds were removed and decomposed in the first mass lost. This Phenomenon indicated that the RE-N bond formed in the compound was less stable than the RE-O bond, and would break at lower temperatures, resulting in lower bond energy (Zapała et al., 2018). This conclusion also showed up in the crystal data.
Compound
Phase
Temperature extent/ K
DTG Tp/K
Mass lost ratios (%)
Presumed eliminated segments
Remainder and end-products
Found
Calcd
1
Ⅰ
503–636
579
23.14
23.45
2Ph
[Pr2L6]
Ⅱ
636–947
760
55.09
54.41
6L
Pr6O11
78.23
77.86
2
Ⅰ
463–593
552
23.16
22.76
2Ph
[Sm2L6]
Ⅱ
593–950
745
54.44
53.50
6L
Sm2O3
77.60
76.26
3
Ⅰ
462–651
524
23.44
12.89a
4(C2H5OH) + xPh
[Er2L6(1-x)Ph2]
Ⅱ
651–1003
764
52.75
–
(1-x)Ph + 6L
Er2O3
76.19
78.43
3.5 Isobaric molar heat capacities and thermodynamical parameters
The isobaric molar heat capacities of compounds 1 and 2 were got by the DSC technique. Due to the limitation of the performance of the experimental instrument and the thermal stabilization of the compounds themselves, we selected the temperature range of 193 K to 374 K for heat capacity analysis. The experimental data were shown in supplementary materials Table S5, and the isobaric heat capacity curve was drawn according to the data in Fig. 12. As shown in Fig. 12, the isobaric heat capacities of compounds 1 and 2 increased with increasing temperature. This was due to the increase in temperature and the enhancement of molecular vibration (Rehman et al., 2019), which leaded to the change of heat capacity value. At the same time, we noted that there were no extreme values in either curve, indicating that compounds 1 and 2 did not undergo phase transitions in this temperature range.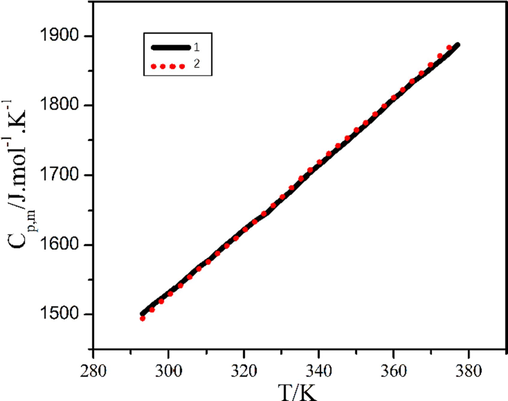
Isobaric heat capacity curves of compounds 1 and 2.
We fitted the heat capacity curve to make it smoother. The temperature was replaced with the reduced temperature X(X = [T – (Tmax + Tmin)/2]/[(Tmax – Tmin)/2] (where Tmax and Tmin were the highest temperature and the lowest temperature measured, respectively). Then the linear relationship between the reduced temperature X and the isobaric heat capacity was processed by the least square method, and the functional relationship of Cp, m ∼ X was obtained, thereinto R2 represented the correlation coefficient, SD represented the standard deviation. The smoothed heat capacities of compounds 1 and 2 were obtained by using the functional relations and were listed in supplementary materials Table S5.
compound 1[PrL3Ph]2
compound 2[SmL3Ph]2
By substituting the function relation into formula , and respectively, two thermodynamical function values of compound 1 and compound 2 were calculated and listed in supplementary materials Table S6. Comparing the above data, it was found that the difference between the heat capacity and the thermodynamical function value of compounds 1 and 2 was very small, showing the same thermodynamical properties. This was mainly because the crystal structures of compounds 1 and 2 were the same, and the vibrations inside the molecules were also very similar (Kou et al., 2019).
3.6 Fluorescence
The fluorescence spectra of compound 2 were shown in Fig. 13. Fig. 13(a) was the excitation spectra of compound 2, which produced a broad ribbon absorption peak range in 250–450 nm, which could be attributed to the π → π* electron transitions in the polyatomic ring of the organic ligand (Li et al., 2019). Fig. 13(b) was the emission spectra of compound 2. There were three characteristic absorption spectra in the range of 500–700 nm, which occurred at 565 nm, 600 nm, and 645 nm, respectively corresponded to 4G5/2→6H5/2, 4G5/2→6H7/2 and 4G5/2→6H9/2 transitions (Lin et al., 2002). The maximum absorption strength at 645 nm leaded to the orange-red emission of compound 2. While compounds 1 (Pr) and 3 (Er) had extremely weak fluorescence, so no fluorescence analysis was done for either.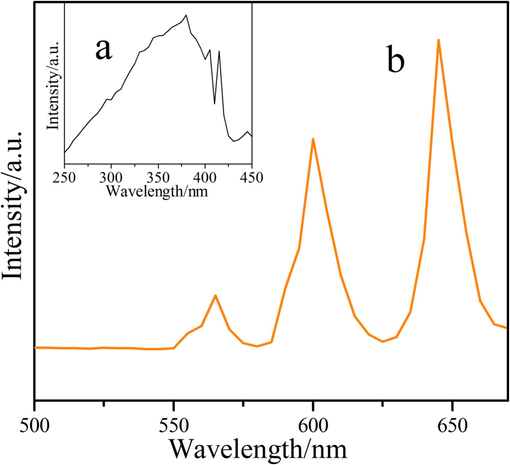
Fluorescence spectrums of compound 2. (a = excitation spectra, b = emission spectra).
4 Conclusions
In summary, three new rare earth coordination compounds [REL3Ph]2(RE = Pr(1), Sm(2)); [ErL3Ph]2·4C2H5OH(3); (L = 2,6-dimethylbenzoate, Ph = o-phenanthroline) were synthesized. The crystal structures of the three compounds were measured by X-ray single-crystal diffraction. The three compounds were all binuclear structures, of which compounds 1 and 2 were isomorphic, and compound 3 contained 4 molecules of uncoordinated ethanol molecules. Three compounds could form a 1D chain-like structure by way of hydrogen bonding. According to the data got by TG/DSC-FTIR technology, we inferred the thermal decomposition of compounds 1–3. It was found that compounds 1–3 firstly removed the Ph ligands and then removed the L ligands, and conclusively formed metal oxides. The isobaric molar heat capacity of compounds 1 and 2 in the low-temperature region was obtained by the DSC technique and the thermodynamical parameters were derived. The fluorescence spectra of compound 2 were determined, and the data showed that the organic ligands enhanced the fluorescence properties of the Sm3+ ion, which had potential development value.
Funding
This work was supported by the National Natural Science Foundation of China (No. 22273015).
CRediT authorship contribution statement
Kun Tang: Validation, Formal analysis, Investigation, Writing – original draft. Xin-Xin Wang: Data curation, Formal analysis, Investigation. Jin-Jin Zhao: Formal analysis, Investigation, Methodology. Ning Ren: Funding acquisition, Conceptualization, Data curation, Writing – review & editing. Jian-Jun Zhang: Conceptualization, Methodology, Resources, Writing – review & editing, Supervision, Project administration, Funding acquisition, Visualization.
References
- Spectral, thermal studies and biological activity of pyrazinamide complexes. Heliyon. 2019;5(11):e02912
- [CrossRef] [Google Scholar]
- A novel bonding of 6, 7-dichloroquinoxlaine-2, 3-dione, DCQX, to two molybdenum (0) metal centers: Synthesis, characterization, biological activity studies and semiempirical calculations of [(bpy) 2Mo (μ2-κ2: η6-DCQX) Mo (CO) 3] complex. Polyhedron.. 2012;44(1):238-244.
- [CrossRef] [Google Scholar]
- Pyrrolidine-Derived Phenanthroline Diamides: An Influence of Fluorine Atoms on the Coordination of Lu (III) and Some Other f-Elements and Their Solvent Extraction. Int. J. Mol. Sci.. 2023;24(6):5569.
- [CrossRef] [Google Scholar]
- New luminescent 10-oxybenzoquinolate complexes of rare earth metals. J. Rare. Earth. 2022
- [CrossRef] [Google Scholar]
- Electronic structure trends across the rare-earth series in superconducting infinite-layer nickelates. Phys. Rev. X.. 2021;11(1):011050
- [CrossRef] [Google Scholar]
- Low-Temperature Heat Capacity and Thermodynamic Functions of Tetrameric Cobalt(II) Acetylacetonate. J. Chem. Eng. Data.. 2020;65:5218-5225.
- [CrossRef] [Google Scholar]
- Benefiting from the unique properties of lanthanide ions. Accounts. Chem. Res.. 2006;39:53-61.
- [CrossRef] [Google Scholar]
- Trivalent lanthanide ions: versatile coordination centers with unique spectroscopic and magnetic properties. J. Alloy. Compd.. 2000;303:66-74.
- [CrossRef] [Google Scholar]
- A series of lanthanide frameworks with a flexible ligand, N, N′-diacetic acid imidazolium, in different coordination modes. Cryst. Growth. Des.. 2010;10:658-668.
- [CrossRef] [Google Scholar]
- Coordination Symmetry Breaking of Single-Atom Catalysts for Robust and Efficient Nitrate Electroreduction to Ammonia. Adv. Mater.. 2022;34(36):2205767.
- [CrossRef] [Google Scholar]
- Molecular magnetism: from chemical design to spin control in molecules, materials and devices. Nat. Rev. Mater.. 2020;5(2):87-104.
- [CrossRef] [Google Scholar]
- Establishing coordination numbers for the lanthanides in simple complexes. CR. Chim.. 2005;8(2):129-145.
- [CrossRef] [Google Scholar]
- The mixed ligand complexes of Co (II), Ni (II), Cu (II) and Zn (II) with coumarilic acid/1, 10-Phanthroline: Synthesis, crystal characterization and biological applications. J. Therm. Anal. Calorim.. 2019;136:1467-1480.
- [CrossRef] [Google Scholar]
- Mononuclear coordination compounds containing a pyrazole-based ligand: Syntheses, magnetism and acetylcholinesterase inhibition assays. J. Mol. Struct.. 2020;1205:127564
- [CrossRef] [Google Scholar]
- Recent progress on plasmon-enhanced fluorescence. Nanophotonics. 2015;4(4):472-490.
- [CrossRef] [Google Scholar]
- Du, D. D., Hao, Y. F., Wang, X. X., Zhao, J. J., Zhang, J. J., Ren, N., 2023. Crystal structure, spectra, and thermal behavior of lanthanide complexes with 2⁃chloro⁃4⁃fluorobenzoic acid and 5,5′⁃dimethyl⁃2,2′⁃bipyridine. Chinese. J. Inorg. Chem. 39(9), 1807-1816. doi: 10.11862/CJIC.2023.138.
- A facile route for tuning emission and magnetic properties by controlling lanthanide ions in coordination polymers incorporating mixed aromatic carboxylate ligands. J. Solid. State. Chem.. 2018;268:22-29.
- [CrossRef] [Google Scholar]
- Synthesis and characterization of poly (butanediol sebacate-butanediol) terephthalate (PBSeT) reinforced by hydrogen bond containing amide group, with good mechanical properties and improved water vapor barrier. Adv. Compos. Hybrid. Ma.. 2022;5(3):2051-2065.
- [CrossRef] [Google Scholar]
- Synthesis and magnetism of RE(BaBO3)3 (RE=Dy, Ho, Er, Tm, Yb) series with rare earth ions on a two dimensional triangle-lattice. J. Alloy. Compd.. 2018;745:396-400.
- [CrossRef] [Google Scholar]
- Spectroscopic study and thermal behavior of trivalent lanthanides and yttrium (III) chelates of EDTA using TG-DSC, FTIR, and TG-DSC coupled to FTIR. J. Therm. Anal. Calorim.. 2014;115:127-135.
- [CrossRef] [Google Scholar]
- Quantum mechanical study, spectroscopic (FT-IR, FT-Raman and UV-Vis) study, NBO, NLO analysis and molecular docking studies of 2-ethoxy-4-(pyridine-2yliminomethyl)-Phol. Polycycl. Aromat. Comp.. 2022;42(7)m:4819-4842.
- [CrossRef] [Google Scholar]
- Dissecting porosity in molecular crystals: influence of geometry, hydrogen bonding, and [π··· π] stacking on the solid-state packing of fluorinated aromatics. J. Am. Chem. Soc.. 2018;140(18):6014-6026.
- [CrossRef] [Google Scholar]
- Recovery of Rare Earth Elements from acidic mine waters by integration of a selective chelating ion-exchanger and a solvent impregnated resin. J. Environ. Chem. Eng. 2021;9(5):105906
- [CrossRef] [Google Scholar]
- Recent progress of rare earth oxides for sensor, detector, and electronic device applications: a review. ACS Appl. Electron. Mater.. 2021;3(10):4255-4283.
- [CrossRef] [Google Scholar]
- N+-CH··· O Hydrogen bonds in protein-ligand complexes. Sci. Rep-UK. 2019;9(1):767.
- [CrossRef] [Google Scholar]
- Containing-PMBP N2O2-donors transition metal (II) complexes: synthesis, crystal structure, Hirshfeld surface analyses and fluorescence properties. Appl. Organomet. Chem.. 2019;33(9):5013.
- [CrossRef] [Google Scholar]
- Trends in structure and thermodynamical properties of normal rare earth carbonates and rare earth hydroxycarbonates. Minerals.. 2018;8(3):106.
- [CrossRef] [Google Scholar]
- Recent progress of pyrimidine derivatives for high-performance organic light-emitting devices. J. Photon. Energy.. 2018;8(3):032108
- [CrossRef] [Google Scholar]
- Thermal analysis and heat capacity study of polyethylene glycol (PEG) phase change materials for thermal energy storage applications. JCT.. 2019;128:259-274.
- [CrossRef] [Google Scholar]
- Effect of Pr3+-doping on the structural, elastic and magnetic properties of Mn–Zn ferrite nanoparticles prepared by solution combustion synthesis method. Chem. Data. Collect.. 2019;24:100273
- [CrossRef] [Google Scholar]
- Structurally characterized homo-trinuclear Zn II and hetero-pentanuclear [Zn II4 RE III] complexes constructed from an octadentate bis (Salamo)-based ligand: hirshfeld surfaces, fluorescence and catalytic properties. New. J. Chem.. 2019;43(11):4605-4619.
- [CrossRef] [Google Scholar]
- Recent progresses in exploring the rare earth based intermetallic compounds for cryogenic magnetic refrigeration. J. Alloy. Compd.. 2020;823:153810
- [CrossRef] [Google Scholar]
- Recent progress in the design and applications of fluorescence probes containing crown ethers. Chem. Soc. Rev.. 2017;46(9):2437-2458.
- [CrossRef] [Google Scholar]
- Optical and luminescence properties of Sm3+-doped cadmium–aluminum–silicate glasses. Appl. Phys. Lett.. 2002;80(15):2642-2644.
- [CrossRef] [Google Scholar]
- Ta-doped PrBa0. 94Co2-xTaxO5+δ as promising oxygen electrodes: a focused study on catalytic oxygen reduction reaction activity, stability and CO2-durability. J. Power. Sources.. 2019;417:42-52.
- [CrossRef] [Google Scholar]
- A single-ligand-protected Eu 60− n Gd (Tb) n cluster: a reasonable new approach to expand lanthanide aggregations. Inorg. Chem. Front.. 2020;7(10):2072-2079.
- [CrossRef] [Google Scholar]
- Thermal investigation and infrared evolved gas analysis of light lanthanide (III) complexes with pyridine-3, 5-dicarboxylic acid. J. Anal. Appl. Pyrol.. 2009;86(2):239-244.
- [CrossRef] [Google Scholar]
- Rare-earth based tetrapyrrolic sandwiches: chemistry, materials and applications. Chem. Soc. Rev.. 2022;51:9262-9339.
- [CrossRef] [Google Scholar]
- A diaminopropane-appended metal–organic framework enabling efficient CO2 capture from coal flue gas via a mixed adsorption mechanism. J. Am. Chem. Soc.. 2017;139(38):13541-13553.
- [CrossRef] [Google Scholar]
- Thermokinetic and TG/DSC-FTIR study of pea waste biomass pyrolysis. Appl. Therm. Eng.. 2018;137:54-61.
- [CrossRef] [Google Scholar]
- Rare earth ion encapsulated basket-like Gd⊂ P6MoV2MoVI16O73 cage as efficient electrochemical sensor and fluorescent probe for Cr (VI) Cryst. Growth. Des.. 2020;20(6):3584-3589.
- [CrossRef] [Google Scholar]
- Copper (II) and Nickel (II) complexes of the non-steroidal anti-inflammatory drug indomethacin containing aromatic chelating N, N-donor ligand: synthesis and structural studies. J. Mol. Struct.. 2020;1224:129069
- [CrossRef] [Google Scholar]
- Infrared spectra of hydrogen bond network in lamellar perfluorocarboxylic acid monohydrates. Spectrochim. Acta. A.. 2021;253:119551
- [CrossRef] [Google Scholar]
- Nickelate superconductivity without rare-earth magnetism:(La, Sr) NiO2. Adv. Mater.. 2021;33(45):2104083.
- [CrossRef] [Google Scholar]
- Chemical sensors for rare earth metal ions. Coord. Chem. Rev.. 2021;429:213639
- [CrossRef] [Google Scholar]
- The chemical consequences of the gradual decrease of the ionic radius along the RE-series. Coordin. Chem. Rev.. 2020;406:213146
- [CrossRef] [Google Scholar]
- Prospects of additive manufacturing of rare-earth and non-rare-earth permanent magnets. Proc. Manuf.. 2018;21:100-108.
- [CrossRef] [Google Scholar]
- Synthesis, photoluminescence and thermodynamicals of two lanthanide coordination polymers with 5-nitroisophthalate. J. Solid. State. Chem.. 2019;270:443-449.
- [CrossRef] [Google Scholar]
- Synthesis, characterization, stability and thermal conductivity of multi-walled carbon nanotubes (MWCNTs) and eco-friendly jatropha seed oil based nanofluid: an experimental investigation and modeling approach. J. Mol. Liq.. 2019;293:111534
- [CrossRef] [Google Scholar]
- New insights on transition metal coordination compounds with biological active azole and nitroimidazole derivatives. Coordin. Chem. Rev.. 2023;494:215360
- [CrossRef] [Google Scholar]
- Thermodynamic evidence of structural transformations in CO2-loaded metal−organic framework Zn-(MeIm)2 from heat capacity measurements. J. Am. Chem. Soc.. 2020;142:4833-4841.
- [CrossRef] [Google Scholar]
- Shrestha, P. K., P. R. Shakya., 2020. Synthesis and structural characterization of some lanthanide (III) nitrate complexes with a mesogenic schiff-base, N, N’-Di-4-(4’-heptadecyloxybenzoate) salicylidene-1, 3-diaminopropane derived from 2, 4-dihydroxybenzaldehyde. J. Nepal. Chem. Soc. 41(1)m 16-25. doi: 10.3126/jncs.v41i1.30509.
- Decoupling theranostics with rare earth doped nanoparticles. Adv. Funct. Mater.. 2019;29(12):1807105.
- [CrossRef] [Google Scholar]
- A new look at the structural and magnetic properties of potassium Neptunate K2NpO4 combining XRD, XANES spectroscopy, and low-temperature heat capacity. Inorg. Chem.. 2017;56:5839-5850.
- [CrossRef] [Google Scholar]
- Stables, S.T., 2021. Mechanochemical Synthesis of Transition Metal Co-Crystals, Doctoral dissertation.University of Otago, New Zealand.
- Structure, Luminescence, and Raman Spectroscopy of europium and terbium dipivaloylmethanates and other β-diketonates with 2, 2′-bipyridine. J. Struct. Chem.. 2020;61:1026-1037.
- [CrossRef] [Google Scholar]
- A family of functional RE-organic framework constructed by iodine-substituted aromatic polycarboxylic acid for turn-off sensing of UO22+. Appl. Organomet. Chem.. 2019;33(5):e4898.
- [CrossRef] [Google Scholar]
- Construction, thermochemistry, and fluorescence properties of novel lanthanide complexes synthesized from halogenated aromatic carboxylic acids and nitrogen-containing ligands. Acta. Phys. Chim. Sin.. 2023;39(1):2206035.
- [CrossRef] [Google Scholar]
- Site-preferential occupancy induced photoluminescence tuning in (Ca, Ba)5 (PO4)3 Cl: Eu2+ phosphors. RSC Adv.. 2016;6(49):43771-43779.
- [CrossRef] [Google Scholar]
- Low-temperature heat capacity and enthalpy of formation of [Er2(Gly)6(H2O)4](ClO4)6·5H2O. J. Chem. Eng. Data.. 2007;52:1182-1185.
- [CrossRef] [Google Scholar]
- A method combining FTIR-ATR and Raman spectroscopy to determine soil organic matter: Improvement of prediction accuracy using competitive adaptive reweighted sampling. Comput. Electron. Agr.. 2021;191:106549
- [CrossRef] [Google Scholar]
- Porous lanthanide–copper coordination frameworks exhibiting reversible single-crystal-to-single-crystal transformation based on variable coordination number and geometry. CrystEngComm.. 2008;10(5):598-604.
- [CrossRef] [Google Scholar]
- Novel rare earth coordination polymers with greatly enhanced fluorescence by synergistic effect of carboxyl-functionalized poly (arylene ether nitrile) and 1, 10-Phanthroline. Eur. Polym. J.. 2020;141:110078
- [CrossRef] [Google Scholar]
- Rare earth metal–organic frameworks (RE-MOFs): Synthesis, properties, and biomedical applications. Coordin. Chem. Rev.. 2021;429:213620
- [CrossRef] [Google Scholar]
- Thermodynamical and spectroscopic studies of the complexes formed in tartaric acid and lanthanide (III) ions binary systems. Molecules.. 2020;25(5):1121.
- [CrossRef] [Google Scholar]
- Preparation, spectral properties and thermal degradation of new ternary complexes of La (III), Ce (III), Pr (III) and Nd (III) ions with N-Phylanthranilic acid and 1, 10-Phanthroline. Thermochim. Acta.. 2018;659:242-252.
- [CrossRef] [Google Scholar]
- Comparison of spectral and thermal properties and antibacterial activity of new binary and ternary complexes of Sm (III), Eu (III) and Gd (III) ions with N-Phylanthranilic acid and 1, 10-Phanthroline. Thermochim. Acta.. 2019;671:134-148.
- [CrossRef] [Google Scholar]
- Structure elucidation, in vitro binding studies and ROS-dependent anti-couldcer activity of Cu (II) and Zn (II) phthaloylglycinatePh complexes against MDA-MB-231 cells. Metallomics.. 2021;13(11):mfab064.
- [CrossRef] [Google Scholar]
- Couldcer cell membrane-coated rare earth doped nanoparticles for tumor surgery navigation in NIR-II imaging window. Chem. Eng. J.. 2020;385:123959
- [CrossRef] [Google Scholar]
- Synthesis, crystal structure and thermal degradation mechanism of the complex [Sm (p-BrBA)3bipy· H2O]2· H2O. J. Alloy. Compd.. 2008;464(1–2):277-281.
- [CrossRef] [Google Scholar]
- Rare earth-free luminescent materials for WLEDs: recent progress and perspectives. Adv. Mater. Technol-US.. 2021;6(1):2000648.
- [CrossRef] [Google Scholar]
- Crystal structures and thermodynamical properties of lanthanide complexes with 2, 6-dimethylbenzoic acid and 2, 2′: 6′, 2′′-terpyridine. J. Chem. Thermodyn.. 2021;152:106293
- [CrossRef] [Google Scholar]
- Porous Zn (II)-based metal–organic frameworks decorated with carboxylate groups exhibiting high gas adsorption and separation of organic dyes. Cryst. Growth. Des.. 2018;18(11):7114-7121.
- [CrossRef] [Google Scholar]
- Rare-earth doping in nanostructured inorganic materials. Chem. Rev.. 2022;122(6):5519-5603.
- [CrossRef] [Google Scholar]
- In vivo molecular imaging for immunotherapy using ultra-bright near-infrared-IIb rare-earth nanoparticles. Nat. Biotechnol.. 2019;37(11):1322-1331.
- [CrossRef] [Google Scholar]
- Calorimetric studies on two halogenated uracil isomers. Thermochim. Acta.. 2016;634:6-11.
- [CrossRef] [Google Scholar]
Appendix A
Supplementary material
Supplementary data to this article can be found online at https://doi.org/10.1016/j.arabjc.2023.105462.
Appendix A
Supplementary material
The following are the Supplementary data to this article:Supplementary data 1
Supplementary data 1
Supplementary data 2
Supplementary data 2
Supplementary data 3
Supplementary data 3
Supplementary data 4
Supplementary data 4


