

Translate this page into:
Effect of calcination temperature and duration on structural and dielectric properties of CaFeO3-δ
-
Received: ,
Accepted: ,
This article was originally published by Elsevier and was migrated to Scientific Scholar after the change of Publisher.
Peer review under responsibility of King Saud University. Production and hosting by Elsevier.
Abstract
With its perovskite structure, CaFeO3-δ exhibits intriguing properties. It possesses remarkable dielectric properties that make it an attractive candidate for various technological applications such as capacitors, enhanced signal transmission, and other electronic components. The primary objective of this study is to optimize the dielectric properties of CaFeO3-δ perovskite material. For this purpose, an ideal combination of the duration and temperature of calcination was studied. The calcination conditions were variated, from 600 °C to 1100 °C for the temperature at different durations (4 h and 10 h). The XRD results were refined using the Rietveld refinement, showing a simple orthorhombic crystallographic structure. This structure was found for samples calcined at 900 °C, 1000 °C, and 1100 °C during 4 h and 10 h, according to the observed and calculated patterns (Rp ≤ 5 % - Rwp ≤ 7 %) of these ceramics. The sample calcinated at 1000 °C/4h has the closest χ2 factor to 1 which indicates an optimum crystallinity. the crystallite size goes from 70.8245 nm to 99.1266 nm with the increase of the calcination temperature and duration, this parameter was calculated using the XRD peak broadening analysis and the Scherrer equation. SEM analysis revealed, that high temperature and calcination time led to a larger grain size. Notably, samples calcined at 1100 °C/10 h had a larger particle size of 1.312 μm, confirming the crystallite size evolution determined by XRD. FT-IR and Raman analyses further confirmed the samples purity. Dielectric studies showed that the colossal dielectric constant (ε') reached a maximum of 105 for CaFeO3-δ calcined at 1000 °C for both durations. The lower transition temperature was found for the sample calcined at 1000 °C/10 h with a value of 257 °C. The maximum conductivity of 0.22 S/m at 1 MHz was recorded for the CaFeO3-δ calcined at 1000 °C/10 h. Furthermore, the dielectric constant exhibits relaxational behavior, which can be attributed to the strong correlation between the ferrite conduction mechanism and their dielectric behavior. The dielectric material does not follow the ideal Debye theory, according to Cole-Cole analysis, indicating a distribution of relaxation times instead. These obtained properties make this ceramic (CaFeO3-δ calcined at 1000 °C/10 h) a potential candidate for dielectric and electrical device applications such as batterie and electric capacitors.
Keywords
CaFeO3-δ
Crystal structure
Raman spectroscopy
SEM
Dielectric properties
Conductivity

1 Introduction
In our days scientists are interested in materials that are characterized by several properties of optical electric and magnetic order such as perovskite. This later indicates an ideal cubic structure of ionic oxides of formula ABO3, where A is an earthy alkaline that plays an important role in stabilizing the crystal structure (Zhang et al., 2022), and B is a transition metal (Jaiswal, 2020; Karki and Ramezanipour, 2020) with catalytic activity. The calcium ferrite CaFeO3-δ (CFO) belongs to this family of perovskites that attracted the attention of researchers, as a result of the presence of oxygen vacancies (δ), and different electronic states of iron ions (Ghosh and Mahato, 2018; Huang, 2019). The ideal cubic structure of CaFeO3- δ gets distorted and converted to an orthorhombic structure when the values of (δ) rise (Yue et al., 2022). In addition, Zdorovets et al mentioned that CaFeO3- δ has a magnetic ordering which is a G-type antiferromagnetism with a Néel temperature of 115 k (Abdel-Khalek et al., 2022; Zdorovets et al., 2021; Kostishyn et al., 2016; Trukhanov, 2018).In order to study the effect of oxygen vacancies and Fe oxidation states on CaFeO3- δ properties, E. K. Abdel-Khalek et al (Abdel-Khalek et al., 2022) successfully synthesized the perovskite nanomaterial using the sol–gel method, and by applying the XRD data in Rietveld refinement they were able to discover an orthorhombic structure with the space group pcmn and according to the Mössbauer and XPS data, they found that CaFeO3- δ exhibits oxygen vacancies and magnetic species (Fe3+ in octahedral coordination, and Fe4+ in tetrahedral coordination) at room temperature (Nitika and Kumar, 2021). A similar process of synthesizing CaFeO3-δ was used by Ghosh and D.K. Mahato (Ghosh and Mahato, 2018) to form polycrystalline nanopowders. The magnetic measurements revealed a strong localization of the electrons, which resulted in a field-induced meta-magnetic first-order transition. The phase coexistence between the high-temperature antiferromagnetic insulating state and the ferromagnetic metallic equilibrium state upon devitrification at lower temperatures was studied using the CHUF procedure. Other studies were focused on the structural, electrical, and thermoelectric properties, N. Zafar and M.N. Khan (Zafar and Khan, 2015; Yang, 2021) adopted the solid-state reaction approach at 1000 °C to precipitate CaFeO3-δ. Rietveld analysis of the XRD data indicated the same results as E. K. Abdel-Khalek et al (Abdel-Khalek et al., 2022). By using electrical resistivity, N. Zafar and M.N. Khan demonstrated that the conduction in the CaFeO3-δ sample happened as a result of variable range hopping of the electrons. Most charge carriers in these samples were electrons, as shown by the negative Sign of the Seebeck coefficient. Due to its defined qualities, this material may be used in applications for electric and thermoelectric devices.
In the realm of materials science and perovskite oxide research, the intricate properties of CaFeO3-δ have long piqued the interest of scientists and researchers such as its structural, catalytic, and magnetic attributes. These characteristics of CaFeO3-δ make it well suited to a range of potential applications, such as batteries, fuel cells, gas sensors (Narsimulu et al., 2015; Yang, et al., 2023; Şaşmaz Kuru et al., 2018), catalytic converters, and memory devices (Jaiswal, 2020; Huang, 2019; Chauhan and Jaiswal, 2021). However, the dielectric properties of CaFeO3-δ have remained unexplored in previous studies, so these properties will be investigated specifically in this study. The objective of this study is the preparation of CaFeO3-δ by solid-state reaction method with varying calcination temperatures and durations, to study their effect on the structural phase, microstructural, and dielectric properties to find the optimum calcination conditions. The contributions of grains and grain boundaries were studied by Nyquist plots and were correlated with microstructure, conductivity, and dielectric results.
2 Experimental section
2.1 Materials and methods
The synthesis of CaFeO3-δ perovskite was achieved using a solid-state method, as depicted in Fig. 1. In this method, the diffusion capacity of the cations and anions in the solid state plays a critical role, requiring high temperatures and long reaction times to increase the diffusion rate and reaction rate for obtaining a stable phase. To achieve this, stoichiometric amounts of high-purity dried powders of CaCO3 (99.9 atom %, sigma–aldrich) and Fe2O3 (99.9 atom %, sigma–aldrich) were ground in an agate mortar for 60 min, following the general chemical equation (1). After grinding, the product was homogenized in a container containing acetone for 4 h.
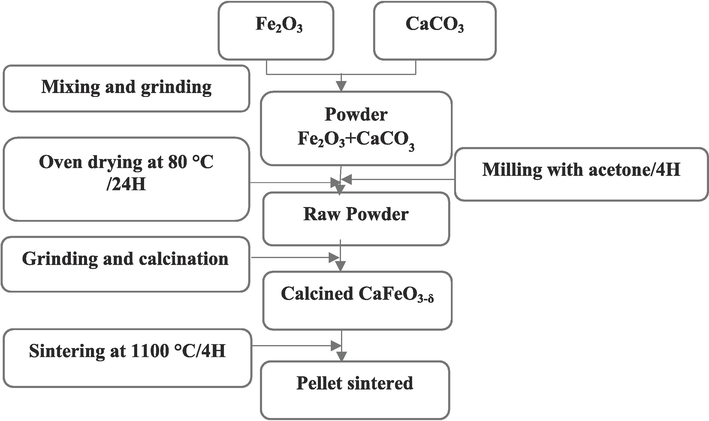
The different stages of CaFeO3-δ preparation.
The ceramics were heated at different temperatures (600 °C, 700 °C, 800 °C, 900 °C, 1000 °C, and 1100 °C) for two different durations (4 h and 10 h), as shown in Fig. 2. After heating, the powders were ground with an agate mortar for 30 min and mixed with a 3 % solution of polyvinyl alcohol (PVA) binder. The resulting mixture was pressed under 8 tons (685 MPa) of pressure using a hydraulic press to make pellets with dimensions of 12 mm in diameter and 1–2 mm thickness for dielectric measurement. These pellets were then sintered at 1100 °C for four hours in the air.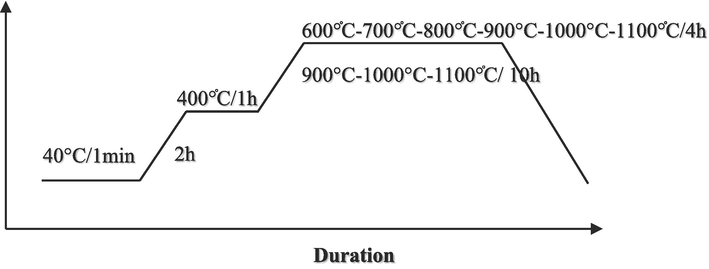
Clacination cycle of CaFeO3-δ.
Using X-ray diffraction (RX) (XPERT-PRO with CuK radiation where (λ = 1.5406) across the range 2θ ∼10-80° with a step size of 0.02°, the effect of calcination temperature and duration on the proprieties structural of the CFO samples was examined. The Rietveld refinement was carried out using FULLPROF suite software and was extended to refine the crystal phases, also for calculating the lattice parameters. The Raman spectroscopy was successfully used to study the structural evolution of ceramics, and measurements were performed at room temperature in the region of 100–1000 cm−1, This spectrometer is equipped with a monochromatic excitation source with a laser power of ≈10 mW and a wavelength of 410 nm. In addition, the microstructures of the pellets are examined using a scanning electron microscope (SEM, model JEOL JSM5410). An energy-dispersive X-ray analyzer (EDX, model Kevex, Sigma KS3) is used for the elemental analysis of sintered samples.
The dielectric measurements are performed on disk-shaped pellets. After sintering, both sides of the pellets are polished with an abrasive paper. The sides of the pellets are then metalized by a thin layer of silver lacquer, to form a plane capacitor. The capacitance and corresponding dielectric losses (Tanδ) as a function of temperature from ambient to 500 °C and frequency from 1000 Hz to 2 MHz, of the capacitor thus formed, are measured using an independence meter operating under a low excitation level of 1 V inducing an electric field. These dielectric measurements are performed with an automatic impedance bridge HP4284A. The degree of charge mobility within the substance is measured by its electrical conductivity. The movement of the charge can be used to determine the product's qualities (insulator, semiconductor, and conductor). The obtained dielectric measurements were used to determine the AC conductivity (σac), which was assessed using the relationship shown below (2):
The Nyquist plot is a crucial experimental piece of information used in impedance spectroscopy to evaluate the circuit. The parallel RC circuit produces an arc on the Z“-Z' plane; and an additional capacitive element connected in parallel with a resistor adds a semicircular arc, while the resistive element produces a displacement on the real axis. The impedance Z is calculated using the formula (3):
To trace the Nyquist diagram, we separate Z Reel (Z') and Z imaginary (Z’’) following the Eq. (4):
Furthermore, ω represents the angular frequency (2πf), C for the sample's geometric capacitance, and ε0 for the permittivity of space (8.854*10-12F/m). The contribution of the ceramics grain and grain boundary impacts is studied using complex impedance and Cole–Cole plots which were fitted using the Z-view.
3 Results and discussion
3.1 XRD results
In order to identify the crystallographic structure of CaFeO3-δ samples, calcined at different temperatures (600 °C to 1100 °C) and durations (4 h and 10 h), the X-ray diffraction was investigated as presented in Fig. 3. The crystallographic structures were refined using the Rietveld technique while varying temperature and calcination time. This analysis was facilitated by FullProf software, in conjunction with WinPlotr. To model the peak profiles, a pseudo-Voigt function was employed, and a 12-coefficient polynomial function defined the background level. The refinement process included various parameters such as fractional atomic coordinates, scale coefficient, atomic occupancy, preferential orientation coefficient, isotropic displacement coefficient (in Å^2), zero-point detector, global isotropic displacement parameters (temperature), cell coefficients, background refinement (via a 12-coefficient polynomial function), half-width coefficients, asymmetry coefficients, and profile shape coefficient (η). The results show that all the powders crystallize in the pure perovskite phase without the presence of a secondary phase. Above 700 °C of calcination temperature, the characteristic peaks of the pure orthorhombic perovskite-like phase appear and remain the same with the change of temperature and duration of calcination. The effect of calcination temperature and duration on crystallinity phase parameters of CaFeO3-δ powders we carried out by the Rietveld refinement method using Full-Prof software. The fitted results are shown in Fig. 4 and confirmed a single orthorhombic crystallographic phase formation of CaFeO3-δ powders with a space group of Pcmn. The structure obtained was in accordance with the previous work reported by Zafar, N. et al (Zafar and Khan, 2015). The lattice parameters (a, b, and c), cell volume (V), B position, site occupancy, and reliability factors obtained from the Rietveld fitting are grouped in Table 1. As expected, the fitted cell parameters, lattice coordinate, and B position are nearly in a zigzag by varying the time and temperature treatment, This might be caused by substitution disorder and compositional changes in the cation arrangement at one or more Ca and Fe crystallographic positions (Gouitaa Najwa et al., 2022), in addition, the change of the calcination conditions can affect the thermal vibrations of the atoms in the crystal structure. But the cell volume increases with the increase of temperature (for both 4 h and 10 h), due probably to many factors such as internal stress, surface energy, and surface stress. The reliability factor χ 2; which represents the ratio between the theoretical and experimental fit; is between 1 and 2 for all the powders and close to 1 for the ceramic calcined at 1000 °C/4H, which confirms the good crystallinity of this powder. A good agreement between the observed and calculated patterns was obtained with Rp ≤ 5 %, and Rwp ≤ 7 % for all ceramics. The broadness of the diffraction peaks of the CaFeO3-δ phase (Table 1) confirms the nano-crystalline nature of the prepared materials, which indicates that the diffraction peak half-width FWHM and average crystallite size depends clearly on the temperature and duration treatment. The average crystallite size was calculated from Scherrer's formula (Akl and Hassanien, 2021; Hassanien and Akl, 2018) as follows (5):
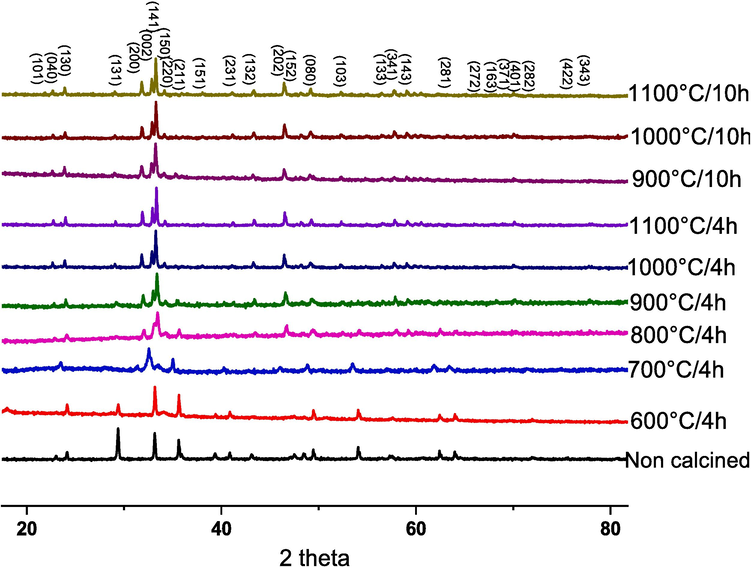
XRD spectra of CaFeO3-δ powders calcined at different temperatures and durations.
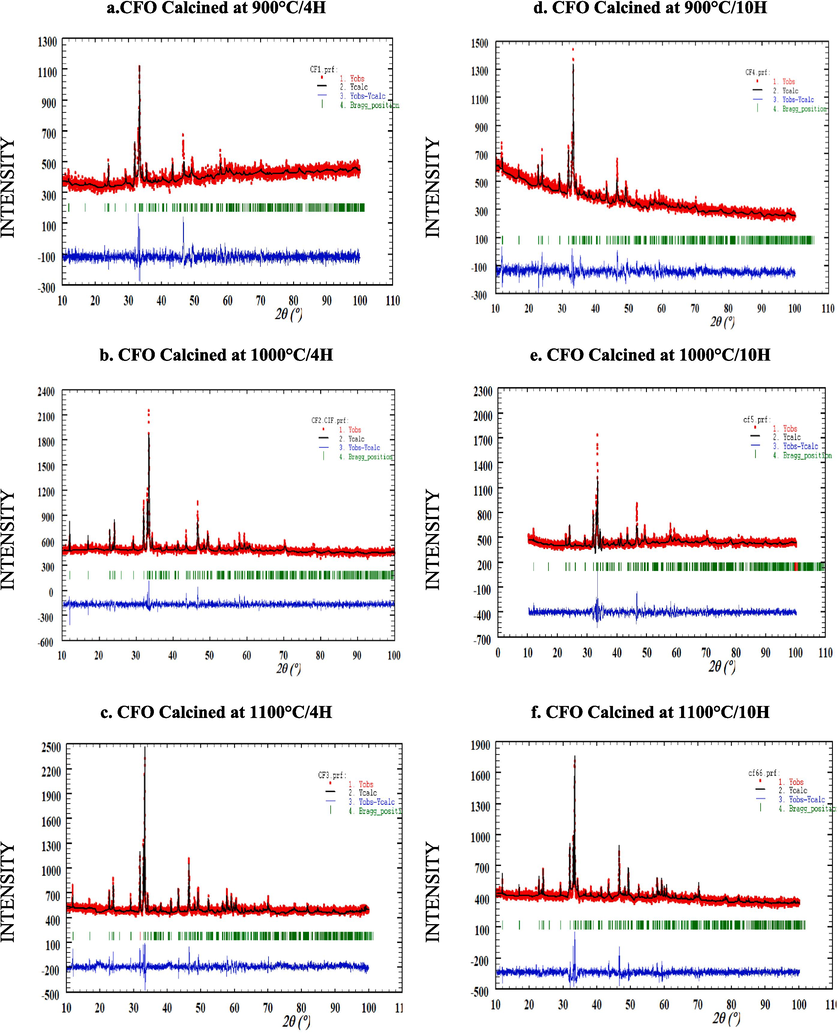
Refinement of CaFeO3-δ compounds calcined at different temperatures and durations using the Rietveld method by Full-prof program.
Lattice parameters
atom
Lattice coordinate
B (position)
occupancy
Reliability factors
FWHM1
Crystallite Size D (nm)
x
y
z
CFO calcined at 900C/4H
a = 5.60 A°
b = 14.82 A°
c = 5.3806 A°
V = 446.94 A°3
Fe1
0.00000
0.00000
0.00000
0.122
0.500
Rp: 4.10 Rwp: 5.68 Chi2: 1.34
0,11709
70,8245
Fe2
−0.14477
0.25000
−0.18361
17.470
0.500
Ca1
0.02433
0.11178
0.46378
−3.595
1.000
O1
0.36331
−0.00576
−0.02812
3.427
1.000
O2
0.02466
0.19015
0.06801
0.885
1.000
O3
0.29476
0.25000
1.07528
3.770
0.283
CFO calcined at 1000C/4H
a = 5.589 A°
b = 14.768 A°
c = 5.4201 A°
V = 447.4425 A°3
Fe1
0.00000
0.00000
0.00000
−3.123
0.500
Rp: 3.46 Rwp: 4.52 Chi2: 1.02
0,08364
99,1248
Fe2
−0.06425
0.25000
−0.05093
−1.397
0.500
Ca1
0.02596
0.10933
0.48000
−2.578
1.000
O1
0.23685
−0.01933
0.25000
−5.963
1.000
O2
0.08051
0.14780
0.00000
−4.148
1.000
O3
−0.11754
0.25000
0.63000
−3.844
0.692
CFO calcined at 1100C/4H
a = 5.60777 A° b = 14.81423 A° c = 5.43635 A°
V = 451.27 A°3
Fe1
0.00000
0.00000
0.00000
0.37693
0.500
Rp: 4.23 Rwp: 5.55
Chi2: 1.560,066921
123,9148
Fe2
−0.06182
0.25000
−0.06292
1.36884
0.500
Ca1
0.03109
0.11050
0.48690
−0.66661
1.000
O1
0.23557
−0.02016
0.25997
−2.77198
1.000
O2
0.07749
0.14340
0.04178
−0.25365
1.000
O3
−0.15113
0.25000
0.62457
13.93430
0.65098
CFO calcined at 900C/10H
a = 5.61 A° b = 14.8412 A° c = 5.3787 A° V = 447.9926 A°3
Fe1
Fe2
Ca1
O1
O2
O30.00000––0.03725 0.04083 0.25000 0.05500––0.14300
0.00000 0.25000 0.10875––0.02777
0.14220
0.250000.00000
−0.10033 0.46563 0.16794
0.07848 0.654781.44911
0.78662
−2.06381
−2.45665
−6.44000
−3.422590.50000
0.50000
1.00000
1.00000
1.000
0.55752Rp: 5.31 Rwp: 6.71 Chi2: 1.45
0,1171
70,8059
CFO calcined at 1000C/10H
a = 5.64 A° b = 14.7800 A° c = 5.3900 A° V = 449.2661 A°3
Fe1
0.00000
0.00000
0.00000
−1.100
0.500
Rp: 4.45 Rwp: 6.19
Chi2: 1.710,10037
82,6081
Fe2
−0.06663
0.25000
−0.06287
−0.724
0.500
Ca1
0.02819
0.11160
0.48744
0.254
1.000
O1
0.24518
−0.01841
0.27410
−1.890
1.00000
O2
0.08004
0.12938
0.01228
4.587
1.00000
O3
−0.13441
0.25000
0.59137
8.945
0.73996
CFO calcined at 1100C/10H
a = 5.6239 A° b = 14.8993 A°
c = 5.3929 A° V = 451.8807 A°3
Fe1
0.00000
0.00000
0.00000
3.28123
0.500
Rp: 4.45 Rwp: 6.06 Chi2: 1.43
0,08364
99,1266
Fe2
−0.02185
0.25000
−0.04119
5.35500
0.500
Ca1
0.03418
0.10933
0.47175
1.34626
1.000
O1
0.22822
−0.01355
0.25955
−0.04875
1.000
O2
0.08196
0.13833
0.05768
−2.84601
1.000
O3
−0.18370
0.25000
0.55122
34.22261
0.93815
where D is the average grain size, β is full width at half maximum (FWHM), and γ is the wavelength of the copper target (0.15405 nm). The Bragg’s diffraction angle is denoted by θ. The values of FWHM and average crystallite size found are reported in Table 1 and show that the half-height width was narrower and the average crystallite size increased with increasing calcination temperature for the two durations 4 h and 10 h. But with changing the calcination time, an inverse phenomenon is observed which consists of an increase in FWHM and a reduction of crystallite size (Basak et al., Feb. 2022). This indicates that the crystallinity of the samples was improved with temperature increasing at low time duration. The same increase in crystallite size was found by Barbara Kucharczyk et al (Kucharczyk et al., 2019) for LaFeO3 compounds with a change in calcination temperature. Also, This result was consistent with that of Mahmoud Lebid (Lebid and Omari, 2014) and Qing Lin (Lin et al., 2018). The influence of calcination temperature and duration on the crystallite size of CaFeO3-δ has not been reported in the previous works.
3.2 SEM results
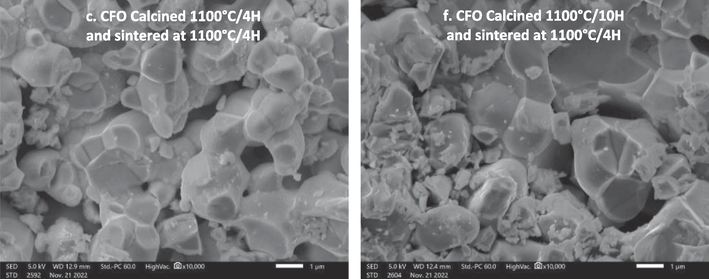
The morphology of the grains of CaFeO3-δ ceramics at different temperatures of calcination (900 °C-1100 °C) and durations (4 h and 10 h) and sintered at 1100 °C/4h is shown in Fig. 5. SEM analysis revealed that the layers of perovskites are independent of the calcination temperature and duration, and they are not homogeneous with the presence of a mixture of small and large grains in each sample. The grains formed in the pellets are porous in their bulk and surrounded by a number of small particles, whose average diameter is 0.5 µm. In addition, we can observe an aggregation phenomenon in the sample (especially in samples calcined at 1000 °C) and a decrease of porosity, this indicates that the chemical stress between the crystal increases with the increase in this calcination temperature (Chetan et al., 2020), leading to the shrinkage and aggregation of crystals. The same phenomenon was reported by Barbara Kucharczyk et al. for LaFeO3 ceramics synthesis using the sol–gel method (Kucharczyk et al., 2019). We can also notice that the ceramics calcined for 10 h are more porous than those calcined for 4 h. The calculated average grain size obtained from the SEM image (Table 2) confirmed that the samples calcined at high temperature ∼ 1100 °C, exhibit a large particle size in both duration (4 h and 10 h). These results agree with the crystallite size found in DRX results, and they are well matched with the values of LaFeO3 synthesized by Barbara Kucharczyk (Kucharczyk et al., 2019). In addition, Fig. 6 presents an Energy Dispersive Spectroscopy micrograph of the CaFeO3-δ perovskite sample calcined at different temperatures and durations and sintered at 1100 °C/4H, and Table 3 records the relative abundance of the elements (%) for all samples. The EDS analyses indicate the presence of Ca, Fe, and O elements in the CaFeO3-δ sample with some impurities of C since it is an outcome of the initial reagent; the percentage of C decreases with increasing temperature and calcination duration. according to the EDS studies, the Ca/Fe ratio is close to 1:1, as Table 3 demonstrates, which is consistent with the stoichiometry expected in the range of experimental errors, It can also be noticed that the atomic percentage of oxygen increases with the increase of the temperature and the duration of calcination which can mean the decrease of the vaccination sites of oxygen. These results highlight the importance of temperature and calcination conditions in influencing the elemental composition and properties of CaFeO3-δ perovskite.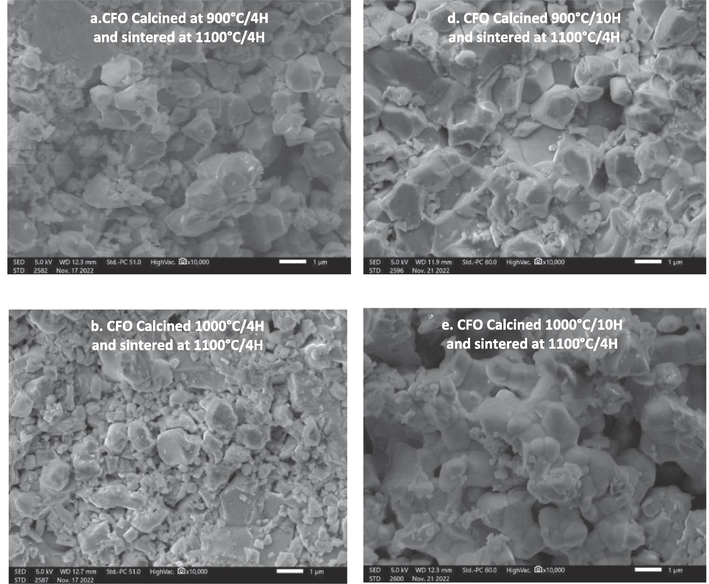
Micrographs SEM of CaFeO3-δ powders calcined at different temperatures and durations and sintered at 1100 °C/4H.
Micrographs SEM of CaFeO3-δ powders calcined at different temperatures and durations and sintered at 1100 °C/4H.
Samples
Average grain size (μm)
CFO calcined at 900C/4H
0.8993
CFO calcined at 1000C/4H
1.145
CFO calcined at 1100C/4H
1.209
CFO calcined at 900C/10H
0.9546
CFO calcined at 1000C/10H
1.282
CFO calcined at 1100C/10H
1.312
The EDS micrograph of the CaFeO3-δ perovskite samples calcined at different temperatures and durations and sintered at 1100 °C/4H.
Elements
weight%
Atom%
weight %
Atom%
weight %
Atom%
weight %
Atom%
Total
C (K)
O (K)
Ca (K)
Fe (K)
CFO calcined at 900 °C/4H
5.75 ± 0.13
14.07 ± 0.32
22.98 ± 0.52
42.22 ± 0.95
29.97 ± 0.50
21.98 ± 0.37
41.30 ± 0.94
21.74 ± 0.50
100.00
100.00
CFO calcined at 1000 °C/4H
2.60 ± 0.06
6.46 ± 0.14
26.34 ± 0.34
49.11 ± 0.64
30.82 ± 0.32
22.94 ± 0.24
40.25 ± 0.59
21.50 ± 0.31
100.00
100.00
CFO calcined at 1100 °C/4H
1.86 ± 0.05
4.71 ± 0.12
26.03 ± 0.34
49.55 ± 0.64
29.95 ± 0.32
22.75 ± 0.24
42.16 ± 0.60
22.99 ± 0.33
100.00
100.00
CFO calcined at 900 °C/10H
2.71 ± 0.06
6.80 ± 0.14
25.60 ± 0.34
48.13 ± 0.64
30.45 ± 0.32
22.86 ± 0.24
41.24 ± 0.60
22.21 ± 0.32
100.00
100.00
CFO calcined at 1000 °C/10H
1.75 ± 0.05
4.28 ± 0.11
29.01 ± 0.35
53.22 ± 0.64
29.62 ± 0.31
21.69 ± 0.23
39.61 ± 0.58
20.82 ± 0.30
100.00
100.00
CFO calcined at CF 1100 °C/10H
---
----
27.46 ± 0.35
53.13 ± 0.67
30.47 ± 0.32
23.54 ± 0.25
42.07 ± 0.61
23.33 ± 0.34
100.00
100.00
3.3 FT-IR results
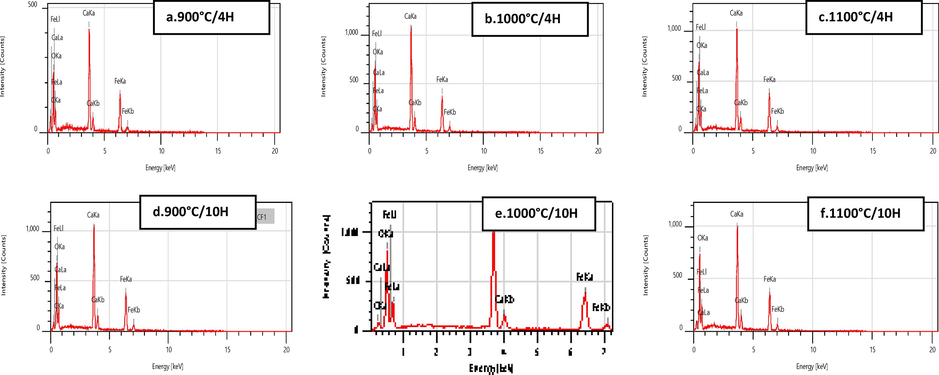
The infrared spectra of CFO samples calcined at various temperatures and durations are depicted in Fig. 7, and Table 4 summarizes the vibrations and assignment. The antisymmetric stretching vibration of the Fe-O bond in the regular octahedron FeO6 (Swatsitang et al., 2017; Lin et al., 2018; Saikia et al., 2022) is shown to represent the main band between 569 and 600 cm−1. This result is in line with those of a prior study by Qing Lin et al (Lin et al., 2018). The Fe-O band is present in the synthetic perovskite oxides La0.85Mg0.15FeO3 with a wavenumber of about 550.16 cm−1 (Lin et al., 2018). Additionally, Qing Lin et al. (Lin et al., 2018) noted that the LaFeO3 samples' spectral absorption pattern revealed a major band of Fe-O stretching vibrations at 574 cm−1 and 400 cm−1. Furthermore, a triplet of 3 bands consisting of a broad, intense absorption band at 1459 cm−1, a thin, intense band at 874 cm−1, and a thin, weak band at 712 cm-1 appears, These are the three modes of C-O elongation of the carbonate group that characterizes CaCO3 (Lin et al., 2018). The latter shows that the samples calcined at 700 °C/4H and 800 °C/4H have a certain level of impurity since it is an initial reagent that disappears with an increase in calcination temperature. The symmetrical stretching vibration band of the carboxyl root appears at around 2359 cm−1 (Lin et al., 2018), and the existence of a peak at 3642 cm−1 indicates the presence of calcium hydroxide Ca(OH)2 according to the work reported in the literature (Lin et al., 2018). On the other hand, with the increase in calcination temperature, the intensities of the bands related to carbon bonds and OH bonds decrease gradually. These OH and C are probably related to small amounts of acetone and precursor residues. It has been observed that certain bonds are not detectable by XRD, but can be identified through Infrared analysis. These bonds are formed mainly at the surface due to exposure to ambient air. Additionally, the appearance of CO2 can be attributed to the release of these bonds on the surface of the powders. These results confirm the purity of the synthesized CFO and are consistent with the literature spectra (Kozakov, 2016).
FT-IR spectra of CaFeO3-δ powders calcined at different temperatures and durations.
Wave-number cm−1
Assignement
569
Fe-O (The antisymmetric stretching vibration)
712
C-O (weak band)
874
C-O (thin, intense band)
1459
C-O (intense absorption band)
2359
COOH (The symmetrical stretching vibration)
3642
Ca(OH)2 (thin band)
3.4 RAMAN results
The Raman spectroscopy analysis of all the CFO powders calcined at different temperatures and durations of calcination is shown in Fig. 8. Many vibrational modes of the orthorhombic CaFeO3-δ structure in the Pcmn space group are undetectable because of their low polarizabilities. For CFO calcinated at 700 °C/4H and 800 °C/4H, four modes 218 cm−1, 287 cm−1, 403 cm−1 and 602 cm−1 are registered that refers to a spectrum of Fe2O3 (Kozakov, 2016). these peaks disappeared with increasing temperature and calcination time for the other CFO; which means that the 900 °C temperature is the beginning of the disappearance of the precursors. For the other powders calcined at 900 °C, 1000 °C, and 1100 °C for 4 h and 10 h, the Raman spectra contain the same modes. Indeed, the symmetric-stretching modes at 250, 305, and 707 cm−1, are corresponded to the breathing-type distortion of the FeO6 octahedra (Deka et al., 2018). In addition; the peak 375 cm−1, can be attributed to the mixed motion of Ca and O ions, as Ghosh et al (Kucharczyk et al., 2019) illustrated. The mode close to 667 cm−1 is assigned to the maghemite γ-Fe2O3; while the observation of maghemite iron implies a reduction in the atmosphere (Gouitaa et al., 2023). Less study of lattice dynamical calculations and assignment of the Raman modes for CaFeO3-δ materials are reported. Moreover; there are some controversial points in the assignment of the mode. Further details will be studied in future work. According to the spectra found in the literature, the CFO therefore had a good structural organization with an orthorhombic perovskite phase (Kozakov, 2016).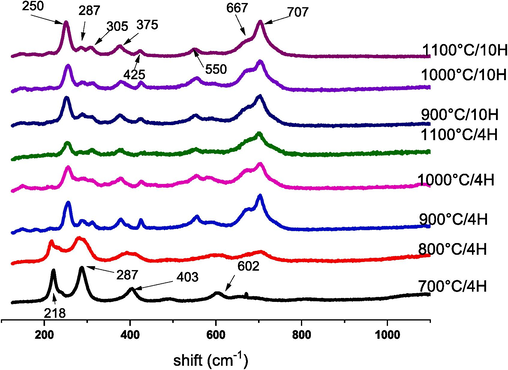
Raman spectra of CaFeO3-δ powders calcined at different temperatures and durations.
3.5 Dielectric studies
The temperature dependence on dielectric permittivity of CaFeO3-δ ceramics at different calcination temperatures (900 °C-1100 °C) and durations (4 h and 10 h) is shown in Fig. 9. In both calcination durations (4 h and 10 h), we can notice the presence of two anomalies T1 and T2 for calcination temperatures of 900 °C and 1000 °C. While at 1100 °C, the two anomalies are merged into one broad phase transition. The samples calcined at 1000 °C showed a good enhancement of dielectric properties. However, the dielectric permittivity reaches colossal values for both duration times which are about 105. This colossal dielectric response in CaFeO3-δ is related to the high capacitance of the grain boundaries which is an extrinsic effect. The understanding of the origin of this response is recorded according to the IBLC model described by I. Jalaf et al. (Jalafi, 2023), and by Y. Zhang et all (Zhang, 2019) in which the ε′ is given by the following Eq. (6):
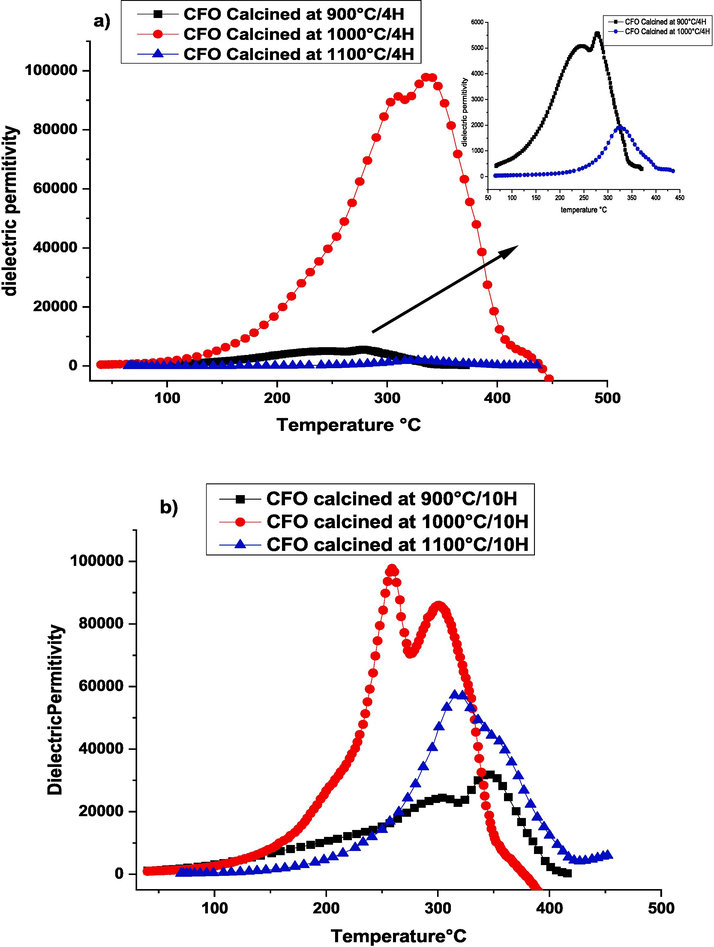
The dielectric permittivity as a function of temperature rise at 1000 Hz frequency for samples CaFeO3-δ calcinated at 900––1000-1100 °C for two durations a) 4 Hours, b) 10 Hours, and sintered at 1100 °C/4H.
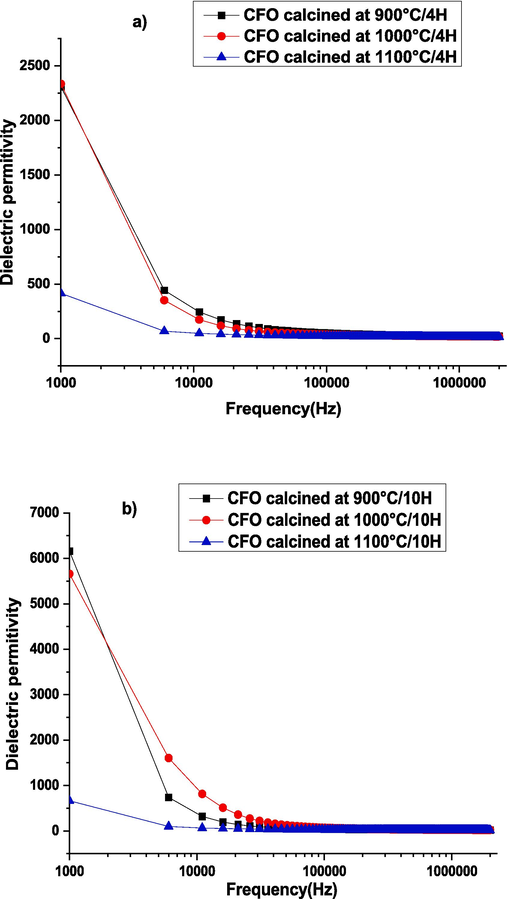
The dielectric permittivity as a function of frequency rise at ambient temperature for samples CaFeO3-δ calcinated at 900––1000-1100 °C for two durations a) 4 Hours and b) 10 Hours and sintered at 1100 °C/4H.
3.6 Electrical properties
The effect of calcination temperature and duration time on the conductivity of CaFeO3-δ ceramics can be investigated by studying the alternative conductivity. Thus, the evolution of Ac-conductivity as a function of frequency, at 340 °C test temperature, for all samples, is represented in Fig. 11. It is clear to see that the conductivity is frequency-independent at low-frequency regions which is called continuous conductivity σdc, which means that the conductivity follows a direct current due to the presence of free charge carriers and the weak electron hopping (Singh Yadav et al., 2020.; Narsimulu et al., 2015; Hajlaoui et al., 2019). At high-frequency regions, the conductivity increases with a frequency that is attributed to the hopping mechanism of the small polaron as described by N. Gouitaa et al (Gouitaa et al., 2021)and by Kyeong-Han Na et al (Na, 2018). It is confirmed that for solid materials the small polaron concept is present which is responsible for the enhancement of Ac-conductivity. According to Maxwell–Wagner theory and Koop’s model, ferrite grains that conduct electricity are separated by non-conductive, oxygen-rich grain boundaries. These non-conductive grain boundaries are more significant in low-frequency regions. However, at higher frequency regions, conductive grains are more prominent, thus the frequency of skipping between Fe2+ and Fe3+ ions of calcium ferrite increases (Hakeem, 2021; Murugesan and Chandrasekaran, 2015; Unal, 2022). With changing the calcination conditions, a noticeable increase in σac values for the sample calcined at 1000 °C/10 h (The maximum conductivity is 0.22 S/m at 1 MHz) more than the sample calcined for 4 h, which is probably due to the grain growth showed in Fig. 5.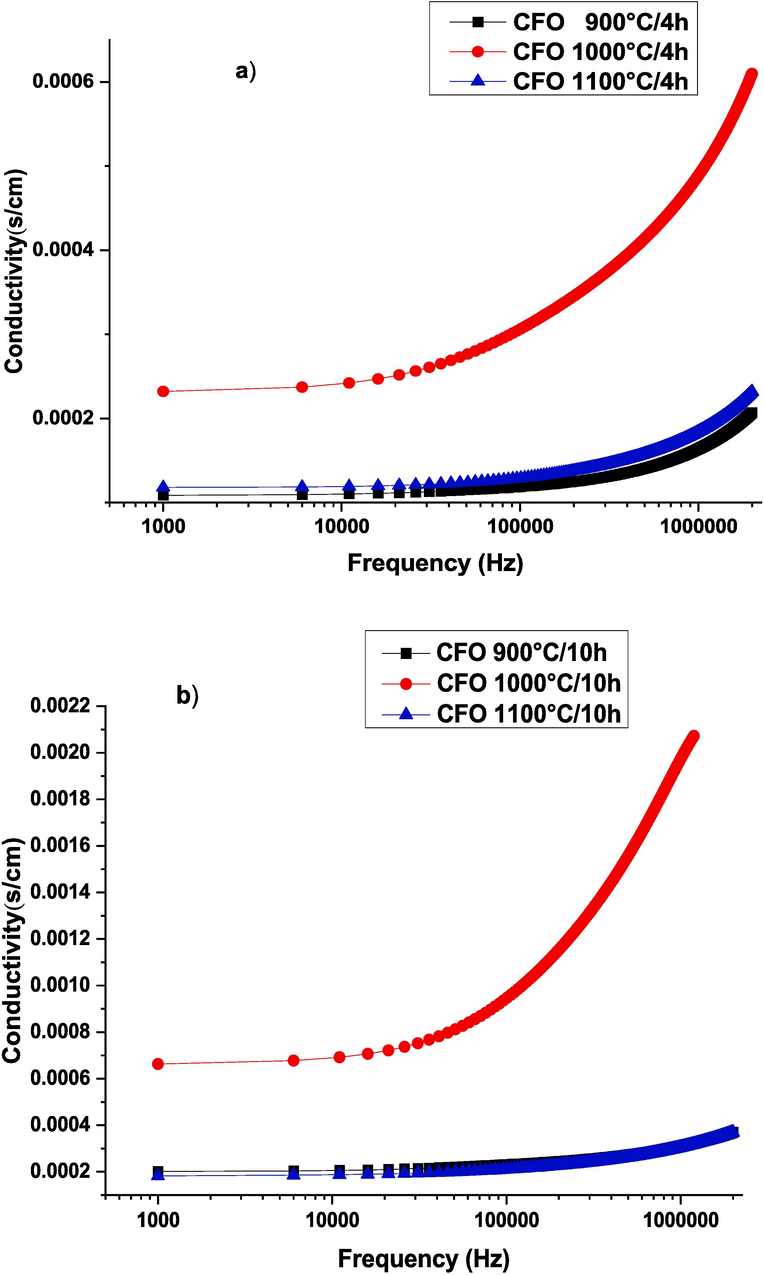
Electrical conductivity curves as a function of frequency rise at 340 °C for all samples CaFeO3-δ calcined for 4H (a) and calcined for 10H (b) and sintered at 1100 °C/4H.
The frequency dependence of the conductivity, often described as the Universal Dynamic Response (UDR), can be succinctly expressed using Jonsher's law (Singh Yadav et al., 2020.; Jafarpour et al., 2022) by the following Eq. (7):
S exponent values
CFO Calcined for 4 h
CFO Calcined for 4 h
CFO Calcined at 900 °C
0,91365
0,942
CFO Calcined at 1000 °C
0,9706
0,96726
CFO Calcined at 1100 °C
0,925
0,9483
Fig. 12 displays the variation of ln(σDC) as a function of the inverse of temperature (1000/T), which provides the activation energy value for electrical conduction of CFO ceramics at 100 kHz where the temperature dependence of the conductivity, determined from Arrhenius law (8).
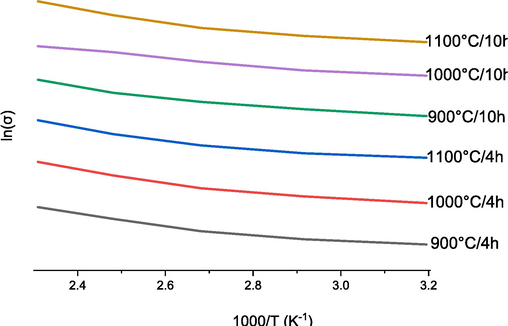
. Conductivity ln(σDC) as a function of 1000/T at 100 kHz for samples CaFeO3-δ calcinated at 900––1000-1100 °C for two durations a) 4 Hours and b) 10 Hours, and sintered at 1100 °C/4H.
Samples
Ea(ev)
CFO calcined at 900 °C/4H
2.994254
CFO calcined at 1000 °C/4H
2.955265
CFO calcined at 1100 °C/4H
2.958867
CFO calcined at 900 °C/10H
2.818227
CFO calcined at 1000 °C/10H
2.457589
CFO calcined at 1100 °C/10H
3.224711
It is known that complex impedance spectroscopy is a powerful tool to separate the effect of grain and grain boundaries, it is used to study the electrical relaxation behavior in these materials (Singh Yadav et al., 2020.). For this purpose, the complex impedance using the Cole-Cole plot is studied. Fig. 13.a shows the fitted plots using a series circuit of two parallel combinations [(R1, C1), (R2, CPE1)] Fig. 13.c, thus indicating the contribution of the sample grains in the high-frequency region and the grain boundaries in the low-frequency part. From this fit, we were able to extract the resistance values R1 and R2 attributed to the grain resistance (RG) and grain boundaries resistance (RGB) respectively. these circuits are parallel and connected in series for the sample calcined at 1000 °C/4h (all the other samples exhibit the same behavior and are not represented here). Two semi-arcs are obtained in the tested samples; one is related to the grain contribution, and the other is related to the grain boundaries contribution. It is known that when the center of the semicircle is on the real axis, the relaxation follows the ideal Debye behavior.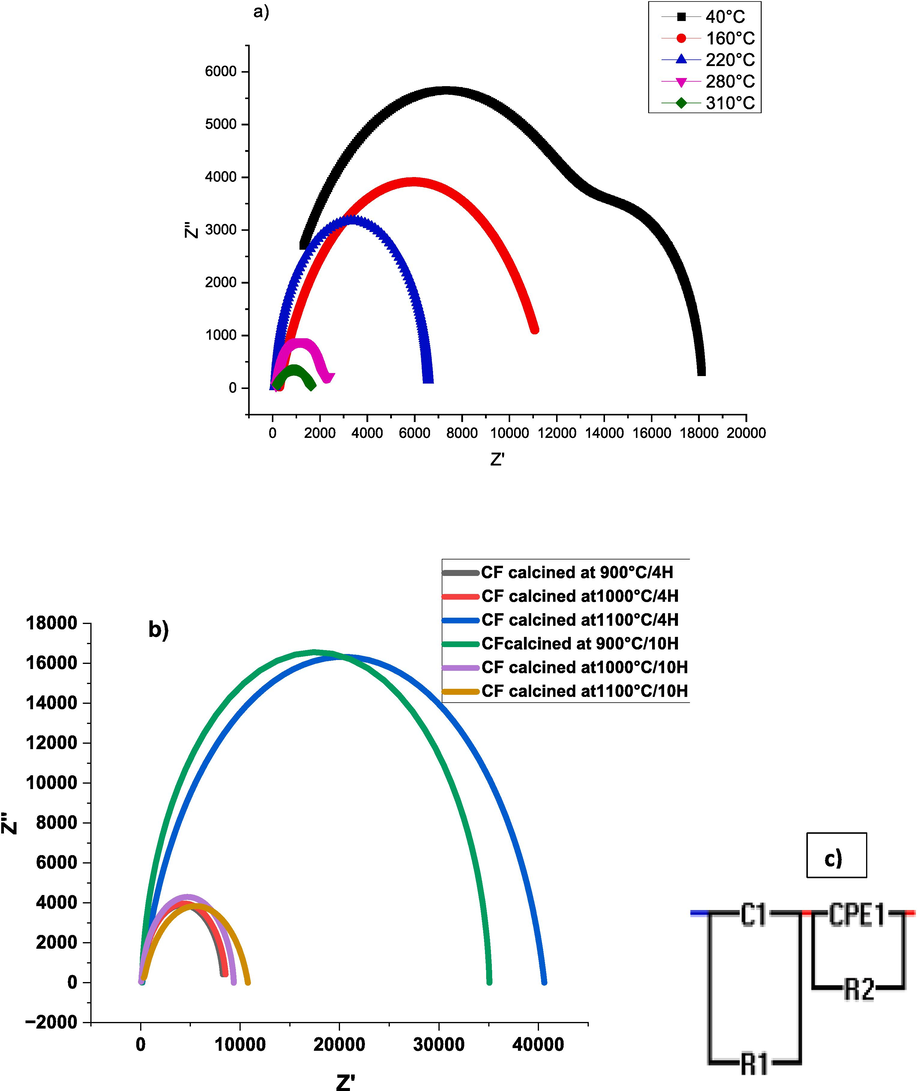
A. Nyquist plots of CaFeO3-δ ceramics calcined at 1000 °C/4h and sintered at 1100 °C/4H. b. Nyquist plots at 220 °C of CaFeO3-δ ceramics calcined at different temperatures and durations and sintered at 1100 °C/4H. c. equivalent circuits.
In the present study, the center of semicircles is below the z’ axis; confirming the poly-dispersive nature of the dielectric response in this material (Giannaccini et al., 2018). The radius of these semicircles decreases when the temperature increases which indicates a negative thermal resistivity coefficient (NTCR) behavior of the materials (Gouitaa et al., 2018). This variation in radii characterizes semiconductor materials indicating a non-ideal Debye relaxation behavior (Khelifi et al., 2015) which could be caused by many factors such as stress phenomena, deformation and distribution of atomic defects as well as the orientation of the grain and the grain boundaries. In addition, we notice that the semicircles partially overlap as the temperature increases. According to the IBLC model, these phenomena are typically related to the existence of a relaxation time distribution; the various components or elements within the system have different time scales for returning to equilibrium or responding to an external perturbation; in which the resulting complex impedance is composed of two overlapping half circles (Mallmann, 2015). Upon analyzing the curve of Nyquist plots of CaFeO3-δ ceramics calcined at different temperatures and durations at 220 °C in Fig. 13-b, it was observed that the CFO calcined at 1100 °C/10H and 900 °C/10H had the largest circle radii. This phenomenon is believed to be one of the reasons for the decrease in conductivity values (Hakeem, 2021). Likewise, CFO calcined at 1000 °C/10H, which has a lower conductivity value, was found to have a smaller radius and sample resistance (R) as compared to the others, as shown in Table 7, which groups the values of the adjusted parameters (RB, RGB, CB, and CGB) at T = 220 °C. Based on the same table, all samples had Rg values that were significantly lower than Rgb values. And this demonstrates the capacity for the creation of the internal barrier layer (IBLC). The IBLC model predicts that the behavior of Rg < Rgb can result in a significant amount of polarization at the grain boundaries and interface (Singh Yadav et al., 2020.).
RG (Ω)
RGB(Ω)
CG (F)
CGB(F)
CFO calcined at 900 °C/4H
135.66
8172.9
1.607 x 10⁻¹³
1.3063 x10⁻⁹
CFO calcined at 1000 °C/4H
135.22
8452.9
1 x10⁻¹⁰
1.3407 x10⁻⁹
CFO calcined at 1100 °C/4H
171.11
40,424
2.5833 x 10⁻¹³
5.9852 x10⁻⁸
CFO calcined at 900 °C/10H
119.31
34,956
8.1665 x 10⁻¹³
1.5441 x10⁻⁸
CFO calcined at 1000 °C/10H
66.268
9296.8
9.7492 x10⁻¹⁰
1.1615 x10⁻⁸
CFO calcined at1100°C/10H
300.93
10,483
9.5792 x10⁻¹¹
1.1676 x10⁻⁸
4 Conclusion
CaFeO3-δ perovskite has been successfully synthesized via the solid method at different calcination temperatures and durations. XRD, FT-IR, and Raman analysis confirmed the existence of a single orthorhombic phase with a space group of Pcmn for all samples calcined at 700 °C-800 °C-900 °C-1000 °C-1100 °C for 4 h and 10 h. The crystallographic data showed that the fitted cell parameters, lattice coordinate, and B position are nearly in a zigzag while varying the treatment time and temperature. the cell volume and the average crystallite size increased with high values of the calcination temperature and duration. The EDX illustrated the existence of Ca, Fe, and O atoms with high percentages and a low proportion of C, which confirms the CFO purty. SEM micrographs showed the evolution of grain size as a function of calcination parameters; grain size increases with higher values of temperature and duration. The dielectric study indicated that the dielectric constant decreases until it remains constant at higher frequencies. The colossal dielectric constant (ε’=105) was found for the CFO calcined at 1000 °C for 4 h and 10 h, and the lowest transition temperature was found for the CFO at 1000 °C/10 h. According to our findings, the AC conductivity varies with frequency and adheres to the Maxwell-Wagner two-layer model. The sample calcined at 1000 °C/10 h had the maximum AC conductivity, which may be related to grain growth. The Cole-Cole plots have indicated the presence of semi-circular arcs, which are principally caused by the significant contribution of grain boundaries, and that is what confirms the deviation from the ideal Debye behavior. All samples had RG values that were lower than RGB values, which demonstrates the capacity to create the internal barrier layer (IBLC). Furthermore, the imaginary part (ε“) exhibits relaxational behavior, can be attributed to the strong correlation between the ferrites conduction mechanism and the dielectric behavior. The CFO sample calcinated at 1000 °C/10 h has improved electrical and dielectric properties; such as good electrical conduction, high electrical permeability, and low transition temperature; that make it ideal to be used in batteries and electrical capacitors.
Declaration of competing interest
The authors declare that they have no known competing financial interests or personal relationships that could have appeared to influence the work reported in this paper.
References
- Study the oxygen vacancies and Fe oxidation states in CaFeO3-δ perovskite nanomaterial. Phys. B Condens. Matter. 2022;624
- [CrossRef] [Google Scholar]
- Comparative microstructural studies using different methods: Effect of Cd-addition on crystallography, microstructural properties, and crystal imperfections of annealed nano-structural thin CdxZn1-xSe films. Phys. B Condens. Matter. 2021;620(March):413267
- [CrossRef] [Google Scholar]
- The use of X-ray diffraction peak profile analysis to determine the structural parameters of cobalt ferrite nanoparticles using Debye-Scherrer, Williamson-Hall, Halder-Wagner and Size-strain plot: Different precipitating agent approach. J. Alloys Compd.. Feb. 2022;895:162694
- [CrossRef] [Google Scholar]
- Investigation on structure and stability of cerium doped (Ba0.5Sr0.5)(Fe1-xCex)O3-δ (x = 0–1.0) oxides by Rietveld refinement. Solid State Commun.. 2021;334–335:114343
- [CrossRef] [Google Scholar]
- ‘effect of calcination temperature on synthesized ZnO nanoparticles’. AIP Conf. Proc.. 2020;2244(June)
- [CrossRef] [Google Scholar]
- Synthesis, characterization and in vitro analysis of α-Fe2O3-GdFeO3 biphasic materials as therapeutic agent for magnetic hyperthermia applications. Mater. Sci. Eng. C. 2018;92(July):932-941.
- [CrossRef] [Google Scholar]
- Ghosh, B. and Mahato, D. K. 2018. “Formation of Magnetic Glass By Kinetic Arrest of First Order Magnetic Phase Transition In CaFeO 3,” 2018. [Online]. Available: www.sciencedirect.comwww.materialstoday.com/proceedings2214-7853.
- Giannaccini, M. E. et al., 2018. “Ac ce us pt,” Proc. - IEEE Int. Conf. Robot. Autom., vol. 36, no. 3, pp. 4620–4625, 2018.
- Impedance, modulus and conductivity studies of Fe3+ doped BaTiO3 ceramics prepared by solid state method. J. Mater. Sci. Mater. Electron.. 2018;29(8):6797-6804.
- [CrossRef] [Google Scholar]
- Colossal dielectric constant (CDC) response in 0.5CaTiO3–0.5FeTiO3 composites. J. Mater. Res. 2023
- [CrossRef] [Google Scholar]
- High Dielectric Permittivity and Low Transition Temperature of (1–x)CaTiO3 – xFeTiO3 Inorganic Composites (x = 0.0 to 1.0) Russ. J. Inorg. Chem. 2022
- [CrossRef] [Google Scholar]
- Structural, dielectric and electrical properties of modified BaTi0.80Fe0.20O3 ceramics by zr addition in ti site at x=0.00 to 0.10. Iran. J. Mater. Sci. Eng.. 2021;18(3)
- [CrossRef] [Google Scholar]
- Conductivity and giant permittivity study of Zn0.5Ni0.5Fe2O4 spinel ferrite as a function of frequency and temperature. RSC Adv.. 2019;9(56):32395-32402.
- [CrossRef] [Google Scholar]
- Magnetic, dielectric and structural properties of spinel ferrites synthesized by sol-gel method. J. Mater. Res. Technol.. 2021;11:158-169.
- [CrossRef] [Google Scholar]
- Magnetic and electrical investigations of low dimensional Co0.5Zn0.5−xCuxFe2O4 nano ferrites. J. Alloys Compd.. 2023;954:170031
- [CrossRef] [Google Scholar]
- X-ray studies: CO2 pulsed laser annealing effects on the crystallographic properties, microstructures and crystal defects of vacuum-deposited nanocrystalline ZnSe thin films. CrystEngComm. 2018;20(44):7120-7129.
- [CrossRef] [Google Scholar]
- Tuning the electronic properties of epitaxial strained CaFeO 3-δ thin films. Appl. Phys. Lett.. 2019;114(22):pp.
- [CrossRef] [Google Scholar]
- Tuning the electronic properties of epitaxial strained CaFeO 3-δ thin films. Appl. Phys. Lett.. 2019;114(22)
- [CrossRef] [Google Scholar]
- Impacts of annealing temperature on microstructure, optical and electromagnetic properties of zinc ferrites nanoparticles synthesized by polymer assisted sol-gel method. Arab. J. Chem.. 2023;16(10):105186
- [CrossRef] [Google Scholar]
- The effect of lanthanum substitution on the structural, magnetic, and dielectric properties of nanocrystalline Mn-Ni spinel ferrite for radio frequency (RF) applications. Phys. Lett. Sect. A Gen. at. Solid State Phys.. 2022;446:128285
- [CrossRef] [Google Scholar]
- Investigation on phase and Raman spectra of Ba3(CaTa2-yTiy)O9-δ (y = 0–0.50) system. J. Asian Ceram. Soc.. 2020;3:572-577.
- [CrossRef] [Google Scholar]
- High permittivity and low dielectric loss of the (Ca0.9Sr0.1)1-xLa2x/3Cu3Ti4O12 ceramics. Ceram. Int.. 2023;49(7):10213-10223.
- [CrossRef] [Google Scholar]
- Pseudocapacitive energy storage and electrocatalytic hydrogen-evolution activity of defect-ordered perovskites SrxCa3−xGaMn2O8 (x = 0 and 1) ACS Appl. Energy Mater.. 2020;3(11):10983-10992.
- [CrossRef] [Google Scholar]
- Ac conductivity and ferroelectric phase transition of Bi0.7(Ba0.8Sr0.2)0.3Fe0.7Ti0.3O3 ceramic. Ceram. Int.. 2015;41(10):12958-12966.
- [CrossRef] [Google Scholar]
- Dual ferroic properties of hexagonal ferrite ceramics BaFe12O19 and SrFe12O19. J. Magn. Magn. Mater.. 2016;400:327-332.
- [CrossRef] [Google Scholar]
- Bi1-xCaxFeO3-δ (0 ≤ x ≤ 1) ceramics: Crystal structure, phase and elemental composition, and chemical bonding from X-ray diffraction, Raman scattering, Mössbauer, and X-ray photoelectron spectra. J. Alloys Compd.. 2016;664:392-405.
- [CrossRef] [Google Scholar]
- The effect of the calcination temperature of LaFeO3 precursors on the properties and catalytic activity of perovskite in methane oxidation. Ceram. Int.. 2019;45(2):2779-2788.
- [CrossRef] [Google Scholar]
- Synthesis and Electrochemical Properties of LaFeO3 Oxides Prepared Via Sol-Gel Method. Arab. J. Sci. Eng.. 2014;39(1):147-152.
- [CrossRef] [Google Scholar]
- The structure and magnetic properties of magnesium-substituted LaFeO3 perovskite negative electrode material by citrate sol-gel. Int. J. Hydrogen Energy. 2018;43(28):12720-12729.
- [CrossRef] [Google Scholar]
- The influence of Ca substitution on LaFeO3 nanoparticles in terms of structural and magnetic properties. J. Appl. Biomater. Funct. Mater.. 2018;vol. 16(1_suppl):17-25.
- [CrossRef] [Google Scholar]
- Dielectric Properties of Ca0.7Bi0.3Ti0.7Cr0.3O3 (CBTC)–CaCu3Ti4O12 (CCTO) Composite. J. Electron. Mater.. 2015;44(1):295-302.
- [CrossRef] [Google Scholar]
- Enhanced Electrical and Magnetic Properties of Annealed Magnesium Ferrite Nanoparticles. J. Supercond. Nov. Magn.. 2015;28(12):3607-3615.
- [CrossRef] [Google Scholar]
- Fabrication and characterization of the magnetic ferrite nanofibers by electrospinning process. Thin Solid Films. 2018;660(May):358-364.
- [CrossRef] [Google Scholar]
- Synthesis, characterization and conductivity studies of ZnFe 2 O 4 nanoparticles. AIP Conf. Proc.. 2015;1665:4-7.
- [CrossRef] [Google Scholar]
- Evaluation of structural, magnetic, optical, electrical, and humidity sensing properties of manganese-substituted zinc ferrite nanoparticles. Appl. Phys. A Mater. Sci. Process.. 2021;127(11)
- [CrossRef] [Google Scholar]
- Investigation of structural, morphological and magnetic properties of nanostructured strontium hexaferrite through co-precipitation technique: Impacts of annealing temperature and Fe/Sr ratio. Heliyon. 2023;9(3):e14532.
- [Google Scholar]
- Synthesis and characterization of Gd-doped LaFeO3 for device application. Mater. Sci. Semicond. Process.. 2022;151
- [CrossRef] [Google Scholar]
- Structural, dielectric and humidity properties of Al-Ni-Zn ferrite prepared by co-precipitation method. J. Alloys Compd.. 2018;753:483-490.
- [CrossRef] [Google Scholar]
- Structural and electrical studies of Gd3+ substituted zinc ferrite nano particles. Ferroelectrics. 2016;504(1):53-63.
- [CrossRef] [Google Scholar]
- Impact of sonochemical synthesis condition on the structural and physical properties of MnFe2O4 spinel ferrite nanoparticles. Ultrason. Sonochem.. 2020;61(October 2019)
- [CrossRef] [Google Scholar]
- Slaoui, M., Najwa, G., El Issmaeli, Y. and Abdi, F. 2021. “Effect of Zinc Doping on the Electrical and Dielectric Properties of CCTO Compound Synthesized by Solid-State Method,” no. September, 2021. doi: 10.14233/ajchem.2021.23264.
- Synthesis and physico-chemical characterization of solid solution (1-x)CCTO-xPbTiO3. Asian J. Chem.. 2021;33(6):1208-1214.
- [CrossRef] [Google Scholar]
- Investigation of structural, morphological, optical, and magnetic properties of Sm-doped LaFeO3 nanopowders prepared by sol–gel method. J. Sol-Gel Sci. Technol.. 2017;81(2):483-492.
- [CrossRef] [Google Scholar]
- Polarization origin and iron positions in indium doped barium hexaferrites. Ceram. Int.. 2018;44(1):290-300.
- [CrossRef] [Google Scholar]
- A study on the conductivity, dielectric, and microwave properties of SrNbxYxFe12-2xO19 (0.00 ≤ x ≤ 0.05) nanohexaferrites. J. Mater. Res. Technol.. 2022;17:2975-2986.
- [CrossRef] [Google Scholar]
- A high-entropy perovskite cathode for solid oxide fuel cells. J. Alloys Compd.. 2021;872:159633
- [CrossRef] [Google Scholar]
- Yang, Y. et al., 2016. “Hydrothermal Synthesis of Co3O4/ZnO Hybrid Nanoparticles for Triethylamine Detection,” mdpi.comY Yang, X Wang, G Yi, H Li, C Shi, G Sun, Z ZhangNanomaterials, 2019•mdpi.com, Accessed: Oct. 16, 2023. [Online]. Available: https://www.mdpi.com/2079-4991/9/11/1599.
- Crystal structure and octahedral deformation of orthorhombic perovskite ABO3: Case study of SrRuO3. J. Solid State Chem.. 2022;309(February)
- [CrossRef] [Google Scholar]
- Zafar, N. and Khan, M. N. 2015. “The Nucleus Structural, Electric and Thermoelectric Studies of CaFeO 3 System,” 2015. [Online]. Available: www.thenucleuspak.org.pk.
- Phase transformations in FeCo – Fe2CoO4/Co3O4-spinel nanostructures as a result of thermal annealing and their practical application. J. Mater. Sci. Mater. Electron.. 2021;32(12):16694-16705.
- [CrossRef] [Google Scholar]
- Dielectric properties of Al2O3 modified CaCu3Ti4O12 ceramics. J. Mater. Sci. Mater. Electron.. 2019;30(15):13869-13876.
- [CrossRef] [Google Scholar]
- Cu-doped CaFeO3 perovskite oxide as oxygen reduction catalyst in air cathode microbial fuel cells. Environ. Res.. 2022;214
- [CrossRef] [Google Scholar]


