

Translate this page into:
Poly ether block Amide/Polyvinyl Alcohol/ MgO nanocomposite membranes: Selectivity for CO2 and CH4 gases
⁎Corresponding authors at: Polymer Department, Shahreza Branch, Islamic Azad University, P.O. Box 86145-311, Shahreza, Iran. ebadi@iaush.ac.ir (Hassan Ebadi-Dehaghani), kolahdoozan@iaush.ac.ir (Majid Kolahdozan)
-
Received: ,
Accepted: ,
This article was originally published by Elsevier and was migrated to Scientific Scholar after the change of Publisher.
Abstract
One of the methods of improving mixed matrix membranes is the use of nanoparticles and compounds containing hydroxyl and carboxyl groups, which can be a suitable choice to help more permeability of gases. In this study, a mixed matrix membrane comprising polyether block amide/polyvinyl alcohol (Pebax/PVA) and magnesium oxide (MgO) nanoparticles was fabricated via solution casting. The Pebax/PVA membrane with MgO loadings of 10–15 % at varying PVA weight ratios (0, 20, 50, 80 %) was evaluated for CH4 and CO2 gas separation performance. Characterization via Fourier transform infrared (FTIR), X-ray diffraction (XRD) and field emission scanning electron microscopy (FESEM) revealed the nanoparticles well-dispersed within the polymer matrix, with surface roughness increasing with MgO addition. XRD analysis indicated stronger interaction between MgO and PVA chains versus Pebax. Peaks at ∼ 42, 62° suggest nanoparticles lodged between polymer strands. Variables assessed as independents impacting CH4 and CO2 permeability included PVA content, MgO loading, pressure and temperature. ANOVA showed the quadratic model best fitted correlations between variables and responses. Experimental data yielded the formulation with optimum selectivity. Molecular dynamics simulation (MDS) via Materials Studio estimated CH4 and CO2 diffusion through selected membranes. Simulated results matched experimental data well. Relative to prior separation data and outcomes herein, the synthesized nanocomposite membrane proved highly effective, promising potential for diverse gas mixtures. Membrane permeabilities were also evaluated.
Keywords
Polyether block amide
Polyvinyl alcohol
MgO nanoparticles
Molecular dynamics simulations, Permeability

1 Introduction
Rising global temperatures due to population growth, economic development and increasing energy consumption have made selective CO2 removal a pressing global challenge(Dong et al., 2022; Norby and Luo, 2004). Substantial research shows that CO2 emissions from these driving factors are the primary cause of irreversible climate change, with fossil fuels being the most consumed energy source worldwide despite their emissions. In recent decades, polymer membranes have gained prominence for gas separations like H2/CO2, CO2/N2, and CO2/CH4 due to advantages such as availability, mechanical robustness, and low energy operation(Coronas, 2022; Samuel J. Edens, Michael J. McGrath, Siyu Guo, Zijuan Du, Hemin Zhou, Lingshan Zhong, Zuhao Shi, Jieshuo Wan, Thomas D. Bennett, Ang Qiao, Haizheng Tao, n.d.; Sun et al., 2023). Membrane separation and CO2 absorption have attracted scientific interest for reducing carbon dioxide emissions and excessive fossil fuel usage amid growing energy demands. Compared to traditional processes like absorption, extraction and cryogenic distillation, which consume vast energy and incur high costs, membrane separation offers a simpler, scalable design with lower operating expenses(Aydin et al., 2023; Dai et al., 2023). The application of nanotechnology in membrane science for gas separation has created a novel class of nanoengineered materials. Polymer matrix properties within these membranes are modified to enhance separation and filtration performance. While cross-linking, polymer blending, surface alteration, thermal treatment and ligand immobilization have traditionally been employed, mixed matrix membranes incorporating nanofillers into the polymer structure show promising potential as a cost-effective solution(Chakrabarty et al., 2022; Luo et al., 2022). Nanocomposite membranes have received significant attention due to improved selectivity and permeability in gas separation applications relative to selectivity(Clarizia and Bernardo, 2022; Surya Murali et al., 2010; Wang et al., 2023). In CO2/CH4 separation, selectivity refers to preferential permeation of one gas (e.g., CO2) while effectively blocking the other (e.g., CH4). Factors like molecular sieving, surface interactions, diffusion kinetics, polymer matrix composition, and operating conditions influence nanocomposite membrane selectivity for these gases(Garcia-Martinez et al., 2023; Martinez et al., 2022). One of the principal challenges in membrane technology is balancing selectivity against permeability, commonly known as the Robeson upper bounds. Robeson's limits delineate the theoretical performance limitations of polymeric membranes with respect to selectivity and permeability for various gas pairs. Generally, improving selectivity tends to decrease permeability and vice versa due to factors such as chain packing density, free volume availability, adsorption strength and solubility selectivity, and polymer chain rigidity(Ahmad et al., 2023; Ghanbari et al., 2023). One of the highly promising approaches is the use of mixed matrix membranes (MMMs). Here, an organic polymer matrix, offering flexibility and ease of processing, is combined with inorganic or organic fillers like zeolites, metal–organic frameworks (MOFs), or nanoparticles which impart enhanced selectivity and permeability. The selected filler material, loading concentration within the matrix, and interfacial interactions between polymer and filler can influence the balancing of selectivity versus permeability in MMMs(Cheng et al., 2023; Ebadi et al., 2021; Kalantari et al., 2020). The use of Magnesium oxide (MgO) nanoparticles in a polymer matrix to create mixed matrix membranes (MMMs) is a common approach to increase gas separation performance(Zainuddin et al., 2023). MgO nanoparticles offer several advantages, including high surface area, thermal stability, and chemical compatibility with various polymer matrices.
So far, polymers such as polysulfone (PSF), polyether sulfone (PES), intrinsically microporous polymers (PIMs) and poly ether-block amide (Pebax) have been studied as polymer matrices for MMM membranes(Al-Rowaili et al., 2023; Ding et al., 2023). Meanwhile, Pebax copolymer has been investigated due to its unique combination of permeability and selectivity, and tunable size for various gas separation applications, including CO2 absorption, natural gas purification, biogas upgrading, and hydrogen recovery(Isanejad and Mohammadi, 2018; Miri et al., 2020). This copolymer is a family of thermoplastic elastomers that includes a block of soft parts (rubber like polyether) and hard parts (glass like polyamide) that cause gas permeability without losing selectivity and mechanical stability(Zhang et al., 2022).
Fabrication technique is a suitable alternative for improving the properties of mixed matrix membranes due to its simplicity, reproducibility, commercial feature and cost-effectiveness. On the other hand, polymers with hydroxyl and carboxyl groups such as glycerol (Gl), poly (ethylene glycol) (PEG) and poly (vinyl alcohol) alcohol (PVA) are suitable candidates for combination with Pebax membranes(Nobakht and Abedini, 2022; Vatanpour et al., 2023). Studies have shown that adding Pebax to PVA matrix, in addition to forming a composite membrane with gas separation properties, can also reduce the brittleness of pure polymers by forming a defect-free polymer layer with a thin thickness(Ebadi et al., 2021; Kheirtalab et al., 2020). Due to the interaction between the negative charge of oxygen (atoms of carbonyl and hydroxyl groups) with the central carbon with the positive charge of CO2 through the interaction based on Lewis’s acid, it can help to penetrate more CO2.
Reza et al. in 2023 reported the high-performance separation of CO2 gas using a mixed membrane of Pebax/maltitol/ZIF-8 with high efficiency. Gas permeability analysis at 30 °C and 10 bar showed that the Pebax/maltitol/ZIF-8 membrane exhibited the highest CO2 permeability at 429.57 Barrer. Additionally, the highest selectivity values for CO2/N2 and CO2/CH4 separation were reported as 69.31 and 26.59, respectively, at 30 °C and 10 bar(Bakhtin et al., 2023). Sanaipour et al. investigated the effect of combining cellulose acetate with Pebax to enhance the properties of CO2 separation using the casting method and evaluated its performance in gas separation. The permeability results have shown that the permeability and selectivity of CO2 in the cellulose acetate/Pebax composite membrane increased by 25 % and 59 %, respectively, compared to pure cellulose acetate(Sanaeepur et al., 2019). In 2018, Azizi et al. reported the performance of CO2/CH4 separation using a Pebax/PEG-200 mixed membrane. The results showed that the Pebax/PEG-200 mixed membrane with a 40 % weight loading exhibited CO2 permeability and CO2/CH4 selectivity values of 351.65 and 9.17, respectively, compared to pure Pebax(Azizi et al., 2017). In a 2019 study, researchers investigated the use of Pebax nanocomposite membranes with varying weight percentages of aluminum oxide (Al2O3) for the separation of CH4 and CO2 gases and the determination of their permeation rates. The results demonstrated that Pebax/Al2O3 nanocomposite membranes exhibited CO2 permeability and CO2/CH4 selectivity values of 159.27 and 24.73, respectively, at a pressure of 3 bar. Examination of FESEM images revealed the uniform distribution of Al2O3 nanoparticles within the polymer matrix, indicating defect-free membrane structures(Farashi et al., 2019).
In this study, MgO nanoparticles were incorporated into a mixed matrix membrane aimed at CO2 separation. The base polymeric matrix comprised Pebax blended with PVA bearing hydroxyl functionalities at 0, 20, 50 and 80 wt%, fabricated by solution casting. MgO nanoparticles, leveraged as 10 and 15 wt% loads, sought to boost selectivity and permeability. Membrane identification via FTIR, XRD and FESEM characterization was explored. Variables analyzed as independents influencing CH4 and CO2 gas permeability encompassed PVA content, MgO loading level, pressure and temperature. Structural insights and the effect of polymer blending on separation performance were garnered from the synthesized alloys. Moreover, molecular dynamics simulations assessed selectivity and diffusion coefficients to illuminate gas transport.
2 Materials and methods
2.1 Materials
The polymeric constituents utilized were polyether block amide branded Pebax-2533(PEBA, Pebax 2533) and polyvinyl alcohol (PVA), purchased from Arkema (France) and Merck (Germany) respectively. Magnesium oxide (MgO) nanoparticles (particle size < 50 nm) and 95 % purity were obtained from USNANO to formulate the nanocomposite membrane and acetic acid (glacial, Reagent Plus ®, ≥99 %) were purchased from Sigma Aldrich. As solvent, dimethylacetamide was selected - a colorless polar liquid. Chemical properties of the materials are delineated in Table 1.
Pebax
PVA
MgO
Molecular weight (g/mol)
–
86/09
40/3044
Melting point (°C)
174–134
230
–
Density (g/cm3)
01/303
01/19
03/58
2.2 Methods
2.2.1 Design of experiment (DOE)
In this study, response surface methodology employing a D-optimal design was utilized given all variables were independent with constraints. The Design Expert software (Version 7.0.0, Stat-Ease Inc., Minneapolis, MN) facilitated a central composite design(Kazemi et al., 2020). The proportions of PVA and MgO nanoparticles as well as gas pressure and temperature were designated as the independent variables, with CH4 and CO2 membrane permeabilities selected as responses. The independents were defined at 4 levels, as delineated in Table 2. Sixteen runs were generated, shown in Appendix Table A. Subsequently, the top three formulas exhibiting the highest attractiveness indices per the model were chosen for further testing and characterization.
Independent variables
Unit
Levels
Level 1
Level 2
Level 3
Level 4
A: PVA
%
0
20
50
80
B: MgO
%
0
5
10
15
C: Pressure
bar
2
4
6
8
D: Temperature
°C
25
35
45
55
2.2.2 Membrane preparation
The polyether block amide/polyvinyl alcohol (Pebax/PVA) membrane was fabricated via the following process: First, a 3 wt% solution was prepared by dissolving 0.3 g of Pebax polymer and PVA at varying weight ratios in 10 cc of dimethylacetamide solvent. The mixture was sonicated at 120 °C to ensure complete dispersion of the polymers. The homogeneous solution was then stirred magnetically at an elevated heat of 12 h to promote uniformity. Next, the obtained solution was cast into a Teflon petri dish and placed in an oven at 75 °C for 12 h to form the desired film. Post-formation, the film underwent thermal treatment in a vacuum oven for 4 h. This final step aimed to remove residual solvent and optimize the membrane's physicochemical properties. The resulting composite membrane was termed Pebax/PVA.
To fabricate the polyether block amide/polyvinyl alcohol/magnesium oxide nanoparticle composite membrane (Pebax/PVA/MgO), 10 and 15 wt% MgO nanoparticles were ultrasonicated in dimethylacetamide solvent at 45 °C for 2 h to ensure uniform dispersion. Subsequently, 0.2 g of the Pebax/PVA polymer mixture was added to the nanoparticle solution and further sonicated at 120 °C. Next, to achieve homogeneous blending, the solution was magnetically stirred at elevated heat for a designated duration. The prepared solution was then cast into a Teflon petri dish and placed in an oven at 75 °C for 12 h to form the membrane film. Post-formation, the film underwent thermal treatment in a vacuum oven for 4 h to extract residual solvent and optimize the membrane's properties. The resulting composite membrane was termed Pebax/PVA/MgO.
2.3 Membrane characterization
2.3.1 FESEM analysis
The nanocomposite membranes were firstly immersed in liquid nitrogen for 30 s to enable clean splitting into two portions. Both exposed interior surfaces were stub-coated using a double-sided conductive silver adhesive prior to gold sputter-coating via a sputter coater (SCDOOS, Baltic, Switzerland). Cross-sectional micrographs at magnifying ratios were then obtained using a Vega II scanning electron microscope (Tescan, Czech Republic) operated at 20 kV. Secondary electron detection facilitated examination of membrane microstructures(Keshavarz et al., 2020).
2.3.2 XRD analysis
X-ray diffraction (XRD) was used to investigate the XRD patterns of the samples. The analysis was performed using an ICDD Grant Germany instrument, with CuKα radiation (λ = 1.5418 Å). The scanning range was set from 20 to 60° in steps of 0.05°, while the instrument operated at 40 kV with a current of 30 mA.
2.3.3 Gas separation
The permeability characteristics of PEBA/PVA/MgO membranes to pure gases (CO2 or CH4) were analyzed using a constant pressure mode at various temperatures (25, 35, 45, and 55 °C)(Med, n.d.). The feed side pressures of the gases ranged from 2 to 8 bar, while the permeate side was maintained at 1 atm. The CO2/CH4 mixture gas separation efficiency of the optimal samples was evaluated at 6 or 7 bars and 27.5 or 25 °C (Table 4). The evaluation was conducted using a mixed gas input containing 10 mol% CO2. The separation measurements were carried out using similar mixed gas systems as reported by Khraisheh et al(Khraisheh et al., 2020), with a few minor differences in operational circumstances. In the experiment, a gas mixture of 10 mol% CO2 in CH4 was used to pressurize the feed side of the membrane up to 7 bars, while the permeate side was maintained at atmospheric pressure. The permeate was analyzed using a Varian micro-GC (490-GC Micro-GC) equipped with a PPQ column, heated auto-injector, and backflush option for volatile compounds such as CO2 and CH4. The delay time method was used to investigation the permeability of CO2 and CH4 gases. This method is the most common test for gas permeability in polymer membranes. In this method, the penetration of gas in the polymer is measured and investigated from zero time until the polymer permeability reaches a constant number. The constant pressure method was used to check the amount of gas seeped through the membrane and to record the flow rate of the passing gas.
A
B
C
D
Selectivity index (Theoretical)
Selectivity (α) (Practical)
#1
5
6
7
27.5
20.84
26.30
#2
5
12
6
25
12.78
15.58
The delay time was calculated through equation (1)(Wang et al., 2023):
2.3.4 Molecular dynamics simulation
Molecular dynamics is a method to observe atomic and molecular motions on the microscopic scale. According to Newton's formula, MD allows the examination of microscopic movements of systems containing N atoms(Bahreini et al., 2024, 2023):
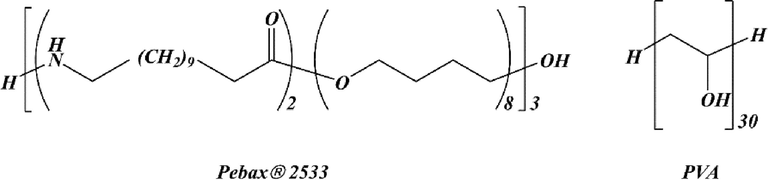
Pebax® 2533 and PVA structures.
The polymer model for Pebax® 2533 and PVA contains 5370 and 2120 atoms, respectively, and the sides of the cubic unit cells measure approximately 29–31 Å. Using the Materials Studio suite of software's Amorphous Cell module, several configurations of polymer chains (depicted in Figure B of the Appendix) were produced and arranged in a cubic space based on Theodorou and Suter's “self-avoiding” random-walk method and the Meirovitch scanning technique, employing periodic boundary conditions (PBC) to model the cubic structure(Meirovitch, 1983). At 1 bar and 298 K, the aim was to generate refined systems approximating the experimental density of the amorphous polymers. In all simulations, Berendsen's method [40] controlled temperature and pressure using a half-life of 0.1 ps (decay constant) and a pressure scaling constant of 0.1 ps, with a system compressibility of 0.5 GPa-1.
Four CO2 and CH4 solute molecules were placed at the center of the simulation space comprising 10 chains of 20 monomers each of the PEBA and PVA blend, to model gas diffusion. A group-based cutoff was employed in this investigation. The COMPASS forcefield described all interactions, using a cutoff value of 12.5 Å. A 3 Å width spline function interpolates the nonbonding interactions from their full value to zero within this range due to computational constraints. Both the cutoff and splining were also modified for long-range effects. For Geometry Optimization the Maximum Iterations was set to 1000.
3 Result and discussion
The 16 formulations were organized according to the design of the experiments. CO2 and CH4 permeation of the resulting specimens was then evaluated. Following this, multiple models were employed to fit the data for the two responses (permeation rates). Analysis of variance (ANOVA) was used to assess the adequacy of the models and establish a valid and trustworthy relationship between the dependent and independent variables. As the manufactured membranes had a similar thickness range of 40–80 μm, the impact of membrane thickness on the responses was able to be excluded. Table A in the Appendix illustrates the findings for all membrane responses.
3.1 Fourier-transform infrared spectroscopy (FT-IR)
FT-IR was employed to characterization and identify the functional groups in the membranes of composite and nanocomposite structures. The results of this investigation for the specimen membrane are presented in Fig. 2, respectively. In Fig. 2, the observed peaks for the Pebax in the range of 3300 and 2860 cm−1 correspond to the stretching vibrations of N–H and aliphatic C–H groups, respectively. Additionally, absorption peaks appearing in the regions of 1720, 1630, and 1100 cm−1 correspond to the C = O, H-N-C = O, and C-O bonds, respectively. The curves in Fig. 2 reveal peaks for PVA in the range of 3300–3500 cm−1, indicative of the stretching vibrations of O–H bonds resulting from intermolecular and intramolecular hydrogen bonding. Moreover, observed absorption peaks in the regions of 1742 and 1140 cm−1 are associated with the C = O and C-O bonds arising from the remaining acetate groups in the structure. The absorption peak at 1627 cm−1 indicates carbonyl groups, while the peak at 1147 cm−1 signifies the presence of crystalline regions in the PVA chain structure formed due to symmetric stretching of C–C or C-O bonds resulting from intramolecular hydrogen bonding. As seen in Fig. 2, in the FTIR spectrum of the Pebax/PVA membrane, the positions of the peaks have slightly changed due to the interaction between the Pebax and PVA. This can be attributed to the suitable interaction between the carbon and nitrogen atoms of the Pebax and the hydrogen atoms of PVA. The positional shift of H-N-C = O in the Pebax from 1600 to 1630 cm−1 in the Pebax/PVA composite membrane is observed. Furthermore, the stretching vibration of O–H in the polyether block amide has shifted from 3300 to 1325 cm−1 in the mixed Pebax/PVA membrane(Klepić et al., 2020; Martínez-Izquierdo et al., 2019; Mina Kheirtalab, Reza Abedini, 2022; Wong et al., 2021).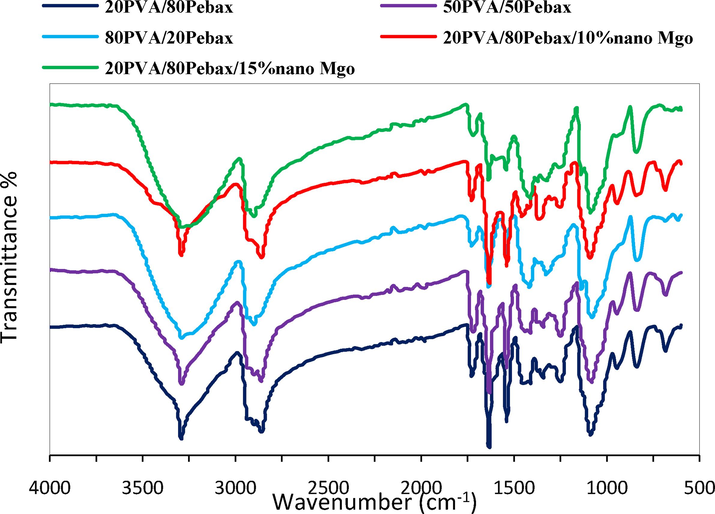
FTIR spectra of membranes.
3.2 X-ray diffraction
The interaction between nanoparticles and polymer chains may cause the nanoparticles to change crystalline form. The change in crystal size and form can be detected by an X-ray diffraction test. The structures of Pebax 1657 polymer, Pebax/PVA composite membrane, and Pebax/PVA/MgO nanocomposite membrane were investigated using X-ray diffraction (XRD). Fig. 3 illustrates the X-ray diffraction patterns of the fabricated membranes. All polymers exhibit prominent peaks in the range of around 24°, indicative of small, distributed crystals within the polymeric membrane composition. With the addition of 10 % by weight of MgO nanoparticles to the polymeric blend of Pebax/PVA, a reduction in peak intensity in the 24° regions is observed. The decreasing trend in the composite and nanocomposite membranes suggests a reduction in the crystallinity of the membranes(Kheirtalab and Reza Abedini, 2022; Kheirtalab and Reza Abedini, 2020). Moreover, the addition of MgO nanoparticles to the polymer blend has led to the emergence of peaks in the 42° and 62° regions. This phenomenon could be attributed to the placement of MgO nanoparticles between the polymer chains, preventing them from closely packing and linking polymer particles together. On the other hand, the addition of MgO nanoparticles has resulted in broader peaks, indicating a decrease in crystalline properties and facilitating the flexibility of the nanocomposite membrane. In fact, MgO, by reducing the crystalline portion of the membranes and enhancing the polymer chain flexibility, contributes to the improvement of the gas transport properties of CO2. Interaction between nanoparticles and polymer chains may cause changes in the crystalline shape and size of the nanoparticles, which can be detected through X-ray diffraction experiments.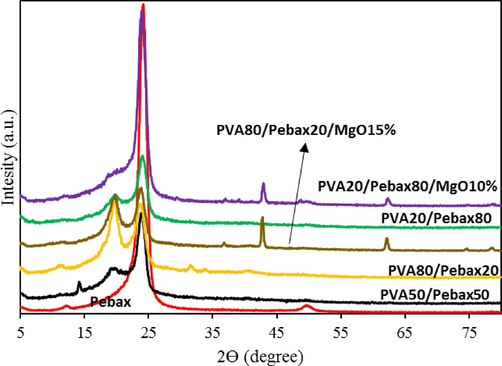
XRD graph of optimal formulations.
3.3 Study of morphology
The morphological investigation of composite membranes with different ratios, including Pebax100/PVA0%, Pebax80/PVA20%, Pebax50/PVA50%, and Pebax20/PVA80%, was conducted using field-emission scanning electron microscopy (FE-SEM). FE-SEM images of the fabricated membranes are presented in Fig. 4. a-c. As observed in Fig. 4. a, Pebax membranes exhibit a texture structure with irregular distribution, and spherical-shaped pores are also visible(Nobakht and Abedini, 2022). In the images of Pebax80/PVA20% composite membrane (Fig. 4. b), a heterogeneous structure with irregular distribution is evident. This heterogeneity can be attributed to the immiscibility of Pebax and PVA membranes with each other. Furthermore, in Fig. 4.c & d, as the PVA content increases, the cross-sectional surface of the samples becomes smoother due to improved compatibility between the two polymers. With an increase in PVA content, Pebax chains are adequately dispersed, forming a homogeneous phase. The more uniform phases lead to increased gas permeability and enhanced selectivity due to reduced entanglement. The smooth surface and improved compatibility between the polymers contribute to the dispersion of Pebax chains, forming a more uniform phase(Chen et al., 2023). This uniformity results in enhanced gas permeability and increased selectivity due to reduced entanglement.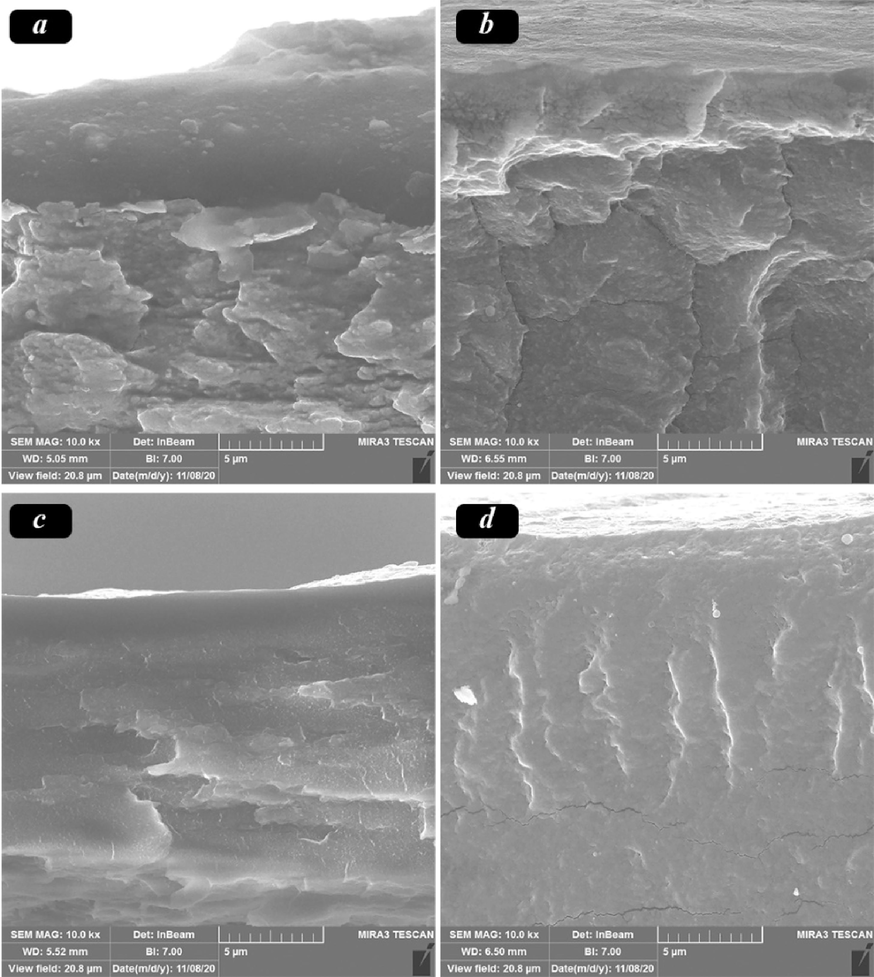
FE-SEM micrographs of samples containing a) 0, b) 20, c) 50 and d) 80 % of PVA.
In the images of Pebax20/PVA80/MgO15% and Pebax80/PVA20/MgO10% nanocomposites in the Fig. 5, it is evident that the addition of MgO nanoparticles during the membrane preparation stages enhances the texture and structure of the membrane compared to the Pebax/PVA composites. The surface roughness increases, and the nanoparticles are well-dispersed in the polymer matrix. The resulting membrane exhibits a uniform distribution with a coherent structure and regular holes, contributing to the overall improvement in membrane performance. The images also reveal that the nanoparticle size for Pebax20/PVA80/MgO15% is 302 nm, and for Pebax80/PVA20/MgO10% is 285 nm. This increase suggests swelling, exfoliation, and dispersion of nanoparticles within the polymer chains. Additionally, the strong interaction between nanoparticles and the polymer substrate, coupled with the reduction of the crystalline phase, is observed as the driving force behind the increased permeability and gas separation efficiency.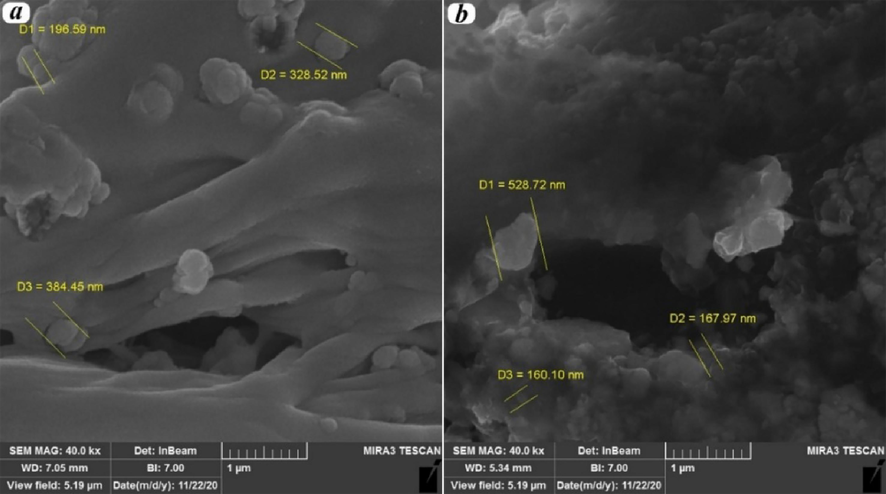
Nanoparticles’ dispersion in polymer matrix for a) Pebax20/PVA80/MgO15%, and b) Pebax80/PVA20/MgO10%.
3.4 Analysis of gas
According to previous studies, CO2 permeability increases with increasing pressure in polymer membranes. While for light gases such as CH4, this trend is decreasing or unchanged. According to the results of the investigations, the permeability of CO2 gas is higher than that of CH4. The greater permeability of CO2 compared to CH4 in Pebax/PVA membrane can be attributed to the interaction of CO2 and the softening effect of CH4 on the polymer. In addition, another reason for the higher permeability of CO2 compared to CH4 is the high critical temperature of CO2 compared to CH4 gas. In terms of molecular size, carbon dioxide is smaller than the studied methane gas and has a higher condensability. The results of CO2 and CH4 gas permeation at pressures of 2, 4, 6 and 8 bar and temperatures of 25, 35, 45 and 55 °C by Pebax/PVA mixed membrane with different weight ratios of PVA are shown in Figs. 6 and 7. As can be seen in Figs. 5 and 6, gas permeation values through the membrane increase with increasing pressure due to increasing driving force caused by mass transfer and solubility of gases. By increasing the pressure from 2 to 8 bar, the permeability of CO2 and CH4 gas has increased. In the rubber membrane, the permeability of light and non-polar gases such as methane is independent of pressure and remains constant with increasing pressure, but the permeability of condensable gases increases with increasing pressure. This increase can be related to the greater affinity of CO2 with the polar ether groups of Pebax, which increases the CO2 absorption in the membrane with the increase in pressure, followed by an increase in solubility. The investigation of changes in permeability with temperature for the Pebax/PVA nanocomposite membrane is shown in Fig. 6-b and Fig. 7-b. As can be seen, the permeability increases as the temperature increases to 55 degrees Celsius. The temperature dependence of permeation for CO2 and CH4 gases in the membrane is probably due to the double effect of permeation and solubility(Feng et al., 2023).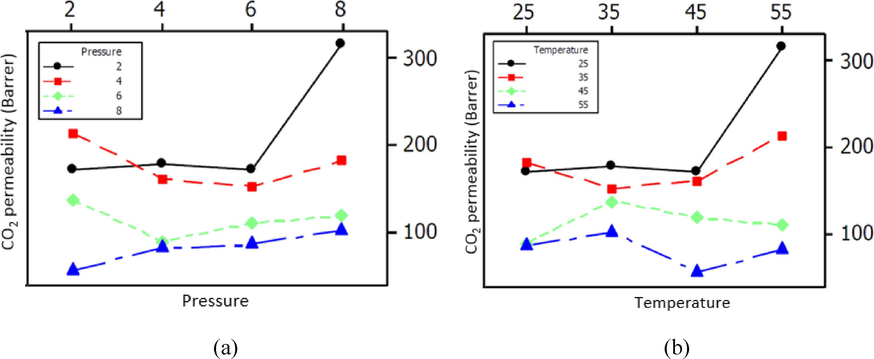
A) the effect of pressure on the permeability of co2 gas and b) The effect of temperature on the permeability of CO2 gas of samples containing 0, 20, 50, and 80 % of PVA.
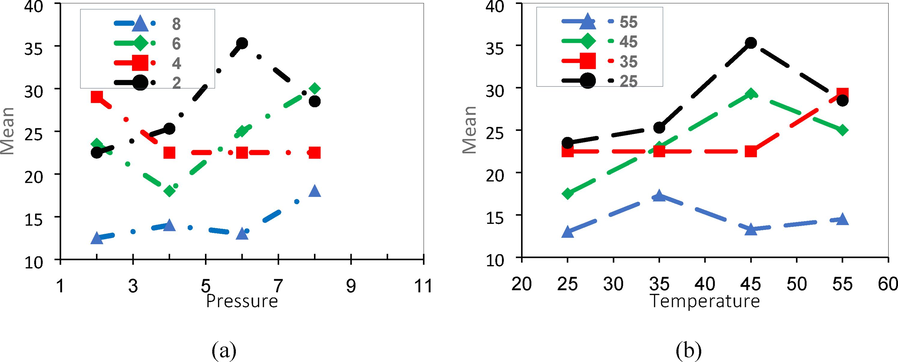
A) the effect of pressure on the permeability of ch4 gas and b) The effect of temperature on the permeability of CH4 gas of samples containing 0, 20, 50, and 80 % of PVA.
The measured CO2 permeability of the membranes was between, 53.569 to 315.440. The most suitable model to fit the relationships between the individual variables and Carbon dioxide permeability is a derived quadratic, according to the analysis of variance (ANOVA) (Table C in Appendix). The model's F-value (19.26) suggests that it is significant. Figure C in the Appendix compares the experimental results to predicted CO2 permeability values. The normalized graphs of the findings are provided in graph a in Figure C in the Appendix for faster and more effective comparisons. Based on the actual value of the findings, graph b in Figure C in the Appendix presents the model's anticipated value of the test results. The residual value in terms of formulations is shown in graph c in Figure C in the Appendix (16 formulations in this study). The residual value (the deviation for both the actual values and the values obtained from the model) is represented in terms of the predicted value in graph d in Figure C in Appendix. The Percentage error for Carbon dioxide permeability among all experimental tests varied between −5.33 percent and +5.33 percent, as seen on the graph's y-axis. As a result, the model is best suited because the discrepancy across the experimental and anticipated values is quite small. The formulation should be skipped if one of the effects falls beyond this range.
Fig. 8 depicts the results of the CO2 permeability test. As illustrated in Fig. 8, the effect of PVA percentage on CO2 permeation is slightly complex and differs from high pressure and temperature at low pressures and temperatures. Two factors control the penetration of gas into the membrane. One is the polar interactions between CO2 and PVA molecules that cause more gas molecules to dissolve inside the membrane, thereby increasing the gas permeation. On the other hand, with increasing the percentage of PVA, the possible crystal points inside the membrane increase, which as a barrier prevents the penetration of gas from the membrane. The outcome of these two factors determines the gas permeation through the membrane according to the conditions. MgO nanoparticles also have a great effect on decreasing the CO2 permeability (graph a in Fig. 8), MgO nanoparticles are on the nanometric scale, interact with polymer chains greatly and act as a barrier18. Fig. 8 illustrates that the CO2 permeability increases as the gas pressure increases. This event indicates that tiny molecules of gases were capable of entering and transferring via the polymer chain, increasing CO2 permeability. By increasing the gas temperature, molecular movements increase and cause more gas to transfer through the membrane. In addition, the warmer gas raises the membrane temperature and increases the free volume of the polymer chains. Gas molecules pass more easily through polymer chains with higher free volume.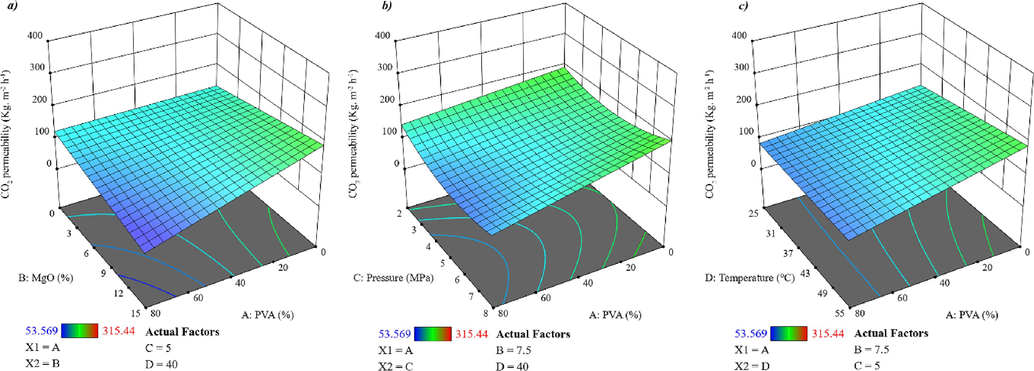
A response surface plot depicting the influence of A to D variables on CO2 permeability.
As the study shows that the independent variables influence CO2 permeability. Eq. (10) displays the mathematical correlation for both CO2 permeability and the A to D variables acquired from the regression study.
The results of examining the selectivity of CO2 and CH4 gas at pressures of 2, 4, 6, and 8 bar and temperatures of 25, 35, 45, and 55 °C by Pebax/PVA mixed membrane with different weight ratios of PVA are presented in Fig. 9. As can be seen, permeability and selectivity increase at higher pressures due to the strengthening of the driving force and softening effect. Examining the values obtained from the Pebax/PVA nanocomposite membrane in the selectivity study showed that, as a result of the compatibility of the polymer surface, the polymer chains can create gaps or narrow seams due to the strong interaction around PVA, which increases the selectivity. Another reason for the simultaneous increase in permeability and selectivity is the absence of non-selective holes in the membrane structure. An important point to note is that due to the selectivity of glass polymers, the presence of polyvinyl alcohol polymer in the Pebax membrane increases the selectivity(Mina Kheirtalab, Reza Abedini, 2022, 2020).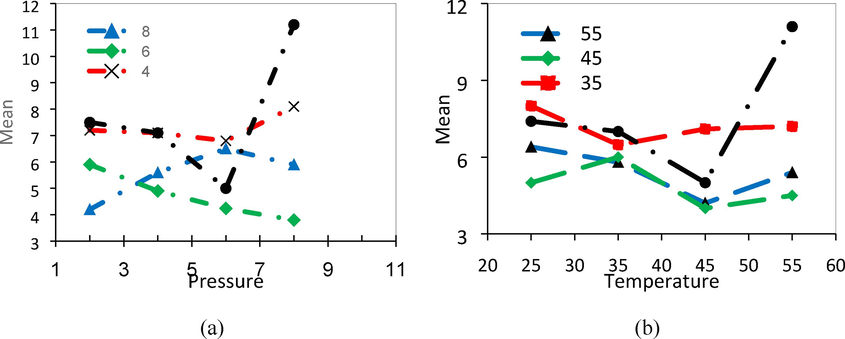
The effect of nanoparticles on the permeability of CO2 gas in Pebax/PVA/MgO nanocomposite membrane of samples containing 0, 20, 50, and 80 % of PVA.
The measured CH4 permeability of the membranes ranged from 12.77 to 35.22 (units). According to the analysis of variance (ANOVA) (Table C in the Appendix), the most suitable model to explain the relationship between the independent variables and CH4 permeability is a modified one. The model's F-value (8.36) indicates its statistical significance. Figure D in the Appendix compares the experimental findings with the predicted values for CH4 permeability. For more detailed and precise comparisons, the normalized graph of the findings is provided in graph a of Figure D in the Appendix. Graph b in Figure D in the Appendix depicts the model's predicted values based on the actual findings. The residual values in terms of formulations are illustrated in Graph c of Figure D in the Appendix, while the residual values (deviation between the observed and predicted values) are shown in terms of the predicted values in graph d of Figure D in the Appendix. The relative error for CH4 permeability of all experimental runs fluctuated within −5.33 % and + 5.33 %, as indicated on the y-axis of the graph(Sambasevam et al., 2023).
Fig. 10 illustrates the results of the CH4 permeability test. In contrast to the effect of PVA on CO2 permeability, increasing PVA content reduces CH4 permeability. This can be attributed to the reduced interactions between CH4 and PVA molecules, resulting in an increased barrier effect of PVA crystals against CH4 molecules. The effects of MgO nanoparticles, pressure, and temperature on CH4 permeability are similar to their effects on CO2 permeability(Zou et al., 2023).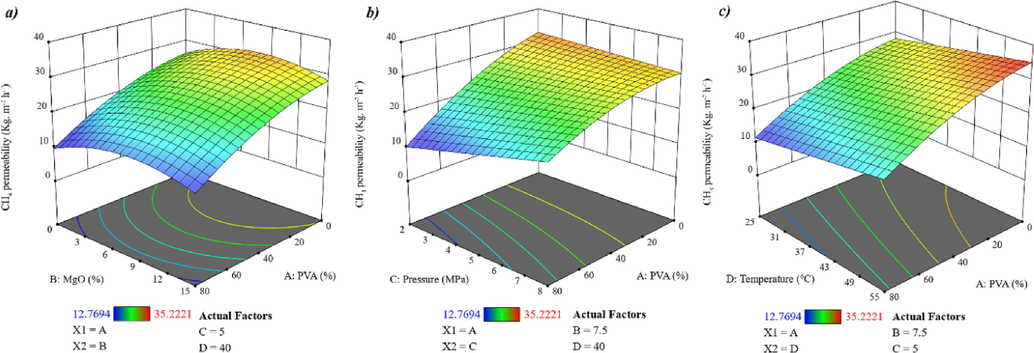
A response surface graph depicting the influence of A to D variables on CH4 permeability.
As the study shows that the independent variables influence CH4 permeability. Eq. (11) exhibits the quantitative correlation between CH4 permeability and the A to D variables derived from the regression study.
3.5 Molecular dynamics simulation
Comparison between experimental results and simulation data validates the reliability of experimental findings. Fig. 11 plots mean squared displacement (MSD) versus time, allowing diffusion coefficients to2 be determined per Equation (5). This quantifies displacement of test gases from original lattice positions [ri(t) - ri(0)] during dynamic motion within the host polymer. Dividing the MSD curve slopes by 6*104 calculates individual gas emission coefficients(Sateria et al., 2023). Table 3 reports diffusion coefficients for CH4 and CO2 through membranes featuring varied PVA loadings. The data indicates CO2 diffusion coefficients rise with increasing PVA content, whereas CH4 values decrease. This performance trend links to membrane polarization at higher PVA proportions. As CO2 molecule polarity matches the enriched surface environment more strongly, it preferentially permeates the material. Since selectivity relates to the diffusion coefficient ratio between gases, incorporating more PVA lowers selectivity for CH4/CO2 separation as a consequence of the described phenomenon. *Gas selectivity is the ratio of CH4 to CO2 diffusion coefficients.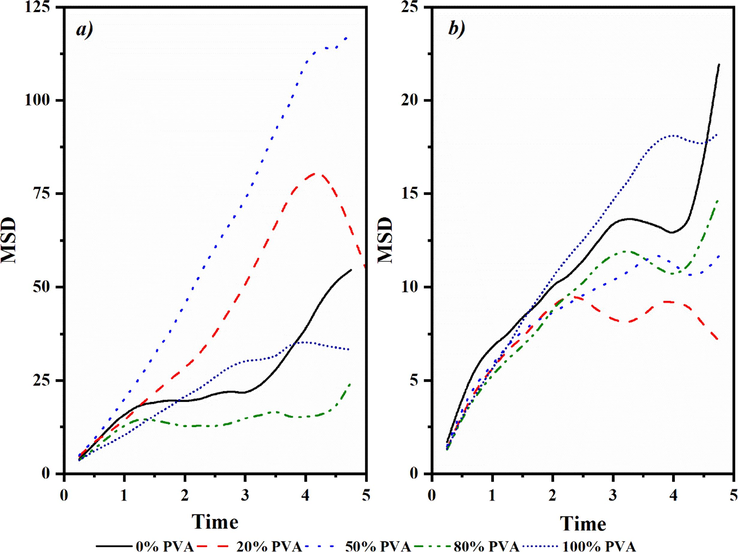
MSD (Å) vs Time (ns) for a) CH4 and b) CO2 at different percentages of PVA.
PVA content (%)
Diffusion coefficient × 105 (m2. s−1)
Gas selectivity
CH4
CO2
0
21.43
1.25
17.15
20
21.95
1.85
11.86
50
20.65
3.22
6.42
80
15.90
4.03
3.94
100
12.33
6.52
1.89
Fig. 12 shows the evaluation of CO2 and CH4 diffusion coefficients obtained from molecular simulation data and gas permeability from experimental measurements at varied PVA weight percentages in dispersed polymer nanocomposites. In Fig. 12. a, the CH4 emission coefficient from simulation decreases non-linearly with a gentle slope as PVA content rises. Fig. 12. c demonstrates experimental CH4 permeability mirrors this trend. This occurs as higher PVA proportions enhance the material's polarity, hindering dissolution of nonpolar CH4. Meanwhile, Fig. 12. b illustrates the CO2 diffusion coefficient from simulation data increases slightly with growing PVA percentage, resembling the experimental CO2 permeability change in Fig. 12 at low pressures and temperatures. Carbon dioxide's polar vibrational nature facilitates greater penetration into the polymer matrix where PVA loading is elevated.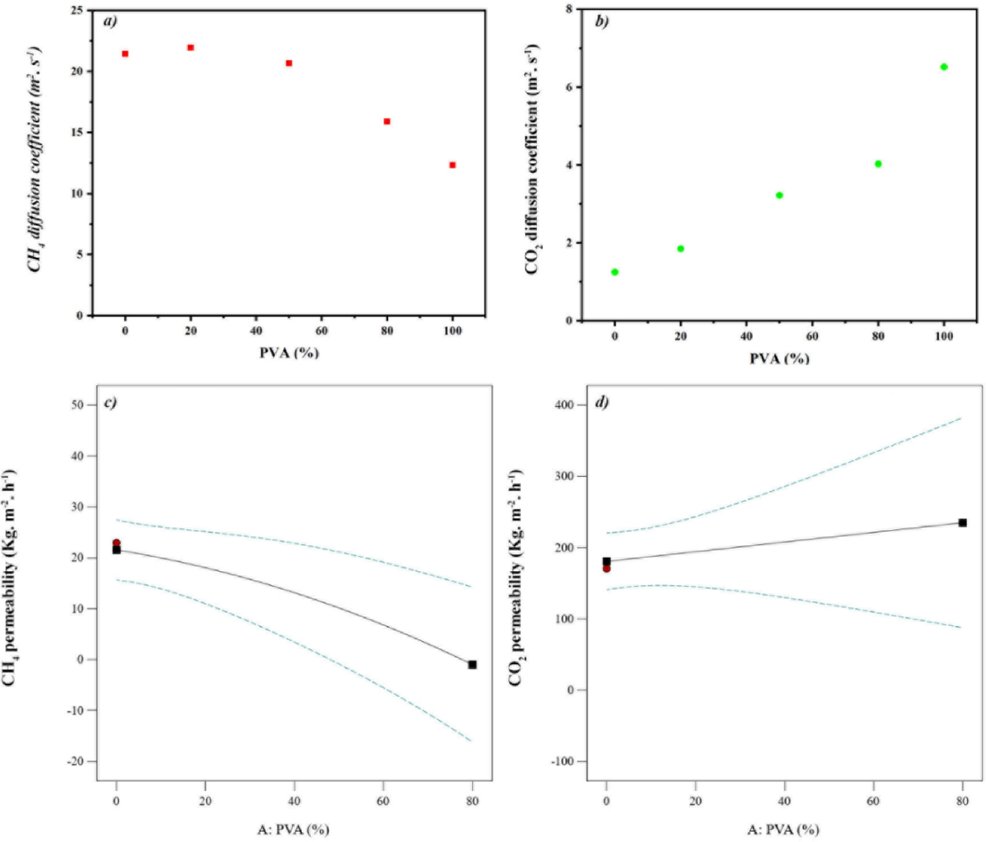
Gas diffusion coefficients for a) CH4 and b) CO2 obtained from molecular dynamics simulation and c) CH4 and d) CO2 gas permeabilities obtained from experimental data.
3.6 Optimal formulations
Further variations in gas permeability compared to each other can serve as a useful criterion for assessing the selectivity of nanocomposite membrane permeation in relation to CO2 or CH4 gases. Equation (12) presents the relative separation of CO2 and CH4 gases by the nanocomposite membrane, where PCO2 represents the CO2 permeability and PCH4 represents the CH4 permeability(Jasim et al., 2023).
4 Conclusion
This study utilized a Pebax®1523 polymer matrix with polyvinyl alcohol (PVA) added at a 20 % weight ratio and magnesium oxide nanoparticles at a 10 wt% for CO2 and CH4 separation. The mixed matrix polymer membrane was successfully prepared via casting. The performance of the membrane was investigated at pressures of 2, 4, 6 and 8 bars and temperatures of 25, 35, 45 and 55 °C. FESEM, FTIR and XRD tests were used to evaluate the prepared membrane. FTIR results confirmed functional groups of polyether block amide, PVA, and magnesium oxide nanoparticles in the composite and nanocomposite. XRD examination showed nanoparticle addition decreased the polymer structure's peak intensity by 24° in two-theta. FESEM imaging revealed nanoparticles were more uniformly distributed with suitable polymer/inorganic compatibility. The results showed polar/ether groups interacting with CO2 increased carbon dioxide permeability. Nanoparticle addition enhanced CO2/CH4 permeability and selectivity versus the pure membrane, while mitigating softening. PVA presence was thought to increase crystalline points preventing gas passage. Examining pressure changes revealed permeability rose with increasing pressure from 2 to 8 bars for both gases. Variance analysis indicated the modified model best fit relationships between variables and responses. Permeability values also correlated significantly with MDS. Simulation data showed the CH4 emission factor decreased non-linearly with gentle PVA percentage slope. Conversely, CO2 gas diffusion increased with gentle PVA percentage slope.
Acknowledgment
The research mentioned in this publication was funded by a research grant from the Islamic Azad University, Shahreza Branch. The authors would like to express their gratitude to the Research Vice Chancellor of Islamic Azad University, Shahreza Branch, and their colleagues for their valuable cooperation and contributions throughout the research process.
Declaration of competing interest
The authors declare that they have no known competing financial interests or personal relationships that could have appeared to influence the work reported in this paper.
References
- Recent progress of MXene-based membranes for high-performance and efficient gas separation. Diam. Relat. Mater.. 2023;135
- [CrossRef] [Google Scholar]
- Mixed matrix membranes for H2/CO2 gas separation- a critical review. Fuel. 2023;333
- [CrossRef] [Google Scholar]
- Computational Investigation of Dual Filler-Incorporated Polymer Membranes for Efficient CO2 and H2 Separation: MOF/COF/Polymer Mixed Matrix Membranes. Ind. Eng. Chem. Res.. 2023;62:2924-2936.
- [CrossRef] [Google Scholar]
- Azizi, N., Reza, M., Mohammad, H., Zarei, M., 2017. Study of CO 2 and CH 4 Permeation Properties through Prepared and Characterized Blended Pebax-2533 / PEG-200 Membranes.
- Effects of MWCNTs on O2/N2 separation performance and morphology of sPEEK/PEI composite membranes: Experimental and molecular dynamics simulation studies. Diam. Relat. Mater. 2023
- [CrossRef] [Google Scholar]
- Effect of incorporation of multi-walled carbon nanotubes on the CO2/CH4 separation performance of sulfonated poly (ether ether ketone) / polyetherimide composite membranes using design of experiments and molecular dynamics simulation methods. Arab. J. Chem. 2024
- [CrossRef] [Google Scholar]
- Mitigation of Physical Aging of Polymeric Membrane Materials for Gas Separation: A Review. Membranes (basel).. 2023;13:1-17.
- [CrossRef] [Google Scholar]
- Mixed-matrix gas separation membranes for sustainable future: A mini review. Polym. Adv. Technol.. 2022;33:1747-1761.
- [CrossRef] [Google Scholar]
- Process Parametric Investigation of Graphene-Oxide-Embedded Composite Membranes for Boosting CO2/N2 Separation. Energy Fuel. 2023;37:11187-11196.
- [CrossRef] [Google Scholar]
- Carbon nanotubes grown on ZIF-L(Zn@Co) surface improved CO2 permeability of mixed matrix membranes. J. Memb. Sci.. 2023;670
- [CrossRef] [Google Scholar]
- Polyether Block Amide as Host Matrix for Nanocomposite Membranes Applied to Different Sensitive Fields. Membranes (basel).. 2022;12
- [CrossRef] [Google Scholar]
- Membrane Application to Gas Separation of Rare Mixtures: A Review. J. Membr. Sci. Res.. 2022;8:8-13.
- [Google Scholar]
- A review on the recent advances in composite membranes for CO2 capture processes. Sep. Purif. Technol.. 2023;307
- [CrossRef] [Google Scholar]
- Nucleophilic substituted NH2-MIL-125 (Ti)/polyvinylidene fluoride hollow fiber mixed matrix membranes for CO2/CH4 separation and CO2 permeation prediction via theoretical models. J. Memb. Sci.. 2023;681
- [CrossRef] [Google Scholar]
- Rising CO2 and warming reduce global canopy demand for nitrogen. New Phytol.. 2022;235:1692-1700.
- [CrossRef] [Google Scholar]
- Fabrication and characterization of Pebax-1657 mixed matrix membrane loaded with Si-CHA zeolite for CO2 separation from CH4. J. Nat. Gas Sci. Eng.. 2021;90:103947
- [CrossRef] [Google Scholar]
- Improving CO2/CH4 separation efficiency of Pebax-1657 membrane by adding Al2O3 nanoparticles in its matrix. J. Nat. Gas Sci. Eng.. 2019;72:103019
- [CrossRef] [Google Scholar]
- Mixed-matrix membranes based on novel hydroxamate metal–organic frameworks with two-dimensional layers for CO2/N2 separation. Sep. Purif. Technol.. 2023;305
- [CrossRef] [Google Scholar]
- Saturated fatty acid-enriched small extracellular vesicles mediate a crosstalk inducing liver inflammation and hepatocyte insulin resistance. JHEP Reports. 2023;5:143747
- [CrossRef] [Google Scholar]
- Journal of Environmental Chemical Engineering Development of melamine-based covalent organic framework-MOF pearl-like heterostructure integrated poly (ether- block -amide) for CO 2 / CH 4 separation. Eng: J. Environ. Chem; 2023. p. :11.
- Effect of amine modification on morphology and performance of poly (ether-block-amide)/fumed silica nanocomposite membranes for CO2/CH4 separation. Mater. Chem. Phys.. 2018;205:303-314.
- [CrossRef] [Google Scholar]
- Modeling and Optimal Operating Conditions of Hollow Fiber Membrane for CO2/CH4 Separation. Membranes (basel).. 2023;13
- [CrossRef] [Google Scholar]
- Superior interfacial design in ternary mixed matrix membranes to enhance the CO2 separation performance. Appl. Mater. Today. 2020;18:100491
- [CrossRef] [Google Scholar]
- Effect of composition on mechanical and physicochemical properties of mucoadhesive buccal films containing buprenorphine hydrochloride: From design of experiments to optimal formulation. J. Drug Deliv. Sci. Technol.. 2020;56:101578
- [CrossRef] [Google Scholar]
- Adsorption and solidification of peppermint oil on microcrystalline cellulose surface: An experimental and DFT study. J. Mol. Struct.. 2020;1205:127558
- [CrossRef] [Google Scholar]
- Investigation of Performance of Pebax/ Poly(vinyl Alcohol) Blend Membrane for Carbon Dioxide Separation from Nitrogen Mina. 2020;3:55-69.
- Investigation of performance of Pebax/ Poly(vinyl alcohol) blend membrane for carbon dioxide separation from nitrogen. Mina. 2020;3:55-69.
- [Google Scholar]
- Mina Kheirtalab, Reza Abedini, M.G., 2022. A novel ternary mixed matrix membrane comprising polyvinyl alcohol (PVA)-modified poly (ether-block-amide)(Pebax®1657)/graphene oxide nanoparticles for CO2 separation 100788.
- Characterization of polysulfone/diisopropylamine 1-alkyl-3-methylimidazolium ionic liquid membranes: high pressure gas separation applications. Greenh. Gases Sci. Technol.. 2020;10:795-808.
- [CrossRef] [Google Scholar]
- Permeation and sorption properties of CO2-selective blend membranes based on polyvinyl alcohol (PVA) and 1-ethyl-3-methylimidazolium dicyanamide ([EMIM][DCA]) ionic liquid for effective CO2/H2 separation. J. Memb. Sci.. 2020;597:117623
- [CrossRef] [Google Scholar]
- Colloids and Surfaces A : Physicochemical and Engineering Aspects MXene / poly (ethylene glycol) mixed matrix membranes with excellent permeance for highly efficient separation of CO 2 / N 2 and CO 2 / CH 4. Colloids Surfaces A Physicochem. Eng. Asp.. 2022;640:128481
- [Google Scholar]
- Martinez, M., Cruz, O.F., G, I.C., Silvestre-albero, J., 2022. Colloids and Surfaces A : Physicochemical and Engineering Aspects Activated carbon from polyurethane residues as molecular sieves for kinetic adsorption / separation of CO 2 / CH 4 652.
- Poly(ether-block-amide) copolymer membrane for CO2/N2 separation: The influence of the casting solution concentration on its morphology, thermal properties and gas separation performance. R. Soc. Open Sci.. 2019;6
- [CrossRef] [Google Scholar]
- Med, Y., n.d. Subscriber access provided by NEW YORK MED COLL.
- Computer simulation of self-avoiding walks: Testing the scanning method. J. Chem. Phys.. 1983;79:502-508.
- [CrossRef] [Google Scholar]
- Membrane-based gas separation accelerated by quaternary mixed matrix membranes. J. Nat. Gas Sci. Eng.. 2020;84:103655
- [CrossRef] [Google Scholar]
- Improved gas separation performance of Pebax®1657 membrane modified by poly-alcoholic compounds. J. Environ. Chem. Eng.. 2022;10
- [CrossRef] [Google Scholar]
- Evaluating ecosystem responses to rising atmospheric CO2 and global warming in a multi-factor world. New Phytol.. 2004;162:281-293.
- [CrossRef] [Google Scholar]
- An optimization of fungal chitin grafted polyaniline for ammonia gas detection via Box Behnken design. Int. J. Biol. Macromol.. 2023;238
- [CrossRef] [Google Scholar]
- Pebax-modified cellulose acetate membrane for CO 2 /N 2 separation. J. Membr. Sci. Res.. 2019;5:25-32.
- [Google Scholar]
- Photocatalytic Degradation of Perfluorooctanoic Acid (PFOA) using Molybdenum Disulphide-Graphene Oxide Composite via Box-Behnken Design Optimization. Malaysian J. Chem.. 2023;25:368-377.
- [Google Scholar]
- Fabrication of Highly Oriented Ultrathin Zirconium Metal-Organic Framework Membrane from Nanosheets towards Unprecedented Gas Separation. Angew. Chemie - Int. Ed.. 2023;62
- [CrossRef] [Google Scholar]
- Gas permeation behavior of pebax-1657 nanocomposite membrane incorporated with multiwalled carbon nanotubes. Ind. Eng. Chem. Res.. 2010;49:6530-6538.
- [CrossRef] [Google Scholar]
- Molecular dynamics simulation of O2 diffusion in polydimethylsiloxane (PDMS) and end-linked PDMS networks. Mol. Simul.. 2014;40:976-986.
- [CrossRef] [Google Scholar]
- Polyvinyl alcohol-based separation membranes: a comprehensive review on fabrication techniques, applications and future prospective. Mater. Today Chem.. 2023;28
- [CrossRef] [Google Scholar]
- Nanocomposite polymer blend membrane molecularly re-engineered with 2D metal-organic framework nanosheets for efficient membrane CO2 capture. J. Memb. Sci.. 2023;685
- [CrossRef] [Google Scholar]
- Enhancing hydrogen gas separation performance of thin film composite membrane through facilely blended polyvinyl alcohol and PEBAX. Int. J. Hydrogen Energy. 2021;46:19737-19748.
- [CrossRef] [Google Scholar]
- Polydimethylsiloxane/Magnesium Oxide Nanosheet Mixed Matrix Membrane for CO2 Separation Application. Membranes (basel).. 2023;13
- [CrossRef] [Google Scholar]
- A hybrid ZIF-8/ZIF-62 glass membrane for gas separation. Chem. Commun.. 2022;58:9548-9551.
- [CrossRef] [Google Scholar]
- Zou, W., Cheng, Y., Ye, Y., Wei, X., Tong, Q., Dong, L., Ouyang, G., 2023. Metal‐Free Photocatalytic CO 2 Reduction to CH 4 and H 2 O 2 under Non‐sacrificial Ambient Conditions. Angew. Chemie. https://doi.org/10.1002/ange.202313392.
Appendix
(See Fig. A1, Fig. B1, Fig. C1, Fig. D1, Table A1, Table B1, Table C1).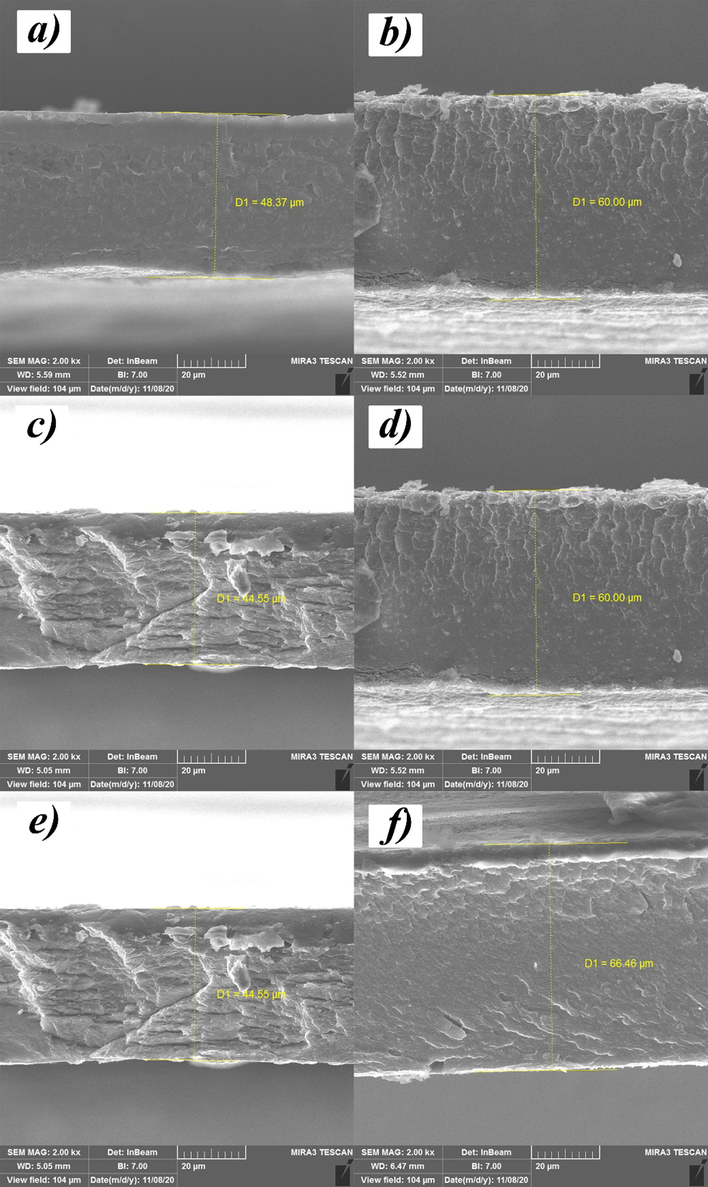
Cross-sectional images of some membrane.
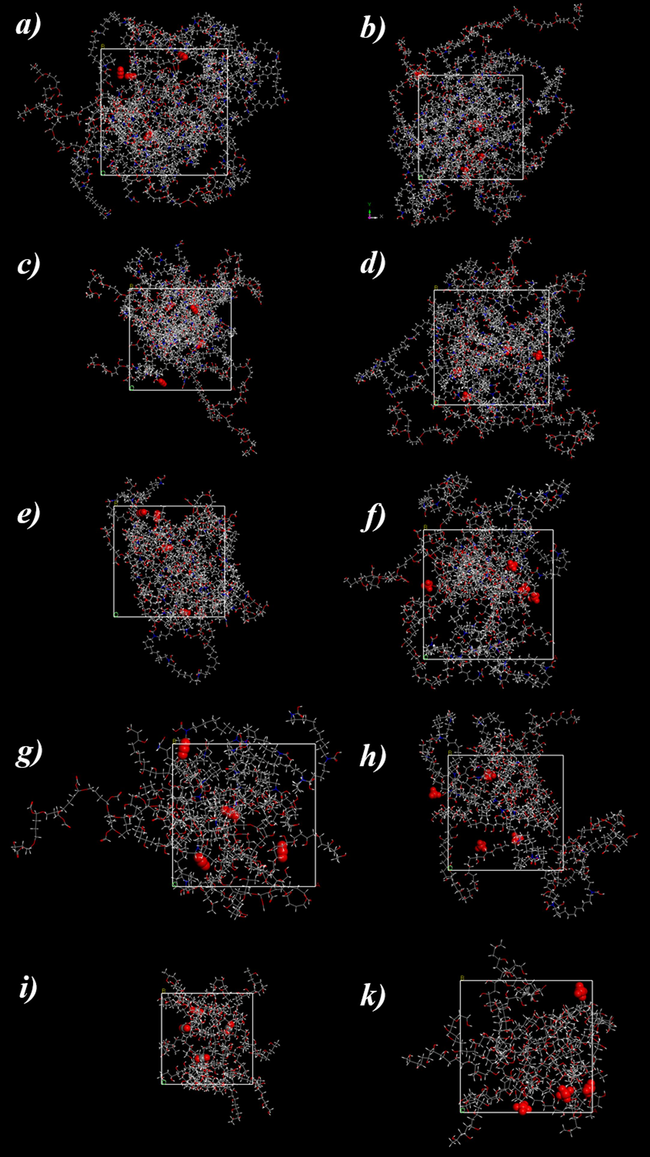
Optimal configuations for a, b) 0, c,d) 20, e,f) 50, g,h) 80 and i,k) 100 % PVA; left side for CO2 and right side for CH4.
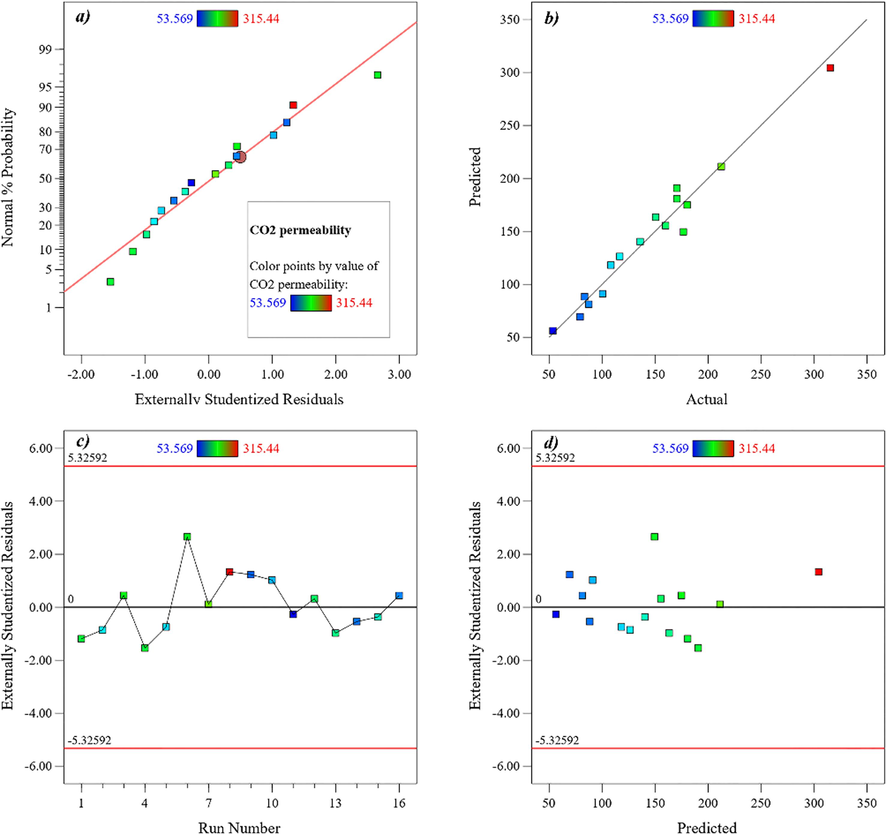
Linear correlation plot between (a) normal % probability and externally studentized residual, (b) actual and predicted values, (c) externally studentized residual and run number (d) and externally studentized residuals and predicted values for CO2 permeability results.
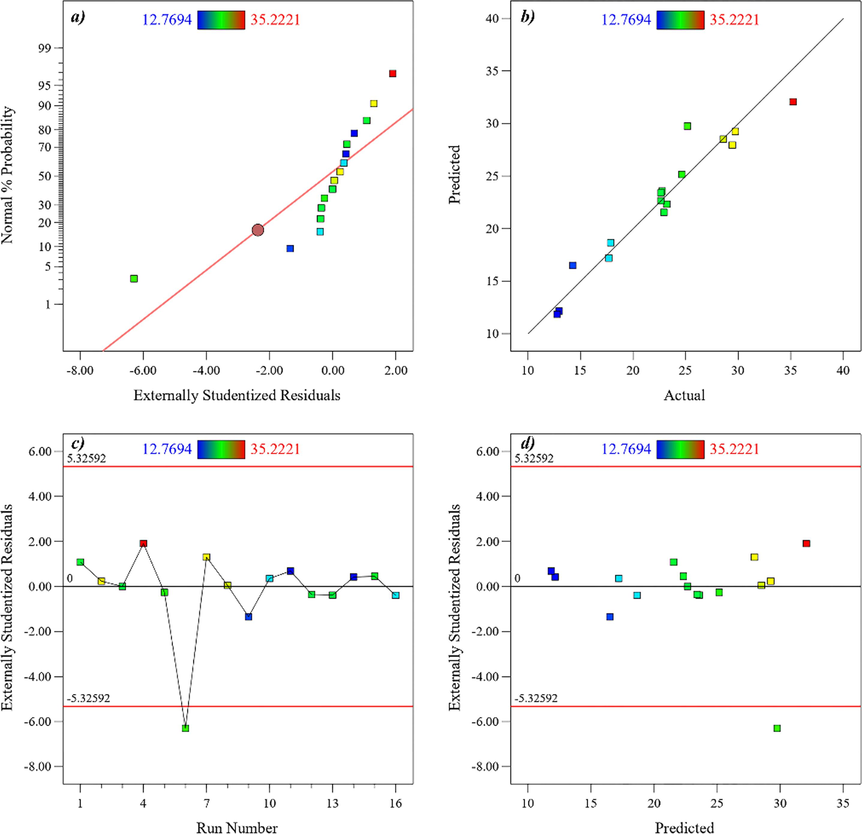
Linear correlation plot between (a) normal % probability and externally studentized residual, (b) actual and predicted values, (c) externally studentized residual and run number (d) and externally studentized residuals and predicted values for CH4 permeability results.
Run
PVA (%), A
MgO (%), B
Pressure (MPa), C
Temperature (°C), D
CO2 permeability
CH4 permeability
1
0
0
2
25
170.636
22.934
2
50
5
8
45
116.598
29.716
3
20
10
8
25
180.290
22.651
4
0
10
6
45
170.561
35.222
5
50
0
6
55
108.271
24.633
6
0
5
4
35
176.740
25.168
7
20
5
2
55
212.541
29.446
8
0
15
8
55
315.440
28.583
9
80
10
4
55
79.246
14.258
10
80
0
8
35
100.411
17.690
11
80
15
2
45
53.569
12.769
12
20
0
4
45
160.003
22.651
13
20
15
6
35
150.572
22.764
14
80
5
6
25
83.468
12.956
15
50
10
2
35
135.905
23.217
16
50
15
4
25
87.395
17.869
Source
Sum of Squares
Df
Mean Square
F-value
p-value
Model
59369.09
9
6596.57
19.26
0.0009
significant
A-PVA
5301.51
1
5301.51
15.48
0.0077
B-MgO
90.72
1
90.72
0.2648
0.6252
C-Pressure
238.22
1
238.22
0.6954
0.4363
D-Temperature
691.44
1
691.44
2.02
0.2052
AB
1140.00
1
1140.00
3.33
0.1179
AC
265.89
1
265.89
0.7762
0.4122
11AD
672.62
1
672.62
1.96
0.2107
BC
3261.89
1
3261.89
9.52
0.0215
C2
4527.07
1
4527.07
13.22
0.0109
Residual
2055.29
6
342.55
Cor Total
61424.37
15
Source
Sum of square
DF
Mean of Squares
F-value
Prob > F
Model
564.53
9
62.73
8.36
0.0089
significant
A-PVA
211.13
1
211.13
28.14
0.0018
B-MgO
2.90
1
2.90
0.3860
0.5573
C-Pressure
32.17
1
32.17
4.29
0.0838
D-Temperature
75.71
1
75.71
10.09
0.0192
AC
11.27
1
11.27
1.50
0.2662
BC
34.70
1
34.70
4.63
0.0750
CD
19.27
1
19.27
2.57
0.1601
A2
22.86
1
22.86
3.05
0.1315
B2
49.21
1
49.21
6.56
0.0428
Residual
45.01
6
7.50
Cor Total
609.54
15


