

Translate this page into:
Preparation and performance of a bamboo-based electromagnetic wave absorber by interfacial polymerization of graphene oxide/polyaniline
⁎Corresponding authors. whuwj@sina.com (Jin Wang), wangzhe@zafu.edu.cn (Zhe Wang), zhjianzj@126.com (Jian Zhang)
-
Received: ,
Accepted: ,
This article was originally published by Elsevier and was migrated to Scientific Scholar after the change of Publisher.
Abstract
Excellent electromagnetic wave absorption ability and effective absorption bandwidth have been the development direction of electromagnetic wave absorbing materials. In this paper, a rational structural design is proposed. Graphene oxide (GO)/polyaniline (PANI) layer was formed on the surface of the natural material bamboo powder (BP) by an interfacial polymerization process. The combination of GO and PANI improves the impedance mismatch of the conductive polymer PANI. Enhanced dielectric storage and loss capability of the composite GO/PANI/BP. The addition of BP brings more electromagnetic wave loss channels to the composite GO/PANI/BP. This unique structure facilitates the construction of a three-dimensional electromagnetic wave-reflecting cavity, which improves the absorptive capacity of the composite by introducing effective multiple reflections. The conductivity of GO/PANI/BP was 1.78 (±0.06) S/cm. When filled to 30 wt%, a minimum reflection loss (RLmin) of −44 dB at 9.36 GHz and a thickness of 3 mm, and an effective absorption bandwidth (<-10 dB) of up to 5.36 GHz in the frequency range 12.64–18 GHz and at a thickness of 2 mm. Exhibits superior loss capability compared to most previous PANI-based electromagnetic wave absorbing materials. In addition, the design structure of this three-dimensional electromagnetic wave reflecting cavity can provide inspiration for the design of other electromagnetic wave absorbing materials and expands the candidate range of green and efficient electromagnetic wave absorbers.
Keywords
Bamboo powder
Polyaniline
Graphene oxide
Electromagnetic wave absorbing
Conductivity
Composite materials

1 Introduction
Currently, electromagnetic interference has become a significant issue affecting people. Electromagnetic wave radiation not only poses health risks but also disrupts the functionality of electronic devices (Wang et al., 2012; Zhang et al., 2015; Liu et al., 2021). The rapid development of wireless communication in the field of electronic communication has caused interference in aviation communication, radio, television, and communication systems. It is urgent to eliminate the detrimental effects of electromagnetic pollution. Therefore, it is crucial to prioritize research on electromagnetic wave-absorbing materials with low density, strong absorption, wide frequency band, and thin thickness (Lv et al., 2017, 2018; Wu et al., 2018).
Compared to traditional electromagnetic wave absorbers such as ferrum (Fe) (Liu et al., 2016; Meng et al., 2016; Chuai et al., 2016), nickel (Ni) (Liu et al., 2017; Yan and Luo, 2017); and cobalt (Co) (Wang et al., 2015; Wen et al., 2014), conductive polymers offer advantages in design flexibility, lightweight construction, and corrosion resistance (Ramoa et al., 2018; Merlini et al., 2017). Among the various types of conductive polymers, PANI is widely used with a range of properties, including electrical conductivity, affordability, and low density (Movassagh-Alanagh et al., 2017; Joseph et al., 2017; Gopakumar et al., 2018). PANI shows promising prospects in absorbing electromagnetic waves, especially in mitigating microwave effects (Bora et al., 2017). However, the electromagnetic wave absorption performance of PANI is unsatisfactory at thin thicknesses despite its remarkable absorption capabilities (Qiu et al., 2018), which is attributed to the high electrical conductivity of dopped-PANI and severe impedance mismatch issues. Usually, an increase in quantity or thickness of PANI is required to achieve optimal electromagnetic wave absorption characteristics at the expense of lightweight, thereby limiting their applicability in complex domains. Graphene oxide (GO) is rich in oxygen-containing functional groups, as well as special hydrophilic, dispersive, and wave-transmission properties. Thus, GO can be used as an ideal two-dimensional growth template for doped-state PANI (Liu et al., 2018). The combination of PANI and GO can alleviate impedance mismatch issues and effectively maintain the low-density and low-thickness advantages of PANI composite wave-absorbing materials, which conforms to the current trend in wave-absorbing material development. For the selection of dopant acid, we chose (1R)-(−)-10-camphorsulfonic acid (L-CSA). Compared with the commonly used HCl, L-CSA contains a large molecule camphorsulfonate (CSA−) that can further enhance carrier transport between PANI chains and between PANI and GO through interactions such as electrostatic attraction or hydrogen bonding. This gives the composites higher dielectric storage and loss capability, which improves the electromagnetic wave absorption properties of the composites.
In the past few years, many researches have explored innovative methods to improve the electromagnetic wave absorption ability (Quan et al., 2017; Jiao et al., 2022), such as constructing multiple interfaces, including air/graphene-coated polymer foams (Shen et al., 2016), air/porous-poly (pyridobisimidazole)/grafted-poly (dimethyl diallyl ammonium chloride)/Au composites (Li et al., 2017), yolk-shell C/air/C microspheres (Qiang et al., 2016), and polydimethylsiloxane/multiwalled carbon nanotubes/cotton fibers (Li et al., 2019). These multiple interfaces integrated within the material function as numerous tiny cavities, effectively reflecting microwaves. These cavities extend the propagation path of incident microwaves by causing multiple reflections, resulting in the eventual attenuation of microwave energy through absorption within the materials. Furthermore, the incorporation of microwave reflective cavities has been identified as a fascinating means to enhance the overall electromagnetic wave absorption capacity when designing electromagnetic wave absorbing materials. We have found that bamboo, which is already widely used in our lives, is the ideal natural material that can be used as a reflective cavity for electromagnetic waves. Common bamboo materials have electrically insulating properties that make them transparent to electromagnetic waves. When bamboo surfaces are loaded with electromagnetic wave absorbing materials, their porous and multi-tubular structure makes them ideal for electromagnetic wave reflecting cavities. The reflective cavity extends the transmission path of the incident electromagnetic wave and improves the electromagnetic wave loss capability of the composite material.
In this paper, a bamboo-based electromagnetic wave absorber was prepared by interfacial polymerization of GO/PANI and BP. The microstructure, composition, and electromagnetic wave absorption properties were comprehensively investigated. In addition, the main component of the composite is biodegradable and renewable bamboo, which makes the composite more competitive than conventional wave-absorbing materials, further expanding a brand new development in the high-value utilization of bamboo materials.
2 Materials and methods
2.1 Materials and instruments
Five-year-old Phyllostachys pubescens bamboo was sampled from Suichang County, Zhejiang Province, processed into pieces with a moisture content of approximately 10 %, and grounded to powders of approximately 200 mesh. The composition of moso bamboo includes lignin, heddle cellulose, pentosan, ash, cold water extracts and hot water extracts. Graphene oxide (C6O11(OH)2) was provided by Suzhou Tianfeng Technology Co., Ltd, purity of 99 %. Aniline (C6H7N) and ammonium persulfate (APS, (NH4)2S2O8) were obtained from Chengdu Colon Chemical Co., Ltd, purity of 99 %. (1R)-(−)-10-camphorsulfonic acid (L-CSA, C10H16O4S) was purchased from Shanghai Maclin Biochemical Technology Co., Ltd, purity of 99 %.
2.2 Preparation process of the GO/PANI/BP composite
90 mg of GO was weighed and ultrasonically dispersed in 30 mL of deionized water to form a GO dispersion with a mass concentration of 3 g/L. 3 mL of aniline was mixed with 30 mL of L-CSA solution with a concentration of 1.25 mol/L and stirred electromagnetically for 0.5 h. 3 g of BP was added to the above mixture together with the GO dispersion and sonicated for 0.5 h. After sonication, the mixture was placed in an ice bath, and the temperature was maintained at 5 ± 1 °C. Another 5.7 g of APS (1.25 mol/L) was dissolved in 20 mL of L-CSA solution with a concentration of 1.25 mol/L and added dropwise to the above mixture in an ice bath with electromagnetic stirring for 6 h. After the reaction, the reaction product was washed with deionized water and anhydrous ethanol several times until the filtrate was neutral and colorless, thereby obtaining the final product, L-CSA-doped GO/PANI/BP. The preparation process of GO/PANI/BP is shown in Fig. 1. L-CSA-doped polyaniline/bamboo and L-CSA-doped graphene oxide/polyaniline powders prepared without graphene oxide and bamboo were used as the control groups and labeled PANI/BP and GO/PANI, respectively. Three replicate preparations of each sample were made.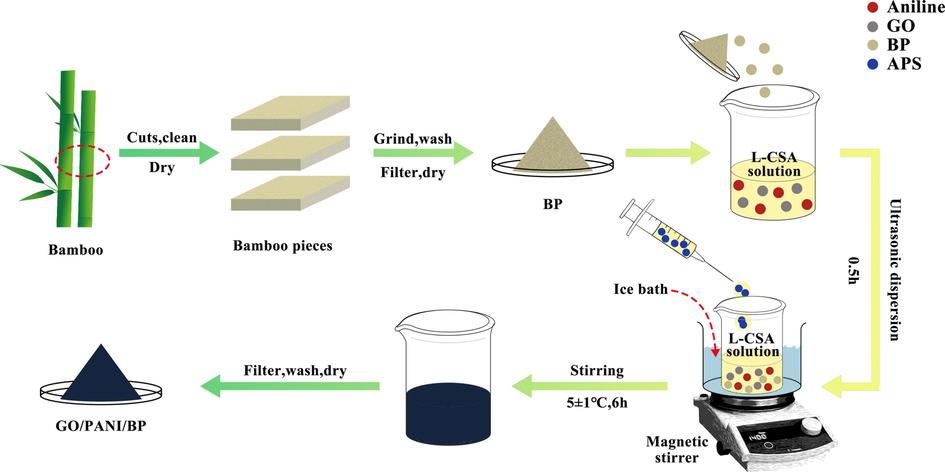
Schematic illustration of the preparation procedure of the GO/PANI/BP composite.
2.3 Characterization
The surface morphology was characterized by scanning electron microscopy (SEM, Quanta 200, FEI, USA) and transmission electron microscope (TEM, Tecnai G2 F20, FEI, USA). The surface chemical compositions were determined via energy dispersive spectroscopy (EDS, coupled with SEM. The crystalline structures were identified by X-ray diffraction (XRD, D/MAX 2200, Rigaku, Japan) using Cu Kα radiation ( ) at a scan rate of 10°min−1 ranging from 5° to 90°, 40 kV, and 40 mA. The functional groups in the samples were confirmed through Fourier transform infrared (FTIR) spectroscopy (Spectrum One, Perkin Elmer, USA). Raman spectra were obtained using a laser Raman spectroscopy (Horiba Scientific-LabRAM HR evolution) with a 514 nm argon ion laser. The surface elemental composition analysis was conducted by X-ray photoelectron spectroscopy (XPS, Thermo Fisher Scientific-K-Alpha 1063, UK) with an Al Kα monochromatic X-ray source, in which all of the binding energies were calibrated regarding the C1s peak (284.8 eV).
2.4 TG-DSC test
Synchronous thermal analysis (TG-DSC, STA409PC, German) was employed to analyze the quality changes and heat absorption/release of the samples. The sample powders were heated in a nitrogen protection atmosphere at a rate of 10 °C/min ranging from 20 °C to 650 °C, and three replicates were performed in each group.
2.5 Conductivity test
A standard four-probe resistance tester (M-3 handheld, Suzhou Jingge Electronics Co., Ltd., China) was employed to test the resistivity ρ (Ω·cm) of the samples at room temperature, aiming to determine their conductivity. The samples were pressed into a circular tablet with a diameter of 10 mm and a thickness of 2 mm at room temperature. After adjusting the parameters, the samples were closely contacted with four large-head probes. At least 3 samples were tested for each measurement to ensure the accuracy of the data. The calculation formula for conductivity is σ = 1/ρ, where σ is the conductivity (S/cm) and ρ is the resistivity (Ω·cm).
2.6 Microwave absorbing properties test
The electromagnetic parameters were measured by Agilent PNA-N5245A vector network analyzer using coaxial line method. The samples powders were uniformly mixed with paraffin in a mass ratio of 3:7. Standard samples with an outer diameter of 7.00 mm, an inner diameter of 3.00 mm, and a thickness of 2.00 mm were prepared by hot pressing. After that, the samples were inserted into acopper holder and connected between the waveguide flanges of the instrument. The test band was 2–18 GHz. The real and imaginary parts of the complex permittivity are the dielectric constant and dielectric loss, respectively. The real and imaginary parts of the permeability are the complex permeability and magnetic loss, respectively. The imaginary parts/real parts are the dielectric loss angle and magnetic loss angle, respectively. According to transmission line theory, the reflection loss (RL) in decibels (dB) was calculated. Each sample was repeated 3 times to ensure the accuracy of the sample data.
3 Results and discussion
3.1 FT-IR analysis
The chemical structures of BP, GO/PANI, PANI/BP, and GO/PANI/BP were examined by FT-IR analysis, as displayed in Fig. 2. BP showed characteristic peaks in natural plant fibers. The stretching vibration of O-H bonds was represented by a broad absorption band at approximately 3400 cm−1. The peak at 2910 cm−1 was assigned to C-H stretching. Additionally, the peak at 1735 cm−1 indicated an absorption peak of the carbonyl group. The C⚌C stretching vibration was caused by the peak at 1603 cm−1. The C–C stretching vibration was responsible for the band centered at 1250 cm−1. The secondary hydroxyl groups were denoted by the characteristic peak at 1162 cm−1, while the primary hydroxyl groups were derived from the peak at 1041 cm−1.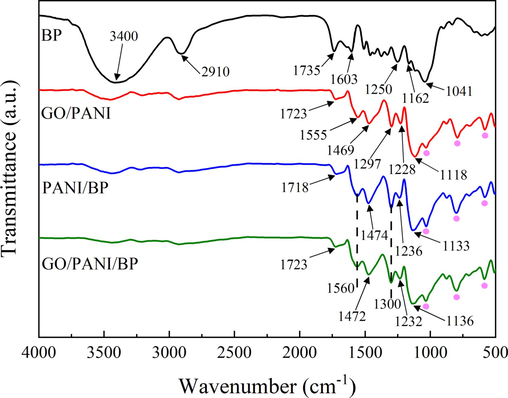
FT-IR spectra of BP, GO/PANI, PANI/BP, and GO/PANI/BP.
Following the procedure of interfacial polymerization, the distinctive peaks associated with PANI can be clearly observed in the spectra of PANI/BP and GO/PANI/BP. The peak at 1560 cm−1 was ascribed to the stretching vibration of C⚌C in the plutonium ring (N⚌Q⚌N) of PANI (Rezaei et al., 2014). The peaks at 1474 cm−1 in PANI/BP and 1472 cm−1 in GO/PANI/BP originated from the stretching vibration of C⚌C in the benzene ring (N⚌B⚌N) of PANI (Rezaei et al., 2014). The peak at 1300 cm−1 was ascribed to the bending vibration of the C–N bond in aromatic amines. The stretching vibration of the C–N+• (the N atom has a positive charge) bond in the specific polarizable subconfiguration of PANI was manifested as the peaks at 1236 cm−1 in PANI/BP and 1232 cm−1 in GO/PANI/BP (Zhang et al., 2017). These peaks proved the existence of a PANI layer on the BP surface. The vibration mode of the imino (–NH–) bond in the protonated form of PANI (B-NH+ = Q) was responsible for the bands at 1133 cm−1 in PANI/BP and 1136 cm−1 in GO/PANI/BP (Sapurina et al., 2000); which was attributed to the electron delocalization in the PANI chain and is commonly regarded as a characteristic of the doping degree of PANI (Tissera et al., 2018). The findings mentioned above indicated that functional amino groups in aniline monomers readily chemically bonded with polar groups (such as hydroxyl and carboxyl groups) on the BP surface. PANI was adsorbed onto the hydroxyl and carboxyl groups of BP through electrostatic interactions, forming hydrogen bonds between PANI and BP.
In the spectra of GO/PANI, PANI/BP, and GO/PANI/BP, the characteristic absorption peaks of the –SO3 group were labeled with pink dots. The characteristic absorption peaks of the S⚌O stretching vibration near 1030 cm−1 and the stretching vibration absorption peaks of the C–S and S–O groups near 800 cm−1 and 580 cm−1 indicated the presence of camphorsulfonate ions (CSA−) (Li et al., 2007). Compared with the spectra of GO/PANI and GO/PANI/BP, the peak near 1723 cm−1 was attributed to the stretching vibration of the C⚌O bond in GO, demonstrating the presence of graphene oxide in the complexes. Compared with the spectra of PANI/BP and GO/PANI/BP, redshifts in the absorption peaks of C⚌C and C–N+• of PANI indicated interactions between GO and PANI molecules (Bissessur et al., 2006). GO is adsorbed with PANI through hydrogen bonding. The spectra of GO/PANI and GO/PANI/BP exhibited characteristic absorption peaks of both GO and PANI functional groups, indicating the successful polymerization of PANI on the surface of GO lamellae.
3.2 Raman analysis
The chemical structures of BP, GO/PANI, PANI/BP, and GO/PANI/BP were further explored by Raman, as shown in Fig. 3. BP exhibited characteristic peaks in natural plant fibers. The peak at 1171 cm−1 was attributed to the C–C and C–O bond stretching vibrations. The peaks at 1603 cm−1 and 1630 cm−1 represented characteristic lignin peaks resulting from symmetric telescoping vibrations of the benzene ring and C⚌C conjugation vibrations of the benzene ring, respectively.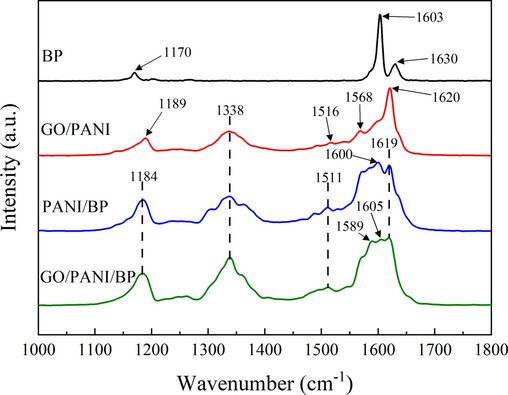
Raman spectra of BP, GO/PANI, PANI/BP, and GO/PANI/BP.
Based on the interfacial polymerization procedure, the PANI/BP and GO/PANI/BP spectra clearly exhibited unique peaks associated with PANI. These spectra displayed remarkable similarity, with peaks at 1184 cm−1 and 1338 cm−1 designated as C-H bond deformation and C–N+• bond stretching in the plane, respectively. The presence of the C⚌N⚌C stretching vibration in the plane was indicated by a peak at 1511 cm−1. PANI/BP possessed a distinct peak at 1600 cm−1, while GO/PANI/BP displayed a peak at 1605 cm−1, both corresponding to C⚌C bond stretching in the plane. Moreover, PANI in PANI/BP and GO/PANI/BP was supported by the presence of a peak at 1619 cm−1, which was assigned to C–C bond stretching in the plane. The broad peaks at approximately 1600 cm−1 in PANI/BP and GO/PANI/BP suggested a polymerization reaction between PANI and BP (Cochet et al., 2000). Hydroxyl and carboxyl groups on the surface of BP chemically bind to the amino functional groups of PANI. Hydrogen bonds are also formed between PANI and BP. Characteristic peaks at 1568 cm−1 in GO/PANI and 1589 cm−1 in GO/PANI/BP, corresponding to the disordered defects or edge areas and vibration of the sp2-hybridized carbon (Tian et al., 2018), demonstrated the presence of GO in both GO/PANI and GO/PANI/BP.
3.3 XRD analysis
The XRD patterns of BP, GO/PANI, PANI/BP, and GO/PANI/BP are shown in Fig. 4. The characteristic peaks of doped-state PANI appeared near 2θ = 10.8°, 15.6°, 21.4°, 24.5°, and 25.4°, corresponding to the (0 0 1), (0 1 0), (1 0 0), (1 1 0), and (1 1 1) crystal planes of PANI, respectively (Fan et al., 2012). This is consistent with the results reported by POUGET et al (Pouget, 1991). The diffraction peaks on the crystal plane of (1 1 1) are broadened and less pronounced. The reason may be that L-CSA acts as a dopant acid and also as a surfactant to help the system dispersion. The peaks labeled by pink dots were located at 2θ = 16.8°, 18.4°, and 19.4°, which were the characteristic peaks of sulfonated PANI in the presence of L-CSA (Li et al., 2007). GO/PANI and GO/PANI/BP show weak diffraction peaks at 2θ = 23.4° attachment. This is the diffraction peak of the (0 0 2) crystal plane of graphene. The reason for this is that the purity of GO used in the raw material is 99 %, and some graphene is not fully oxidized. According to previous studies, strong diffraction peaks of GO appear at 2θ = 11° attachment to the (0 0 1) crystal plane (Nebol'sin et al., 2020). However, due to the presence of a large number of oxygen-containing functional groups such as hydroxyl, carbonyl and carboxyl groups on the surface of GO, PANI reacts with GO through hydrogen bonding, and PANI grows on the GO surface. This leads to an increase in the spacing between the GO layers, and the diffraction peaks of GO gradually move to the small angle region until they disappear (Dreyer et al., 2010). This is the reason why the unique strong diffraction peaks of GO did not appear in the XRD curves of GO/PANI and GO/PANI/BP. The results of the XRD curves of the three PANI complexes were basically the same, and the introduction of GO and BP did not significantly change the crystal morphology of polyaniline in the complexes.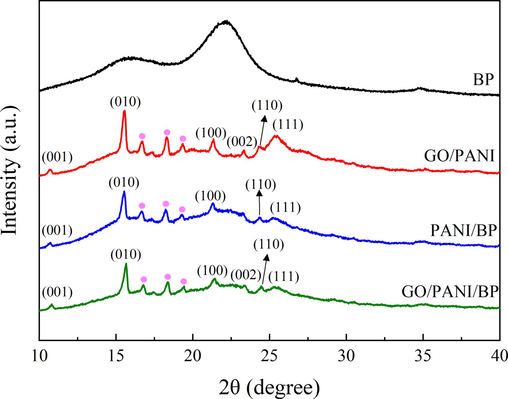
XRD patterns of BP, GO/PANI, PANI/BP, and GO/PANI/BP.
3.4 XPS analysis
The functional groups of the sample were further investigated using XPS spectroscopy (Fig. 5a). The XPS broad scan of BP possessed two distinct peaks of C 1s and O 1s, and GO/PANI, PANI/BP, and GO/PANI/BP showed the addition of two new distinct peaks of N 1s and S 2p, which were due to the introduction of PANI doped with L-CSA (Fan et al., 2012). GO/PANI/BP exhibited a higher peak intensity of C 1s and a lower peak intensity of O 1s than BP and PANI/BP, which indicated that GO/PANI was successfully polymerized on the surface of BP, along with the introduction of C element of GO and the consumption of O element in GO by reacting with BP (Pouget, 1991). The C 1s spectrum (Fig. 5b) of the deconvolution GO/PANI/BP yielded four peaks at 284.1 eV, 284.8 eV, 286 eV, and 287.6 eV, corresponding to C⚌C, C–C, C–N/C⚌N, and C–OH/C–O–C. The peak intensity of C–OH/C–O–C was significantly weakened. This indicates that GO adsorbs with PANI through hydrogen bonding. The amino functional group of PANI binds to the hydroxyl and carboxyl groups on the surface of BP. Which was consistent with the FT-IR results.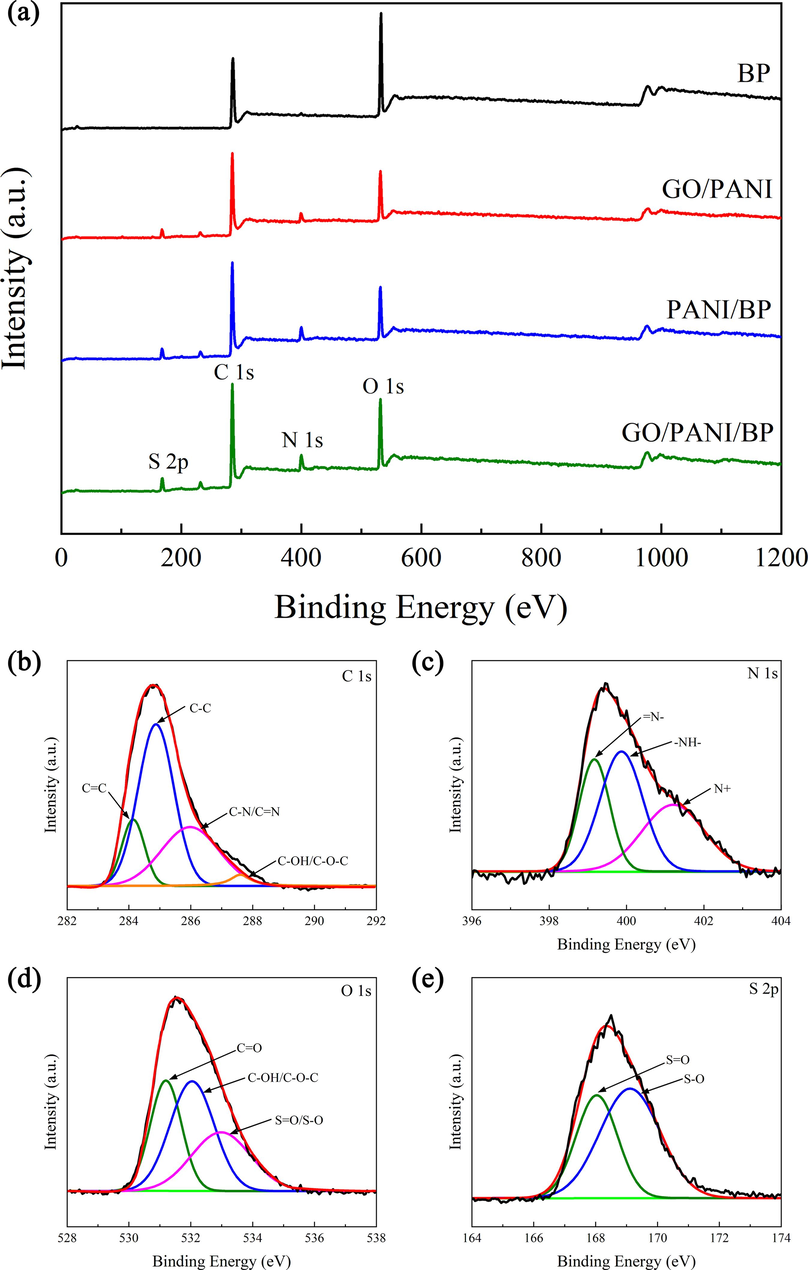
XPS full spectra of BP, GO/PANI, PANI/BP, and GO/PANI/BP (a), and C 1s (b), N 1s (c), O 1s (d), and S 2p (e) regions of GO/PANI/BP.
The deconvolution of the N 1sspectrum (Fig. 5c) had three peaks at 399.1 eV, 399.9 eV, and 401.2 eV attributed to indandiamine (⚌N–), benzenoid amine (–NH–), and nitrogen cation radicals (N+), respectively (Nebol'sin et al., 2020). As the binding site of doped protons, the N atom is the key for PANI to have conductive properties. Excellent conductivity is one of the keys to effectively improve the electromagnetic wave absorption properties of materials. (Cochet et al., 2000). Three Gaussian peaks were present in the XPS spectra of O 1s (Fig. 5d), including C⚌O (531.2 eV), C-OH/C-O-C (532 eV), and S⚌O/S–O (533 eV) (Dreyer et al., 2010). Two Gaussian peaks, S⚌O (168 eV) and S–O (169.1 eV), can be observed in the XPS spectrum of S 2p (Fig. 5e) (Li et al., 2007). The Gaussian peaks of O 1s and S 2p indicated the presence of L-CSA-doped PANI in GO/PANI/BP.
3.5 SEM and TEM analysis
Fig. 6(a–h) shows the low and high magnification SEM images of BP, GO/PANI, PANI/BP and GO/PANI/BP, respectively. Fig. 6(a and e) shows that the original BP exhibits a natural complex structural pattern with a rough surface and some grooves. High magnification reveals that the BP surface is relatively clean but not smooth. The rough surface of BP not only enhanced the adhesion between GO and PANI but also provided a larger surface area, which increased the interfacial interaction between the PANI and BP surfaces. The surface morphology of GO/PANI is shown in Fig. 6(b and f). From the low magnification images, it is seen that GO and PANI present agglomerates of different sizes. As can be seen from the labeling of the high magnification images, the PANI polymerizes on the GO surface and forms a stacked arrangement with the GO, like a sandwich. As shown in Fig. 6(c and g), the PANI particles polymerized on the surface of BP and densely encapsulated BP. This was due to the chemical bonding of the amino functional group of PANI with the hydroxyl and carboxyl groups on the surface of BP. Hydrogen bonds were formed between PANI and BP. The same is true for the scanning electron microscopy images of GO/PANI/BP shown in Fig. 6(d and h). GO/PANI particles polymerized on the surface of BP, densely encapsulating the BP. The stacked arrangement of GO with PANI is also seen by the markers in the high magnification images.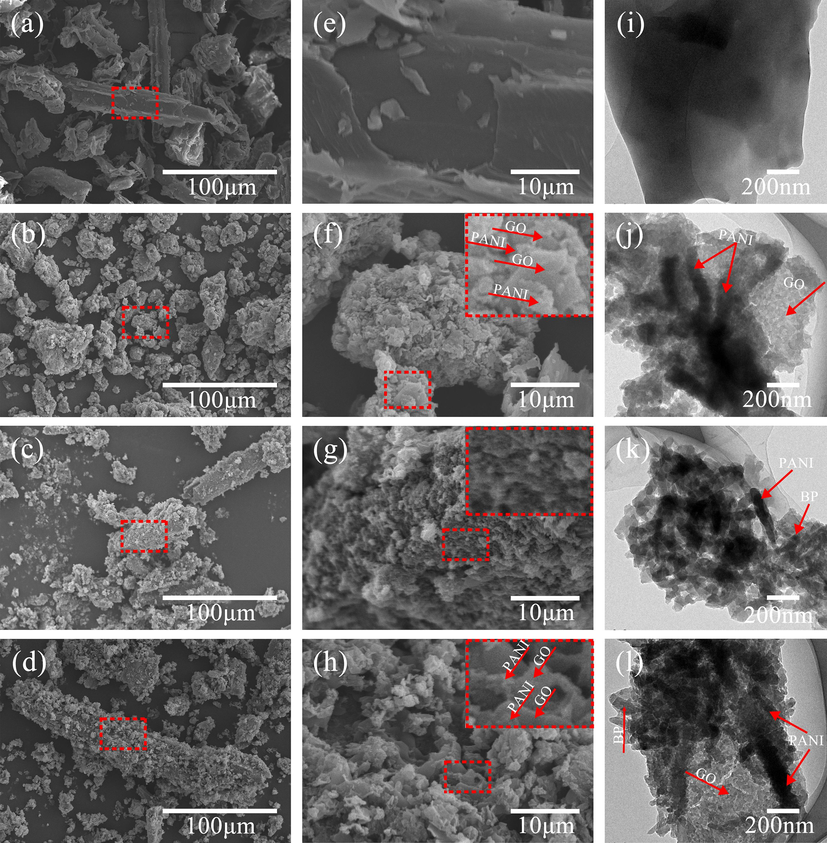
SEM images of BP (a, e), GO/PANI (b, f), PANI/BP (c, g), and GO/PANI/BP (d, h). TEM images of BP (i), GO/PANI (j), PANI/BP (k), and GO/PANI/BP (l).
Fig. 6(i–l) shows the TEM images of BP, GO/PANI, PANI/BP and GO/PANI/BP, respectively. The BP surface is relatively intact and clean as seen in Fig. 6(i). The presence of grooves on the surface of the BP can be seen from the depth of the shading. Fig. 6(j) shows the TEM image of GO/PANI, which shows the good transparency property of GO. GO also exhibits a thin film structure with pleated nature. This is due to the disruption of the conjugated structure of GO during oxidation. The substance appearing in the figure with rod-like morphology is PANI. The length of PANI nanorods is about 200–600 nm. This also indicates the successful polymerization of PANI on the surface of GO. Fig. 6(k) shows the TEM image of PANI/BP, where it can be seen that the PANI nanorods have a length of about 200–400 nm and are cross-stacked on the surface of BP. Fig. 6(l) shows the TEM image of GO/PANI/BP, which reveals the fold-like film structure brought about by GO. The length of PANI nanorods is about 200–600 nm. The GO, PANI and BP are staggered and overlapped, suggesting that the PANI polymerizes on the surface of GO and BP through covalent bonding. The presence of covalent bonds enhances the compatibility between GO and PANI, which further improves the impedance matching problem. And the covalent bonding also enables GO/PANI to firmly adsorb BP, maximizing the synergistic effect between the conductive polymer and the reflective cavity.
3.6 EDS analysis
Fig. 7(a–d) shows the chemical elements and element content of BP, GO/PANI, PANI/BP, and GO/PANI/BP. In the samples, C and O originated from the BP and the conducting polymer attached to it, and most of N and S were derived from doped-state PANI. Pristine BP contained less N and S, but GO/PANI was composed of more N and S. Compared to pristine BP, PANI/BP showed a significant increase in N and S, as well as a significant decrease in C and O, which indicated that the polymerization of PANI on BP was successful and a large number of PANI particles were attached to the surface of BP. Compared with PANI/BP, GO/PANI/BP possessed a significant increase in C and a slight decrease in other elements, which suggested that the addition of GO changed the elemental content of the samples and the GO/PANI particles polymerized successfully on the surface of BP. The C, N, O, and S element mapping images of GO/PANI/BP are shown in Fig. 7(f–i). The distribution of C, N, and O was more concentrated, indicating that the distributions of C, N, and O in the GO/PANI particles and BP appeared to overlap. The uniform distribution of S indicated that the GO/PANI particles were in an orderly arrangement and uniformly polymerized on the BP surface.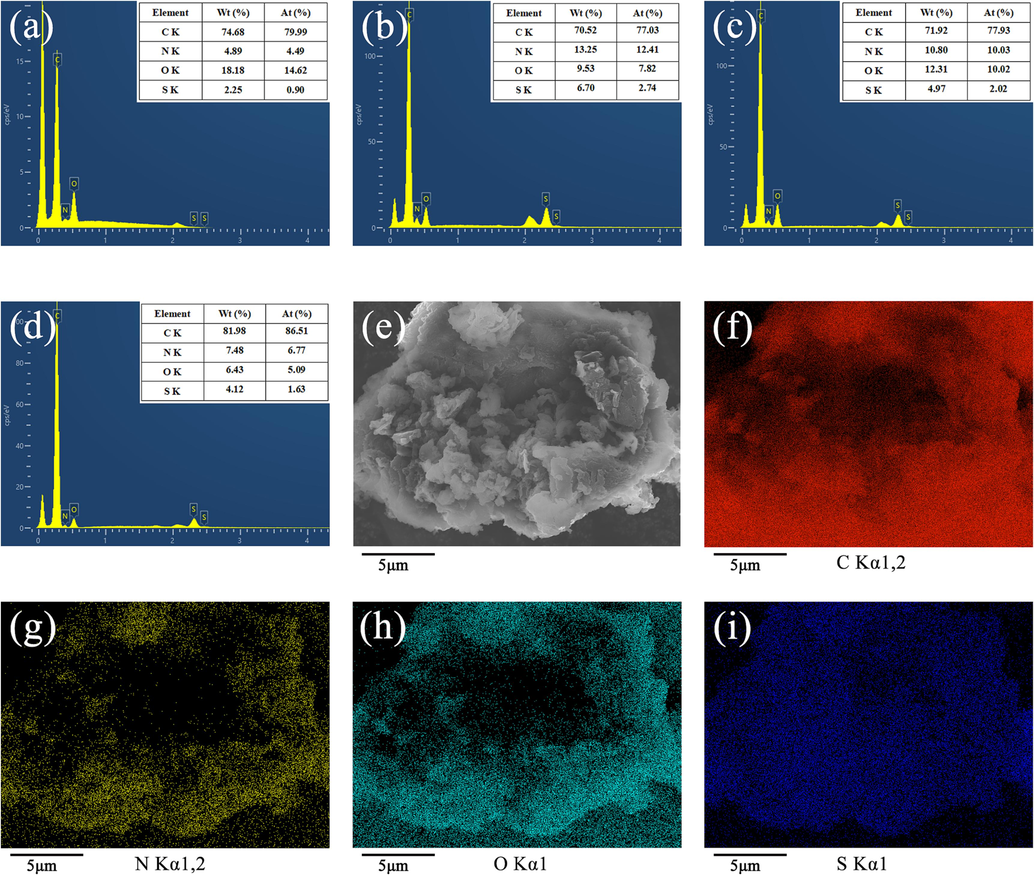
EDS spectra of BP (a), GO/PANI (b), PANI/BP (c), and GO/PANI/BP (d), and the elemental contents presented in the inset tables. SEM images of GO/PANI/BP (e). C (f), N (g), O (h), and S (i) element mapping images of GO/PANI/BP.
3.7 TG-DSC analysis
The TG curves and DSC curves of GO/PANI/BP, PANI/BP, GO/PANI, and BP are shown in Fig. 8. All samples exhibited certain thermal absorption and mass loss from approximately 60 °C to 120 °C, which was due to the evaporation of water in the sample. BP had a large mass loss from approximately 120 °C to 350 °C, which was ascribed to the decomposition of cellulose and hemicellulose contained in BP. There was still a slow mass loss after 350 °C in BP, which was related to the carbonization of lignin. GO/PANI/BP and PANI/BP showed a significant loss of mass from approximately 200 °C to 550 °C, which was derived from the decomposition and carbonization of BP and the decomposition of PANI. The mass loss of GO/PANI/BP was slightly faster than that of PANI/BP from approximately 200 °C to 400 °C, which was caused by the decomposition of GO in GO/PANI/BP. The four samples were predominantly exothermic from 20 °C and 650 °C. The sample residues of GO/PANI/BP, PANI/BP, GO/PANI, and BP at 650 °C were 32 %, 32 %, 28 %, and 21 %, respectively. The GO/PANI/BP and PANI/BP samples showed lower mass loss values, because of their high thermal stability.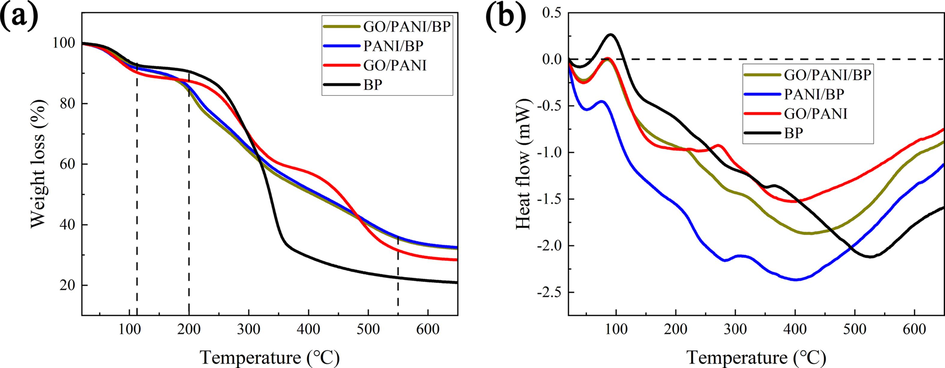
TG curves (a) and DSC curves (b) of GO/PANI/BP, PANI/BP, GO/PANI, and BP.
3.8 Conductivity analysis
Fig. 9(a) shows the conductivity of BP, GO/PANI, PANI/BP, and GO/PANI/BP. The original BP was electrically insulating, with a conductivity of 0 S/cm. The conductivities of the GO/PANI, PANI/BP, and GO/PANI/BP samples were 2.03 (±0.09) S/cm, 1.20 (±0.08) S/cm, and 1.78 (±0.06) S/cm, respectively. The polymerization of PANI and GO gradually improved the electrical conductivity of the composites. However, the conductivity of the final product (GO/PANI/BP) was still slightly lower than that of GO/PANI, which was due to the electrical insulation of BP and its equivalent to a resistor. Fig. 9(b–e) shows photos of the circuit connected by BP, GO/PANI, PANI/BP, and GO/PANI/BP. When the voltage was 4.00 V, the lighting with BP was in an off state with a current of 0 A. The lightings with GO/PANI, PANI/BP, and GO/PANI/BP were always on, with currents of 0.017 A, 0.010 A, and 0.013 A, which also matched the conductivity test results.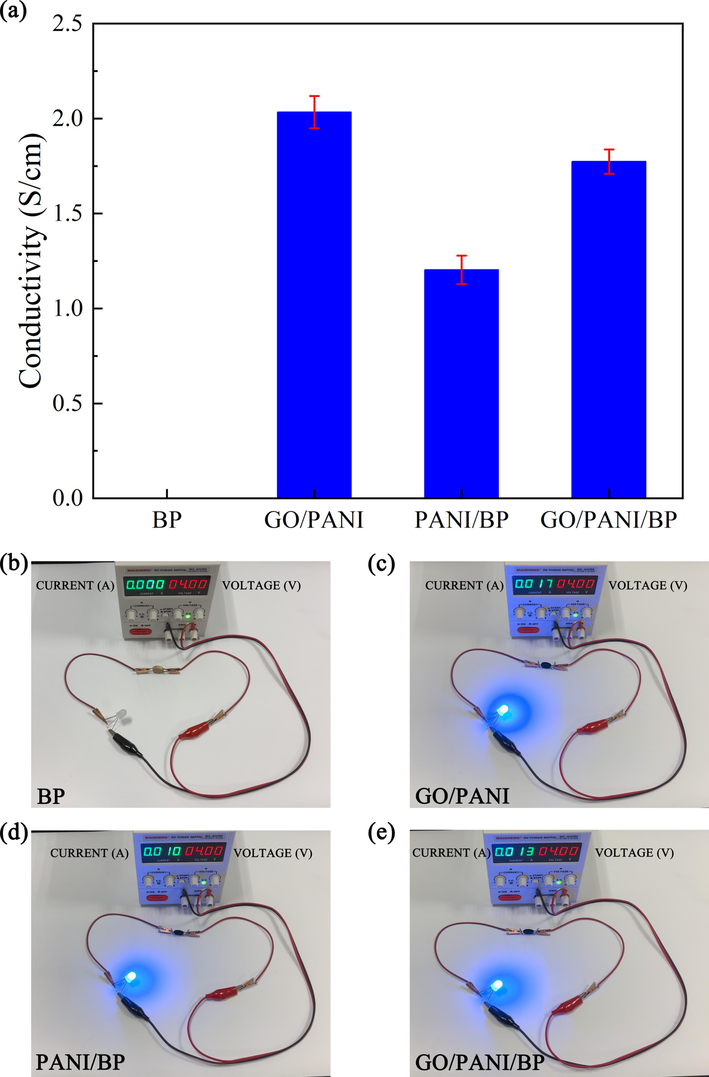
The conductivity of BP, GO/PANI, PANI/BP, and GO/PANI/BP (a); photos of the circuit connected by BP (b), GO/PANI (c), PANI/BP (d), and GO/PANI/BP (e).
3.9 Electromagnetic property analysis
To investigate the EM wave absorption mechanism of the samples, the EM wave parameters of BP, GO/PANI, PANI/BP, and GO/PANI/BP in the range of 2–18 GHz are shown in Fig. 10. Generally, the real part (ε′) and imaginary part (ε″) of the relative permittivity correspond to the storage and dissipation capability of electrical energy, while the real part (μ′) and imaginary part (μ″) of the relative permeability represent the storage and dissipation capability of magnetic energy. The dielectric and magnetic energy loss can be measured in terms of the dielectric loss tangent (tan δε = ε″/ε′) and magnetic loss tangent (tan δμ = μ″/µ′), respectively (Li et al., 2020). As shown in Fig. 10(a and b), the smooth and low values of ε′ and ε′′ for BP indicate a poor dielectric loss capability, consistent with the results of the conductivity test section. ε′ and ε′′ of GO/PANI, PANI/BP, and GO/PANI/BP decreased with increasing frequency, manifested as dielectric dispersion. When an electromagnetic field was applied to these samples, the random dipoles were adjusted to be parallel to the external field, resulting in dipole polarization. The ε′ of GO/PANI/BP was smaller than that of GO/PANI in the high-frequency bands, which was due to the poor conductivity of non-conducting BP. As shown in Fig. 10(c and d), some peaks appear in the magnetic permeability part of the sample, but they are very small and almost close to the values of the paraffin matrix. The µ′ values of the samples fluctuate slightly around the value 1 and the µ″ values fluctuate slightly around the value 0. This means that the magnetic contribution of the sample is very limited and can be ignored. The reason is that the material and the samples may contain traces of metallic impurities. In general, the dielectric loss property and magnetic loss property affect the electromagnetic wave absorption property of the material. As shown in Fig. 10(e and f), the dielectric loss tangent value of BP is close to 0, which still shows the weak dielectric loss capability of BP. This is related to the electrically insulating nature of BP. The dielectric loss tangent value of GO/PANI/BP was significantly higher than that of GO/PANI and PANI/BP, which indicated that GO/PANI/BP had a better dielectric loss capability, often accompanied by a better electromagnetic wave absorption property. The magnetic loss tangent of all samples was close to 0, still indicating a smaller contribution to the magnetic loss. Therefore, the electromagnetic wave absorption properties of GO/PANI, PANI/BP, and GO/PANI/BP mainly stemmed from the dielectric loss properties.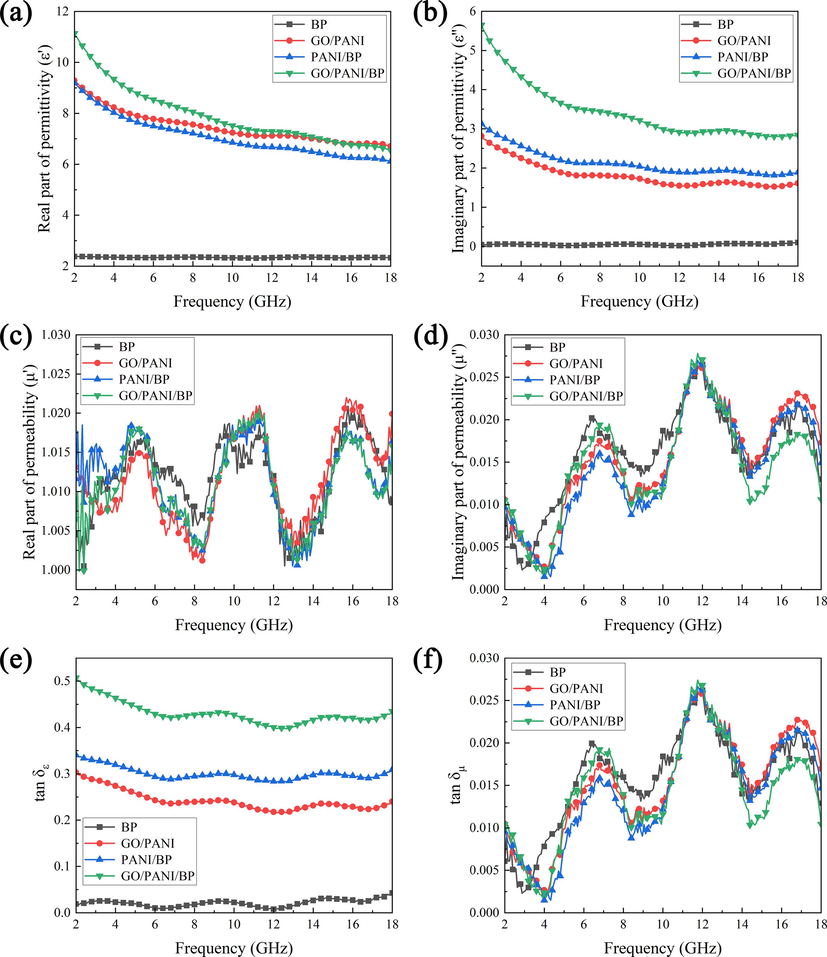
Relative permittivity (a, b), relative permeability (c, d), and tangent loss (e, f) of the as-obtained samples.
Generally, dielectric loss is related to Debye polarization relaxation, which can be represented by the following formula (Liang et al., 2020):
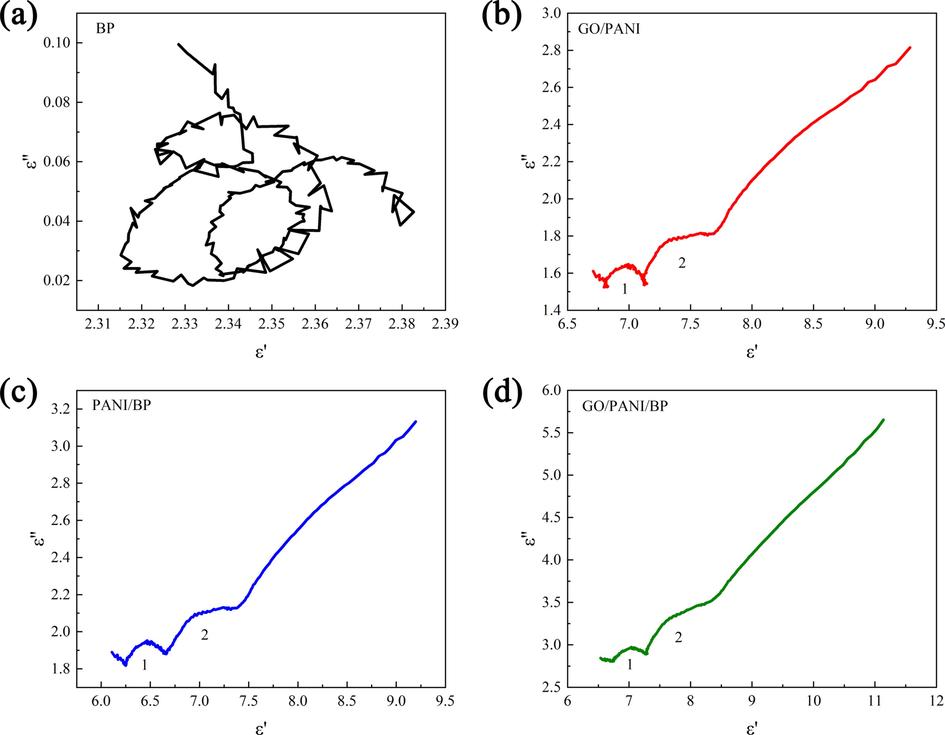
Cole-Cole semicircles of BP (a), GO/PANI (b), PANI/BP (c), and GO/PANI/BP (d).
The impedance matching (Z) and attenuation constant (α) are the two crucial coefficients in the design of electromagnetic wave-absorbing materials, which can be expressed as follows (Zhang et al., 2020):
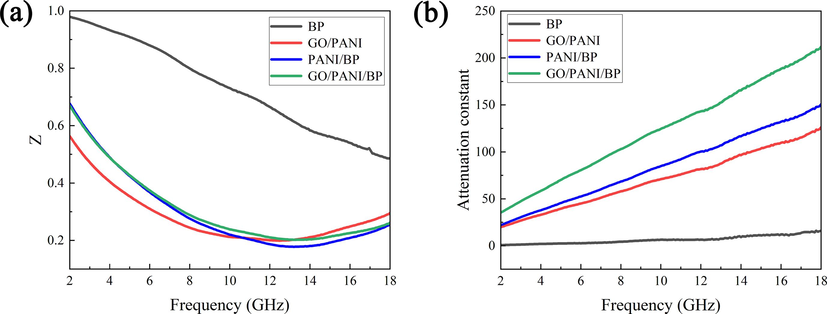
Frequency dependences of impedance matching (a) and attenuation constant (b).
3.10 Electromagnetic wave absorption property analysis
The electromagnetic wave absorption performance of the absorbers can be evaluated by the RL value. Typically, the effective absorption bandwidth requires an RL value lower than −10 dB, which indicates that the absorber must attenuate at least 90 % of the incident EM energy in the corresponding band. The RL value can be calculated using the following equation (Zhang et al., 2020):
The RL and 3D RL curves of BP, GO/PANI, PANI/BP, and GO/PANI/BP are shown in Fig. 13. BP had a minimum reflection loss (RLmin) of −1.32 dB at 18 GHz and a thickness of 3.5 mm. This is consistent with the electromagnetic part of the analysis, where the suboptimal electromagnetic properties caused by electrical insulation directly contribute to the weak electromagnetic wave absorption properties. GO/PANI/BP had a minimum reflection loss (RLmin) of −44 dB at 9.36 GHz and a thickness of 3 mm, as well as an effective absorption bandwidth (<-10 dB) of up to 5.36 GHz in the frequency range 12.64–18 GHz and a thickness of 2 mm. PANI/BP possessed a minimum reflection loss (RLmin) of −14.7 dB at 5.76 GHz and a thickness of 5 mm, with an effective absorption bandwidth (<-10 dB) of up to 3.84 GHz in the frequency range 14.16–18 GHz and a thickness of 2 mm. GO/PANI exhibited a minimum reflection loss (RLmin) of −15.6 dB at 17.44 GHz and a thickness of 5 mm, with an effective absorption bandwidth (<-10 dB) of up to 2.64 GHz in the frequency range 5.2–6.08/16.24–18 GHz and a thickness of 5 mm. The calculated results showed that the polymerization of GO and PANI on the BP surface greatly improved the electromagnetic wave absorption properties of the composites, including the lowest reflection loss, effective absorption bandwidth, and thinner material thickness, which conformed to the direction currently advocated for electromagnetic wave absorbing materials. GO combined with PANI to form an ordered and neat conductive network, and BP provided a reflective cavity that extended the transmission path of electromagnetic waves. The joint collaboration of the three is necessary for the superior electromagnetic wave absorption performance of GO/PANI/BP composites.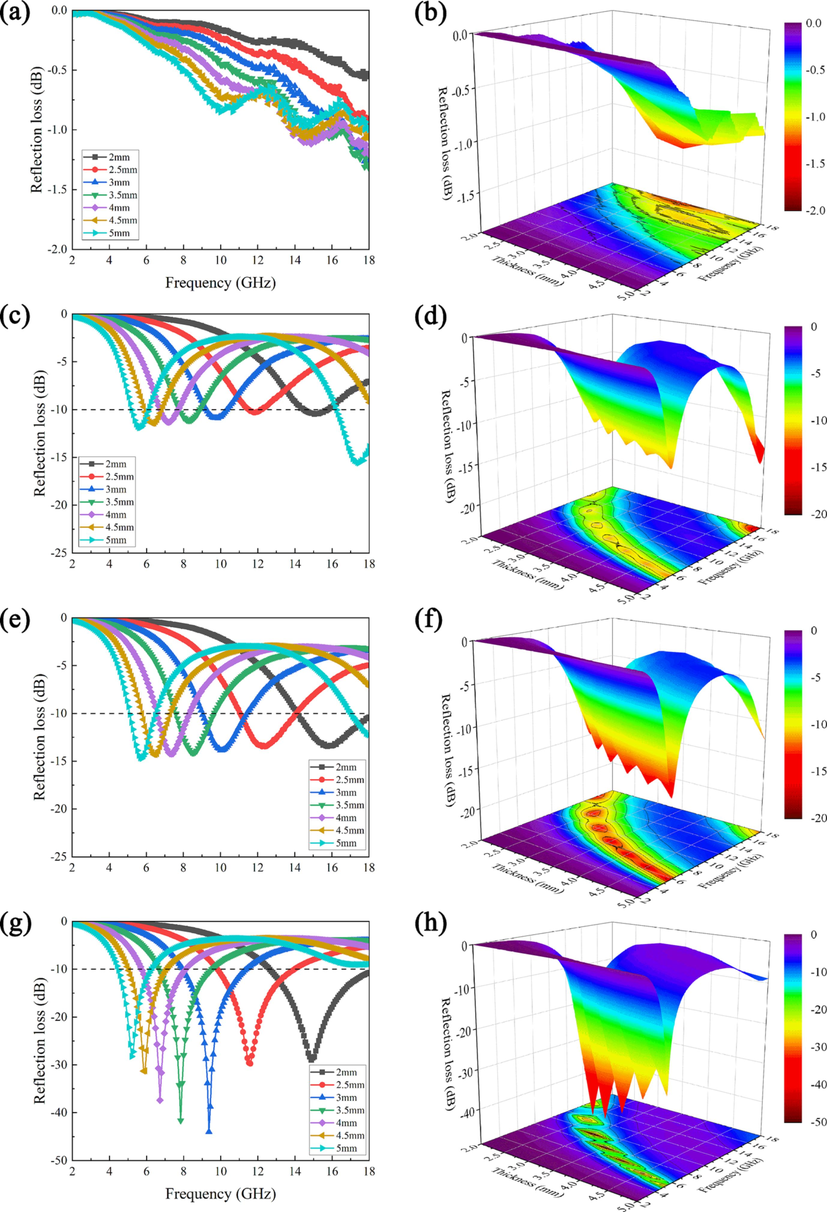
RL values and 3D RL of BP (a, b), GO/PANI (c, d), PANI/BP (e, f), and GO/PANI/BP (g, h).
The BP does not have an effective absorption bandwidth at 2–18 GHz, so it is not plotted in Fig. 14. From the above figure, it can be seen that the GO/PANI/BP composites exhibited excellent effective absorption bandwidths and thin material thicknesses, with the optimum effective absorption bandwidth of 5.36 GHz (12.64–18 GHz, 2 mm). The optimum effective absorption bandwidths of GO/PANI and PANI/BP were 2.64 GHz (5.2–6.08/16.24–18 GHz, 5 mm) and 3.84 GHz (14.16–18 GHz, 2 mm), respectively. Moreover, effective electromagnetic wave absorption in multiple frequency bands (4–18 GHz) was realized by adjusting the thickness of the GO/PANI/BP composites.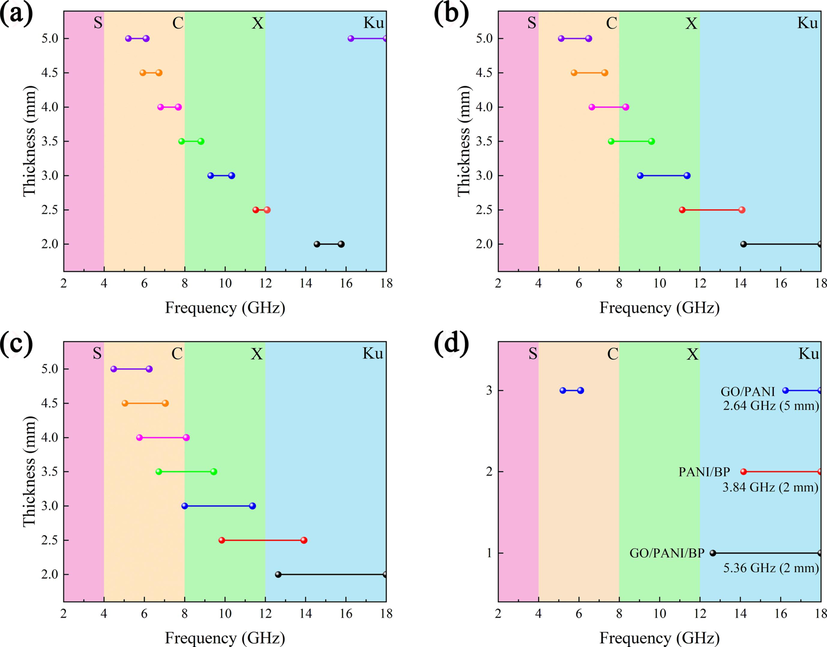
Effective frequency bandwidth (RL exceeding −10 dB) of GO/PANI (a), PANI/BP (b), and GO/PANI/BP (c). Comparison of the optimal effective frequency bandwidths of the three samples (d).
A comparison analysis of the electromagnetic wave absorption indices between the GO/PANI/BP composite and other reported PANI-based composites is listed in Table 1. As displayed in Fig. 15, GO/PANI/BP possessed excellent electromagnetic wave absorption properties at moderate thickness.
Sample
Minimum RL (dB)
Minimum peak position (GHz)
Thickness (mm)
Effective absorption bandwidth (GHz)
Mass fraction added (%)
Ref.
RGO/Fe3O4/PANI
−28.2
5.4
2
5.4(12.6–18)
30
(Li et al., 2019)
Graphene@Fe3O4@PANI@TiO2
−41.8
14.4
1.6
3.5(12.5–16.2)
50
(Liu et al., 2016)
3D heterostructure of graphene@Fe3O4@WO3@PANI
−46.7
9.4
4
1.8(12.4–14.2)
70
(Wang et al., 2017)
RGO/Fe3O4/PANI
−28
18
3.3
5.6(12.4–18)
—
(Singh et al., 2013)
Fe3O4/RGO/PANI
−43.7
10.7
3
5.4(6.8–12.2)
30
(Wang et al., 2018)
N-doped graphene/PANI/Fe3O4
−40.8
14.8
2.7
5.1(10.4–15.5)
—
(Wang et al., 2014)
RGO/PANI/FeNi3
−43.2
6.2
4.8
4.8(8–12.8)
—
(Singh et al., 2014)
RGO/Co-doped ZnNi ferrite/PANI
−24.2
17
1.7
3(15–18)
30
(Lei et al., 2019)
RGO/Porous Fe3O4/PANI
−29.5
14.96
1
4.23(12–16.23)
30
(Luo et al., 2015)
GO/PANI/BP (This work)
−44
9.36
3
5.36(12.64–18)
30
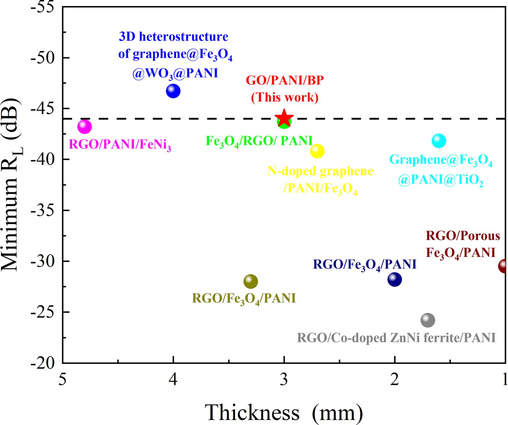
Reflection loss versus thickness for typical PANI-based composites reported in recent literature.
Based on the above analysis, the possible electromagnetic wave absorption mechanism of the GO/PANI/BP composites is shown in Fig. 16. Aniline reacts under acidic conditions and an ice bath environment to form PANI. GO is adsorbed with PANI through hydrogen bonding. And it is arranged in sandwich shape. PANI adsorbs to the hydroxyl and carboxyl groups of BP through electrostatic interactions. Polar groups (hydroxyl and carboxyl groups) on the surface of BP chemically bind to the amino functional groups of PANI. Hydrogen bonds are also formed between PANI and BP. The N in polyaniline is co-doped with the carbon skeleton of GO, thus increasing the dipole polarization (Yan et al., 2023; Yan et al., 2024; Yan et al., 2024). This enhances the dielectric loss capability of the composite, which plays an important role in electromagnetic wave absorption. BP acted as a reflective cavity, providing space for multiple reflections and scattering of electromagnetic waves. The electromagnetic wave propagation path is lengthened, thus improving the electromagnetic wave absorption properties of the composite material.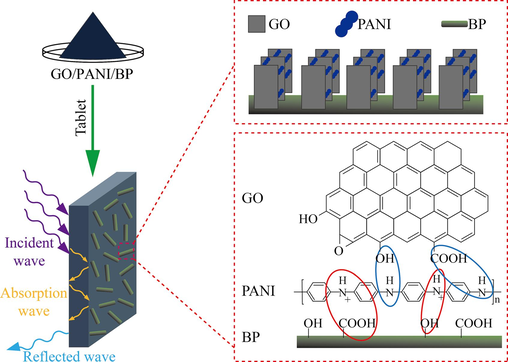
Schematic diagram of the electromagnetic wave absorption mechanism of GO/PANI/BP composites.
4 Conclusion
In summary, an environmentally friendly, economical, and effective bamboo-based electromagnetic wave absorber (GO/PANI/BP) was successfully prepared. BP acted as a reflective cavity, which greatly increased the transmission path of electromagnetic waves within the material. This unique structure introduced effective multiple reflections. GO and PANI stacked polymerization on BP surface. GO/PANI exhibited suitable impedance matching and attenuation coefficients, which delivered excellent electromagnetic wave absorption properties. GO/PANI/BP had a minimum reflection loss (RLmin) of −44 dB at 9.36 GHz and a thickness of 3 mm, as well as an effective absorption bandwidth (<-10 dB) of up to 5.36 GHz in the frequency range 12.64–18 GHz and a thickness of 2 mm, which exceeded many recently reported PANI-based composites. The excellent performance was mainly due to depolarization and interfacial poles induced by multiple interfaces, as well as multiple reflections and scattering induced by BP reflective cavities. More depletion channels brought by BP, and enhanced dielectric storage and depletion capabilities by the combination of GO and PANI. The rational structural design of the two is an efficient strategy to enhance electromagnetic wave absorption (Liu et al., 2021; Xu et al., 2023; He et al., 2023; Chen et al., 2024; Zhang et al., 2023; Xu et al., 2022). Therefore, the synergistic cooperation between conducting polymers and biomass reflective cavities is a relatively interesting and novel strategy for the preparation of electromagnetic wave absorbers. The results of this paper provide a reference for exploring low-cost natural bamboo materials for the development of electromagnetic wave absorbing composites.
Acknowledgment
The work was financially supported by the Zhejiang Provincial Science and Technology Project(Grant NO. 2021F1065-3).
Declaration of competing interest
The authors declare that they have no known competing financial interests or personal relationships that could have appeared to influence the work reported in this paper.
References
- Intercalation of polypyrrole into graphite oxide. Synth. Met.. 2006;156:1023-1027.
- [CrossRef] [Google Scholar]
- Electromagnetic interference shielding effectiveness of polyaniline-nickel oxide coated cenosphere composite film. Compos. Commun.. 2017;4:37-42.
- [CrossRef] [Google Scholar]
- Flower-like hierarchical Fe3O4-based heterostructured microspheres enabling superior electromagnetic wave absorption. Appl. Surf. Sci.. 2024;642:158633
- [CrossRef] [Google Scholar]
- Enhanced microwave absorption properties of flake-shaped FePCB metallic glass/graphene composites. Compos. A Appl. Sci. Manuf.. 2016;89:33-39.
- [CrossRef] [Google Scholar]
- Theoretical and experimental vibrational study of emeraldine in salt form, Part II. J. Raman Spectrosc.. 2000;31:1041-1049.
- [CrossRef] [Google Scholar]
- Enhanced microwave absorption in Ni/polyaniline nanocomposites by dual dielectric relaxations. Appl. Phys. Lett.. 2008;92:013127
- [CrossRef] [Google Scholar]
- Hierarchical nanocomposite of polyaniline nanorods grown on the surface of carbon nanotubes for high-performance supercapacitor electrode. J. Mater. Chem.. 2012;22:2774-2780.
- [CrossRef] [Google Scholar]
- Cellulose nanofiber-based polyaniline flexible papers as sustainable microwave absorbers in the X-band. ACS Appl. Mater. Interfaces. 2018;10:20032-20043.
- [CrossRef] [Google Scholar]
- Hierarchical Co2P/CoS2@C@MoS2 composites with hollow cavity and multiple phases toward wideband electromagnetic wave absorption. Small. 2023;28:2306253.
- [CrossRef] [Google Scholar]
- Achieving ultra-wideband and elevated temperature electromagnetic wave absorption via constructing lightweight porous rigid structure. Nano-Micro Lett.. 2022;14:173.
- [CrossRef] [Google Scholar]
- In situ polymerized polyaniline nanofiber-based functional cotton and nylon fabrics as millimeter-wave absorbers. Polym. J.. 2017;49:391-399.
- [CrossRef] [Google Scholar]
- Tunable electromagnetic wave absorption properties of nickel microspheres decorated reduced graphene oxide. Ceram. Int.. 2017;43:12904-12914.
- [CrossRef] [Google Scholar]
- Synthesis and high-performance microwave absorption of reduced graphene oxide/Co-doped ZnNi ferrite/polyaniline composites. Mater. Lett.. 2019;236:456-459.
- [CrossRef] [Google Scholar]
- Flexible, conductive, porous, fibrillar polymer–gold nanocomposites with enhanced electromagnetic interference shielding and mechanical properties. J. Mater. Chem. C. 2017;5:1095-1105.
- [CrossRef] [Google Scholar]
- Constructing multiple interfaces in polydimethylsiloxane/multi-walled carbon nanotubes nanocomposites by the incorporation of cotton fibers for high-performance electromagnetic interference shielding and mechanical enhancement. Appl. Surf. Sci.. 2019;466:657-665.
- [CrossRef] [Google Scholar]
- Electrochemical capacitance of camphorsulfonic acid doped polyaniline microtubes prepared at low temperature. Acta Phys. Chim. Sin.. 2007;23:820-824.
- [CrossRef] [Google Scholar]
- Toward the application of high frequency electromagnetic wave absorption by carbon nanostructures. Adv. Sci.. 2019;6:1801057.
- [CrossRef] [Google Scholar]
- 3D conductive network wrapped CeO2-x Yolk@Shell hybrid microspheres for selective-frequency microwave absorption. Carbon. 2020;162:86-94.
- [CrossRef] [Google Scholar]
- Environment-stable CoxNiy encapsulation in stacked porous carbon nanosheets for enhanced microwave absorption. Nano-Micro Lett.. 2020;12:102-113.
- [CrossRef] [Google Scholar]
- Sandwich structures of graphene@Fe3O4@PANI decorated with TiO2 nanosheets for enhanced electromagnetic wave absorption properties. J. Alloy. Compd.. 2016;662:63-68.
- [CrossRef] [Google Scholar]
- Construction of layer-by-layer sandwiched graphene/polyaniline nanorods/carbon nanotubes heterostructures for high performance supercapacitors. Electrochim. Acta. 2018;272:77-87.
- [CrossRef] [Google Scholar]
- Magnetic porous N-doped carbon composites with adjusted composition and porous microstructure for lightweight microwave absorbers. Carbon. 2021;173:655-666.
- [CrossRef] [Google Scholar]
- Hollow engineering to Co@N-doped carbon nanocages via synergistic protecting-etching strategy for ultrahigh microwave absorption. Adv. Funct. Mater.. 2021;31:2102812.
- [CrossRef] [Google Scholar]
- Small magnetic Co-doped NiZn ferrite/graphene nanocomposites and their dual-region microwave absorption performance. J. Mater. Chem. C. 2016;4:9738-9749.
- [CrossRef] [Google Scholar]
- Facile synthesis and hierarchical assembly of flowerlike NiO structures with enhanced dielectric and microwave absorption properties. ACS Appl. Mater. Interfaces. 2017;9:16404-16416.
- [CrossRef] [Google Scholar]
- Synthesis and microwave absorption properties of reduced graphene oxide magnetic porous nanospheres-polyaniline composites. Compos. Sci. Technol.. 2015;117:315-321.
- [CrossRef] [Google Scholar]
- A brief introduction to the fabrication and synthesis of graphene based composites for the realization of electromagnetic absorbing materials. J. Mater. Chem. C. 2017;5:491-512.
- [CrossRef] [Google Scholar]
- A voltage boosting strategy enabling a Low-frequency, flexible electromagnetic wave absorption device. Adv. Mater.. 2018;30:1706343.
- [CrossRef] [Google Scholar]
- Design of porous C@ Fe3O4 hybrid nanotubes with excellent microwave absorption. PCCP. 2016;18:2510-2516.
- [CrossRef] [Google Scholar]
- Electrically conductive composites of polyurethane derived from castor oil with polypyrrole-coated peach palm fibers. Polym. Compos.. 2017;38:2146-2155.
- [CrossRef] [Google Scholar]
- Three-phase PANI@nano-Fe3O4@CFs heterostructure: Fabrication, characterization and investigation of microwave absorption and EMI shielding of PANI@nano-Fe3O4@CFs/epoxy hybrid composite. Compos. Sci. Technol.. 2017;150:65-78.
- [CrossRef] [Google Scholar]
- Graphene oxide and its chemical nature: Multi-stage interactions between the oxygen and graphene. Surf. Interfaces. 2020;21:100763
- [CrossRef] [Google Scholar]
- Pouget, J.P., Jozefowicz, M.E., Epstein, A.J., Tang, X., MacDiarmid, A.G., 1991. X-ray structure of polyaniline. Macromolecules 24, 779–789. DOI: 10.1021/ma00003a022.
- Rational design of yolk-shell C@C microspheres for the effective enhancement in microwave absorption. Carbon. 2016;98:599-606.
- [CrossRef] [Google Scholar]
- Facile synthesis of polyaniline nanostructures with effective electromagnetic interference shielding performance. J. Mater. Sci. Mater. Electron.. 2018;29:10437-10444.
- [CrossRef] [Google Scholar]
- Strong electromagnetic wave response derived from the construction of dielectric/magnetic media heterostructure and multiple interfaces. ACS Appl. Mater. Interfaces. 2017;9:9964-9974.
- [CrossRef] [Google Scholar]
- Electromagnetic interference shielding effectiveness and microwave absorption properties of thermoplastic polyurethane/ montmorillonite-polypyrrole nanocomposites. Polym. Adv. Technol.. 2018;29:1377-1384.
- [CrossRef] [Google Scholar]
- Morphology of polyaniline nanofibers synthesized under different conditions. Res. Chem. Intermed.. 2014;40:1233-1247.
- [CrossRef] [Google Scholar]
- Sapurina, I., Mokeev, M., Lavrentev, V., Zgonnik, V., Trchová, M., Hlavatá, D.r., Stejskal, J., 2000. Polyaniline complex with fullerene C60. Eur. Polym. J. 36, 2321–2326. DOI: 10.1016/S0014-3057(00)00012-4.
- Shen, B., Li, Y., Zhai, W.T., Zheng, W.G., 2016. Compressible graphene-coated polymer foams with ultralow density for adjustable electromagnetic interference (EMI) shielding. ACS Appl. Mater. Interfaces 8, 8050–8057. DOI:10.1021/acsami.5b11715.
- Encapsulation of g-Fe2O3 decorated reduced graphene oxide in polyaniline core−shell tubes as an exceptional tracker for electromagnetic environmental pollution. J. Mater. Chem. A. 2014;2:3581-3593.
- [CrossRef] [Google Scholar]
- Nanostructured graphene/Fe3O4 Incorporated polyaniline as a high performance shield against electromagnetic pollution. Nanoscale. 2013;5:2411-2420.
- [CrossRef] [Google Scholar]
- Growth of polyaniline thorns on hybrid electrospun CNFs with nickel nanoparticles and graphene nanosheets as binder-free electrodes for high-performance supercapacitors. Appl. Surf. Sci.. 2018;458:389-396.
- [CrossRef] [Google Scholar]
- Heterogeneous in situ polymerization of polyaniline (PANI) nanofibers on cotton textiles: improved electrical conductivity, electrical switching, and tuning properties. Carbohydr. Polym.. 2018;186:35-44.
- [CrossRef] [Google Scholar]
- Microwave absorption properties of carbon nanocoils coated with highly controlled magnetic materials by atomic layer deposition. ACS Nano. 2012;6:11009-11017.
- [CrossRef] [Google Scholar]
- Enhanced microwave absorption properties of N-doped graphene@PANI nanorod arrays hierarchical structures modified by Fe3O4 nanoclusters. Synth. Met.. 2014;198:300-307.
- [CrossRef] [Google Scholar]
- Cobalt/polypyrrole nanocomposites with controllable electromagnetic properties. Nanoscale. 2015;7:7189-7196.
- [CrossRef] [Google Scholar]
- 3D heterostructure of graphene@Fe3O4@WO3@PANI: preparation and excellent microwave absorption performance. Synth. Met.. 2017;231:7-14.
- [CrossRef] [Google Scholar]
- Synthesis of polyaniline nanorods and Fe3O4 microspheres on graphene nanosheets and enhanced microwave absorption performances. Mater. Chem. Phys.. 2018;209:23-30.
- [CrossRef] [Google Scholar]
- Synthesis, dual-nonlinear magnetic resonance and microwave absorption properties of nanosheet hierarchical cobalt particles. PCCP. 2014;16:18333-18340.
- [CrossRef] [Google Scholar]
- Design of carbon sphere/magnetic quantum dots with tunable phase compositions and boost dielectric loss behavior. Chem. Eng. J.. 2018;333:519-528.
- [CrossRef] [Google Scholar]
- Porous magnetic carbon spheres with adjustable magnetic-composition and synergistic effect for lightweight microwave absorption. Carbon. 2023;213:118290
- [CrossRef] [Google Scholar]
- Atomically dispersed cobalt anchored on N-doped grapheneaerogels for efficient electromagnetic wave absorption with an ultralow filler ratio. Appl. Phys. Rev.. 2022;9:011402
- [CrossRef] [Google Scholar]
- Effects of Ce-Zn co-substitution on structure, magnetic and microwave absorption properties of nickel ferrite nanoparticles. J. Alloy. Compd.. 2017;695:1185-1195.
- [CrossRef] [Google Scholar]
- Two-dimensional metal organic framework derived nitrogen-doped graphene-like carbon nanomesh toward efficient electromagnetic wave absorption. J. Colloid Interface Sci.. 2023;643:318-327.
- [CrossRef] [Google Scholar]
- Zn-MOF-derived hierarchical carbon nanorods superstructures with tunable microwave absorption properties. Mater. Res. Bull.. 2024;171:112622
- [CrossRef] [Google Scholar]
- Metal Mo and nonmetal N, S co-doped 3D flowers-like porous carbon framework for efficient electromagnetic wave absorption. Carbon. 2024;216:118563
- [CrossRef] [Google Scholar]
- Synthesis and characterization of polyaniline nanoparticles with enhanced microwave absorption. RSC Adv.. 2013;3:12694-12701.
- [CrossRef] [Google Scholar]
- Broadband and tunable high-performance microwave absorption of an ultralight and highly compressible graphene foam. Adv. Mater... 2015;27:2049-2053.
- [CrossRef] [Google Scholar]
- Metal Ions confined in periodic pores of MOFs to embed single-metal atoms within hierarchically porous carbon nanoflowers for high-performance electromagnetic wave absorption. Adv. Funct. Mater.. 2023;33:2210456.
- [CrossRef] [Google Scholar]
- TiN/Ni/C ternary composites with expanded heterogeneous interfaces for efficient microwave absorption. Compos. B Eng.. 2020;193:108028
- [CrossRef] [Google Scholar]
- Periodic three-dimensional nitrogen-doped mesoporous carbon spheres embedded with Co/Co3O4 nanoparticles toward microwave absorption. ACS Appl. Mater. Interfaces. 2020;12:24102-24111.
- [CrossRef] [Google Scholar]
- A novel polyaniline-coated bagasse fiber composite with core–shell heterostructure provides effective electromagnetic shielding performance. ACS Appl. Mater. Interfaces. 2017;9:809-818.
- [CrossRef] [Google Scholar]


