

Translate this page into:
Ultrasonic-enhanced phosphorus sludge excited O3 coupled red mud simultaneous desulfurization and denitrification
⁎Corresponding authors. libin@kust.edu.cn (Bin Li), jinzhang@kust.edu.cn (Jin Zhang)
-
Received: ,
Accepted: ,
This article was originally published by Elsevier and was migrated to Scientific Scholar after the change of Publisher.
Abstract
Abstract
The SO2/NOX pollution in the flue gas of non-ferrous smelting is increasingly serious. At the same time, the accumulation of red mud (RM) in the aluminum industry and phosphorus sludge (PS) in the yellow phosphorus industry has caused serious harm to the environment. To remove SO2 and NOX from the non-ferrous smelting flue gas and realize the resource utilization of the above two solid wastes, an ultrasonic field was used in this study to strengthen the PS excited O3 process and RM wet desulfurization and denitrification process. In the process of O3 excitation, the response surface method (RSM) is used to obtain the optimal O3 excitation concentration, and the optimal reaction conditions are designed based on the response surface optimization model: T is 53.226 °C, power density is 0.4 W/cm2, PS concentration is 51.433 g/L, O3 formation concentration up to 250 ppm or more, which provides a theoretical basis for subsequent desulfurization and denitrification steps. It is proved that this study can replace the expensive traditional O3 generator and provide a basis for NOX removal in the following process. In addition, the optimum experimental conditions of ultrasonic enhanced RM desulfurization and denitrification process were also explored. Under ultrasonic frequency of 28 kHz, ultrasonic power density of 0.4 W/cm2, T of 50 °C, RM concentration of 15 g/L, and stirring intensity of 1000 rpm, the desulfurization efficiency of the reaction system can be maintained above 95 % within 250 min, and the denitrification efficiency can be maintained above 90 % within 250 min. The effect of desulfurization and denitrification in this study is much better than that of traditional methods. Finally, the reaction mechanism of ultrasonic enhanced O3 excitation and RM wet desulfurization and nitrogen removal was discussed by combining adsorption thermodynamics, isotherm, and kinetics. The results showed that the OH· free radicals generated by ultrasonic cavitation and the physical effects brought by emulsification had significant promoting effects.
Keywords
Red mud
Ultrasonic
Phosphorus sludge
O3 excitation
Desulfurization and denitration

1 Introduction
Red mud (RM) is a solid waste byproduct of alumina production. Depending on the alumina refining process, it is primarily categorized into combined RM, sintered RM, Bayer RM, or modified Bayer RM (Li et al., 2018). China, the world’s largest alumina producer, accounted for 64 % of the global production in 2019 alone (Wei et al., 2021). The Bayer method generates 0.8–1.5 t of RM per tonne of alumina produced, while the sintering or combined method produces 1.5–2.5 t of RM for every tonne of alumina produced (Xiao et al., 2023; Zhang et al., 2024). By 2022, the stockpiled RM is projected to exceed 1 billion t. Currently, the primary treatment method for RM is stockpiling, which incurs high costs and occupies extensive land areas. The alkali metal and radioactive elements in RM can dissolve into surface water and groundwater, leading to soil and water pollution. With its highly alkaline nature (pH = 11–14) and richness in heavy metal elements, RM can cause severe environmental damage if not adequately treated and randomly stored. The cost and time required to manage this waste are substantial. Long-term storage of RM in large quantities can result in numerous environmental problems and safety hazards. However, RM also represents a potential resource for extracting valuable metal elements or as an environmental remediation material (Niu and Lin, 2024). As an environmental remediation material, RM is primarily used for wastewater, soil, and exhaust gas purification. Waste gas purification mainly involves using RM to treat SO2, NOX, and other acidic gases in industrial tail gas. For instance, Nie et al. utilized supercritical water (SCW) and a leaching agent to deal with and remove SO2 from raw materials of the Bayer method. The results demonstrated that the original sample of RM was maintained at 88.52 ± 0.00068 % at 180 min, indicating a superior desulfurization effect using RM (Nie et al., 2023). In addition to desulfurization or denitration alone, RM can also be used for synchronous desulfurization and denitration of RM. RM is highly alkaline, so it can be used as a highly efficient adsorbent for SO2 and NOX. However, in traditional studies, due to its weak oxidation, oxidants need to be added to enhance its oxidation capacity and improve its desulfurization and denitrification efficiency.
O3 is the most commonly used oxidizing agent, which has high oxidation capacity and reactivity and is widely used in environmental science and engineering fields. The O3 oxidation method is based on the oxidation capacity of O3 molecules. The O3 molecule reacts with the target pollutant, converting it into simpler compounds through oxidation reactions. However, this needs to provide enough energy to produce O3, so higher energy consumption is required. The equipment and operation costs of the O3 oxidation method are high, including O3 generators, reactors, and control systems. Therefore, the key to the application of the O3 oxidation method is to reduce its production cost.
Phosphorus sludge (PS) is a hazardous waste generated by the production of yellow phosphorus in industry, which is a milky colloidal substance (Li et al., 2024; Nie et al., 2020) consisting of three parts: elemental phosphorus, water, and dust impurities (mainly composed of CaO, SiO2, F, Fe2O3, A12O3) (Herzel et al., 2016; Nie et al., 2019). Due to the hydrophilic nature of SiO2 contained in PS, it can adsorb other impurities, resulting in the phosphorus element in PS being wrapped and thus difficult to separate. Researchers have researched the use of monomolecular phosphorus in PS to stimulate O3. However, due to the solid waste properties of PS and the monomolecular phosphorus in PS being wrapped by other impurities and other factors, monomolecular phosphorus in PS can not be efficiently utilized (Li et al., 2024; Li et al., 2021; Liu et al., 2022).
Nonferrous smelting flue gas, the tail gas emitted during the smelting process of nonferrous metals, primarily comprises SO2 and NOX. These components are characteristic of high sulfur flue gases, with SO2 concentrations reaching up to 20 %. Concurrently, the concentration of NOX is lower. If these pollutants are discharged indiscriminately without treatment, they will contaminate the atmospheric environment, posing a threat to human health (Yang et al., 2019; Yao et al., 2020). SO2 and NOX are the primary pollutants contributing to the formation of acid rain. Acid rain can lead to the acidification of rivers, lakes, and berths, disrupting the ecological balance, corroding buildings and other infrastructures, damaging soil structure, and threatening human health. Acid rain has emerged as a significant environmental problem that disrupts the ecological balance and threatens human survival and development. With the increasingly stringent emission standards set by the state and industry, nonferrous smelting flue gas has become a research hotspot. NOX in nonferrous smelting flue gas typically has a low concentration and coexists with a high concentration of SO2. However, its low flue gas temperature makes it difficult to treat using conventional reduction and denitrification techniques (Wang et al., 2012). Therefore, to meet the demand for flue gas desulfurization and denitrification and the need for synergistic control of sulfur and N pollutants in the nonferrous smelting industry, it is necessary to adopt technologies with high flue gas purification efficiency, easy operation, and industrial feasibility (Ding et al., 2014; Wang et al., 2012). Currently, the leading technologies in the field of flue gas desulfurization and denitrification are wet flue gas desulfurization (WFGD) (Córdoba, 2015) and selective catalytic reduction (SCR) (Tang et al., 2024). These technologies are widely used in the actual industry but still have harsh operating conditions, high maintenance costs, and complex operations. In recent years, the oxidation method has become a research hotspot in desulfurization and denitrification. The oxidation method can oxidize NO into high-valence NOX (NO2, N2O5). Currently, the commonly used oxidants mainly include NaClO2 and KMnO4. However, these oxidants will cause MnO4− and ClO− residue, causing pollution to the water. Therefore, O3 is widely used due to its high selectivity, non-pollution, high oxidation efficiency, and no decomposition by-products (Chen et al., 2016; Fu et al., 2016; Wang et al., 2007).
For instance, Wu et al. utilized RM as an absorbent and oxidized it with O3 to eliminate SO2 and NOX. The results demonstrated that the desulfurization efficiency of the RM could reach 93 % within the initial hour, and the denitrification efficiency could be sustained at approximately 87 % under typical practical conditions with an O3/NO molar ratio of 1.1–1.5 (Li et al., 2020). The key to applying O3 oxidation to NO oxidation lies in balancing the cost of O3 preparation and oxidation efficiency and further enhancing the desulfurization and denitrification efficiencies. External field intensification has emerged as the preferred method in numerous studies. External field enhancement involves using US waves, electric fields, magnetic fields, and microwaves to augment the material transfer and reaction in flue gas desulfurization and denitrification. The external field force can stimulate the reaction rate and enhance the mass transfer efficiency, thereby improving the efficiency of desulfurization and denitrification. The influence mechanisms of different external field forces on the desulfurization and denitrification process vary (Li et al., 2016; Zeng et al., 2018). Currently, ultrasonic technology is extensively employed in flue gas desulfurization and denitrification. ultrasonic technology can stimulate the chemical reaction and increase the material transfer rate, thereby enhancing the efficiency of desulfurization and denitrification (Ma et al., 2022). When the ultrasonic propagates in a liquid, small cavities are formed inside the liquid due to the intense vibration of the liquid particles, which rapidly expand and close, resulting in violent collisions between the liquid particles and generating pressures of up to 100 MPa, thus causing ultrasonic cavitation within the liquid (Ja'Fari et al., 2018). Simultaneously, this violent interaction between the particles will cause the temperature of the liquid to rise abruptly and play an excellent stirring role, thus emulsifying two immiscible liquids, accelerating the solute dissolution, and accelerating the chemical reaction (Liu et al., 2018; Sinhmar and Gogate, 2020). The application of the ultrasonic can promote the discovery and understanding of the new mechanism of PS excitation O3 and RM wet desulfurization and denitrification process. The ultrasonic can alter the physical and chemical properties of the liquid phase, which may lead to the formation of new reaction pathways and products and contribute to the in-depth study of desulfurization and denitrification mechanisms.
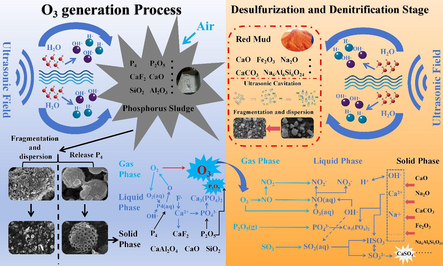
In summary, this study takes solid waste RM and hazardous waste PS as research objects. Under the action of the ultrasonic field, O3 excited by PS and RM slurry are used to purify SO2 and NOX in flue gas synchronously. Moreover, the change of solid phase before and after the reaction of RM and PS was characterized and analyzed, and then the mechanism of O3 generation, desulfurization and denitration, and the strengthening mechanism of ultrasonic were investigated. The effect of the ultrasonic can increase the interaction between reactants and the mass transfer rate so as to improve the O3 concentration and the efficiency of desulfurization and denitrification. This research can provide a new idea and direction for flue gas desulfurization and denitrification technology of non-ferrous smelting, which is of great significance for environmental protection and reducing air pollutant emissions.
2 Materials and methods
2.1 Preparation of materials and analysis system
The RM (Sample picture as shown in Fig. S3 (b)) utilized in this study was sourced from an alumina plant in Wenshan, Yunnan Province. The RM sample underwent drying at 80 °C for 48 h and was ground to 200 mesh (particle size < 74 μm). The PS (Sample picture as shown in Fig. S3 (a)), a hazardous solid waste, was produced during the production of yellow phosphorus at a phosphorus chemical enterprise in Qujing City, Yunnan Province. Typically, PS was placed in Ultrapure water to prevent spontaneous combustion. During the experimental process, the PS was initially used to absorb excess water with filter paper. Throughout the experiment, PS was first absorbed with filter paper to remove excess water and weighed to dry weight for the experiment.
The experimental system comprises four parts: simulated flue gas preparation system, O3 generation system, desulfurization and denitrification system, and analysis system. The schematic diagram of the experimental setup is depicted in Fig. 1. The experimental device of ultrasonic-enhanced phosphorous sludge excitation is shown in Fig. S4 in Supporting Information (SI). In the simulated flue gas preparation system, N2 (99.999 %) and O2 (99.999 %) were procured from Kunming Stoneman Gas Products Co., Ltd; SO2 (1.75 %) and NOX (4997.4 mg/Nm3) were obtained from Kunming Guangreda Gas Products Co., dispersed in a gas mixing tank to meet the experimental requirements (CSO2 = 2000 ppm, CNOX = 250 ppm, flue gas flow rate 400 mL/min). In the O3 generation system, a certain amount of PS was weighed and placed in a four-necked flask containing 200 mL of Ultrapure water and then introduced into an ultrasonic reactor (JLT 400, Shenzhen Jielite Co., Ltd.) for preheating. Simultaneously, anhydrous air was inputted into the four-necked flasks (400 mL/min) to ensure complete contact between the air and the PS slurry, after which the O3-containing gases were condensed and inputted to the subsequent steps of the reaction. In the desulfurization and denitrification system, a certain amount of RM was weighed, placed in a four-necked flask containing 200 mL of Ultrapure water, and introduced into an ultrasonic reactor. The simulated flue gas was inputted into the four-necked flask with the O3-containing gas, which fully reacted with the RM absorbing solution and then transported to the flue gas analysis system. In the analysis system, the inlet and outlet flue gas concentrations were measured using a flue gas analyzer (Ecom-J2KN, RBR Co., Ltd., Germany), the O3 concentration was detected using an ozone detector (GT-1000 Shenzhen Corno Electronic Technology Co., Ltd.), and the pH of the slurry before and after the reaction was tested using a portable pH meter (Ramag PHS-3C, INESA Scientific Instruments Shanghai Co. Ltd.) for testing. A detailed description of the characterization methodology employed in this study and the associated description of the response surface model used can be found in the SI. A comprehensive description of the characterization methods used in this study and a related description of the RSM model used can be found in SI.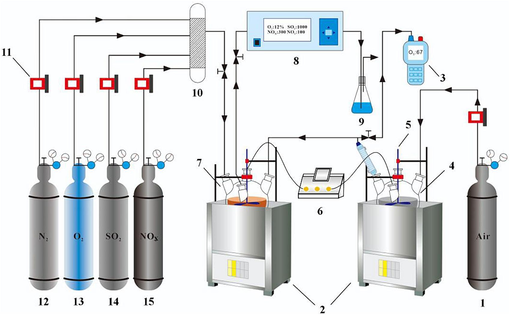
Experimental setup diagram: (1) anhydrous air bottle; (2) ultrasonic reactor; (3) O3 detector; (4) PS slurry bottle; (5) mechanical stirrer; (6) pH meter; (7) RM slurry bottle; (8) flue gas analyser; (9) tail gas absorption bottle; (10) gas mixing tank; (11) gas mass flow meter; (12) N2 gas cylinder; (13) O2 gas cylinder; (14) SO2 gas cylinder; (15) NOX gas cylinder.
2.2 Desulfurization and denitrification calculation
The efficiency of desulfurization and denitrification is calculated based on the inlet and outlet flue gas concentrations and is used as a standard for evaluating the effectiveness of desulfurization and denitrification. The specific calculation formula is shown in Eqs. (1) and (2) (Kuropka, 2008):
2.3 Materials characterization
The detailed characterization procedures of all the sample are described in the SI file.
2.4 Response surface methodology (RSM)
The experimental response surface methodology is described in the SI file.
3 Results and discussion
3.1 Study of ultrasonic-enhanced phosphorus sludge excited O3
The concentration of O3 in the reaction system is crucial for NO oxidation in NOX. The flue gas with a NOX concentration of 250 ppm, in which the NO concentration was approximately 200–220 ppm, was selected as the subject of the study. For gases containing both SO2 and NO, the O3 passed through preferentially oxidized NO (Li et al., 2020; Wang et al., 2020), but not SO2. Therefore, to prevent environmental pollution caused by O3 overflow during subsequent experiments, the molar ratio of O3 to NO during the reaction process was controlled between 0.8:1–1:1 using the single factor experimental method combined with the RSM experimental design method in this study.
Fig. 2 (a–b) illustrates the effect of ultrasonic frequency on the concentration of O3 generation. In this section, the experimental conditions are set to: PS concentration: 40 g/L; ultrasonic frequency: 0, 28, 40 kHz; US power density: 0.4 W/cm2; Stirring intensity: 1000 rpm; Reaction temperature: 50 °C; Air flow: 400 mL/min. Ultrasonic significantly enhances the increase of O3 concentration generated by PS, primarily due to the ultrasonic cavitation and dispersion effects. Ultrasonic waves can increase the specific surface area of PS reactants and the gas–liquid contact area. Simultaneously, the ultrasonic can break down the microscopic agglomerate structure of PS so that the P4 lurking in the PS aggregate can fully contact and react with O2 in the air, improving the utilization rate of the P element in PS (Li et al., 2021). The cavitation effect caused by the ultrasonic can enhance the mass transfer process of chemical reactions on one hand. On the other hand, it can enable the tiny bubbles in the slurry and the medium (such as H2O) at the liquid interface to be heated and decomposed into potent oxidizing free radicals (such as OH·), thus promoting the reaction process between P4 in PS and O2 in the air. The main reactions occurring in the ultrasonic-enhanced O3 generation process in this study are shown in Eqs. (3)–(6) (Li et al., 2021; Liu et al., 2014; Liu et al., 2018; Rooze, 2013):
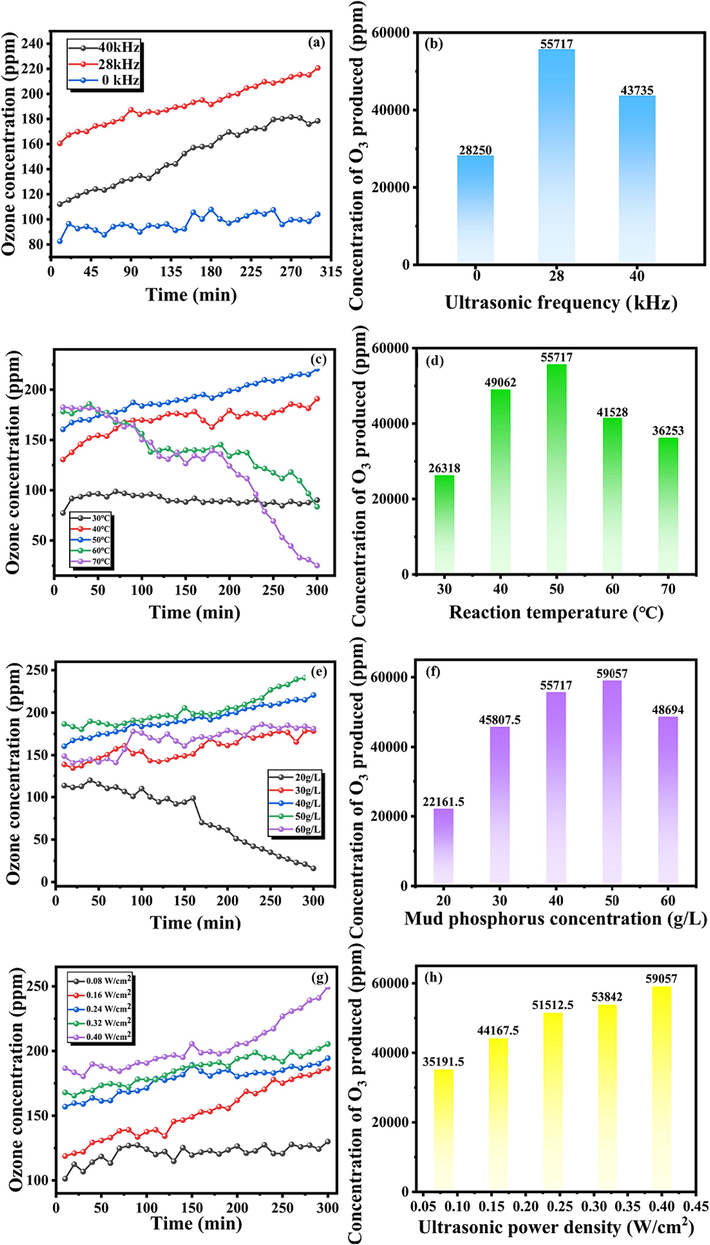
The O3 over time concentration and the total concentration under different conditions of ultrasonic frequency (a–b), Reaction temperature (c–d), PS concentration (e–f) and ultrasonic power density (g–h).
As depicted in Fig. 2(a–b), the utilization of low-frequency ultrasonic (28 kHz) has a more pronounced effect on enhancing the concentration of O3 during the reaction process. However, the O3 concentration does not increase with the rise in the ultrasonic frequency. This is attributed to the fact that at the same ultrasonic power, the ultrasonic cavitation threshold is proportional to the ultrasonic frequency, and an increase in frequency necessitates more power to initiate the cavitation effect, resulting in a decrease in the cavitation intensity. Furthermore, the increase in ultrasonic frequency will also diminish the time required for the expansion and rupture of tiny bubbles in the PS slurry, thus reducing the emulsification and dispersion of ultrasonic to the slurry (Du and Chen, 2021; Wang et al., 2023).
The increase in the reaction temperature is favorable to enhance the chemical reaction and mass transfer process, which escalates the chemical reaction rate and directs the reaction towards O3 production, thus increasing the concentration of O3 (Sahu et al., 2019). Fig. 2(c–d) illustrates that when the reaction temperature is 30–50 °C, the O3 concentration increases with the temperature rise. In this section, the experimental conditions are set to: PS concentration: 40 g/L; ultrasonic frequency: 28 kHz; ultrasonic power density: 0.4 W/cm2; Stirring intensity: 1000 rpm; Reaction temperature: 30, 40, 50, 60, 70 °C; Air flow: 400 mL/min. However, when the reaction temperature escalates to 60–70 °C, the concentration of the O3 gradually decreases. This phenomenon can be explained by the following two aspects: (1) The reaction temperature significantly influences the decomposition rate of O3 in the PS slurry. The lower the temperature, the slower the decomposition rate of O3, and the most stable O3 is when the reaction temperature is close to 0 °C (Li et al., 2020). When the temperature rises to 60 °C or more, accompanied by the ultrasonic cavitation effect on the interior of the slurry resulting in the enhancement of the local thermal effect, the decomposition of O3 accelerates, and continuing to raise the temperature will further increase the decomposition rate of O3. (2) In the process of ultrasonic emulsification, an appropriate increase in the temperature of the reaction system will reduce the surface tension and viscosity of the PS slurry so that the substances in the PS slurry are more evenly dispersed. However, the increasing reaction temperature will also impede the emulsification effect. The increase in reaction temperature will elevate the air pressure inside the tiny bubbles in the PS slurry, resulting in the attenuation of ultrasonic diffusion and the generation of many bubbles. The pressure caused by bubble rupture will decrease, weakening the ultrasonic dispersion effect, which is not conducive to forming an O3 reaction (Udepurkar et al., 2023). Therefore, after exceeding the appropriate temperature for O3 generation, the concentration of O3 generation tended to decrease.
PS concentration directly affects the generation of O3 and reaction rate, as seen in Fig. 2(e–f). In this section, the experimental conditions are set to: PS concentration: 20, 30, 40, 50, 60 g/L; ultrasonic frequency: 28 kHz; ultrasonic power density: 0.4 W/cm2; Stirring intensity: 1000 rpm; Reaction temperature: 50 °C; Air flow: 400 mL/min. At PS concentrations between 20 and 50 g/L, the concentration of O3 increased with time and PS concentration. However, as the PS concentration increased above 60 g/L, the concentration of O3 generation slightly decreased compared to that at 50 g/L. The reason is that the addition of PS can increase not only the content of P4 required in the O3 generation reaction but also other impurities not involved in the O3 generation reaction, such as SiO2. The content of impurities in the PS slurry increases with the increase in the addition of PS, which makes it challenging to release the P4 contained in the PS, hindering the mass transfer process of the O3 generation reaction, thus leading to the decrease in the concentration of O3 generation. Therefore, a reasonable concentration of PS addition can promote the O3 generation reaction, thus generating more O3.
As depicted in Fig. 2(g–h), the trend of O3 generation concentration exhibits a positive correlation with the ultrasonic power density. In this section, the experimental conditions are set to: PS concentration: 50 g/L; ultrasonic frequency: 28 kHz; ultrasonic power density: 0.08, 0.16, 0.24, 0.32, 0.4 W/cm2; Stirring intensity: 1000 rpm; Reaction temperature: 50 °C; Air flow: 400 mL/min. An increase in ultrasonic power density will yield a high energy density and accelerate the collision rate of droplets within the PS slurry, thereby enhancing the turbulence and cavitation of the PS slurry. This, in turn, accelerates the gas–liquid phase mass transfer process of the O3 generation reaction (Zhou et al., 2022). This study demonstrates that power density is one of the principal factors controlling liquid emulsification efficiency. With the escalation of ultrasonic power density, more intense dissolution and dispersion motion occur in the material inside the PS slurry, forming a flow field of high temperature, high pressure, and high turbulence. This stabilizes the emulsification effect inside the PS slurry (Taha et al., 2020). This study investigated the effect of rotational speed on excited O3, and the results are detailed in the SI (Fig. S1).
3.2 Response surface analysis of ultrasonic-enhanced PS excited O3
3.2.1 Factor and level design of response surface analysis
To explore the theoretical implications of various factors in the ultrasonic-enhanced O3 generation process and their interrelated effects on O3 concentration, we selected three factors with significant impacts on O3 concentration based on a single-factor investigation (Khodaei et al., 2016).
From the empirical section of the study in Chapter 3.2, it was observed that the experimental process of temperature (℃), PS concentration (g/L), and power density (W/cm2) were the primary factors impacting the ultrasonic enhancement of PS to generate O3. Consequently, these three experimental conditions were selected for theoretical analysis, experimental design, and optimization. The design outcomes are presented in Table 1: temperature (A): 40, 50, 60 °C; power density (B): 0.24, 0.32, 0.40 W/cm2; PS concentration (C): 30, 40, 50 g/L. Following the guidelines of the three-factor design of the response surface, 17 sets of experiments were conducted in this study. Data were statistically analyzed based on the experimental parameters designed by the response surface design software and in conjunction with the O3 concentration under this condition. The results are presented in Table S1.
Variable level
Temperature (A) °C
Ultrasonic power density (B) W/cm2
Concentration of PS (C) g/L
−1
40
0.24
30
0
50
0.32
40
1
60
0.40
50
3.3 Quadratic regression fitting and variance analysis
Based on the design and results of the response surface experiment in SI, a multiple regression fit analysis of the quadratic model can be derived in Eq. (7):
The design model underwent evaluation and statistical analysis to ascertain the influence of the three selected factors on O3 concentration (ppm) (R1). The results of the Analysis of Variance (ANOVA) for the design model are presented in Table 2. The ANOVA was conducted using the F-test, a statistical method to determine the significance of each variable’s effect in the regression equation on the response value (O3 concentration) (Jia et al., 2020; Tian et al., 2023). The principle of the F-test is as follows: when PProb > F, the corresponding variable’s level of significance increases (P < 0.001, highly extremely significant; P < 0.01, highly significant; P < 0.05, significant; and P > 0.1, not significant) (Wang et al., 2017). Therefore, the ANOVA was conducted using the F-test in this study, and the results are presented in Table 2. As shown in Table 2, the experiments’ results were analyzed using the response surface quadratic variance model, and the model’ s significance level was P < 0.0001, indicating that the model is highly significant and statistically significant (Chen et al., 2012). The significance analysis revealed that the effects of B (power density), C (PS concentration), A2, and B2 on O3 concentration were highly significant, P < 0.0001; the effects of A (temperature) and AC were significant, P < 0.05; the effect of C2 was significant, P < 0.01; and the effects of AB and BC were insignificant, P > 0.1. Furthermore, the larger the F-value, the more significant the effect on the response value; by analyzing each factor’s F-value, it can be seen that FA > FC > FB, indicating that the order of influence of each factor on O3 concentration is reaction temperature > PS concentration > ultrasonic power density (Kumar et al., 2020).
Source
Sum of Squares
df
Mean Square
F-value
P-value Prob>F
Salience
Model
3066.64
9
340.74
87.29
<0.0001
significant
A-Temperature
35.7
1
35.7
239.04
0.0193
B-Ultrasonic power density
933.12
1
933.12
9.15
<0.0001
C-Concentration of PS
727.71
1
727.71
186.42
<0.0001
AB
7.56
1
7.56
1.94
0.2066
AC
22.09
1
22.09
5.66
0.049
BC
4.2
1
4.2
1.08
0.334
A2
838.88
1
838.88
214.9
<0.0001
B2
332.77
1
332.77
85.25
<0.0001
C2
58.11
1
58.11
14.89
0.0062
Residual
27.33
7
3.9
Lack of Fit
2.8
3
0.9325
0.1521
0.9231
not significant
Pure Error
24.53
4
6.13
Cor Total
3093.97
16
C.V.%
1.04
R2
0.9912
R2adj
0.9798
The proportion of the total variance of the responses predicted by the model can also be seen through R2 (in Eq. (8)), which is calculated and expressed as follows, and the results of this calculation are placed in Table 2(Mofidi and Shahhosseini, 2022):
As indicated in Table S1, the model determination coefficient R2 = 0.9912 suggests that the model accounts for 99.12 % of the variability in the experimental data. The model calibration coefficient of determination R2adj = 0.9798 implies that the model explains 97.98 % of the variation in response values. As shown in Table 2, both R2 and R2adj (in Eq. (9)) are proximate to 1, signifying a high degree of consistency between the experimental and predicted results. This consistency validates that the established response surface model can comprehensively explain the designed relevant experiments. The model’s coefficient of variation, C.V% = 1.04 % <10 %, indicates a relatively small experimental error, thus affirming a good fit of the model. This good fit further substantiates that the analysis of the established correlation model is more reliable (Chen et al., 2019).
The juxtaposition of the predicted O3 concentration outcomes and the actual experimental results is depicted in Fig. 3. The experimental results exhibit a linear correlation with the predicted values, and the actual values align with the predicted values within the permissible experimental error. This congruence substantiates the reasonableness of the design model (Urbina-Suarez et al., 2023).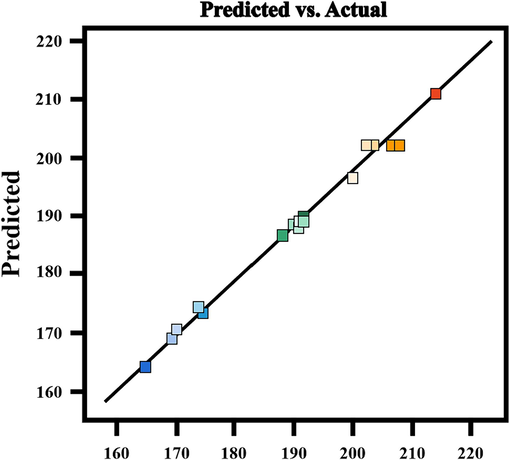
Predicted and experimental values of O3 concentration.
3.3.1 Contour map and three-dimensional (3D) map of response surface analysis
The roles of different influencing factors were further scrutinized, and the interactions between pairs of factors were visually analyzed by plotting observational contour plots and three-dimensional response surfaces. The influence of these factors on O3 concentration can be visualized by observing the color shifts and inclination changes in the contour plots and the three-dimensional response surface. The response surface's apex corresponds to the center point of the most minor ellipse on the contour line. In instances where the contour line assumes an elliptical shape, the stronger the interaction between the two factors, the more pronounced the effect. A contoured shape approximating a circle indicates insignificant interaction between the two factors. The steeper the slope of the three-dimensional response surface, the more significant the interaction between the two factors, and the darker the color, the higher the O3 concentration production rate.
As depicted in Fig. 4, the contours of AB, BC, and AC closely resemble circles, and the inclination angle of the three-dimensional response surface is more pronounced, indicating a significant interaction between A (temperature), B (power density), and C (PS concentration). The results derived from the contour lines and the three-dimensional response surface align with the results of the ANOVA of the quadratic regression equation, thereby validating the reliability of the analysis results (Wei et al., 2019).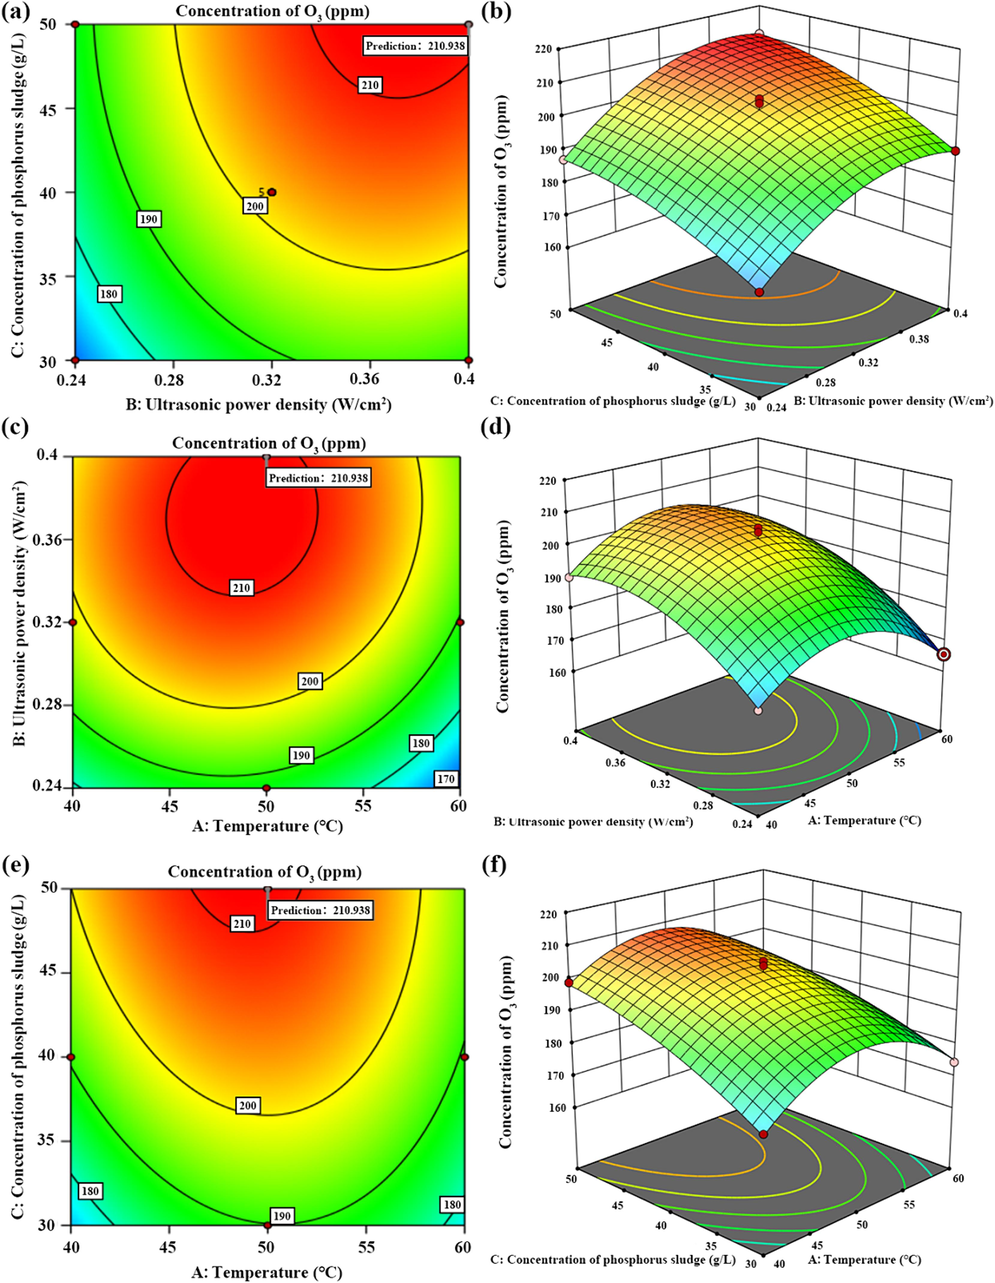
The contour and 3D response surface plots of interaction for O3 concentration of temperature and power density (a–b), power density and PS concentration (c–d), temperature and PS concentration (e–f).
3.3.2 Optimal conditions and validation
The factor analysis of the Box Behnken Design (BBD) model, as implemented in the Design Expert 13 Trial, was employed to predict the optimal values for each reaction condition and the O3 concentration. As demonstrated in Table 3, the O3 concentration of 210.938 ppm closely aligns with the predicted value, thereby validating the accuracy of the predictions under the optimized conditions. Based on the BBD model, the optimized experimental conditions were determined: reaction temperature (A) = 53.226 °C, power density (B) = 0.4 W/cm2, and PS concentration C = 51.433 g/L. Under these conditions, the O3 concentration was able to reach 218.764 ppm. The proximity of the actual value to the predicted value indicates the accuracy of the predicted value under the optimized experimental conditions.
Constraints
-
Lower
Upper
Lower
Upper
Name
Goal
Limit
Limit
Weight
Weight
Importance
A
is in range
0.24
0.40
1
1
3
B
is in range
30
50
1
1
3
C
is in range
40
60
1
1
3
R1
Target
200
220
1
1
3
Solutions
Number
A
B
C
R1
Desirability
1
53.226
0.40
51.433
218.764
1.000
Selected
We made a Pareto chart (Fig. S6) for the three factors studied combined with the relevant results of response surface analysis. In this chart, the most important factors affecting O3 concentration can be quickly identified by ranking them from the greatest to the smallest. There are three parts in the diagram: temperature, power density, and PS concentration. Each part is represented by a column, the height of which represents the influence of the factor. In this graph, temperature has the highest bar, indicating that it is the factor that has the greatest influence. The curve in the figure represents the percentage of cumulative influence, and usually this curve is used to represent the percentage of the total influence that has been covered when accumulated to a factor. Two percentage points are plotted on the chart, the first being 50.00 %, located to the right of the power density bar, indicating that the two factors of temperature and power density alone account for half of the total effect. The second point, 73.08 %, is located to the right of the PS concentration column, indicating that the combined effect of these three factors reaches about 73 % of the total effect. From the analysis of this Pareto chart, it can be seen that temperature is the most critical influencing factor, and the control of temperature should be prioritized if the overall results are to be improved. Power density is also an important influencing factor, while PS concentration has a certain effect, but not as significant as the first two. By focusing on improving these key factors, it can improve overall performance more effectively. The result of Pareto diagram is consistent with the result of response surface analysis, which also verifies the accuracy of response surface analysis.
3.4 Performance of O3 coupled red mud for desulfurization and denitrification
First of all, this research conducted a blank experiment research. This research conducted relevant experiments on desulfurization and denitrification of only ultrasonic + RM and desulfurization and denitrification of only ultrasonic + PS, and the results are shown in Fig. S7. As can be seen from ultrasonic + RM desulfurization and denitrification (Fig. S7(a)), adding RM under ultrasonic conditions for desulfurization and denitrification has basically no effect on denitrification. For desulfurization, the desulphurization effect can be maintained above 90 % in the first 200 min of the reaction, but the desulphurization efficiency decreases significantly after 200 min. The desulphurization efficiency is only 47.8 %, and the desulphurization effect is not good. As can be seen from ultrasonic + PS desulfurization and denitrification (Fig. S7(b)), when PS is added under ultrasonic conditions for desulfurization and denitrification, the denitrification efficiency can be maintained above 90 % only in the first 80 min of the reaction, and after 240 min to 480 min, the denitrification efficiency is basically maintained at about 60 % and no longer changes significantly. For the desulphurization reaction, the desulphurization efficiency is maintained above 90 % only in the first 180 min, and the desulphurization efficiency decreases continuously after 180 min, and the desulphurization efficiency is basically maintained at about 52 % when 360 min–480 min. To sum up, the desulfurization and denitrification effect of RM or PS alone is not good, so follow-up experiments are conducted.
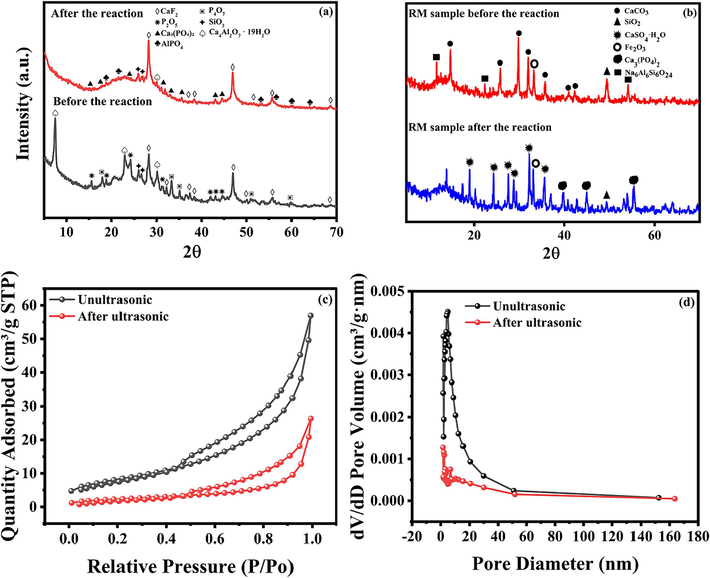
Based on the optimal O3 excitation concentration explored in Chapter 3.4, we investigated the impact of ultrasonic frequency on NOX and SO2 removal. The experiment was conducted at three commonly used ultrasonic frequencies of 28, 40, and 60 kHz and under conditions without ultrasonic. The results are presented in Fig. 5(a–b). In this section, the experimental conditions are set to: Stirring intensity: 1000 rpm; ultrasonic power density: 0.4 W/cm2; RM concentration: 15 g/L; Reaction temperature: 50 °C; Flue gas flow rate:400 mL/min;SO2 inlet concentration:2000 ppm; NOX inlet concentration:250 ppm; ultrasonic frequency: 0, 28, 40, 60 kHz. The desulfurization efficiency demonstrates that the removal efficiency of SO2 is significantly enhanced by the two lower ultrasonic frequencies, 28 kHz and 40 kHz, compared to the 0 kHz and 60 kHz ultrasonic frequencies. The removal rate of SO2 can be sustained at over 95 % for 250 min. This is attributed to the high solubility of SO2 in water, which facilitates its reaction with the alkaline components in the RM slurry (Eqs. (10)–(11) and Eqs. (13)–(15)) (Nie et al., 2023). Therefore, the ultrasonic enhancement on the RM desulfurization process is primarily physical. The free radicals generated by the ultrasonic play a specific auxiliary role in the RM desulfurization process (Eq. (12). Low-frequency ultrasonic waves can generate large bubbles in the RM slurry, and these bubbles have a more extended expansion and contraction period. The robust movement of bubbles in the liquid can better dissolve the flue gas components in the RM slurry and accelerate the reaction mass transfer process, thereby improving the efficiency of the desulfurization reaction. As seen in Fig. 5(b), the ultrasonic frequency has a minimal influence on denitrification efficiency because the primary influencing factor of the NOX removal effect is the oxidant O3. In this study, O3 is derived from the PS-generated O3 stage, and the molar ratio of O3/NO is controlled at approximately 1:1 by the RSM method in this procedure. Therefore, during the denitrification reaction, O3 can oxidize NO to high-valent NOX, such as NO2 and NO3, and simultaneously generate a large amount of acid. The central role of the RM slurry in NOX removal is to provide an alkaline environment and act as a pH buffer to maintain stable and efficient NOX removal efficiency (Eqs. (16)–(17)) (Liu et al., 2022).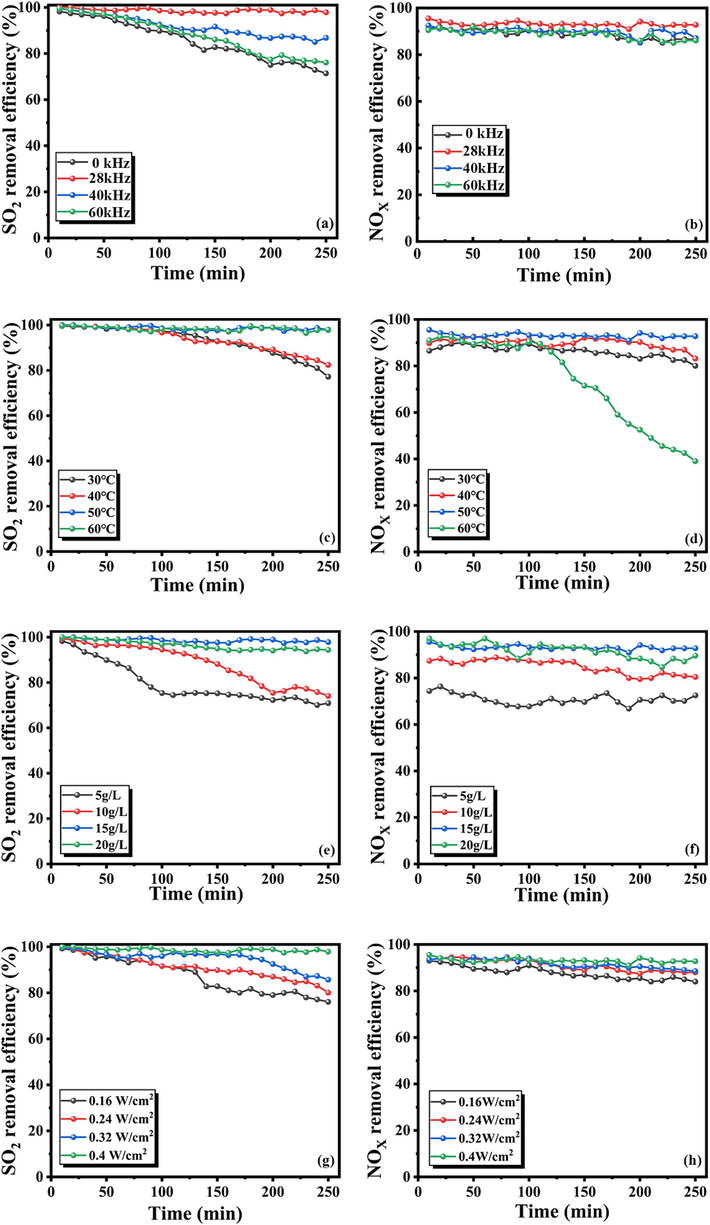
The performance of desulfurization and denitrification under different conditions for ultrasonic frequency (a–b), Reaction temperature (c–d), RM concentration (e–f) and ultrasonic power density(g–h).
Additionally, the ultrasonic has a specific promotional effect on the denitrification process of RM slurry (Patil and Raut-Jadhav, 2022; Zhang et al., 2022). The free radical (OH·) generated by the ultrasonic cavitation effect also plays an auxiliary role in NO oxidation. This is also why the denitrification effect of RM at 28 kHz is slightly higher than other conditions; the removal efficiency of NOX can be maintained at more than 90 % for 250 min (Eq. (18)).
As depicted in Fig. 5(c–d), an increase in reaction temperature facilitates the removal of SO2. In this section, the experimental conditions are set to: Stirring intensity: 1000 rpm; ultrasonic power density: 0.4 W/cm2; RM concentration: 15 g/L; Reaction temperature: 30, 40, 50, 60 °C; Flue gas flow rate: 400 mL/min; SO2 inlet concentration: 2000 ppm; NOx inlet concentration: 250 ppm; ultrasonic frequency: 28 kHz. This is attributed to the fact that a rise in reaction temperature enhances the gas–liquid-solid mass transfer process of the reaction system, thereby accelerating the rate of chemical reaction and promoting the reaction towards SO2 absorption. When the reaction temperature exceeds 50 °C, the desulfurization efficiency can be sustained above 95 % for 250 min. Fig. 5(d) illustrates that within the temperature range of 40–50 °C, the oxidation removal efficiency of NOX remains above 85 % for 250 min, and the denitrification efficiency at 30 °C is marginally lower than that at 40–50 °C. This validates that an increase in temperature can enhance the chemical reaction rate of NOX absorption by the RM slurry to a certain extent, thereby improving the removal efficiency of NOX. However, when the temperature rose to 60 °C, the NOX removal efficiency rapidly declined after 100 min. This is due to the gradual decomposition of O3 with rising temperature, leading to a decrease in NO oxidation and NOX removal efficiency (Zhang et al., 2023).
As seen in Fig. 5(e–f), an increase in RM concentration benefits the SO2 absorption reaction. In this section, the experimental conditions are set to: Stirring intensity: 1000 rpm; ultrasonic power density: 0.4 W/cm2; RM concentration: 5, 10, 15, 20 g/L; Reaction temperature: 50 °C; Flue gas flow rate: 400 mL/min; SO2 inlet concentration: 2000 ppm; NOx inlet concentration: 250 ppm; ultrasonic frequency: 28 kHz. The desulfurization efficiency significantly increases when the concentration of RM slurry is between 5 and 15 g/L. This is because an increase in the addition of RM implies that more alkaline components come into contact with the acidic flue gas and react, thereby enhancing the overall desulfurization efficiency of the reaction system. However, when the concentration of RM increased from 15 g/L to 20 g/L, the impurities in the RM slurry that were not involved in the reaction gradually increased due to the increase in the addition of RM, which hindered the mass transfer process of the reaction and led to a slight decrease in the desulfurization efficiency. In the denitrification process, a low concentration of RM cannot provide sufficient alkaline substances and pH buffer function for the nitrogen oxide absorption process, resulting in a low NOX removal efficiency. The experimental results show that when the concentration of RM is increased to 15 g/L, the denitrification efficiency can be maintained above 85 % for 250 min. Therefore, the optimal concentration of 15 g/L RM is selected in this study (Bang and Kang, 2022).
Based on previous studies, it is known that ultrasonic power density is one of the critical parameters for the generation and intensity of ultrasonic cavitation. In this study, the effect of ultrasonic power density on the removal efficiency of SO2 and NO at four intensity gradients was investigated, and the results are shown in Fig. 5(g–h). In this section, the experimental conditions are set to: Stirring intensity: 1000 rpm; ultrasonic power density: 0.16, 0.24, 0.32, 0.4 W/cm2; RM concentration: 15 g/L; Reaction temperature: 50 °C; Flue gas flow rate: 400 mL/min; SO2 inlet concentration: 2000 ppm; NOx inlet concentration: 250 ppm; ultrasonic frequency: 28 kHz. It can be observed that the removal efficiency of SO2 increases with the increase in ultrasonic power density. The removal efficiency of SO2 can be stabilized at more than 98 % when the power density is increased to 0.4 W/cm2. This is because the ultrasonic cavitation and emulsification effects increase with the power increase under the same ultrasonic frequency. The higher ultrasonic power density can better break the local inhomogeneity in the liquid phase of the RM slurry, promote the mixing and dispersion of reactants, and then promote the reaction mass transfer process to enhance the desulfurization effect of the reaction system. Since O3 dominates the NO oxidation process, the denitrification effect under different power densities can be maintained at more than 80 % within 250 min. The high ultrasonic power density will bring more intense ultrasonic cavitation and produce more vital oxidant free radicals, which have a specific enhancement effect on NO oxidation, thus improving the removal effect of NOX (Li et al., 2022).
4 Mechanism analysis
4.1 Structure and composition of materials
Fig. 6(a) depicts the XRD patterns of RM samples pre- and post-reaction. The initial RM predominantly consists of calcite (CaCO3), hematite (Fe2O3), and Na6Al6Si6O24, manifesting as stable minerals. A dissolution equilibrium is observed during the desulfurization and denitrification process, providing an optimal alkaline environment for the reaction system to attain stable and efficient desulfurization and denitrification performance. Post-reaction, the phase products primarily comprise desulfurization gypsum (CaSO4·H2O). It is speculated that the reaction related to Eq. (19) occurs. At 38°, the corresponding peak is Ca3(PO4)2, and this change is due to the occurrence of the Eq. (23). During the O3 generation stage, P2O5 dissolves in water to form PO43−, which reacts with Ca2+ in water to yield Ca3(PO4)2.
(a)XRD comparison of PS before and after reaction; (b)XRD comparison of RM before and after reaction; (c)N2 adsorption/desorption isotherms of ultrasonic and unultrasonic RM; (d)Barrett-Joyner-Halendar (BJH) pore size distribution ofultrasonicated and unultrasonicated RM.
A comparison of the XRD patterns of the PS samples pre- and post-reaction, as presented in Fig. 6, reveals that the primary components of the PS pre-reaction are P2O5, CaF2, SiO2, and P4O7. In contrast, the main constituents of the PS post-reaction are Ca3(PO4)2, CaF2, CaAl2O4·19H2O, SiO2, and AlPO4. In Fig. 6(a), the peaks corresponding to 37° and 50° mainly represent CaF2, and the intensity of the peaks increases after the reaction. A notable observation from comparing the PS pre- and post-reaction XRD patterns is the disappearance of the P2O5 peaks post-reaction. This is attributed to the dissolution of P2O5 in water during the reaction process, leading to the formation of phosphate post-reaction, as delineated in Eq. (20) (Li et al., 2024).
Secondly, it is observed that a significant quantity of CaAl2O4·19H2O transforms into Ca3(PO4)2 post-reaction, while a substantial amount of AlPO4 is generated, likely due to the reaction as outlined in Eqs. (21)–(26) (Duan et al., 2023). It is evident that CaAl2O4·19H2O initially produces a minor quantity of AlO2− via hydrolysis, which is further hydrolyzed to yield OH−. This OH− is neutralized with the H+ generated from the dissolution of P2O5 in water, resulting in the formation of H2O. Throughout the reaction process, the large quantity of P2O5 dissolved in water leads to the generation of H+ far exceeding the quantity of OH−, rendering the overall reaction environment acidic (Liu et al., 2022). The enhancement of the CaF2 peak is attributed to the presence of fluorine in the PS form, which is bifurcated into F− and CaF2. The presence of Ca2+ in the PS slurry and the dissolution of soluble fluorine in the reaction generate a new CaF2, making the CaF2 peak more prominent post-reaction.
The BET results are presented in Table 4 and Fig. 6(c–d). The pore size, pore volume, and specific surface area of the original and post-ultrasonic treatment RM samples were analyzed and evaluated. It is discernible that ultrasonic treatment enhances the specific surface area, pore diameter, and pore volume, thereby improving the surface properties of RM (Li et al., 2022). As depicted in Fig. 6(c), the N2 adsorption and desorption isotherms of the RM, both pre- and post-reaction, exhibit Type IV adsorption curves, all characterized by double hydroxide structures and H3-type hysteresis loops (López et al., 2011). This outcome indicates that the RM, both pre-and post-ultrasonic treatment, possesses mesoporous material characteristics, albeit with irregular results. The hysteresis loops of the RM, both pre-and post-ultrasonic treatment, appear at a relative pressure of P/P0, approximately 0.50, signifying the existence of micro and mesopores in the RM structure (Deihimi et al., 2018).
Material
Specific surface area m2·g−1
Confusion m3·g−1
Average pore size nm
Raw RM
18.023
0.048
2.136
RM (after ultrasonic)
20.145
0.059
3.327
Regarding the pore size distribution of the RM, both pre-and post-ultrasonic treatment, as shown in Fig. 6(c–d), it is observed that the particle size of the RM pre-sonication is primarily concentrated in the 10–20 nm range, while post-ultrasonic treatment, it is predominantly concentrated in the 0–10 nm range. This suggests that ultrasonic treatment can effectively reduce the particle size of RM, thereby exposing a larger specific surface area and more active sites. Concurrently, the BET results also confirm that the RM is primarily mesoporous, with the presence of mesoporous and microporous structures, indicating that the material possesses a multilevel pore structure post-ultrasonication. This structure could provide more binding sites conducive to the adsorption of NOX and SO2, thereby demonstrating that ultrasonic treatment can endow the RM with a more robust structural foundation for desulfurization and denitrification (Li et al., 2024).
Table 5 presents the XRF compositions of PS in its original state and after undergoing reactions under various conditions. As can be observed from Table 5, elements such as O, F, Na, Mg, Al, Si, P, K, Ca, and Fe primarily exist in the PS both pre- and post-reaction. Compared with the original PS samples, the content of P elements is reduced post-reaction, attributable to the generation of O3 by P during the reaction process. Furthermore, Ca and Al decompose along with CaAl2O4·19H2O to form AlO4−, Ca3(PO4)2, and CaF2 (Li et al., 2024). The XRF results of the original RM sample pre- and post-reaction are displayed in Table 6. Table 6 reveals that O, Na, Al, Si, S, P, Ca, and Fe dominate the original RM samples. A comparison of the RM samples post-reaction with the original RM samples indicates a significant decrease in the content of Na, Al, and Si elements. This could be due to the large-scale consumption of the chemical binding base of the free base, composed of the elements above, during the reaction (Liu et al., 2022). The notable increase in the content of O and S elements may be ascribed to the absorption of NOX and SO2 flue gas by the slurry during the reaction. The increase in the content of P element is due to the formation of Ca3(PO4)2 by partial P2O5 in the flue gas containing O3, which results in the detection of P in the solid phase post-reaction (Li et al., 2024; Liu et al., 2023).
PS
O
F
Na
Mg
Al
Si
P
K
Ca
Fe
Other
Before the reaction
31.08
10.13
0.39
1.22
1.95
16.44
12.98
3.89
11.16
0.51
10.76
After the reaction
(0 W/cm2)38.57
10.73
0
0.95
2.31
18.37
6.16
2.16
11.65
0.51
9.1
After the reaction
(0.4 W/cm2)39.56
10.40
0
0.84
2.28
20.75
4.94
2.35
11.52
0.54
7.36
Material
O
Na
Al
Si
S
P
Ca
Fe
Other
Raw RM (pH = 10.50)
32.03
4.95
8.81
9.72
0.22
0.18
13.43
21.54
30.66
RM after the reaction (pH = 2.58)
34.78
1.81
6.32
5.25
7.69
5.43
13.02
20.83
25.7
In order to further study the removal mechanism of SO2 and NOX, XPS analysis of RM samples before and after desulfurization and denitrification was carried out. The XPS full spectrum of the sample before and after the reaction is shown in Fig. 7(a–b), the percentage content of each element in the full spectrum is shown in Table S6, and the XPS spectrum of Ca 2p is shown in Fig. 7(a). As can be seen from the full spectrum of XPS (Fig. 7(a)), the characteristic peaks of Fe, Al, Si, O, Ca, and Na were detected in the untreated RM samples. After the reaction, the peaks of Fe 2p and Si 2p were weakened, while Na 1 s was not detected, which indicates that the free base and chemically bound base in the RM were consumed and decomposed during the reaction, which is consistent with the results of XRD. We carried out peak fitting of Ca 2p (Fig. 7(b)), and it can be seen that the binding energies corresponding to Ca 2p before and after the reaction are 347.2 eV and 347.5 eV respectively, which belong to the Ca-containing alkaline components (CaCO3, etc.) and desulfurization gypsum (CaSO4·2H2O) in RM, respectively. These results indicate that the alkaline components are converted to CaSO4·2H2O after the reaction, consistent with the XRD results.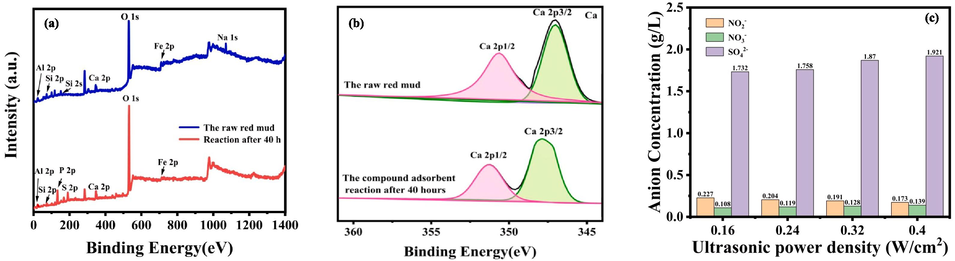
(a) Full Xps spectrum of absorbent sample before and after reaction; (b) XPS spectra of Ca 2p in RM before and after desulfurization and denitrification; (c) Anion concentration in absorption solution under different ultrasonic power density conditions.
IC is used for testing to explore the concentration of anions in the absorption solution after the reaction. Under different ultrasonic power density conditions, the sample was pretreated: first, the sample was filtered by centrifugation, and then the supernatant was taken and reserved. In the detection process, the sample is diluted 50 times according to the concentration of the standard line, and then the type and concentration of anions in the absorption solution are determined. Three parallel tests were performed on each sample. Fig. 7(c) shows the measured results.
It can be observed from Fig. 7(c) that the concentrations of NO3− and SO42− both increase with the increase of ultrasonic power density, but the concentration of NO2− decreases with the increase of ultrasonic power density, and its concentration decreases from 0.227 g/L to 0.173 g/L-1. NO3− concentration increased from 0.108 g/L to 0.139 g/L because with the increase of ultrasonic power density, more hydroxyl radicals were generated in the system, which promoted the reaction and made more NO absorbed by oxidation, which was conducive to the transformation of NO2− to NO3−, resulting in the reduction of NO2− concentration. The concentration of SO42− increased from 1.732 g/L to 1.921 g/L, indicating that when the ultrasonic power density increased, the physicochemical effect caused by it made the absorption reaction of SO2 proceed forward, and more SO2 was absorbed (Liu et al., 2022).
The change in fluorine content of PS samples before and after the reaction of ultrasonic-induced PS to produce O3 was compared in the leaching experiment. The main reason is that ultrasonic-induced PS to produce O3 may lead to fluoride conversion. By comparison, the effects of ultrasound on fluoride can be better understood, and the chemical reactions and substance transfer processes that may occur during the reaction can be inferred. The fluorine content in PS is related to the risk of environmental pollution. By comparing the fluorine content in PS before and after the reaction, we can further judge whether there will be a potential environmental pollution risk.
Leaching experiment procedure: A certain amount of PS before and after the reaction was placed in a 100 mL polyethylene serum bottle, and a certain amount of ultra-pure water was added and placed in a constant temperature oscillation chamber. Three parallel samples were set after oscillating at 250 rpm at room temperature for some time. At the corresponding time, 3 mL of samples were taken and filtered with a 0.45 μm organic filter membrane. After that, the fluoride content in the filtrate was determined by HJ 999–2018, “Determination of Fluorine in Solid Waste by alkali fusion - ion selective Electrode Method,” and the content was determined by ion chromatography. Then, it was compared with the national standard GB 5085.6–2007 “Identification standard of hazardous waste Toxic substance content Identification” to determine whether the fluorine ion content in PS after reaction met the relevant standards.
The PS samples before and after the ultrasound-induced PS-produced O3 reaction were levered, and the results are listed in Table S7. It can be found that the F− leaching content of PS can reach 446.78 mg/L before O3 excitation, and the F− ion concentration drops to 133.65 mg/L after ultrasound excitation PS to produce O3, which may be because P4 is released in the ultrasonic process of PS, exposing more active sites. There is a large amount of Ca2+ in the active site, and F− reacts, as shown in Eq. (25), to combine and generate CaF precipitation, thereby reducing the content of F− in it. However, the national standard GB 5085–2007 stipulates that the limit of inorganic fluoride in the leaching solution is 100 mg/L (Xu et al., 2021). In this study, the F− content in the PS leaching solution before the reaction exceeds the standard by 346.786 mg/L, while the F− content in the PS after the reaction decreases and is lower than the limit and meets the standard requirements. The results indicated that the fluoride-leaching toxicity of PS did not exceed the standard.
Organic element analysis was performed on the RM before and after the desulfurization and denitrification reaction, and the results are listed in Table S8. In combination with RM’s XRF before and after the reaction (Table 6), it can be found that the RM after desulfurization and denitrification is rich in P, S, K, and N elements (Liu, 2021). P element can make plants grow better and promote germ differentiation; K element can make plants have the ability to resist lodging, but also can make plant roots thrive and have the ability to resist insects, diseases, and drought. The S element can promote plant growth and chlorophyll synthesis and make plants thrive. N element can promote plant height, leaf number, root length, biomass, and other agronomic traits and has an essential effect on plant growth. It can be found that the RM, after desulphurization and denitrification, has relevant nutrient elements necessary for plant growth. The coordinated desulfurization and denitrification of RM with O3 stimulated by ultrasound can effectively transform SO2 and NOX into S and N elements required for plant growth. This provides a corresponding theoretical basis for the soil utilization of RM after desulphurization and denitrification.
4.2 Morphology analysis
SEM characterization was conducted on the original PS sample, the PS reaction sample without ultrasonic, and the PS reaction sample under ultrasonic conditions of 28 kHz, 0.4 W/cm2. The surface morphology of the PS, both pre- and post-reaction, was observed and analyzed. Selected areas of the surface layer of the PS samples were subjected to spot-scanning via the EDS analytical method. Fig. 8(a–d) displays the SEM images of the original PS sample, revealing that the PS primarily comprises a variety of spherical and massive agglomerated structures, bound together by numerous spherical and porous granular structures of varying sizes, with an amorphous granular agglomerate of impurities adhering to the P element. Fig. 8(b–e) presents the samples post-O3 production from PS under non-ultrasonic conditions, indicating no significant change in the micro-morphology of PS pre- and post-reaction. Fig. 8(c) and Fig. 8(f) depict the PS samples under ultrasonic conditions. As shown in Fig. 8(c), introducing ultrasonic waves disrupts the original agglomerate structure, enhances the dispersion of PS particles, and provides a larger reaction area for PS and air, thereby promoting the O3 generation reaction. Upon increasing the magnification to 20 K, it was discovered that the membrane-like material on the surface of the porous spherical particles within the PS had disappeared, as shown in Table S2 (EDS). Post-EDS spot-scanning test on the site, it was found that the content of elemental P in the area had significantly decreased from 7.40 wt% to 1.80 wt%, further substantiating that the introduction of the ultrasonic external field could facilitate the release of more latent P4 within the PS, and enhance the utilization of the P element in PS. As can be inferred from Fig. S2(a), the microstructure of the ultrasonic-treated RM desulfurization samples was more loosely packed, and the desulphurized gypsum (CaSO4) was fragmented into fine particles by the ultrasonic under the magnification of 2 K, 20 K. According to prior studies, one of the primary reasons for the gradual decrease in desulfurization efficiency of the RM wet desulfurization process is the extensive deposition of desulfurization product CaSO4 blocking the pores of RM and reducing the pore size between particles (Mohal et al., 2023). The surface of the RM cannot adsorb more foreign substances, leading to a rapid decrease in the rate of desulfurization and denitrification. The introduction of the ultrasonic external field can break and disperse the generated CaSO4 crystals and increase the reaction contact area between RM and flue gas, which is one of the main reasons for maintaining high desulfurization efficiency under the action of the ultrasonic external field.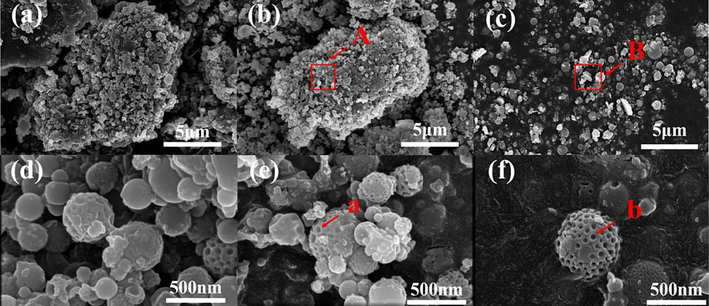
SEM image of PS under different conditions: (a) 20 K scanning electron microscope image of PS raw sample; (b) 20 K scanning electron micrograph of PS without ultrasonic; (c) 20 K scanning electron micrograph of PS under ultrasonic; (d) 2 K scanning electron micrograph of PS raw sample; (e) 2 K scanning electron micrograph of PS without ultrasonic;(f) 2 K scanning electron micrograph of PS under ultrasonic.
4.3 Free radical of materials surface analysis
EPR characterization was performed on the original RM samples and the RM samples that reacted under varying ultrasonic power densities to elucidate the reaction mechanism and analyze the impact of ultrasonic on the reaction. The results are presented in Fig. 9. The critical radical OH· was captured utilizing EPR spectroscopy in conjunction with DMPO. As depicted in Fig. 9, the EPR spectroscopy successfully captured the radical signals under different ultrasonic power densities. The measured ultrafine splitting constants (aN = 15.4 G and aN = 14.8 G) align with the relevant literature, suggesting the production of OH· (Liu et al., 2018; Nie et al., 2021). The EPR test results suggest that OH· is produced during ultrasonic treatment, with the highest OH· intensity observed when the power density was 0.40 W/cm2. This indicates that the ultrasonic can promote OH· production, and the OH· intensity becomes more vigorous as the power density increases (Li et al., 2023; Tian et al., 2022).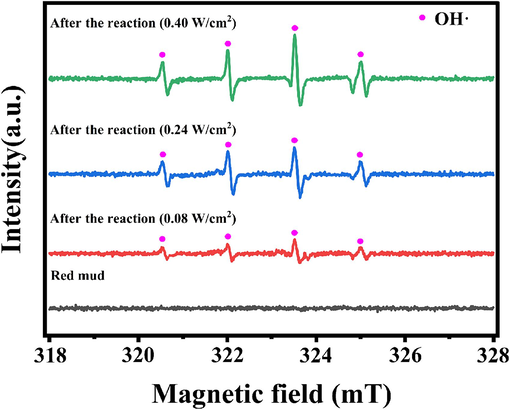
EPR results of original RM samples and RM samples treatment under different power densities.
4.4 Adsorption kinetics model
This study used Pseudo-first-order and pseudo-second-order kinetic models and Weber-Morris internal diffusion models to study the adsorption of NOX and SO2 in flue gas by ultrasonic enhanced RM, and corresponding kinetic models were established. The adsorption mechanism of NOX and SO2 by ultrasonic enhanced RM was explored through model fitting analysis. 4 g of RM was added to the absorption solution, and the absorption was enhanced by ultrasound. The initial concentration of NOX was 625.0 mg/m3, and the initial concentration of SO2 was 5235.17 mg/m3. Pseudo-first-order and Pseudo-second-order kinetic equations and Weber-Morris internal diffusion models were used to fit and analyze the adsorption equilibrium data. The results are shown in Fig. 10(a–b), and the relevant parameters are shown in Table 7.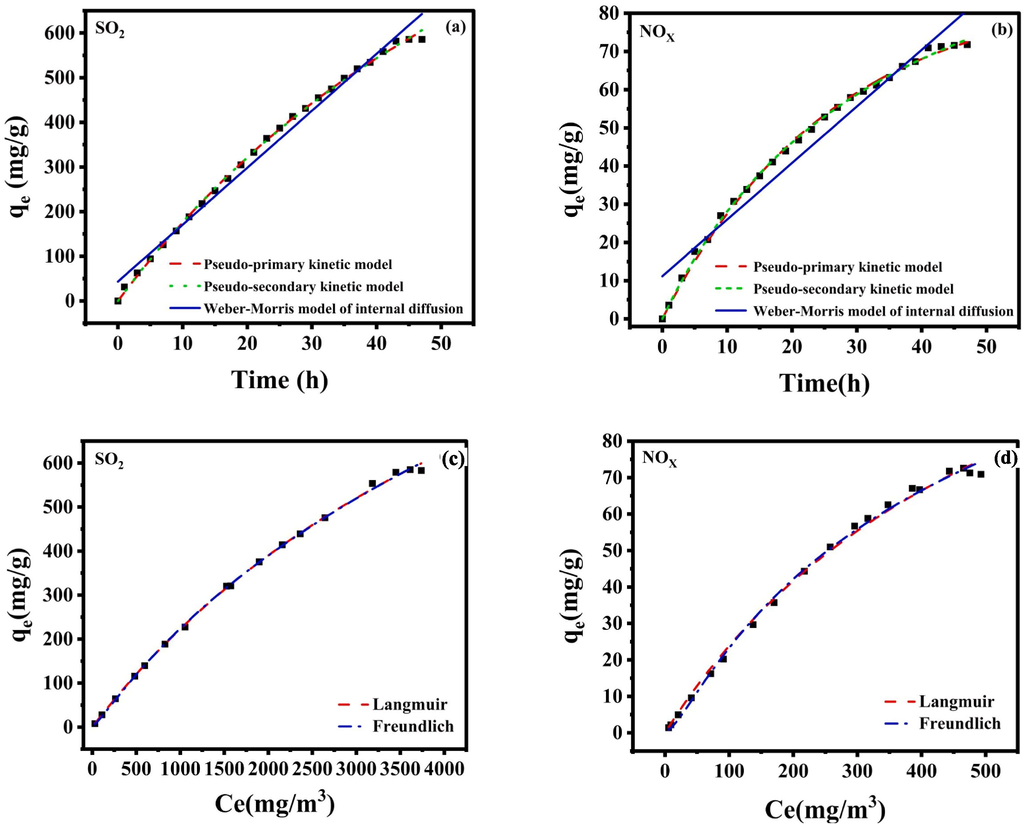
Adsorption kinetics fitting of (a)SO2 and (b)NOX by RM; Ultrasonic enhanced isotherm model fitting for (c)SO2 and (d)NOX adsorption by RM.
Adsorption kinetics model
Correlation parameter
NOX
SO2
Pseudo-first-order
K1 (min−1)
0.0379
0.0185
Qe (mg·g−1)
87.109
841.85
R2
0.99770
0.99891
Pseudo-Second-order
K2 (g·mg−1·min−1)
2.151 × 10⁻⁴
6.272 × 10⁻⁶
Qe (mg·g−1)
120.185
768.85
R2
0.99853
0.99877
Weber-Morris
Kp (g·mg−1·min−1/2)
2.9631
25.510
R2
0.95086
0.98573
As can be seen from the fitting curve of adsorption kinetics (Fig. 10(a–b)), when the adsorption time is prolonged, the adsorption capacity of NOX and SO2 by ultrasonic enhanced RM also increases gradually. When the reaction reaches 45 h, the adsorption equilibrium state is basically reached, and the saturated adsorption capacity of NOX is 71.80 mg/g, and the saturated adsorption capacity of SO2 is 585.82 mg/g. It can also be seen from Table 7 that the determination coefficients R2 of adsorption of NOX and SO2 by the Pseudo-first-order kinetic model are 0.99770 and 0.99891. The determination coefficients R2 of adsorption of R2 and SO2 by the Pseudo-second-order kinetic model are 0.99853 and 0.99877. In the Weber-Morris internal diffusion model, the determination coefficients R2 for adsorption of NOX and SO2 are 0.95086 and 0.98573. The correlation coefficients R2 of the above three models are all greater than 0.93, indicating that the kinetic models adopted can better describe the whole process of adsorption in this study, and there are physical, chemical adsorption and internal diffusion processes in the adsorption process (Sun et al., 2021). However, the theoretical adsorption quantity fitted in the Weber-Morris internal diffusion model differs greatly from the actual value, and the correlation coefficient R2 is lower than that of the Pseudo-first-order kinetic model, indicating that internal diffusion is not the main step to control adsorption in this study (Ma et al., 2011). The theoretical adsorption capacity of the Pseudo-first-order and Pseudo-second-order kinetic models is closer to the actual value, and the correlation coefficient is R2 > 0.99, indicating that both primary and secondary levels can well explain the adsorption behavior of NOX and SO2 by ultrasonic enhanced RM. External and external diffusion can play a certain role, the adsorption process is mainly chemical and physical adsorption, and the alkaline substances in the RM play a leading role. Through ultrasonic strengthening, more free alkali and bound alkali in the RM can react with NOX and SO2, and the specific surface area of the RM can be increased after ultrasound. It is conducive to the physical adsorption of NOX and SO2 (Wang and Zhong, 2016). At the same time, in this experiment, a higher concentration of SO2 is also conducive to the adsorption reaction, because the sulfate substances generated by SO2 and the alkaline substances in the RM can increase the adsorption site on the surface of the adsorbent, providing a relevant driving force for the external diffusion reaction.
4.5 Adsorption isotherm model analysis
Langmuir and Freundlich's adsorption isotherm models were used to explore further the adsorption data of ultrasound-enhanced RM on SO2 and NOX. The adsorption isotherm model was established to explore the adsorption principle of ultrasound-enhanced RM on SO2 and NOX. Langmuir's adsorption isotherm model assumes that the adsorption process is carried out at homogeneous adsorption sites, and there is no interaction between adsorption sites and adsorbed material molecules (Yi et al., 2018) The Langmuir model is suitable for monolayer adsorption and is more suitable for highly uniform adsorption sites with no interaction. The Freundlich adsorption model assumes that the adsorption is carried out at heterogeneous adsorption sites, that there are interactions between adsorption sites, and that there are interactions between adsorbent molecules in the adsorption layer. The Freundlich model is suitable for multilayer adsorption and is more suitable for the interaction between heterogeneous adsorption sites and adsorbent molecules (Gaudino et al., 2016). The Langmuir and Freundlich adsorption isothermal models fitted by ultrasonic-enhanced RM are shown in Fig. 10(c–d), and the fitting parameters are shown in Table 8.
Adsorbed substance
Langmiur
Freundlich
Qm(mg/g)
K1
R2
KF
n
R2
NOX
74.305
0.0017
0.9963
94.925
4.8622
0.9968
SO2
565.07
1.66 × 10⁻⁴
0.9981
834.09
4.8867
0.9989
As seen from Table 8, the correlation coefficients R2 of adsorption of NOX and SO2 by ultrasonic enhanced RM fitted by Langmuir adsorption isotherm model are 0.9963 and 0.9981, respectively. The correlation coefficients R2 of adsorption of NOX and SO2 by ultrasonic enhanced RM fitted by Freundlich adsorption isotherm model are 0.9968 and 0.9989, respectively, indicating that the adsorption of NOX and SO2 by ultrasonic enhanced RM is more in line with the Freundlich adsorption isotherm model, and the adsorption is multi-layer adsorption (Gaudino et al., 2016).
Moreover, the n value fitted by the Freundlich adsorption isotherm model was within the range of 0.1 < 1/n < 0.5, indicating that the adsorption reaction was relatively easy to carry out, and the reaction corresponded to the heterogeneous surface due to the complex composition of the RM. Combined with the adsorption kinetics model, it can be found that the co-action of chemisorption, physical adsorption and internal diffusion model mainly causes the influence of ultrasonic enhanced RM adsorption. In contrast, the Langmuir adsorption isothermal model can explore the maximum adsorption capacity under the optimal theoretical conditions. The theoretical maximum adsorption capacities of NOX and SO2 fitted by Langmuir adsorption isothermal model are 74.30 mg/g and 5565.07 mg/g, which are close to the actual values in the experiment, indicating that the actual values in the experiment are credible (Huang et al., 2020 & Nie et al., 2020).
The desulphurization performance of this study was compared with that of the same type of research, and the results are shown in Table S5. It can be seen that the desulphurization and denitrification effect in this study is better, and the adsorption capacity is higher than that found in other studies. Such differences may be due to the strong interaction between O3 and related free radicals with SO2 and NOX generated by ultrasonic excitation of PS production, resulting in strong adsorption force to improve the adsorption capacity, and this study can be maintained for a longer time under high desulphurization and denitrification efficiency. And the produced byproducts are less, which also shows that the effect of this study is better, and the RM and PS can be used as resources without secondary pollution.
4.6 Analysis of adsorption thermodynamic parameters
The thermodynamic parameters of the adsorption process were evaluated, including the change of Gibbs free energy (ΔG), entropy (ΔS) and enthalpy (ΔH). The Van't Hoff diagram of ultrasound-enhanced adsorption of NOX and SO2 by RM was drawn using the temperature experimental data, and the fitting equations were shown in Eqs. (S1)–(S2), as shown in Fig. S5. The equation can calculate the thermodynamic parameters of the adsorption process. Tables S3 and S4 shows the results. It can be seen from the figure that ΔG increases negatively with the increase of temperature, which proves that the increase of temperature leads to the increase of mobility of NOX and SO2 molecules, indicating that adsorption is a spontaneous process (Han and Chen, 2016). The positive value of ΔS indicates that the adsorption has a high randomness, and the internal structure of the adsorption increases randomly, indicating the feasibility of the adsorption, and the driving force of the adsorption of NOX and SO2 under the action of ultrasonic enhancement of RM is due to the entropy effect (Sedaghat et al., 2019). ΔH0 < 0, indicating that the absorption of NOX by ultrasonic-enhanced RM is an exothermic reaction, and higher temperature is not conducive to improving the absorption effect of ultrasonic-enhanced RM on NOX. ΔH0 > 0 indicates that the absorption of SO2 by ultrasonic-enhanced RM is an endothermic reaction (Sedaghat et al., 2019).
4.7 Penetration curve fitting
In order to study the effect of pH value on the removal efficiency of sulfur nitrate pollutants in ultrasonic-enhanced RM desulfurization and denitrification, a penetration curve experiment was carried out. The control test conditions are: stirring intensity 1000 rpm; Ultrasonic power density 0.4 W/cm2; RM concentration: 15 g/L; Reaction temperature: 50 °C; Flue gas flow rate: 400 mL/min; SO2 import concentration: 2000 ppm; NOX import concentration: 250 ppm; Ultrasonic frequency: 28 kHz. The influence of pH value changing over time on NOX and SO2 simultaneous removal efficiency was investigated, as shown in Fig. 11(c).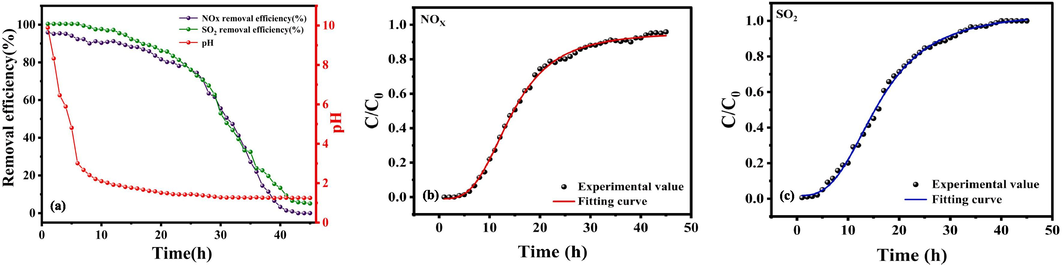
(a)The effect of pH value variations on NOX and SO2 removal efficiency with time extension; Ultrasonic enhancement of adsorption penetration fitting curve of (b)NOX and (c)SO2 in RM.
According to the results in Fig. 11(a), the pH value of the RM slurry presents a certain change with the extension of reaction time. At first, the pH drops sharply, then stabilizes and slowly declines. At the same time, the simultaneous removal efficiency of NOX and SO2 showed an “anti-S” -type declining trend. In the range of 0–25 h, the removal efficiency slowly decreased, and in the range of 25–40 h, the removal rate dropped sharply and then stabilized. The reaction process can be divided into two stages according to the change in pH value. The first stage occurs within the first 10 h of the reaction, with a sharp drop in pH, from an initial value of 9.89 directly to 2.10. At this stage, the desulfurization and denitrification efficiency is stable and can be maintained at more than 95 %. This rapid drop in pH value is due to the hydrolysis of SO2 to SO32−, HSO3− and H+, and the dissolution of NOX to NO2−, NO3− and H+. P2O5 produced in the O3 phase stimulated by ultrasonic enhanced PS dissolved in water to produce PO43− and H+. At this time, the free alkali substance present in the RM slurry can neutralize the generated H+, resulting in a sharp drop in pH value. The second stage occurs when the pH value drops from 2.10 to 1.26, a slow and steady decline. At this stage, the desulfurization rate dropped from 98.24 % to 0.56 % and the denitrification rate from 90.34 % to 0.91 %. This is due to the decomposition of chemically bound bases in the RM (including hydrocalcite, calcite and calcite nepheline), so the pH value of the RM slurry is reduced. In summary, in the process of ultrasonic enhanced desulfurization and denitrification of RM, the change in pH value impacts the removal efficiency of sulfur nitrate pollutants. An efficient desulfurization and denitrification process can be achieved by controlling the reaction time and pH value.
The logistic model was used to fit the adsorption penetration curve, as shown in Fig. 11(b–c), and the fitting parameters are shown in Table 9. In the early stage of adsorption, the outlet concentration is 0, but with the progress of the reaction, the mass transfer zone changes and gradually moves upward, while the outlet concentration also increases. However, when the outlet concentration increases to a certain level, the growth rate becomes slow, which indicates that this adsorption process belongs to fixed bed adsorption. When the penetration curve tends to be flat, the fixed bed adsorption reaches the saturation saturation adsorption state, and the mass transfer zone moves to the top of the fixed bed. Moreover, it can be seen from Table 9 that the correlation coefficients R2 obtained from the fitting curves of the adsorption penetration of NOX and SO2 by ultrasonic enhanced RM are 0.99849 and 0.99809, indicating that the fitting degree is good and the fitting regression equation is reliable. This formula can also be applied in actual industry.
Adsorbed substance
A1
A2
T0
P
R2
NOX
0.00622
0.95909
14.2756
3.2922
0.99849
SO2
0.01782
1.05019
15.9628
3.0323
0.99809
4.8 Reaction mechanism
Based on the experimental results and pertinent characterization analysis, the process of ultrasonic-enhanced PS-generating O3 and ultrasonic-enhanced RM desulfurization and denitrification can be summarized as follows: (1) ultrasonic-enhanced PS excited O3 process: The application of an ultrasonic external field can liberate more latent P4 in the PS, augment the dispersion degree of PS reactants, thereby facilitating better contact and reaction between O2 in the air and P4 in PS. P4 reacts with O2 to form P2O5 and releases active oxygen, which can oxidize O2 to O3. The hydroxyl radical (OH·) generated by ultrasonic cavitation can oxidize water-soluble O2 to hydroperoxyl radical (HO2·) and active oxygen, which has a specific promotional effect on the O3 formation process. After P2O5 is dissolved in water, PO43− is formed. Acidic substances can neutralize the alkaline components in PS and release Ca2+ and Al3+, forming Ca3(PO4)2 and AlPO4. Simultaneously, Ca2+ can combine with soluble F to form stable CaF2. (2) ultrasonic-enhanced RM desulfurization and denitrification process: The O3 and the OH· introduced by ultrasonic cavitation can oxidize NO in the flue gas to water-soluble NOX. Concurrently, P2O5 from the O3 formation stage generates PO43− after being dissolved in water, and SO2 generates SO32− after being dissolved in water, which induces more soluble free alkali (sodium base) and calcite to decompose in RM slurry, neutralizing the acidic substances in the reaction system. The final product of the reaction is primarily CaSO4. At the same time, introducing the ultrasonic wave will crush and disperse the agglomerated CaSO4, enabling the reaction system to maintain a high efficiency of desulfurization and denitrification. According to the principles above and the test results, the potential reaction mechanism is roughly inferred, as depicted in Fig. 12.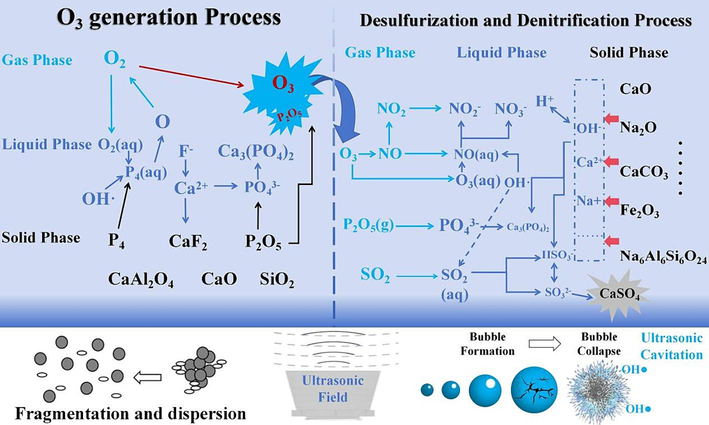
Reaction mechanism diagram.
5 Conclusion
This study primarily utilized ultrasonic-enhanced PS generating O3 in synergy with RM to eliminate SO2 and NOX from non-ferrous smelting flue gas. Initially, the effects of individual factors in the O3 generation process by ultrasonic-enhanced PS were investigated, and RSM optimized the pertinent process parameters. The optimal conditions for O3 generation were determined to be a temperature of 53.226 °C, an ultrasonic power density of 0.4 W/cm2, a PS concentration of 51.433 g/L, and a ultrasonic frequency of 28 kHz. Under these conditions, the optimal reaction conditions for ultrasonic-enhanced RM desulfurization and denitrification were explored. The results indicate that under the best conditions, the removal efficiency of SO2 and NOX can be maintained above 95 % and 90 %, respectively, within 250 min. Based on the experimental results and characterization tests such as XRD, BET, EPR, SEM, it was demonstrated that the use of the ultrasonic external field exerts physical and chemical enhancement effects on both O3 generation and desulphurization and denitrification processes, and the ultrasonic enhancement mechanism and reaction mechanism were postulated. This study employed hazardous solid waste (PS) in combination with ultrasonic enhancement to replace the conventional O3 generator and a bulk solid waste (RM) as the flue gas absorbent. This study offers a novel method for the resourceful utilization of RM and PS and the efficient removal of non-ferrous smelting flue gas, which holds specific practical value. However, the applicability of this technology under more complex conditions still necessitates further exploration.
6 Consent for publication
All authors are informed and agree to the study.
CRediT authorship contribution statement
Hengxi Zhu: Formal analysis, Writing – original draft. Jiamin Qi: Supervision, Writing – review & editing. Nan Shi: Methodology, Investigation. Shuai Liu: Methodology, Investigation. Bin Li: Supervision, Resources, Writing – review & editing. Jin Zhang: Conceptualization, Data curation.
Acknowledgment
This study was financially supported by the National Natural Science Foundation of China [52060010].
References
- Recycling red mud to develop a competitive desulfurization flux for Kanbara Reactor (KR) desulfurization process. J. Hazard. Mater.. 2022;440:129752
- [CrossRef] [Google Scholar]
- SNCR De-NOx within a moderate temperature range using urea-spiked hydrazine hydrate as reductant. Chemosphere. 2016;161:208-218.
- [CrossRef] [Google Scholar]
- Optimizing conditions for preparation of MNOX/RHA catalyst particle for the catalytic oxidation of NO. Adv. Powder Technol.. 2012;23:256-263.
- [CrossRef] [Google Scholar]
- Recycling of paper sludge powder for achieving sustainable and energy-saving building materials. Constr. Build. Mater.. 2019;229:116874
- [CrossRef] [Google Scholar]
- Status of flue gas desulphurisation (FGD) systems from coal-fired power plants: overview of the physic-chemical control processes of wet limestone FGDs. Fuel. 2015;144:274-286.
- [CrossRef] [Google Scholar]
- Characterization studies of red mud modification processes as adsorbent for enhancing ferricyanide removal. J. Environ. Manage.. 2018;206:266-275.
- [CrossRef] [Google Scholar]
- Simultaneous removal of NOX and SO2 from coal-fired flue gas by catalytic oxidation-removal process with H2O2. Chem. Eng. J.. 2014;243:176-182.
- [CrossRef] [Google Scholar]
- Cavitation dynamics and flow aggressiveness in ultrasonic cavitation erosion. Int. J. Mech. Sci.. 2021;204:106545
- [CrossRef] [Google Scholar]
- Study on the influence mechanism of flue gas desulphurisation gypsum on solid waste-based geopolymer grouting materials. Constr. Build. Mater.. 2023;403:133137
- [Google Scholar]
- Mechanism study on the adsorption and reactions of NH3, NO, and O2 on the CaO surface in the SNCR deNOX process. Chem. Eng. J.. 2016;285:137-143.
- [CrossRef] [Google Scholar]
- Fuel desulfurization/denitrification via adsorption or extraction: a complementary approach to oxidative treatments. Energy Sources Part A. 2016;38(15):2290-2298.
- [CrossRef] [Google Scholar]
- Han, X., Chen, X., 2016. Thermodynamics analysis of integrated process for simultaneous desulfurization and denitrification with manganese dioxide. In: Int. Conf. Transp. Environ., Proc. (ICCTE 2016). doi: 10.2991/iccte-16.2016.182.
- Sewage sludge ash — a promising secondary phosphorus source for fertilizer production. Sci. Total Environ.. 2016;542:1136-1143.
- [CrossRef] [Google Scholar]
- Interaction among the simultaneous removal of SO2, NO and Hg0 by electrochemical catalysis in K2S2O8. Fuel. 2020;260:116323
- [CrossRef] [Google Scholar]
- Ultrasound-assisted oxidative desulfurization and denitrogenation of liquid hydrocarbon fuels: a critical review. Ultrason. Sonochem.. 2018;40:955-968.
- [CrossRef] [Google Scholar]
- Removal of SO2 and NOX from flue gas using mud-phosphorus slurry. Environ. Sci. Pollut. Res.. 2020;27:23270-23280.
- [CrossRef] [Google Scholar]
- Optimization of ultrasound-assisted oxidative desulfurization of high sulfur kerosene using response surface methodology (RSM) Clean Techn. Environ. Policy. 2016;18:2677-2689.
- [CrossRef] [Google Scholar]
- Application of response surface methodology to absorptive separation of SO2 from its mixture with air using marble waste. Chem. Eng. Commun.. 2020;207:458-473.
- [CrossRef] [Google Scholar]
- Simultaneous desulphfurisation and denitrification of flue gases. Environ. Prot. Eng.. 2008;34:187-195.
- [CrossRef] [Google Scholar]
- Simultaneous removal of NO and SO2 by Fe(II)/peracetic acid oxidation system: operating conditions, removal efficiency and removal mechanism. Fuel. 2023;342:127793
- [CrossRef] [Google Scholar]
- Simultaneous removal of SO2 and NO using a novel method with red mud as absorbent combined with O3 oxidation. J. Hazard. Mater.. 2020;392:122270
- [CrossRef] [Google Scholar]
- O3 oxidation excited by yellow phosphorus emulsion coupling with red mud absorption for denitration. J. Hazard. Mater.. 2021;403:123971
- [CrossRef] [Google Scholar]
- Comparison of the effects of ultrasonic and ball milling on red mud desulfurization. Metals. 2022;12:1887
- [CrossRef] [Google Scholar]
- Enhanced NOX absorption in flue gas by wet oxidation of red mud and phosphorus sludge. J. Hazard. Mater.. 2024;465:133075
- [CrossRef] [Google Scholar]
- Hydrothermal liquefaction of typical livestock manures in China: biocrude oil production and migration of heavy metals. J. Anal. Appl. Pyrol.. 2018;135:133-140.
- [CrossRef] [Google Scholar]
- Recent advances in catalytic decomposition of ozone. J. Environ. Sci.. 2020;94:14-31.
- [CrossRef] [Google Scholar]
- Study on the performance of simultaneous desulfurization and denitrification of Fe3O4-TiO2 composites. Chem. Eng. J.. 2016;304:89-97.
- [CrossRef] [Google Scholar]
- Leaching of arsenic from flue gas desulphurisation gypsum using ultrasound-enhanced sulfuric acid. J. Clean. Prod.. 2022;381:135163
- [CrossRef] [Google Scholar]
- Preparation of Potassium Humate and Functional Carbon Materials and Their Properties for Supercapacitors by Organic Solid Waste Regulation. Xinjiang: Xinjiang Agricultural University; 2021.
- Sodium ascorbate as additive in red mud slurry for simultaneous desulfurization and denitrification: insights into the multiple influence factors and reaction mechanism. Chemosphere 2022135663
- [CrossRef] [Google Scholar]
- Simultaneous absorption of SO2 and NO from flue gas using ultrasound/Fe2+/heat coactivated persulfate system. J. Hazard. Mater.. 2018;342:326-334.
- [CrossRef] [Google Scholar]
- Novel method for high-performance simultaneous removal of NO and SO2 by coupling yellow phosphorus emulsion with red mud. Chem. Eng. J.. 2022;428:131991
- [CrossRef] [Google Scholar]
- The roles of red mud as desulfurization and denitrification in flue gas: a review. J. Environ. Chem. Eng.. 2023;11:109770
- [CrossRef] [Google Scholar]
- The influence of air content in water on ultrasonic cavitation field. Ultrason. Sonochem.. 2014;2:566-571.
- [CrossRef] [Google Scholar]
- Catalytic pyrolysis of plastic wastes with two different types of catalysts: ZSM-5 zeolite and Red Mud. Appl. Catal. B. 2011;104:211-219.
- [CrossRef] [Google Scholar]
- Simultaneous desulfurization and denitrification of flue gas enabled by hydrojet cyclone. J. Clean. Prod.. 2022;377:134205
- [CrossRef] [Google Scholar]
- Kinetic study on desulfurization and denitrification using microwave irradiation over activated carbon. Sci. China Technol. Sci.. 2011;54(9):2321-2326.
- [CrossRef] [Google Scholar]
- Ultrasound assisted oxidative desulfurization of a model fuel using a deep eutectic solvent: optimization and experimental design. Chem. Eng. Process.. 2022;171:108274
- [CrossRef] [Google Scholar]
- Ultrasonic pulse velocity of recycled polymer concrete composites. Mater. Today:. Proc. 2023
- [CrossRef] [Google Scholar]
- An efficient and environmentally friendly process for the reduction of SO2 by using waste phosphate mine tailings as adsorbent. J. Hazard. Mater. 2019121748
- [CrossRef] [Google Scholar]
- Catalytic effect of Mn2+, Fe3+ and Mg2+ ions on desulfurization using phosphate rock slurry as absorbent. Chem. Eng. J. 2020124568
- [CrossRef] [Google Scholar]
- Mutual promotion effect of SO2 and NOX during yellow phosphorus and phosphate rock slurry adsorption process. AIChE J. 2021;67
- [CrossRef] [Google Scholar]
- Red mud with enhanced dealkalization performance by supercritical water technology for efficient SO2 capture. J. Environ. Manage.. 2023;344:118469
- [CrossRef] [Google Scholar]
- Trends in research on characterization, treatment and valorization of hazardous red mud: a systematic review. J. Environ. Manage.. 2024;351:119660
- [CrossRef] [Google Scholar]
- Intensification of degradation of acetamiprid by the combination of ultrasonic cavitation with other advanced oxidation processes (AOPs) J. Indian Chem. Soc.. 2022;99:100353
- [CrossRef] [Google Scholar]
- Dissolved gas and ultrasonic cavitation – a review. Ultrason. Sonochem.. 2013;1:1-11.
- [CrossRef] [Google Scholar]
- Modified thorium oxide polyaniline core-shell nanocomposite and its application for the efficient removal of Cr(VI) J. Chem. Eng. Data. 2019;64:1294-1304.
- [CrossRef] [Google Scholar]
- Model fuel deep desulfurization using modified 3D graphenic adsorbents: isotherm, kinetic, and thermodynamic study. Ind. Eng. Chem. Res.. 2019;58(24):10341-10351.
- [CrossRef] [Google Scholar]
- Ultrasound assisted oxidative deep-desulfurization of dimethyl disulphide from turpentine. Ultrason. Sonochem.. 2020;63:104925
- [CrossRef] [Google Scholar]
- Study on photocatalytic desulfurization and denitrification performance of Cu- and Cr-modified MWCNT. Processes. 2021;9(10):1823
- [CrossRef] [Google Scholar]
- Ultrasonic emulsification: an overview on the preparation of different emulsifiersstabilized emulsions. Trends Food Sci. Technol. 2020
- [CrossRef] [Google Scholar]
- Recent advances in heavy metal poisoning mechanism and regeneration methods of selective catalytic reduction (SCR) denitration catalyst. Fuel. 2024;355:129429
- [CrossRef] [Google Scholar]
- Performance on desulfurization and denitrification of one-step produced activated carbon for purification of sintering flue gas. J. Environ. Manage.. 2023;323:116281
- [CrossRef] [Google Scholar]
- Integrated strategy for efficient simultaneous desulfurization and denitrification of flue gas and high value conversion of sulfur and nitrogen resources. J. Hazard. Mater.. 2022;440:129827
- [CrossRef] [Google Scholar]
- Emulsification mechanism in an ultrasonic microreactor: influence of surface roughness and ultrasound frequency. Ultrason. Sonochem.. 2023;94:106323
- [CrossRef] [Google Scholar]
- Using the response surface methodology to treat tannery wastewater with the bicarbonate-peroxide system. ChemEngineering. 2023;62
- [CrossRef] [Google Scholar]
- Combining ozone and ultrasound technology to remove S2− in Bayer liquor. Ultrason. Sonochem.. 2023;101:106684
- [CrossRef] [Google Scholar]
- Optimization of wet denitration by dual oxidant (H2O2/S2O82−) advanced oxidation process. Fuel Process. Technol.. 2017;156:82-89.
- [CrossRef] [Google Scholar]
- Simultaneous desulfurization and denitrification of flue gas by pre-ozonation combined with ammonia absorption. Chin. J. Chem. Eng.. 2020;28:2457-2466.
- [CrossRef] [Google Scholar]
- Effect of additive agents on the simultaneous absorption of NO2 and SO2 in the calcium sulfite slurry. Energy Fuels. 2012;26:5583-5589.
- [CrossRef] [Google Scholar]
- Simultaneous desulfurization and denitrification of sintering flue gas via composite absorbent. Chin. J. Chem. Eng.. 2016;24(8):1104-1111.
- [CrossRef] [Google Scholar]
- Simultaneous removal of NOX, SO2 and hg in nitrogen flow in a narrow reactor by ozone injection: experimental results. Fuel Process. Technol.. 2007;88:817-823.
- [CrossRef] [Google Scholar]
- Iron extraction from red mud using roasting with sodium salt. Miner. Process Extr. Metall. Rev.. 2021;42:153-161.
- [CrossRef] [Google Scholar]
- Optimization of the co-digestion of sewage sludge, maize straw and cow manure: microbial responses and effect of fractional organic characteristics. Sci. Rep.. 2019;9
- [CrossRef] [Google Scholar]
- Properties of red mud blended magnesium phosphate cements: workability and microstructure evolution. Constr. Build. Mater.. 2023;409:134023
- [CrossRef] [Google Scholar]
- Fingerprint characteristics and toxicity analysis of solid waste in China's aluminum smelting industry. Res. Environ. Sci.. 2021;34(9):2248-2255.
- [CrossRef] [Google Scholar]
- Highly stable activated carbon composite material to selectively capture gas-phase elemental mercury from smelting flue gas: copper polysulfide modification. Chem. Eng. J.. 2019;358:1235-1242.
- [CrossRef] [Google Scholar]
- Dissociation mechanism of particulate matter containing arsenic and lead in smelting flue gas by pyrite. J. Clean. Prod.. 2020;259:120875
- [CrossRef] [Google Scholar]
- Simultaneous desulfurization and denitrification on the SAPO-34@Al2O3 core-shell structure adsorbent. Energy Fuel. 2018;32(11):11694-11700.
- [CrossRef] [Google Scholar]
- The study of simultaneous desulfurization and denitrification process based on the key parameters. Process Biochem.. 2018;70:144-152.
- [CrossRef] [Google Scholar]
- Simultaneous oxidation of SO2 and NOX via hydrox radicals using ozone-cavitation-absorption system. Water Air Soil Pollut.. 2023;234:165.
- [CrossRef] [Google Scholar]
- Process intensification of the ozone-liquid mass transfer in ultrasonic cavitation-rotational flow interaction coupled-field: optimization and application. J. Environ. Manage.. 2022;310:114710
- [CrossRef] [Google Scholar]
- Co-pyrolysis of biomass with Red Mud: an efficient approach to improving bio-oil quality and resourceful utilization of the iron in Red Mud. Fuel. 2024;355:129482
- [CrossRef] [Google Scholar]
- Facile synthesis of mesoporous ZSM-5 aided by sonication and its application for VOCs capture. Ultrason. Sonochem.. 2022;88:106098
- [CrossRef] [Google Scholar]
Appendix A
Supplementary material
Supplementary data to this article can be found online at https://doi.org/10.1016/j.arabjc.2024.105728.
Appendix A
Supplementary material
The following are the Supplementary data to this article:Supplementary data 1
Supplementary data 1


