

Translate this page into:
Cellulose nanocrystals isolated from sugarcane bagasse using the formic/peroxyformic acid process: Structural, chemical, and thermal properties
⁎Corresponding author at: Faculty of Materials Science and Technology, University of Science, VNU–HCM, 700000, Viet Nam. vnan@hcmus.edu.vn (An Nang Vu)
-
Received: ,
Accepted: ,
This article was originally published by Elsevier and was migrated to Scientific Scholar after the change of Publisher.
Abstract
Sugarcane bagasse (SCB) is a renewable biomass source for cellulose extraction. In the pretreatment, SCB is processed to break down the cellulose-lignin-hemicellulose matrix and isolate components. This work proposes a formic/peroxyformic acid process for extracting cellulose nanocrystals (CNCs) from SCB. Fourier transform infrared spectroscopy (FTIR), Raman spectroscopy, and solid-state 13C nuclear magnetic resonance (ss- 13C NMR) were employed to evidence the removal of wax, hemicellulose, and lignin from the raw SCB. X-ray diffraction (XRD), scanning electron microscopy (SEM), transmission electron microscopy (TEM), and thermogravimetric analysis (TGA) were used for analyzing crystallinity, morphology, and thermal properties. SEM results showed that after lignin removal, the size of purified cellulose fibrils decreased significantly, and the structure of cellulose microfibers became smoother and more apparent. After acid hydrolysis of bleached cellulose microfibers, XRD analysis showed CNCs had the highest crystallinity (70.8 %). In TEM images, rod-like structures of CNCs were measured to be 23 ± 2.7 nm wide and 610 ± 18 nm long. The eco-friendly formic/peroxyformic acid procedure with a chlorine-free bleaching stage produced a white, cellulose-rich solid powder of CNCs.
Keywords
Cellulose nanocrystals
Cellulose microfibers
Formic/peroxyformic acid process
Sugarcane bagasse

1 Introduction
Cellulose, a highly prevalent macromolecular polymer in the natural world, has captured the interest of both academia and industry for many years because of its abundant supply and exceptional characteristics. This polysaccharide is created by linking D-glucose molecules by β (1–4) glycosidic bonds, forming a linear biopolymer (Ventura-Cruz and Tecante, 2021). It has many applications in industries such as paper manufacture, textile, construction, food, cosmetics, and more (Seta et al., 2020; Perumal et al., 2022a). Thanks to the progress in nanotechnology, researchers have been focusing on cellulose as a promising study area, particularly nanocellulose. Nanocellulose can be derived from various biomass sources, including wood pulp, industrial and agricultural wastes, fungi, algae, bacteria, and more. Cellulose nanocrystals (CNCs) are a form of nanocellulose characterized by their small size, typically less than 100 nm. These particles can have various shapes, such as needle-like, rod-like, or whisker-shaped (Kallel et al., 2016a). CNCs show great potential in various fields thanks to their impressive mechanical properties, strong Young's modulus, adjustable surface, liquid crystal tendency, and compatibility with living organisms. These include food and cosmetic enhancements, water purification technology, biomedical engineering, and composite materials (Gan and Chow, 2021; Leite et al., 2021; Zhang et al., 2021). High aspect ratio, high crystallinity, and the stability of CNCs suspensions are crucial properties for their application in nanocomposites (Vanderfleet and Cranston, 2021; Zhang et al., 2022).
Sugarcane bagasse (SCB) is a secondary bioresource produced during sugar-making. Two hundred and seventy tons of bagasse are produced for every one thousand tons of processed sugarcane (Elias et al., 2017; Saratale et al., 2018). In 2015, approximately 1.81 billion tons of sugarcane were produced globally; by 2024, this number is projected to exceed 2.21 billion tons (Chandel et al., 2012; Elias et al., 2017). Fifty percent of SCB is possibly used for energy generation, while the remainder is unused. In Vietnam, SCB is commonly regarded as a low-value substance utilized primarily for agricultural, fertilizer, animal fodder, and combustion fuels by-products. This by-product is usually disposed of by burning it in the fields, which leads to air pollution, the release of greenhouse gases, and negative effects on respiratory health (Thiangtham et al., 2019). Over the past few years, a strong focus has been on creating valuable products from SCB. Sugarcane has the highest cellulose content compared to other natural sources such as durian (33 %) (Penjumras et al., 2015), bamboo sugar (41 %) (Yu et al., 2012; Nguyen et al., 2013), and rice husk (35 %) (Lu and Hsieh, 2012). Meanwhile, the non-cellulosic materials in SCB consist of hemicellulose, lignin, ash content, and wax, with compositions of 33.8 %, 18.1 %, 2.3 %, and 0.8 %, respectively (Sun et al., 2004). Since sugarcane is not woody, it often has less lignin than wood. This characteristic has various benefits, including fewer processing stages and a less rigorous bleaching process for cellulose. (Krishnan et al., 2010; Siró and Plackett, 2010). Extracting CNCs from SCB is more straightforward than wood due to the looser organization of cellulose microfibrils in the primary cell of agricultural fibers compared to the secondary wall of wood. The fibrillation process to generate CNCs from SCB consumes significantly less energy (Rosa et al., 2010).
To obtain purified cellulose, pretreatment processes of lignocellulosic feedstocks are applied to decompose the strong, rigid, and complex microfibril structure of the cellulose-lignin-hemicellulose matrix and to facilitate the isolation of compounds for further production of high-value products (Toor et al., 2020). Pretreatment is essential in biomass conversion because it breaks the lignin-polysaccharide bonds, eliminates the hemicelluloses, and exposes the cellulose fibers (Fougere et al., 2016; Souza et al., 2019). Size reduction, abrasion, acids, alkalis, organic solvents, ionic liquids, enzymes (e.g., cellulases, hemicellulases, and lignin-modifying enzymes), supercritical CO2, subcritical water, steam explosion, ammonia fiber explosion, and torrefaction are available agents and methods for the pretreatment of lignocellulosic biomass (Sarker et al., 2021).
This research seeks to separate cellulose from SCB and hydrolyze cellulose nanocrystals (CNCs) for composite materials' reinforced-phase applications. Cellulose was isolated through the formic/ peroxyformic acid process, which consists of three primary steps: treatment with formic acid (FA, HCOOH), treatment with peroxyformic acid (PFA, a mixture of HCOOH and H2O2), and bleaching with a mixture of NaOH and H2O2. According to the authors' knowledge, several notable reports on biomass pretreatment, including acidic and alkaline treatment, pulping, and bleaching, are available in the literature (Candido and Gonçalves, 2019; Liu et al., 2019; Kalhori et al., 2022; Maheri et al., 2022). Corporating acidic or alkaline pretreatment techniques in cellulose isolation increases the cost because of corrosion-resistant materials and post-processing technologies to neutralize or dispose of corrosive chemicals. Since most inorganic acids are highly corrosive and difficult to recover, conventional pretreatment utilizing inorganic acid does not conform to the principles of green and sustainable chemistry (Ji et al., 2019). Organic acids are less corrosive than inorganic acids and can be readily recycled via vacuum distillation or recrystallization (Huang et al., 2019; Du et al., 2020). Formic acid (FA, HCOOH) is the simplest carboxylic acid with relatively strong acidity (pKa = 3.77) (Li et al., 2015). Integrating FA and PFA processes to partially dissolve hemicellulose, swell, and migrate lignin to the SCB surface effectively improved the efficiency of the bleaching stage for cellulose isolation. In addition, FA can be quickly recovered and reused by vacuum distillation or rotary evaporation due to its low boiling point (100.8 °C). This is the first advantage of using a pre-treated formic/ peroxyformic acid process to extract cellulose fibers from SCB. Sodium chlorite (NaClO2), sodium hypochlorite (NaClO), chlorine dioxide (ClO2), chlorine (Cl2), sodium hydroxide (NaOH), and hydrogen peroxide (H2O2) were used to delignify lignocellulosic biomass (Abdel-Halim, 2012; Chandra et al., 2016; Chen et al., 2016; Li et al., 2024a, 2024b). Under certain conditions, the potent alkaline chemical NaOH can remove hemicellulose and lignin (Fitriana et al., 2020). However, using high concentrations of NaOH may lead to cellulose polymorphic conversion; the cellulose I structure was transformed into cellulose polymorph II (Jin et al., 2016; Wulandari et al., 2016; Li et al., 2024a). The reason is that cellulose tends to swell and rearrange during the mercerization (alkaline treatment). The CNCs with allomorph II (CNC-II), with a size range of 20 to 80 nm, have a spherical or thick rod morphology, significantly different from the conventional thin rod CNC-I (Li et al., 2024b). Even though H2O2 is less effective than other bleaching agents, it is considered greener than chlorine-based bleaching agents (Rosa et al., 2012). Another novel aspect of this study is using a mixture of alkali (NaOH) and oxidant (H2O2) to remove hemicellulose, depolymerize lignin, extract cellulose fibers, and maintain the cellulose I structure. The alkaline media (pH 8–12) contained hydroperoxide anion (HOO–), which oxidized the lignin structure to produce fibers with a higher cellulose content and a whiter color (Arnata et al., 2019).
This study presents a comprehensive structural, compositional, and morphological characterization of isolated cellulose fibers compared to untreated, acid-treated, PFA-treated, and bleached biomass. The investigation focuses on CNCs derived from SCB, which could apply to other plant residues. Consequently, this study provides a process for SCB treatment and a theoretical reference for developing CNCs.
2 Experimental
2.1 Materials
Sugarcane bagasse (SCB) materials were gathered from the Viet Nam National University − Linh Trung − Thu Duc metropolitan region in Ho Chi Minh City. Raw bagasse was first yellowish-white, then the stern section of the sugarcane stalk was removed, rinsed with water, dried in the sun, and then crushed into a fine powder. The compositional analysis of SCB was performed with the NREL protocol to determine structural carbohydrates and lignin (Sluiter et al., 2008). Sodium hydroxide (NaOH, 96 %), formic acid (HCOOH, 90 %), hydrogen peroxide (H2O2, 30 %), and sulfuric acid (H2SO4, 98 %) were supplied from Xilong Scientific Co. (China). All of these are commercial compounds that were used directly.
2.2 Isolation of cellulose
The three basic procedures in isolating cellulose from SCB were HCOOH acid treatment, peroxyformic acid (PFA) treatment, and bleaching with a NaOH/H2O2 mixture. First, the SCB powder was submerged in distilled water and boiled at 100 °C for 2 h to eliminate contaminants. The resulting mixture was filtered and desiccated for 8 h at 70 °C. The SCB powder was homogeneously blended with a 90 % HCOOH solution at a 1:15 ratio (SCB powder to 90 % HCOOH acid volume) at 80 °C for 120 min. The sludge was filtered, rinsed with hot water many times, and desiccated at 80 °C for 6 h. A solution of PFA, comprising 90 % HCOOH, 4 % H2O2, and 6 % H2O, was then added to SCB powder. The PFA treatment was kept at 80 °C for 2 h. The solid product was filtered, extensively washed with distilled water, and dried at 80 °C for 12 h. Finally, the PFA-treated sample was bleached with a NaOH/H2O2 mixture. A 1 M NaOH solution was dropped into a PFA-treated suspension (4 wt%) until the pH reached 11. After that, 30 % H2O2, equal to 40 % of the solid mass in the rest, was slowly added. The mixture was then agitated for 1 h at 80 °C.
2.3 Production of cellulose nanocrystals (CNCs)
SCB cellulose was hydrolyzed with a 64 % sulfuric acid solution at 45⁰C for 30 min to make CNCs. The ratio of solid mass to acid volume was 1:15. The hydrolysis was quenched by adding a large amount of water (about 10 times the volume of the acid solution used) after the designed reaction time was reached. The diluted suspension was centrifuged at 6,000 rpm for 10 min, twice with distilled water and thrice with ethanol. After drying out at 80⁰C until the mass was unchanged, white powder CNCs were taken. The CNCs yield was calculated based on the initial weight of the raw SCB (Islam et al., 2017).
2.4 Characterization
2.4.1 Fourier transform infrared (FTIR) spectroscopy
The functional groups of the materials were determined using the KBr disk method on an FTIR Bruker-Tensor 27, Germany. A total of 2 mg of the sample was combined with 200 mg of potassium bromide (KBr). With a resolution of 4 cm−1, measurements were taken at wavelengths ranging from 400 cm−1 to 4000 cm−1.
2.4.2 X-ray diffraction (XRD) analysis
The X-ray diffraction (XRD) technique revealed the structural changes of treated materials at each stage. XRD (D2 PHASER, Bruker, Germany) patterns with Cu-Kα (λ = 0.15418 nm), 30 kV, and 10 mA were used to determine the crystal size and crystallinity fraction. The samples were mounted on a quartz substrate, and images were acquired at a scanning speed of 0.02 ⁰. min−1 over a 2θ range of 10⁰- 80⁰. Duplicate XRD analyses were performed on each material. The XRD diffractograms were smoothed and analyzed with Xpert HighScore Plus (PANalytical Technologies Pvt. Ltd, Netherlands) software. The curve was fitted using the Gauss function in OriginPro 9.0.0 (64-bit) (OriginLab Corporation, United States). The percentage of crystallinity (CrI) was calculated based on the areas beneath the crystalline and amorphous regions after baseline correction using equation (1) below (Dos Santos et al., 2013).
Scherrer's equation (2) was applied to the peak broadening in the XRD profiles obtained following the deconvolution procedure to determine the dimension Dhkl of the crystallites perpendicular to the hkl diffracting planes.
2.4.3 Scanning electron microscopy with energy-dispersive X-ray spectroscopy (SEM-EDX) analysis
SEM-EDX experiments were carried out using an IGS-QUANTA 650 SEM (FEI, USA) and an EDX detector in low-vacuum mode at 0.1 mbar to avoid charging effects on the materials. All samples were distributed on brass supports and secured with double-sided 3 M tape. Before SEM analysis, all samples were coated with gold to make them conductive.
2.4.4 Transmission electron microscopy (TEM) analysis
The morphology of CNCs was studied in duplicate using a transmission electron microscope (TEM, JEM-1400F, JEOL Ltd., Tokyo, Japan) with a 100 kV accelerating voltage. With a cabinet micropipette, a drop of a 1 % CNCs solution was put on a copper grid, left to dry at room temperature, and then examined using TEM.
2.4.5 Dynamic laser scattering and zeta potential (DLS & zeta potential)
The Zeta potential and particle size of CNCs were determined using Nanopartica sz-100 (Horiba Scientific, Japan). Aqueous suspensions of 0.1 wt% CNCs were prepared, and the measurements were performed at 25 °C with a scattering angle of 90°.
2.4.6 Thermogravimetric (TGA) analysis
On the TA Instruments TGA Q500, thermogravimetric analysis was performed to determine the thermal decomposition of materials after each treatment. Under a nitrogen atmosphere, 15–20 mg samples were heated from room temperature to 800⁰C at a heating rate of 10⁰C. min−1.
2.4.7 Raman spectroscopy analysis
The Raman spectra were collected using laser Raman microspectroscopy (XploRA Plus, Horiba) with an excitation wavelength of 785 nm and an excitation power of 0.5 mW to prevent laser heating from affecting the Raman shift of the cellulose materials. A spectrum was obtained by combining three discrete scans of distinct CNCs sample regions. Origin Pro 9.0.0 (OriginLab Corporation, United States) was used for all spectral manipulations.
2.4.8 Solid-state 13C nuclear magnetic resonance (ss- 13C NMR)
Using a combination of cross-polarization, high-power proton decoupling, and magic angle spinning (CP/MAS), solid-state 13C NMR experiments were conducted on a Bruker AVANCE 400 spectrometer. Spectra of 13C NMR were acquired at 298 K using a 4 mm probe tuned to 100.13 MHz. The rotation frequency of the MAS was 12 kHz, the contact periods of the CP were 2 ms, and the repetition duration was 1 s.
3 Results and discussion
3.1 Fourier transform infrared (FTIR) analysis
Fig. 1 depicts the FTIR spectra of natural bagasse, acid-treated, PFA-treated, bleached, and CNCs samples in the wavenumber range 4000 to 2000 cm−1 and 2000 to 400 cm−1, respectively. The spectra revealed the presence of functional groups in the structure of natural fibers. Spectral peaks and bands with wavenumbers in the 1270–1020 cm−1 range were characteristic vibrations of the polysaccharide compound's C-O-C group (pyranose ring ether bond) (Mondragon et al., 2014; Lamaming et al., 2015). A broad spectral band at 3418 cm−1, which corresponded to the region of stretching vibration of the hydroxyl (–OH) group, characterized the hydrophilic properties of plant fibers. The spectral peak at 2918 cm−1 represented the stretching vibration of the C–H bond, presented in most organic components such as cellulose, hemicellulose, and lignin (Oun and Rhim, 2015). The raw bagasse sample's spectral peak at 1739 cm−1 indicated the presence of an acetyl group, ester group, or carboxyl group of ferulic acid and p-coumaric acid in the hemicellulose component (Qua et al., 2011; Jiang and Hsieh, 2015; Lamaming et al., 2015). When HCOOH and PFA acid were added to SCB at 80 °C, they broke down the hemicellulose parts of SCB. In the meantime, the lignin component was flattened and moved to the surface, making the absorption peak at 1739 cm−1 stronger in the PFA-treated sample than in the raw SCB sample.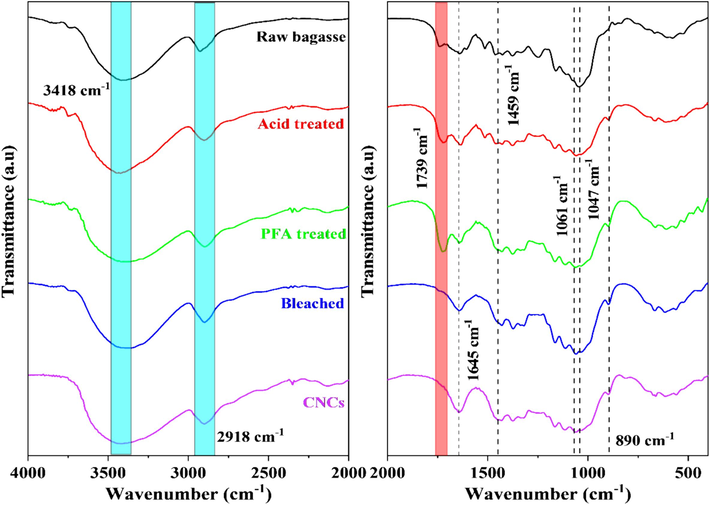
FTIR spectra of SCB at different stages of chemical treatment and CNCs.
In all spectra, the peak at 1645 cm−1 corresponded to the O–H bending of water adsorbed in the cellulose fiber (Mondragon et al., 2014; Li et al., 2016). The 1459 cm−1 peak was representative of the deformation vibrations of CH2 groups. The asymmetric stretching vibration of the C–H bond was visible at 1330 cm−1. The peaks in the region 1200–950 cm−1 were caused by C-O bond stretching vibrations. The −C-O-C group vibration of the pyranose ring produced a prominent band at 1047 cm−1 (Arman et al., 2024). Comparing samples before and after bleaching revealed that the intensity of this band increased, indicating an increase in pure cellulose content. The peak intensity at 890 cm−1 increased with each processing step in the samples' FTIR spectra. This peak was attributed to the glycosidic connections of the cellulose glucose ring (Lu et al., 2015).
After the PFA treatment, FTIR results showed that most of the hemicellulose and part of the lignin were removed. Lignin was one of the most abundant components in fiber and was the most challenging element to remove from natural fibers. Its presence hindered the −cellulose component's bonding surface. The fiber must then undergo a “bleaching” procedure, also known as delignification, to remove most of the lignin required to treat the fibers' component residues (Alemdar and Sain, 2008; Jonoobi et al., 2009). The FTIR study of the bleached and raw bagasse samples showed that the peak at 1739 cm−1 had disappeared from the bleached sample, demonstrating that the bleaching process to eliminate hemicellulose and lignin was successful (Arman et al., 2024). The spectral peaks in the wavenumber range of approximately 1640–1650 cm−1 were associated with moisture adsorption, which forms intermolecular hydrogen bonds between plant fiber constituents and airborne water molecules (Le Troedec et al., 2008).
In addition, the peaks at 1061 cm−1 and 890 cm−1 in the CNCs sample displayed strong C-O-C stretching vibrations, suggesting the presence of a pyranose ring and glycoside linkage. These results indicated that the CNCs are made up of pure cellulose. The hydrogen bonds in the cellulose molecule were responsible for most of the changes in the FTIR spectrum, meaning that during hydrolysis, the acid attack fractured the hydrogen bonds, drastically altering the number of intermolecular hydrogen bonds in cellulose molecules. The results demonstrated that the characteristic peak of the –OH vibration became more pointed and substantially increased in intensity (Laokul et al., 2015; Arman et al., 2024).
3.2 X-ray diffraction analysis (XRD)
XRD patterns were used to examine cellulose's crystalline structure. Fig. 2 shows the XRD patterns of the SCBs before and after they were treated with chemicals. All of the diffractograms showed two peaks at about 22⁰ and 15⁰. These peaks were likely related to the crystalline structure of cellulose I (French, 2014).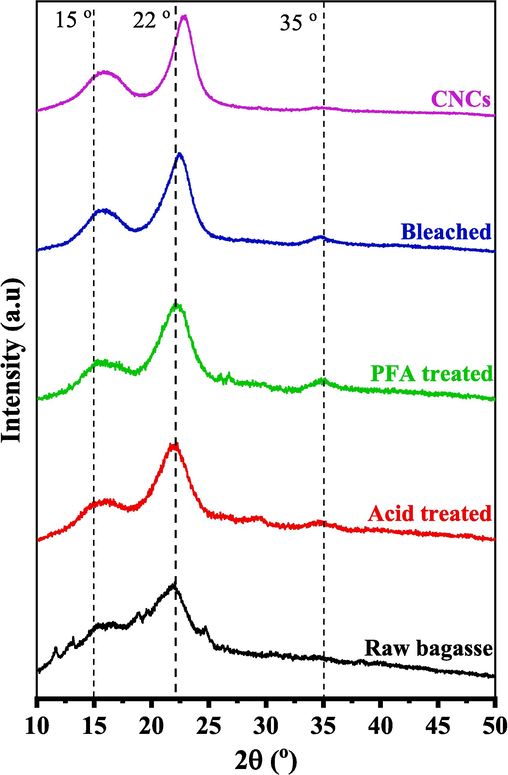
XRD pattern of SCB at various stages of treatment.
Individual crystalline peaks were taken from the diffraction intensity profiles using the peak deconvolution method (Garvey et al., 2005; Park et al., 2010; Xing et al., 2018), as shown in Fig. S1. Peak deconvolution was the most conservative way to measure the crystallinity of cellulose with XRD analysis. Curve fitting required specific hypotheses, such as the shape and number of points. The Gaussian, Lorentzian, and Voigt functions were typically employed for deconvolution (Park et al., 2010). All of the peaks in this study fit with Gaussian functions, and the broad peaks at about 20⁰ and 40⁰ were thought to be from the amorphous input. An amorphous region was often seen in cellulose's 2θ range of 16–20⁰ (Park et al., 2010; French and Santiago Cintrón, 2013; Xing et al., 2018). This study also linked a broad peak around 35⁰ to the crystallinity component to match experimental results. As shown in Table 1, the CrI and the crystalline domain size were enhanced for the SCB treated with formic/peroxyformic acid.
SCB stage
CrI (%)
Crystalline domain size (nm)
Raw
32.1
2.0
Acid-treated
41.4
2.8
PFA-treated
42.0
2.8
Bleached
57.8
3.3
CNCs
70.8
3.5
Because hydroxyl groups formed H-bonds between and within molecules, cellulose had ordered crystalline arrangements (Chirayil et al., 2014). The H bonding made it hard for the cellulosic chains to move around quickly and made the chains line up close to each other in an orderly way, which made them more likely to crystallize. In raw SCB, these crystalline domains were surrounded by amorphous parts like hemicelluloses, lignin, and pectin, which makes the SCB less crystalline. Combined with FTIR results, XRD patterns indicate that the crystallinity improved due to the effective removal of non-crystalline components using a series of chemical treatments (Abdul Rahman et al., 2017; Perumal et al., 2022b; Raza et al., 2022).
Acid and PFA treatments dissolved amorphous hemicelluloses and lignin, increasing CrI from 32.1 % to 42.0 %. Bleaching removed the remaining amorphous components, resulting in a CrI of 57.8 %. With their removal, a large number of crystalline domains can be realigned. The remaining underdeveloped regions were hazardous to acid attacks and exposed to unpredictable orientations. Hydronium ions (H3O+) penetrated amorphous regions and promoted the hydrolysis of cellulose's glycosidic connections, resulting in the liberation of individual crystallites (de Souza Lima and Borsali, 2004; Park et al., 2010; Collazo-Bigliardi et al., 2018; Doh et al., 2020). After acid hydrolysis, a prominent and robust peak appeared in the XRD pattern, indicating a considerable 70.8 % increase in crystallinity. A higher crystallinity index was associated with increased stiffness of cellulose nanocrystals. As a result, when high cellulose nanocrystals were used as a reinforcement ingredient, the composite materials had better mechanical properties (Collazo-Bigliardi et al., 2018; Naduparambath et al., 2018; Melikoğlu et al., 2019).
3.3 Cellulose nanocrystals morphologies
Fig. 3 depicts digital photographs and SEM images of the SCB at various stages of treatment. After treatment with acid, SCB's color changed from light yellow to brown to a distinct white after treatment with PFA and bleaching. The apparent color changes were predominantly caused by eliminating hemicellulose, lignin, and other non-cellulosic components from SCB. Raw SCB appeared as long, rigid tubes (Fig. 3a), and longitudinal examination of SCB revealed that the stems were composed of many aligned fibers. There is a correlation between the presence of cementing materials, including lignin, hemicelluloses, waxes, and pectin, and the interconnection of fibers in the stem. SCB was treated in an acidic environment to dissolve hemicellulose, wax, and pectin partially. Rest and lignin swelled in the acidic environment. They migrated toward the surface, altering the surface morphology of acid-treated SCB (Fig. 3b). The sample color at this stage was a deeper reddish brown than the original because the phenol derivatives found in lignin absorb visible light. The PFA-treated stage mellowed the fiber by removing most of the hemicellulose and a small amount of lignin. Due to the oxidation effects of PFA and the cracking of polysaccharides, particularly hemicellulose and lignin, the morphology of PFA-treated SCB was substantially rougher than that of untreated SCB (Fig. 3c). SCB's hemicellulose, wax, and pectin preponderance were extracted through acid and PFA processing. Lignin, however, remained external to the fiber. Therefore, additional bleaching was necessary to remove lignin and acquire pure cellulose.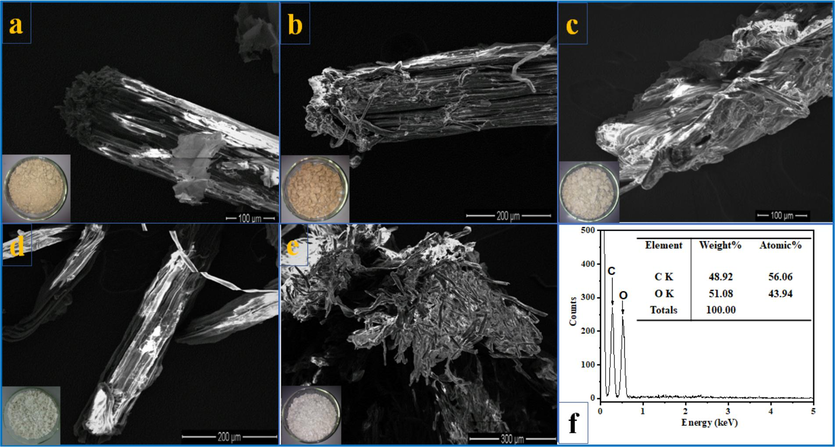
(a-e) Digital photographs and SEM images of the SCB at different stages of treatment; (f) EDX spectra of CNCs.
The PFA-treated SCB was bleached in a NaOH/H2O2 mixture. The presence of NaOH accelerated the breakdown of H2O2 into H+ and perhydroxyl ions (HO2–). These ions attacked the double bonds on the chain and aromatic ring derivatives in lignin, breaking the outer lignin structure and releasing the cellulose component inside the SCB. After bleaching, the isolated cellulose fibers had a smoother surface and smaller diameter than the untreated SCB (Fig. 3d). It is known that cellulose fibers consist of cellulose crystal fibers and amorphous cellulose. The amorphous sections of bleached SCB were removed using sulfuric acid to obtain CNCs. Hydronium ions (H+) liberated by sulfuric acid degrade glycoside and ether bonds in the cellulose molecular chain of the amorphous region during this procedure. Therefore, the cellulose fiber's original structure was disrupted and fragmented into numerous fine ones (Fig. 3e). Fig. 3f demonstrates the EDX spectrum of CNCs, which confirms this material's high purity when only C and O were present.
The morphology of the three-dimensional images of dilute bleached SCB and CNCs suspensions were analyzed using TEM. As depicted in Fig. 4 (a,b), the fibers in the final bleached SCB suspension were nanoscale in diameter and had a high aspect ratio. The image displayed lengthy fibrils with diameters between 30 and 35 nm. The majority of fibers had an aspect ratio between 40 and 50. Fig. 4 (c, d) illustrates the TEM image of the CNCs obtained via acid hydrolysis. After treatment with acid hydrolysis, it was evident that the amorphous phase in cellulose nanofibrils had been effectively removed, resulting in a discernible length reduction. The CNCs had a diameter of 23 ± 2.7 nm, a length of 610 ± 18 nm, and an aspect ratio of 26.5 ± 6.7. This aspect ratio value was comparable to or even more significant than that reported in the scientific literature for CNCs isolated from sugarcane bagasse (Oliveira et al., 2016; Leão et al., 2017; Ren et al., 2023) (Table 2). The aspect ratio is crucial in determining the reinforcing capacity of nanofibers. The higher aspect ratio of CNCs suggested they could be used as a reinforcing filler in the film, increasing the biocomposites' mechanical strength (El Achaby et al., 2017). In comparison to other CNCs sources, the aspect ratios obtained in this study were significantly greater than those isolated from mengkuang leaves (10–20) (Sheltami et al., 2012), raw cotton linter (19) (Morais et al., 2013), rice straw (8.8–10.5), grape skin (5–10) (Hsieh, 2013), cotton linter (11–12) (Roohani et al., 2008), and waste cotton cloth (17 ± 15) (Wang et al., 2017), but lower than cellulose nanofibers derived from areca nut husk fibers (Chandra et al., 2016).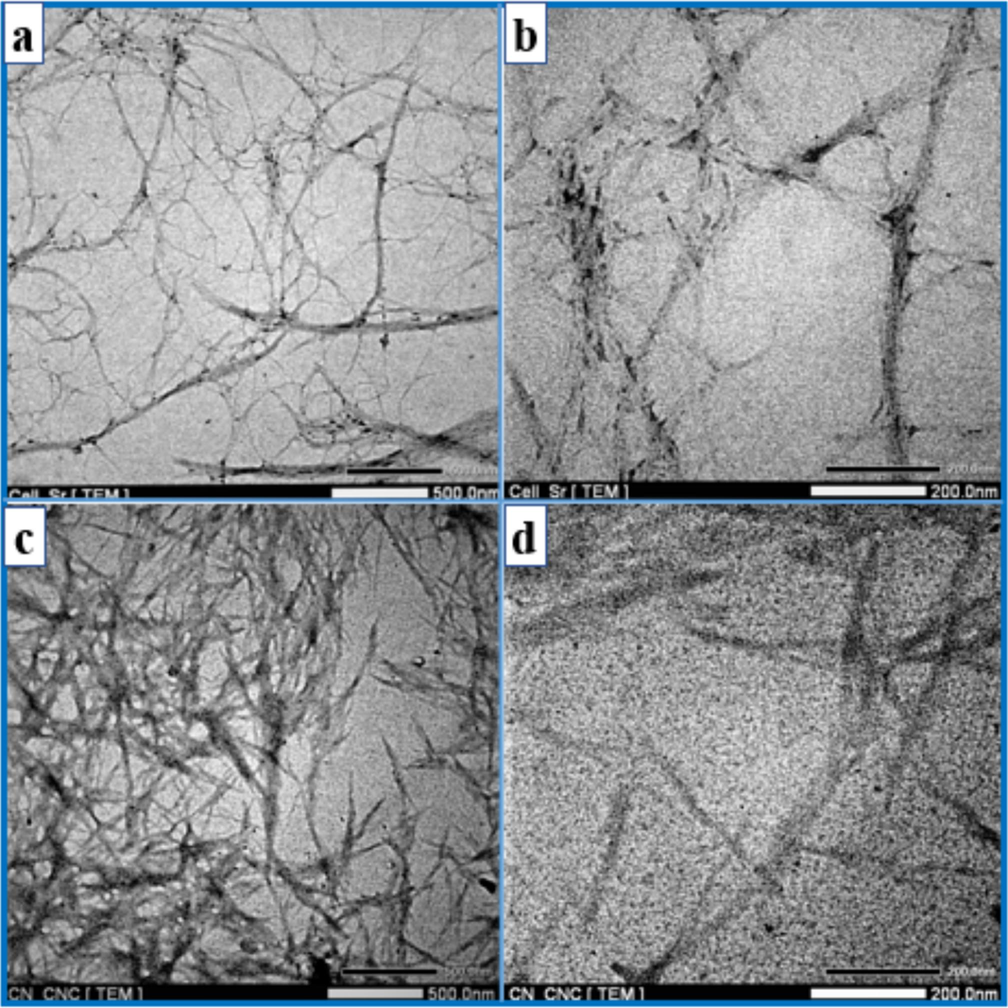
TEM image of (a, b) bleached SCB and (c, d) CNCs.
Extraction procedure
Length (nm)
Diameter
(nm)L/D
CrI(%)
Yield (%)
Zeta potential (mV)
Tmax (oC)
Ref.
• H2O2 11 wt% and NaOH 5 wt%
• H2SO4 6 M255 ± 55
4 ± 2
∼64
88
50 ∼ 58
NG
260
(Teixeira et al., 2011)
• H2O2 24 wt% and NaOH 4 wt%
• H2SO4 65 wt%69 ± 26
6 ± 1
NG
84
9
NG
280
(Oliveira et al., 2016)
• NaClO2 3.3 % (w/v) and NaOH 5 % (w/v)
• H2SO4 64 % (w/w)152 ± 32
12 ± 1.8
12 ± 15
67
34
NG
305
(Leão et al., 2017)
• NaClO2 3.3 % (w/v) and NaOH 5 % (w/v)
• HNO3 1 M and H2SO4 64 % (w/w)222 ± 23
12 ± 1.623 ± 11
65
24
NG
295
• Steam explosion at 195 °C for 15 min
• NaClO2 5 wt% (7 times)
• H2SO4 60 wt%200–400
20–40
−
68
NG
260
(Sukyai et al., 2018)
• NaOH 4 wt% and NaClO2 3.3 % (w/v)
• H3PO4 8 M∼250
∼7
45
67.7
NG
NG
NG
(Gan and Chow, 2021)
• NaClO2 5 wt%
• H2SO4 60 wt%180.79 ± 52.70
10.80 ± 2.26
16.7
72.3
23.46 ± 0.97
−45.22 ± 0.12
213.1
(Ren et al., 2023)
• H2O2 30 wt%
• H2SO4 60 wt%205.08
± 87.505.40 ± 1.38
38.0
72.1
23.84 ± 1.28
−29.97 ± 0.05
237.6
• HCOOH 90 %
• HCOOH/H2O2 (90: 4)
• NaOH 1 M and H2O2 30 wt%
• H2SO4 64 wt%610 ± 18
23 ± 2.7
26.5 ± 6.7
70.8
37–39
−62.6 ± 2.3
250
This study
In our study, the compositional analysis of SCB was observed to be 45 ± 1 % cellulose, 27 ± 2 % hemicellulose, lignin 20 ± 2 % with lesser quantities of ash (3–4 %), and extractives (1–2 %). The yield of CNCs extracted from SCB ranged from 37 % to 39 %, which was comparable to or even more significant than the yields obtained using alkaline and sodium chlorite treatments (Yue et al., 2015) or ultrasonic-assisted TEMPO-mediated oxidation and one-step APS oxidation method (Zhang et al., 2016). The difference in yield could be attributed to using an isolated cellulose process and acid hydrolysis conditions. This yield was comparable to Mengkuang leaves (28 %) and Okra fibers (30 %) (Sheltami et al., 2012; Fortunati et al., 2013). In contrast, the percentage yield of CNCs from SCB was greater than that of CNCs from barley straw and husk (12 %) (Fortunati et al., 2016), old corrugated container fiber (23.98 %) (Tang et al., 2015), sugarcane pith (23.84 ± 1.28 %) (Ren et al., 2023), and areca nut fibers (35 ± 0.2 %) (Ramesh and Radhakrishnan, 2022), and lower than the CNCs content of grape promace (38–46 %) and corn cob (65.33 ± 7.57 %) (Sartika et al., 2023). It indicated that both the cellulose source and isolation conditions influence the yield of CNCs. Utilizing mechanical cellulose pretreatment, acid hydrolysis with controlled hydrolysis conditions such as acid concentration, hydrolysis duration, and temperature, and post-treatment, including homogenization and ultrasonication, could have resulted in a higher yield of CNCs (Li et al., 2014).
3.4 DLS and zeta potential
The zeta potential of the CNCs suspension was −62.6 ± 2.3 mV (Fig. 5b). The negative charge was due to the addition of sulfate groups to the surface of CNCs during H2SO4 hydrolysis. This demonstrated that the treatment conditions induced the dispersion of CNCs in aqueous suspension, which was electrostatically stabilized by repulsive forces. The hydrodynamic size distribution of CNCs calculated using DLS was about 300.1 nm (Fig. 5a). The DLS analysis revealed a sharp distribution profile for the CNCs, indicating their uniform size. Similarly, recent research found that the CNCs isolated from SCB had a sharp and narrow distribution profile, suggesting that the CNCs crystals were more uniform in size and may have created a homogenous dispersion in water (Verma et al., 2021). Pandi et al. (2021) synthesized CNCs from cotton using ultrasound-assisted acid hydrolysis. The DLS research showed that the average hydrodynamic size of CNC was about 221 nm (Pandi et al., 2021).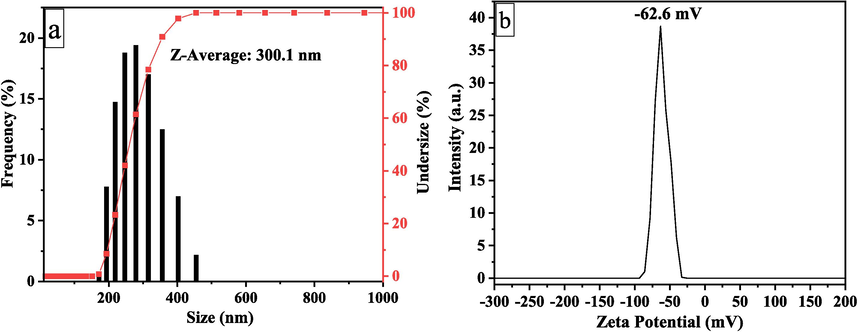
Hydrodynamic size analysis (a) of CNCs by DLS and zeta potential (b) of CNCs.
3.5 Thermogravimetric analysis
To compare degradation characteristics at different processing stages, untreated SCB, acid-treated SCB, PFA-treated SCB, bleached SCB, and CNCs were thermogravimetrically analyzed. Table S1 compares SCB weight loss, maximum degradation temperature, and char yield at different treatment stages. The TG curves (Fig. 6a) depict the weight loss of samples between 25⁰C and 800⁰C. Due to various non-cellulosic and cellulosic components with varying decomposition temperatures, the thermal degradation of unprocessed SCB was a multistage process. Initial weight loss began at 39 °C and continued to about 120⁰C, caused by the evaporation of loosely bound surface moisture and intermolecular hydrogen-bonded chemisorbed water (Dai et al., 2018; Prakash et al., 2018). The subsequent stage of degradation was initiated by the thermal depolymerization of hemicelluloses and the disruption of glycosidic bonds in cellulose at 221.9⁰C. Lignin decomposed over a broader range of temperatures than cellulose and hemicelluloses (Chirayil et al., 2014).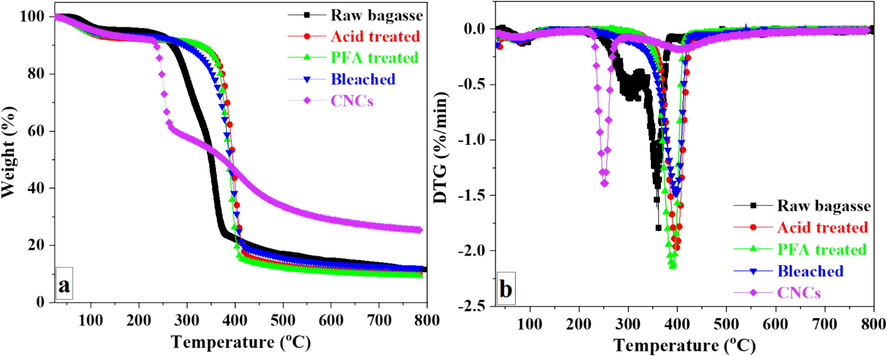
TGA (a) and DTG (b) of the SCB at different stages of treatment.
Consequently, the third stage of decomposition was most likely associated with lignin, the principal component of a cementing substance. The DTG of unprocessed SCB revealed two broad peaks, one at 242.4⁰C and the other at approximately 386.7⁰C, and continued to 400⁰C. The broader range of lignin breakdown observed may be attributed to the different thermal stabilities and cleavage temperatures of the oxygen functional groups in its structure (Brebu and Vasile, 2010).
TGA analysis of acid and PFA-treated samples revealed weight loss at temperatures below 150⁰C. At 80⁰C, the hemicellulose components of SCB dissolved when exposed to HCOOH acid and HCOOH/H2O2 acid. The lignin component was simultaneously swollen and migrated to the fiber surface. Due to lignin's hydrophobic properties, its migration to the material's surface reduced its capacity to absorb moisture. TGA results revealed a decrease in adsorbed moisture in two samples compared to the unprocessed SCB. In addition, the presence of flame-retardant lignin on the surface of two samples was responsible for the increase in the onset temperature of degradation of these materials.The degradation of acid-treated samples began at 367.3⁰C and reached its maximum rate at 397.3⁰C. The degradation of PFA-treated samples began at 360.8⁰C and reached its maximum rate at 390.5⁰C. After being treated with PFA, the SCB was bleached in NaOH/ H2O2 mixture. In the presence of NaOH, H2O2 broke down into H+ and perhydroxyl ions (HO2–). These ions attacked the double bonds on lignin's chain and aromatic ring derivatives, destroyed the outer lignin structure, and liberated the cellulose component within the SCB.
The DTG curve for bleached SCB (Fig. 6b) revealed that significant weight loss occurred between 360⁰C and 420⁰C, with the maximum degradation peak corresponding to cellulose degradation occurring at 395.8⁰C. The highest cellulose degradation peak for CNCs occurred at 250.0⁰C (Fig. 6b). The thermal stability of CNCs was lower than untreated and bleached SCB. This can be attributed to replacing –OH groups of cellulose with O-SO3H groups during H2SO4 hydrolysis (Li et al., 2024a), the increased surface area of CNCs during thermal heating (Hemmati et al., 2018; Naduparambath et al., 2018; Melikoğlu et al., 2019; Singh et al., 2023), and the increased number of free ends in CNCs chains due to their reduced molecular weight (Kallel et al., 2016b; Luzi et al., 2019). Nevertheless, the residue content of CNCs surpassed that of the two samples as a result of the crystalline structure of CNCs (George et al., 2011) and the flame-retardant properties of sulfate ester groups formed during acid hydrolysis (Jiang and Hsieh, 2013; Li et al., 2024a). Similar pyrolysis behavior was reported in CNCs derived from several sources, including garlic straw (Kallel et al., 2016a), sunn hemp (Mahur et al., 2023), corn cob (Sartika et al., 2023), sugarcane pith (Ren et al., 2023), and walnut shells (Arbelaiz and Orue, 2023).
3.6 Raman spectroscopy analysis
Raman spectroscopy correlates the polarizability of electrons in the molecular bond and provides information about the material's vibrational modes. Fig. 7a depicts the Raman spectra of the bleached SCB and CNCs; the obtained band pattern was comparable to that described in the literature (Li and Renneckar, 2011; Agarwal, 2014). The region between 250 and 1600 cm−1 (Fig. 7b) was dominated by bands resulting from the COC, CH2, CH, and OH groups' vibrations and the probable vibrations of CH-O and OH-O hydrogen bonds. 1474–1464, 1377, 1333, 1265/1284, 988, and 988 cm−1 were the most distinctive bands associated with the molecular environment of methylene (–CH2) and methine (–CH) groups. Broad bands at 1474 cm−1 and 1464 cm−1 were primarily attributed to CH2 scissoring (bending) deformations and OH bending deformations at C-6. These bands provided information about the ultrastructure of intramolecular and intermolecular bonds within cellulose (Li and Renneckar, 2011).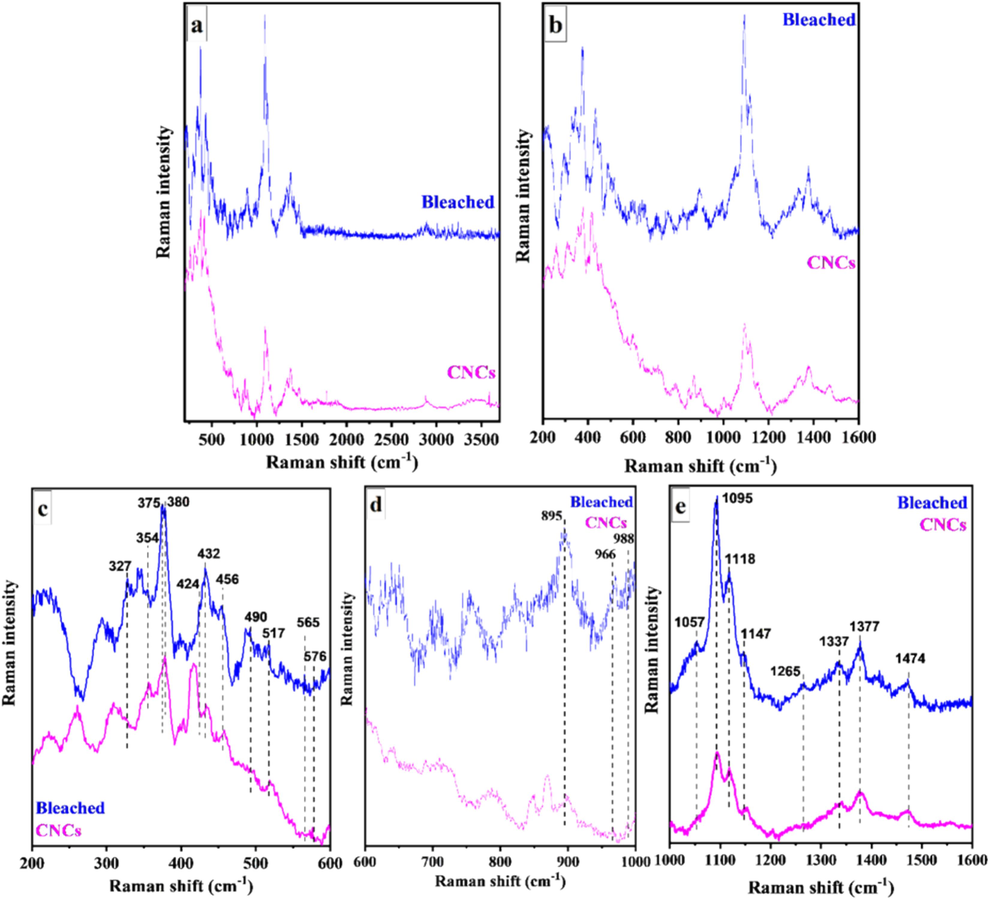
Raman spectra of bleached SCB and CNCs (a) in the range of 200–3600 cm−1 and (b–e) within specific band regions.
The region between 1200 and 1300 cm−1 was sensitive to glycosidic linkage orientation. In this region, a relatively weak band related to cellulose II was visible at 1265 cm−1 (Fig. 7e). The vibrations of the CH2 and CH groups related to the bands at 988 and 966 cm−1 (Fig. 7d). C–O–C glycosidic linkage deformations were linked to 1118, 1095, 560–576, 517, and 490 cm−1 bands. Ring deformations were visible between 576 and 1147 cm−1 (Fig. 7c, e). The bands at 456 cm−1, 432 cm−1, and 424 cm−1 corresponded to CCC and CCO ring vibrations. Bands at approximately 456 and 432 cm−1 were characteristic of cellulose I, while bands at 424 cm−1 were unique to cellulose II (Schenzel and Fischer, 2001). Agarwal (2014) demonstrated that the cellulose crystallinity index was associated with bands at approximately 380 cm−1 (Agarwal, 2014). Other skeletal deformations typical of cellulose I included bands at 565 and 327 cm−1, while those of cellulose II were at 576 and 351 cm−1 (Fig. 7c). The 897 cm−1 band corresponded to the bending vibration of the methine group at C-1 or the bending vibrations of HCC and HCO at C-6 in the pyranose unit (Schenzel and Fischer, 2001).
3.7 13C NMR analysis
Fig. 8 depicts the spectrum of bleached SCB and CNCs. The region between 60 and 110 ppm contained cellulose carbon 13C NMR signals. Two peaks at 72.6 and 73.4 ppm corresponded to cellulose C-2 and C-3 carbon, respectively, while 75.5 ppm corresponded to cellulose C-5 carbon. The peak at 89.3 ppm corresponded to crystalline cellulose carbon C-4, while 105.5 ppm corresponded to cellulose carbon C-1 (Wikberg and Maunu, 2004). The C-6 signal at 65.7 ppm indicated crystalline presence (Vivian Abiaziem et al., 2019). The NMR spectra of the cellulose after chemical treatments (acid treatment, PFA treatment, and bleaching) revealed that most of the carbohydrates were eliminated. Hemicellulose removal was confirmed by the absence of the peak at 102 ppm attributed to the C-1 of the (1 → 4)-β-D-Xylp-2-O-(4-OMe-α-D-GlcpA) units in hemicellulose (Wen et al., 2011). As there were no peaks at 21, 56, or 173 ppm (Fig. S2) corresponding to hemicellulose and lignin (Idström et al., 2016), it can be concluded that the chemical treatments removed the carbons in the methyl and methoxyl groups in lignin as well as the carbons in the carboxyl groups. In conclusion, the spectrum of the two samples revealed that six carbon atoms caused each peak in the cellulose structure.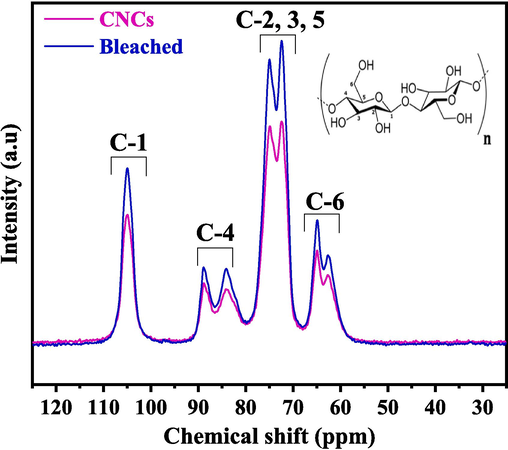
13C NMR spectra of bleached SCB and CNCs.
4 Conclusion
Using the formic/peroxyformic acid pretreatment followed by hydrolysis for nano-fibrillation, cellulose nanocrystals (CNCs) were effectively extracted from sugarcane bagasse. The chlorine-free bleaching method was necessary to obtain white and cellulose-pure solid products thanks to the delignification and solubilization of a substantial amount of hemicellulose contaminants. FTIR, Raman, and solid-state 13C NMR analyses of cellulose microfibers revealed that hemicellulose and lignin were removed during the bleaching procedure. For the preparation of CNCs, H2SO4 acid was utilized. TEM analysis revealed that CNCs had a diameter of 23 ± 2.7 nm, a length of 610 ± 18 nm, and an aspect ratio of 26.5 ± 6.7. The XRD analysis revealed that CNCs have the highest crystallinity index (70.8 %), making them an attractive additive for industrial biopolymer composites. Overall, preparing CNCs using the proposed methodology is a more efficient and environmentally friendly approach for sugarcane bagasse waste valorization.
Ethical approval
This study did not involve any experiments on human subjects or animals.
Funding
This research is funded by Vietnam National University, Ho Chi Minh City (VNU-HCM) under grant number C2021-18–24. The authors are grateful for this financial support.
CRediT authorship contribution statement
An Nang Vu: Conceptualization, Investigation, Writing – review & editing. Long Hoang Nguyen: Investigation, Writing – original draft. Kimio Yoshimura: Resources. Tap Duy Tran: Investigation. Hieu Van Le: Conceptualization, Supervision, Validation.
Declaration of competing interest
The authors declare that they have no known competing financial interests or personal relationships that could have appeared to influence the work reported in this paper.
References
- Simple and economic bleaching process for cotton fabric. Carbohydr. Polym.. 2012;88(4):1233-1238.
- [CrossRef] [Google Scholar]
- Extraction and characterization of cellulose nanocrystals from tea leaf waste fibers. Polymers.. 2017;9(11):588.
- [Google Scholar]
- 1064 nm FT-Raman spectroscopy for investigations of plant cell walls and other biomass materials. Front. Plant Sci.. 2014;5
- [CrossRef] [Google Scholar]
- Isolation and characterization of nanofibers from agricultural residues – Wheat straw and soy hulls. Bioresour. Technol.. 2008;99(6):1664-1671.
- [CrossRef] [Google Scholar]
- Arbelaiz, A.Orue, A., 2023. Walnut shells as cellulose nanocrystal source: isolation procedure and properties characterization. Biomass Convers. Biorefin. 10.1007/s13399-023-03996-2.
- Cellulose nanocrystals from celery stalk as quercetin scaffolds: A novel perspective of human holo-transferrin adsorption and digestion behaviours. Luminescence.. 2024;39(1):e4634.
- [Google Scholar]
- Cellulose Production from Sago Frond with Alkaline Delignification and Bleaching on Various Types of Bleach Agents. Orient. J. Chem.. 2019;35
- [Google Scholar]
- Evaluation of two different applications for cellulose isolated from sugarcane bagasse in a biorefinery concept. Ind. Crops Prod.. 2019;142:111616
- [CrossRef] [Google Scholar]
- Sugarcane bagasse and leaves: foreseeable biomass of biofuel and bio-products. J. Chem. Technol. Biotechnol.. 2012;87(1):11-20.
- [CrossRef] [Google Scholar]
- Isolation and characterization of cellulose nanofibrils from arecanut husk fibre. Carbohydr. Polym.. 2016;142:158-166.
- [CrossRef] [Google Scholar]
- Production of new cellulose nanomaterial from red algae marine biomass Gelidium elegans. Carbohydr. Polym.. 2016;151:1210-1219.
- [CrossRef] [Google Scholar]
- Isolation and characterization of cellulose nanofibrils from Helicteres isora plant. Ind. Crops Prod.. 2014;59:27-34.
- [CrossRef] [Google Scholar]
- Isolation and characterisation of microcrystalline cellulose and cellulose nanocrystals from coffee husk and comparative study with rice husk. Carbohydr. Polym.. 2018;191:205-215.
- [CrossRef] [Google Scholar]
- Utilization of pineapple peel for production of nanocellulose and film application. Cellulose.. 2018;25(3):1743-1756.
- [CrossRef] [Google Scholar]
- Rodlike Cellulose Microcrystals: Structure, Properties, and Applications. Macromol. Rapid Commun.. 2004;25(7):771-787.
- [CrossRef] [Google Scholar]
- Physicochemical characteristics of cellulose nanocrystals isolated from seaweed biomass. Food Hydrocolloids.. 2020;102:105542
- [CrossRef] [Google Scholar]
- Cellulose nanocrystals from pineapple leaf, a new approach for the reuse of this agro-waste. Ind. Crops Prod.. 2013;50:707-714.
- [Google Scholar]
- Sustainable valorization of paper mill sludge into cellulose nanofibrils and cellulose nanopaper. J. Hazard. Mater.. 2020;400:123106
- [CrossRef] [Google Scholar]
- Processing and properties of eco-friendly bio-nanocomposite films filled with cellulose nanocrystals from sugarcane bagasse. Int. J. Biol. Macromol.. 2017;96:340-352.
- [CrossRef] [Google Scholar]
- Elias, M.-H., Myriam Adela, A.-A., Jhuma, S. et al 2017. Sugarcane Bagasse Valorization Strategies for Bioethanol and Energy Production. In: O. Alexandre Bosco de (ed) Sugarcane, Rijeka, IntechOpen, Ch. 4.
- Cellulose extraction from sugar palm (Arenga pinnata) fibre by alkaline and peroxide treatments. IOP Conf. Ser.: Earth Environ. Sci.. 2020;462(1):012053
- [CrossRef] [Google Scholar]
- Cellulose nanocrystals extracted from okra fibers in PVA nanocomposites. J. Appl. Polym. Sci.. 2013;128(5):3220-3230.
- [CrossRef] [Google Scholar]
- Revalorization of barley straw and husk as precursors for cellulose nanocrystals extraction and their effect on PVA_CH nanocomposites. Ind. Crops Prod.. 2016;92:201-217.
- [CrossRef] [Google Scholar]
- Effect of acidic pretreatment on the chemistry and distribution of lignin in aspen wood and wheat straw substrates. Biomass Bioenergy.. 2016;91:56-68.
- [CrossRef] [Google Scholar]
- Idealized powder diffraction patterns for cellulose polymorphs. Cellulose.. 2014;21(2):885-896.
- [Google Scholar]
- Cellulose polymorphy, crystallite size, and the Segal Crystallinity Index. Cellulose.. 2013;20(1):583-588.
- [CrossRef] [Google Scholar]
- Tailoring Chemical, Physical, and Morphological Properties of Sugarcane Bagasse Cellulose Nanocrystals via Phosphorylation Method. J. Nat. Fibers.. 2021;18(10):1448-1459.
- [CrossRef] [Google Scholar]
- On the Interpretation of X-Ray Diffraction Powder Patterns in Terms of the Nanostructure of Cellulose I Fibres. Macromol. Chem. Phys.. 2005;206(15):1568-1575.
- [CrossRef] [Google Scholar]
- Bacterial cellulose nanocrystals exhibiting high thermal stability and their polymer nanocomposites. Int. J. Biol. Macromol.. 2011;48(1):50-57.
- [CrossRef] [Google Scholar]
- Synthesis and characterization of cellulose nanocrystals derived from walnut shell agricultural residues. Int. J. Biol. Macromol.. 2018;120:1216-1224.
- [CrossRef] [Google Scholar]
- Cellulose nanocrystals and self-assembled nanostructures from cotton, rice straw and grape skin: a source perspective. J. Mater. Sci.. 2013;48(22):7837-7846.
- [CrossRef] [Google Scholar]
- Coupling the post-extraction process to remove residual lignin and alter the recalcitrant structures for improving the enzymatic digestibility of acid-pretreated bamboo residues. Bioresour. Technol.. 2019;285:121355
- [CrossRef] [Google Scholar]
- 13C NMR assignments of regenerated cellulose from solid-state 2D NMR spectroscopy. Carbohydr. Polym.. 2016;151:480-487.
- [CrossRef] [Google Scholar]
- Effect of low pressure alkaline delignification process on the production of nanocrystalline cellulose from rice husk. J. Taiwan Inst. Chem. Eng.. 2017;80:820-834.
- [CrossRef] [Google Scholar]
- Strategy towards one-step preparation of carboxylic cellulose nanocrystals and nanofibrils with high yield, carboxylation and highly stable dispersibility using innocuous citric acid. Green Chem.. 2019;21(8):1956-1964.
- [CrossRef] [Google Scholar]
- Chemically and mechanically isolated nanocellulose and their self-assembled structures. Carbohydr. Polym.. 2013;95(1):32-40.
- [Google Scholar]
- Cellulose nanocrystal isolation from tomato peels and assembled nanofibers. Carbohydr. Polym.. 2015;122:60-68.
- [CrossRef] [Google Scholar]
- On the polymorphic and morphological changes of cellulose nanocrystals (CNC-I) upon mercerization and conversion to CNC-II. Carbohydr. Polym.. 2016;143:327-335.
- [CrossRef] [Google Scholar]
- Chemical composition, crystallinity and thermal degradation of bleached and unbleached kenaf bast (Hibiscus cannabinus) pulp and nanofiber. BioResources.. 2009;4(2):626-639.
- [Google Scholar]
- Enzyme activity inhibition properties of new cellulose nanocrystals from Citrus medica L. pericarp: A perspective of cholesterol lowering. Luminescence.. 2022;37(11):1836-1845.
- [CrossRef] [Google Scholar]
- Isolation and structural characterization of cellulose nanocrystals extracted from garlic straw residues. Ind. Crops Prod.. 2016;87:287-296.
- [CrossRef] [Google Scholar]
- Kallel, F., Bettaieb, F., Khiari, R. et al 2016. Isolation and structural characterization of cellulose nanocrystals extracted from garlic straw residues.
- Alkali-based AFEX pretreatment for the conversion of sugarcane bagasse and cane leaf residues to ethanol. Biotechnol. Bioeng.. 2010;107(3):441-450.
- [CrossRef] [Google Scholar]
- Isolation and characterization of cellulose nanocrystals from parenchyma and vascular bundle of oil palm trunk (Elaeis guineensis) Carbohydr. Polym.. 2015;134:534-540.
- [CrossRef] [Google Scholar]
- Magnetic and Optical Properties of CoFe2O4 Nanoparticles Synthesized by Reverse Micelle Microemulsion Method. Journal of Superconductivity and Novel Magnetism.. 2015;28(8):2483-2489.
- [CrossRef] [Google Scholar]
- Influence of various chemical treatments on the composition and structure of hemp fibres. Composites, Part A. 2008;39(3):514-522.
- [CrossRef] [Google Scholar]
- Environmental and technical feasibility of cellulose nanocrystal manufacturing from sugarcane bagasse. Carbohydr. Polym.. 2017;175:518-529.
- [CrossRef] [Google Scholar]
- Electrostatic interactions regulate the physical properties of gelatin-cellulose nanocrystals nanocomposite films intended for biodegradable packaging. Food Hydrocolloids.. 2021;113
- [CrossRef] [Google Scholar]
- Supramolecular Structure Characterization of Molecularly Thin Cellulose I Nanoparticles. Biomacromolecules.. 2011;12(3):650-659.
- [CrossRef] [Google Scholar]
- Effects of hydrolysis conditions on the morphology of cellulose II nanocrystals (CNC-II) derived from mercerized microcrystalline cellulose. Int. J. Biol. Macromol.. 2024;258
- [CrossRef] [Google Scholar]
- On rheological properties of disc-shaped cellulose nanocrystals. Carbohydr. Polym.. 2024;330:121764
- [CrossRef] [Google Scholar]
- Cellulose nanocrystals prepared via formic acid hydrolysis followed by TEMPO-mediated oxidation. Carbohydr. Polym.. 2015;133:605-612.
- [CrossRef] [Google Scholar]
- Characteristics and deoxy-liquefaction of cellulose extracted from cotton stalk. Fuel.. 2016;166:196-202.
- [CrossRef] [Google Scholar]
- High Yield Preparation Method of Thermally Stable Cellulose Nanofibers. BioResources.. 2014;9(2)
- [Google Scholar]
- Mild Alkaline Pretreatment for Isolation of Native-Like Lignin and Lignin-Containing Cellulose Nanofibers (LCNF) from Crop Waste. ACS Sustainable Chem. Eng.. 2019;7(16):14135-14142.
- [CrossRef] [Google Scholar]
- Preparation and characterization of cellulose nanocrystals from rice straw. Carbohydr. Polym.. 2012;87(1):564-573.
- [Google Scholar]
- A mechanochemical approach to manufacturing bamboo cellulose nanocrystals. J. Mater. Sci.. 2015;50(2):611-619.
- [CrossRef] [Google Scholar]
- Valorization and extraction of cellulose nanocrystals from North African grass: Ampelodesmos mauritanicus (Diss) Carbohydr. Polym.. 2019;209:328-337.
- [CrossRef] [Google Scholar]
- Glucokinase activity enhancement by cellulose nanocrystals isolated from jujube seed: A novel perspective for type II diabetes mellitus treatment (In vitro) J. Mol. Struct.. 2022;1269:133803
- [CrossRef] [Google Scholar]
- Different nanocellulose morphologies (cellulose nanofibers, nanocrystals and nanospheres) extracted from Sunn hemp (Crotalaria Juncea) Int. J. Biol. Macromol.. 2023;253:126657
- [CrossRef] [Google Scholar]
- Optimum alkaline treatment parameters for the extraction of cellulose and production of cellulose nanocrystals from apple pomace. Carbohydr. Polym.. 2019;215:330-337.
- [CrossRef] [Google Scholar]
- A common strategy to extracting cellulose nanoentities from different plants. Ind. Crops Prod.. 2014;55:140-148.
- [CrossRef] [Google Scholar]
- Morais, J. P. S., Rosa, M. d. F., de Souza Filho, M. d. s. M. et al 2013. Extraction and characterization of nanocellulose structures from raw cotton linter. Carbohydr. Polym. 91(1), 229-235. Doi: 10.1016/j.carbpol.2012.08.010.
- Isolation and characterisation of cellulose nanocrystals from sago seed shells. Carbohydr. Polym.. 2018;180:13-20.
- [CrossRef] [Google Scholar]
- A novel method for preparing microfibrillated cellulose from bamboo fibers. Adv. Nat. Sci.: Nanosci. Nanotechnol.. 2013;4(1)
- [Google Scholar]
- Production of cellulose nanocrystals from sugarcane bagasse fibers and pith. Ind. Crops Prod.. 2016;93:48-57.
- [CrossRef] [Google Scholar]
- Preparation and characterization of sodium carboxymethyl cellulose/cotton linter cellulose nanofibril composite films. Carbohydr. Polym.. 2015;127:101-109.
- [CrossRef] [Google Scholar]
- Synthesis of cellulose nanocrystals (CNCs) from cotton using ultrasound-assisted acid hydrolysis. Ultrason. Sonochem.. 2021;70
- [CrossRef] [Google Scholar]
- Cellulose crystallinity index: measurement techniques and their impact on interpreting cellulase performance. Biotechnol. Biofuels.. 2010;3:1-10.
- [CrossRef] [Google Scholar]
- Mechanical properties and water absorption behaviour of durian rind cellulose reinforced poly (lactic acid) biocomposites. International Journal on Advanced Science, Engineering and Information Technology.. 2015;5(5):343-349.
- [Google Scholar]
- Nanocellulose: Recent trends and applications in the food industry. Food Hydrocolloids.. 2022;127
- [CrossRef] [Google Scholar]
- Extraction of cellulose nanocrystals from areca waste and its application in eco-friendly biocomposite film. Chemosphere.. 2022;287:132084
- [CrossRef] [Google Scholar]
- Novel process for isolation of major bio-polymers from Mentha arvensis distilled biomass and saccharification of the isolated cellulose to glucose. Ind. Crops Prod.. 2018;119:1-8.
- [CrossRef] [Google Scholar]
- Preparation and characterisation of cellulose nanofibres. J. Mater. Sci.. 2011;46(18):6029-6045.
- [CrossRef] [Google Scholar]
- Areca nut fiber nano crystals, clay nano particles and PVA blended bionanocomposite material for active packaging of food. Appl. Nanosci.. 2022;12(3):295-307.
- [CrossRef] [Google Scholar]
- Isolation and Characterization of Cellulose Nanocrystals from Date Palm Waste. ACS Omega.. 2022;7(29):25366-25379.
- [CrossRef] [Google Scholar]
- Characterization of cellulose nanocrystals prepared by different delignification methods and application of ultra-light, hydrophobic aerogels as oil absorbent in food systems. Ind. Crops Prod.. 2023;197:116653
- [CrossRef] [Google Scholar]
- Cellulose whiskers reinforced polyvinyl alcohol copolymers nanocomposites. Eur. Polym. J.. 2008;44(8):2489-2498.
- [CrossRef] [Google Scholar]
- Cellulose nanowhiskers from coconut husk fibers: Effect of preparation conditions on their thermal and morphological behavior. Carbohydr. Polym.. 2010;81(1):83-92.
- [CrossRef] [Google Scholar]
- Chlorine-free extraction of cellulose from rice husk and whisker isolation. Carbohydr. Polym.. 2012;87(2):1131-1138.
- [CrossRef] [Google Scholar]
- Screening and optimization of pretreatments in the preparation of sugarcane bagasse feedstock for biohydrogen production and process optimization. Int. J. Hydrogen Energy.. 2018;43(25):11470-11483.
- [CrossRef] [Google Scholar]
- Hydrothermal pretreatment technologies for lignocellulosic biomass: A review of steam explosion and subcritical water hydrolysis. Chemosphere.. 2021;284:131372
- [CrossRef] [Google Scholar]
- High yield production of nanocrystalline cellulose from corn cob through a chemical-mechanical treatment under mild conditions. Int. J. Biol. Macromol.. 2023;240:124327
- [CrossRef] [Google Scholar]
- NIR FT Raman Spectroscopy–a Rapid Analytical Tool for Detecting the Transformation of Cellulose Polymorphs. Cellulose.. 2001;8(1):49-57.
- [CrossRef] [Google Scholar]
- Preparation and characterization of high yield cellulose nanocrystals (CNC) derived from ball mill pretreatment and maleic acid hydrolysis. Carbohydr. Polym.. 2020;234
- [CrossRef] [Google Scholar]
- Extraction of cellulose nanocrystals from mengkuang leaves (Pandanus tectorius) Carbohydr. Polym.. 2012;88(2):772-779.
- [CrossRef] [Google Scholar]
- Insights into thermal degradation kinetics and liquid crystalline behavior of cellulose nanocrystals from the waste of Cajanus cajan (pigeon pea) Int. J. Biol. Macromol.. 2023;242:124507
- [CrossRef] [Google Scholar]
- Microfibrillated cellulose and new nanocomposite materials: a review. Cellulose.. 2010;17(3):459-494.
- [CrossRef] [Google Scholar]
- Determination of structural carbohydrates and lignin in biomass. Laboratory Analytical Procedure.. 2008;1617(1):1-16.
- [Google Scholar]
- Valorization of industrial paper waste by isolating cellulose nanostructures with different pretreatment methods. Resour. Conserv. Recycl.. 2019;143:133-142.
- [CrossRef] [Google Scholar]
- Effect of cellulose nanocrystals from sugarcane bagasse on whey protein isolate-based films. Food Res. Int.. 2018;107:528-535.
- [Google Scholar]
- Isolation and characterization of cellulose from sugarcane bagasse. Polym. Degrad. Stab.. 2004;84(2):331-339.
- [CrossRef] [Google Scholar]
- Extraction of cellulose nano-crystals from old corrugated container fiber using phosphoric acid and enzymatic hydrolysis followed by sonication. Carbohydr. Polym.. 2015;125:360-366.
- [CrossRef] [Google Scholar]
- Sugarcane bagasse whiskers: Extraction and characterizations. Ind. Crops Prod.. 2011;33(1):63-66.
- [CrossRef] [Google Scholar]
- Sulfonation of dialdehyde cellulose extracted from sugarcane bagasse for synergistically enhanced water solubility. Carbohydr. Polym.. 2019;208:314-322.
- [CrossRef] [Google Scholar]
- An overview on bioethanol production from lignocellulosic feedstocks. Chemosphere. 2020;242:125080
- [CrossRef] [Google Scholar]
- Production routes to tailor the performance of cellulose nanocrystals. Nature Reviews Materials.. 2021;6(2):124-144.
- [CrossRef] [Google Scholar]
- Nanocellulose and microcrystalline cellulose from agricultural waste: Review on isolation and application as reinforcement in polymeric matrices. Food Hydrocolloids.. 2021;118
- [CrossRef] [Google Scholar]
- Isolation of cellulose nanocrystals from different waste bio-mass collating their liquid crystal ordering with morphological exploration. Int. J. Biol. Macromol.. 2021;175:242-253.
- [CrossRef] [Google Scholar]
- Preparation and Characterisation of Cellulose Nanocrystal from Sugarcane Peels by XRD, SEM and CP/MAS 13C NMR. J. Phys. Conf. Ser.. 2019;1299(1):012123
- [CrossRef] [Google Scholar]
- Reuse of waste cotton cloth for the extraction of cellulose nanocrystals. Carbohydr. Polym.. 2017;157:945-952.
- [CrossRef] [Google Scholar]
- Comparative study of alkali-soluble hemicelluloses isolated from bamboo (Bambusa rigida) Carbohydr. Res.. 2011;346(1):111-120.
- [CrossRef] [Google Scholar]
- Characterisation of thermally modified hard- and softwoods by 13C CPMAS NMR. Carbohydr. Polym.. 2004;58(4):461-466.
- [CrossRef] [Google Scholar]
- Nanocellulose prepared by acid hydrolysis of isolated cellulose from sugarcane bagasse. IOP Conf. Ser.: Mater. Sci. Eng.. 2016;107(1):012045
- [CrossRef] [Google Scholar]
- Cellulose I and II nanocrystals produced by sulfuric acid hydrolysis of Tetra pak cellulose I. Carbohydr. Polym.. 2018;192:184-192.
- [CrossRef] [Google Scholar]
- Preparation and characterization of bamboo nanocrystalline cellulose. BioResources.. 2012;7(2):1802-1812.
- [Google Scholar]
- Cellulose fibers isolated from energycane bagasse using alkaline and sodium chlorite treatments: Structural, chemical and thermal properties. Ind. Crops Prod.. 2015;76:355-363.
- [CrossRef] [Google Scholar]
- Extraction and comparison of carboxylated cellulose nanocrystals from bleached sugarcane bagasse pulp using two different oxidation methods. Carbohydr. Polym.. 2016;138:237-243.
- [CrossRef] [Google Scholar]
- Water-resistant nanopaper with tunable water barrier and mechanical properties from assembled complexes of oppositely charged cellulosic nanomaterials. Food Hydrocolloids.. 2021;120
- [CrossRef] [Google Scholar]
- Effects of low frequency multi-mode ultrasound and it’s washing solution’s interface properties on freshly cut cauliflower. Food Chem.. 2022;366
- [CrossRef] [Google Scholar]
Appendix A
Supplementary material
Supplementary data to this article can be found online at https://doi.org/10.1016/j.arabjc.2024.105841.
Appendix A
Supplementary material
The following are the Supplementary data to this article:Supplementary Data 1
Supplementary Data 1


