

Translate this page into:
Constructing a label-free electrochemical biosensor based on magnetic α-Fe2O3/Fe3O4 heterogeneous nanosheets for the sensitive detection of VKORC1*2 gene
⁎Corresponding authors. ksdaweihe@163.com (Dawei He), luckystar_lrj@ujs.edu.cn (Ruijiang Liu)
-
Received: ,
Accepted: ,
This article was originally published by Elsevier and was migrated to Scientific Scholar after the change of Publisher.
Abstract
Pharmacogenetic testing technology can effectively determine the individual differences among patients and scientifically assist doctors to select the most suitable drugs for each patient. In this study, an electrochemical biosensor based on magnetic α-Fe2O3/Fe3O4 heterogeneous nanosheets was constructed to detect Vitamin K epoxide reductase complex 1 type AA (VKORC1*2). Firstly, we fabricated magnetic α-Fe2O3/Fe3O4 heterogeneous nanosheets as the substrate material for electrochemical biosensors. Subsequently, the material surface was modified with Au nanoparticles to facilitate the connection of sensing probes and enhance current signal amplification. The electrochemical biosensor showed a negative linear relationship with the concentrations of target DNA (tDNA, VKORC1*2 gene) within 1 pM − 1 μM, a limit of detection was (LOD) = 0.36 pM, and a limit of quantification was (LOQ) = 1.19 pM. The biosensor demonstrated exceptional specificity, reproducibility, and stability. In real sample analysis, it exhibited a recovery range of 96.63 % − 110.57 % (RSD ≤ 3.07 %) for various tDNA concentrations, thereby indicating its promising potential in clinical diagnostics.
Keywords
Electrochemical biosensor
Magnetic α-Fe2O3/Fe3O4 heterogeneous nanosheets
Magnetic self-assembly
ssDNA probes
VKORC1*2

1 Introduction
Pharmacogenetic testing utilizes molecular biology technology to detect patients' drug-related genes, clarify the genetic differences of different populations, predict patients' responses to various drugs and the extents of adverse reactions, and scientifically assist doctors to select the most suitable medications for patients. As an oral anticoagulant (Liu et al., 2022b), warfarin is widely used in thromboembolic diseases such as phlebitis (Chang et al., 2023), pulmonary embolism (Zheng et al., 2024), atrial fibrillation (Erhard et al., 2024), recurrent stroke (Benz et al., 2023), etc. It is chosen as the preferred drug for oral anticoagulation therapy due to its long duration of action, ease of administration, relatively few side effects, and low price.
However, warfarin is characterized by a narrow therapeutic window and significant individual disparities, overdoses can lead to bleeding problems of varying degrees (Kang et al., 2023). Approximately 15.2 % of patients take the drug experience blood side effects each year, including fatal hemorrhages in 3.5 % of cases. There are a number of the known factors to affect warfarin dosage, including age, race, food, co-medication, co-morbidities, etc., with genetic factors being particularly prominent (Deng et al., 2023; Jahmunah et al., 2023; Kim et al., 2023).
There are a number of genes associated with the dosage of warfarin administration, therein the determining factor is a genetic polymorphism in the VKORC1 gene (Biswas et al., 2022; Sun et al., 2023). The VKORC1 gene serves as the rate-limiting enzyme in the production of vitamin K-dependent coagulation factor, and warfarin exerts its drug action by inhibiting this enzyme, thereby affecting the catalytic process of vitamin K (Wallin et al., 2008). In addition, it has been found that the effect of SNP −1639 G > A, a significant predictor for warfarin dosage, is manifested in the VKORC1*2 haplotype (Oldenburg et al., 2007). Therefore, a simple, low cost, sensitive and effective method to detect VKORC1*2 is of great importance to guide the precision medicine of warfarin.
At present, polymerase chain reaction (PCR) is the mainly means used to detect VKORC1 gene, which detects the mutations at sequence sites by amplifying DNA fragments (Altawil and Youssef, 2023; Zhou et al., 2023). Since its discovery, PCR technology has been widely developed in the fields of biological sciences, medicine and genetics by virtue of its high sensitivity and strong specificity (Fang et al., 2024; Han et al., 2024; Liang et al., 2024). However, because PCR reactions are extremely sensitive to temperature changes, this brings the risk of errors accompanying each cycle of the amplification process. In addition, the high cost of equipment and reagents required for PCR technology, as well as the strict specification for the experimental environment are significant factors that limit its applications (Lim et al., 2024; Ma et al., 2024). Additionally, in situ hybridization (ISH) is also a commonly used method for detecting target genes. It can directly detect gene abnormalities within the cell nucleus, but it still has the disadvantages of being expensive and having low throughput. Interestingly, Sang et al. proposed a method for detecting VKORC1 using a magnetoelastic biosensor (Sang et al., 2020). Biosensors are capable of converting signals expressed by biologically active substances into electrical signals, thus realizing qualitative or quantitative detection of the target analyte (Reja et al., 2024). Biosensors consist of sensing element and transducer. Sensing element includes biologically active substances such as enzymes, antibodies, nucleic acids and cells, among which ssDNA probes are the most classical type of recognition probes, which are widely applied in the preparations of gene sensors (Shoute et al., 2023; Stangherlin and Liu, 2023). Biosensors can be categorized into optical, acoustic wave channel, thermal, electrochemical types based on the different detection principles of sensors (Herrera-Domínguez et al., 2023; Huang et al., 2024; Tang et al., 2023; Wang and Lou, 2023; Zhang et al., 2024b). Among them, electrochemical biosensors have been widely developed in the fields of materials science, chemistry, and biomedicine due to their simplicity, low cost, and sensitivity (Goel et al., 2024; Su et al., 2024; Zhang et al., 2024a).
In recent years, many new nanomaterials have been invented and widely applied to promote the early diagnosis, medical treatment, and prognosis of major diseases (Geng et al., 2018; Guo et al., 2023; Lai et al., 2017; Tan et al., 2019; Wang et al., 2021; Yu et al., 2023). Among them, magnetic nanomaterials are widely employed in biomedical applications because of their excellent biosafety and unique magnetic properties. Specifically, iron oxide nanomaterials can induce multiple biological effects, such as localized magnetic fields, thermal effects, and enhancing enzyme-like activities under the influence of a magnetic field, which facilitates the realization of real-time, non-invasive, and precise modulation of molecular interactions at the nanoscale while also provides a new pathway to achieve efficient treatment of major diseases (Liu et al., 2022a; Yan et al., 2023). Especially, magnetic α-Fe2O3 and Fe3O4 nanomaterials are the most widely used nanomaterials in biomedical research. However, single iron oxide nanomaterials exhibit either excessively strong or insufficient magnetic properties, rendering them inadequate for meeting the diverse requirements of magnetic strength in numerous applications (Ni et al., 2023). Therefore, magnetic α-Fe2O3/Fe3O4 heterogeneous nanomaterials emerge suitable magnetic properties by partially reducing Fe3+ to Fe2+ through high temperature calcination using a reducing agent, controlling the magnitude of the nanomaterials’ magnetic force (Wang et al., 2023), because the suitable magnetic properties enable nanomaterials to complete the process of binding, delivery, or separation under the influence of an external magnetic field, which is more conducive to subsequent applications.
Subsequently, the surface modification of inorganic nanomaterials with precious metals has been widely used to further expand the application field of inorganic nanomaterials, and Au nanoparticles are favored for this purpose due to their ability to form Au-S bond with compounds modified with sulfhydryl groups. In addition, the morphology of magnetic nanomaterials has a significant impact on their properties. Two-dimensional nanomaterials mainly include nanorods, nanoflakes, nanotubes, and so on. Among them, the nanosheets can better reduce the resistance of spatial sites during electron transfer, and they can facilitate the contact between the active substance and electrolyte to amplify the current signal. Therefore, magnetic α-Fe2O3/Fe3O4 heterogeneous nanosheets are considered as excellent immobilization materials for electrochemical biosensors (Ahmadi-Sangachin et al., 2023; Majee and Bhattacharyya, 2024).
To sum up, a label-free electrochemical biosensor based on the magnetic α-Fe2O3/Fe3O4 heterogeneous nanosheets for the detection of VKORC1*2 was presented, which could be used to regulate the dosage of warfarin medication in time and ensure the safety of medication. The biosensor utilized the magnetic properties of the matrix material for self-assembling the sensor probes onto the magnetic glassy carbon electrode (MGCE), the process cannot damage the electrode and can make it recyclable. And then the sensitivity, linearity, detection limit, specificity and stability of electrochemical biosensor were subsequently investigated.
2 Materials and methods
2.1 Chemicals and reagents
KCl (≥99.5 %), K3Fe(CN)6 (≥99.5 %), K4Fe(CN)6⋅3H2O (≥99.5 %), TCEP (≥98.0 %), KH2PO4 (≥99.5 %), Na2HPO4 (≥99.0 %), FeCl3⋅6H2O (≥99.0 %), C6H12O6⋅H2O (≥99.6 %), poly ethyleneimine (PEI, ≥99.0 %), NaBH4 (≥98.0 %), HAuCl4⋅4H2O (≥47.8 %), C6H5Na3O7 (≥99.0 %) were purchased from Sinopharm Chemical Reagent Co. Ltd. (Shanghai, China); NaCl (≥99.0 %) was purchased from Chengdu Kelong chemical reagent factory (Sichuan, China); CH3CH2OH (≥99.7 %) was from Chengdu cologne chemical co., Ltd. (Sichuan, China); Bovine serum albumin (BSA, 96.0 %) was from Shanghai Huzheng Biotech Co. Ltd.; TE buffer (pH = 8) and PBS buffer (20 nM, pH = 7.4) were configured with reference to publicly available methods; The DNA oligonucleotides were obtained from Sangon Biotech (Shanghai, China); and all experiments in this project used ultrapure water (18.2 MΩ);
2.2 Preparation of magnetic α-Fe2O3/Fe3O4 heterogeneous nanosheets
Magnetic α-Fe2O3/Fe3O4 heterogeneous nanosheets were fabricated by hydrothermal and calcination reduction method. Typically, FeCl3 and NaH2PO4 were added in 80 mL deionized water, obtaining a uniform solution with the initial concentrations of 25 mM FeCl3 and 7.5 mM NaH2PO4 after magnetic stirring at room temperature. The solution was transferred to a hydrothermal kettle, and hydrothermally reacted at 220 °C for 24 h in a programmed temperature-controlled furnace. And then the dark-red solution was obtained, and it was washed several times by centrifugation using deionized water and anhydrous ethanol alternately until the supernatant was clear. Subsequently, the resulting product was dried in an oven, and ground to obtain the solid powder of precursor α-Fe2O3 nanosheets.
In the second step, glucose was used as a reducing agent to partially reduce precursor α-Fe2O3 into Fe3O4. Precursor α-Fe2O3 was mixed with glucose in a crucible at a mass ratio of 1:12, and then the crucible was transferred to a programmed temperature-controlled furnace for calcination at 600 °C for 4 h, a deep-red product of magnetic α-Fe2O3/Fe3O4 heterogeneous nanosheets with a saturation magnetization intensity of 25.1 emu/g, average particle size of 230 nm, and average thickness of 120 nm was obtained.
2.3 Surface modification of substrate materials
An improved method of HAuCl4 reduction by NaBH4 was used to modified the surface of magnetic α-Fe2O3/Fe3O4 heterogeneous nanosheets. First, a cross-linking agent PEI needed to be coated on the surface of the magnetic nanosheets before coating the modified material. PEI solution was made by mixing 1.5 g PEI and 150 mL ultrapure water, then 50 mg α-Fe2O3/Fe3O4 heterogeneous nanosheets were added and mixed by ultrasonication for 30 min. The suspension was transferred to a round-bottomed flask and stirred at 90 °C in a constant temperature water bath for 2 h. After the solution was naturally cooled to room temperature, which was centrifugally washed with ultrapure water and dried under vacuum at 60 °C to obtain α-Fe2O3/Fe3O4-PEI.
Subsequently, 15 mg of solid α-Fe2O3/Fe3O4-PEI was ground and then mixed with 150 mL ultrapure water, sonicated for 10 min and transferred to an ice bath sonication environment. The suspension was sonicated for 30 min in an ice bath after adding 1 mL HAuCl4 solution (20 mg/mL) to the suspension, and then the ready-made C6H5Na3O7 and NaBH4 solutions were dropped in sequence, keeping mechanical stirring for 1 min and 15 min, respectively. Finally, it could be observed that the solution turned to atropurpureus, and the resulting product was magnetically separated and dried under vacuum at 60 °C, solid α-Fe2O3/Fe3O4@Au nanocomposites were obtained after grind.
2.4 Construction of electrochemical biorecognition probes and binding of VKORC1*2
This electrochemical biosensor was constructed using the traditional drop-casting method, and the construction mechanism was shown in Scheme 1A. Special attention should be paid to the fact that the next constructing and binding processes were realized in EP tubes. Magnetic α-Fe2O3/Fe3O4@Au nanocomposites were dispersed in ultrapure water to obtain a suspension with the concentration of 10 mg/mL, which was used for the construction. Moreover, the disulfide bonds of sulfhydryl-modified single-stranded DNA (5′-SH-AACAGAGGATAGCCCAGGT-3′) needed to be eliminated before binding to the matrix material, which was mixed with TCEP at a molar ratio of 1:100 and reacted at 37 °C for 1 h. The ssDNA probe solution (1 μM, 30 μL) was mixed with 0.3 mg magnetic α-Fe2O3/Fe3O4@Au nanocomposites to form a suspension, which was incubated at 4 °C for 12 h. With the aid of magnetic separation, the unbound ssDNA probes were washed away using PBS buffer, α-Fe2O3/Fe3O4@Au/ssDNA was obtained. To block the non-specific site, the bull serum albumin (BSA) solution (30 μL) was added, and then the incubation was carried out at 37 °C for 30 min, and the superfluous BSA was washed off with PBS buffer, α-Fe2O3/Fe3O4@Au/ssDNA/BSA was obtained. Finally, after removing the disulfide bonds using the above same method as before, 1 μM of target DNA (tDNA, i.e. VKORC1*2, 5′-ACCTGGGCTATCCTCTGTT-3′) (30 μL) was added. Suspension was transferred to a water-bath shaker with repeated oscillations at 37 °C for 20 min, the α-Fe2O3/Fe3O4@Au/ssDNA/BSA/tDNA was obtained after the unbound tDNA was washed away using PBS buffer.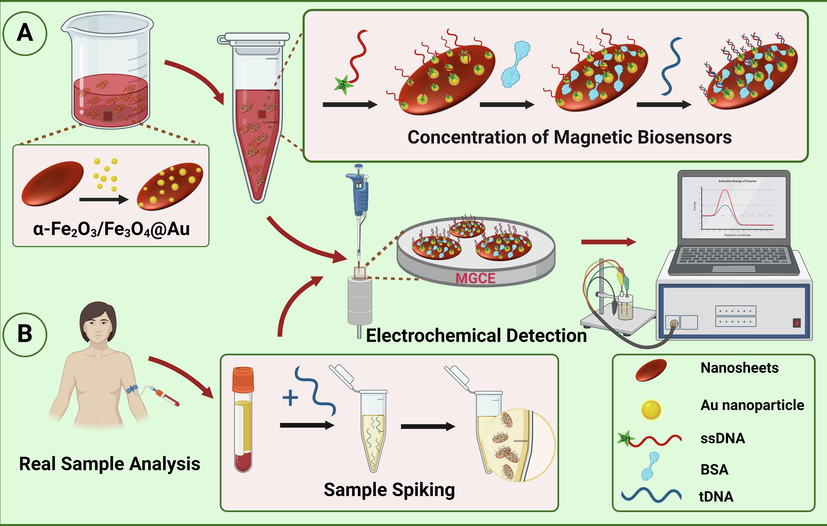
Schematic diagram of the electrochemical biosensor based on magnetic α-Fe2O3/Fe3O4 nanosheets for detecting VKORC1*2 gene (A), and testing in real sample analysis (B).
2.5 Construction of the electrochemical biosensor for VKORC1*2
Firstly, the modified glassy carbon electrodes (MGCE) were polished using 1 μm, 0.3 μm, and 0.05 μm alumina slurry, cleaned and dried for use. The obtained solids after all modifications were washed with PBS buffer, and then re-eddied using ultrapure water to obtain a suspension with a concentration of 10 mg/mL. 9 μL suspension was dropped onto the treated MGCE surface, then moved into an oven for drying at 30 °C to complete the drop construction process. Cyclic voltammetry (CV) and electrochemical impedance spectroscopy (EIS) were used to validate the step-by-step construction of electrochemical biosensors. The constructed biosensors were subjected to optimize conditions and analyze performances by differential pulse voltammetry (DPV). The biosensor was validated by current signal or impedance strength both in the construction as well as in the detection of the VKORC1*2 gene. Therefore, this biosensor was recognized as a label-free electrochemical biosensor.
2.6 Detection of spiked human serum
The collected blood samples were placed in test tubes those did not contain anticoagulant. Natural agglutination was carried out at room temperature for 0.5 h – 1.0 h, and bringing the blood to coagulate. Coagulated blood was centrifuged at 2000 – 3000 rpm for 5 min – 10 min to obtain the supernatant as serum. The serum was taken out separately and stored at -20 °C in equal volumes (10 μL).
10 μL of serum was diluted 20-fold by PBS (20 mM, pH = 7.4) buffer, and the target DNA samples were diluted to different concentrations (0.1 nM, 1 nM, and 10 nM) by diluted serum of human serum assay for the constructed electrochemical biosensor. Particularly, serum sample assay values were subtracted as blanks throughout the analysis and calculation processes due to the uncertainty of the initial VKORC1*2 gene concentrations in human serum samples.
3 Results and discussion
3.1 Characterizations of α-Fe2O3/Fe3O4 heterogeneous nanosheets and α-Fe2O3/Fe3O4@Au nanocomposites
The TEM image of magnetic α-Fe2O3/Fe3O4 heterogeneous nanosheets was displayed in Fig. 1A, where a round sheet-like morphology could be seen, and their average diameter and thickness were approximately 230 nm and 130 nm, respectively. The smaller the size of the nanosheets was, the larger their specific surface area was, thereby which could render them more conducive to enhancing the detection performance of electrochemical biosensors. (Eissa et al., 2020; Perevezentseva et al., 2023). In addition, Fig. 1B showed the TEM image of α-Fe2O3/Fe3O4@Au nanocomposites, there were black dots on the surface of the nanosheets, which might be Au nanoparticles. The hysteresis loops of α-Fe2O3/Fe3O4 and α-Fe2O3/Fe3O4@Au were shown in Fig. 1C, discovering that the magnetic properties of the Au-modified nanosheets were reduced but still exhibit superparamagnetism, which did not affect subsequent applications. To study the phase composition of α-Fe2O3/Fe3O4 and α-Fe2O3/Fe3O4@Au, which were characterized using XRD (Fig. 1D). The pattern (green) corresponded to the standard cards of α-Fe2O3 (JCPDS NO.33–0664) and Fe3O4 (JCPDS NO.19–0629), and it was found that the diffraction peaks at 24.1°, 33.2°, 35.5° and 30.1°, 35.4° had corresponding crystal faces. In addition, the curve (purple) not only corresponded to the standard cards of α-Fe2O3 and Fe3O4, but also had distinct Au (JCPDS NO.04–0784) characteristic peak. These analytical results demonstrated the successful preparation of α-Fe2O3/Fe3O4 and α-Fe2O3/Fe3O4@Au, and supported the conclusions from the TEM images (Zhang et al., 2024b). In addition, a diffraction peak existed at about 2θ angles for 26°, which might be residual carbon from the reduction process (Li et al., 2024). Furthermore, the EDS pattern (Fig. 1E) of α-Fe2O3/Fe3O4@Au showed that the Au content in the nanocomposites was 32.87 %, which once again proved the success of the noble metal Au-modified nanomaterials surface.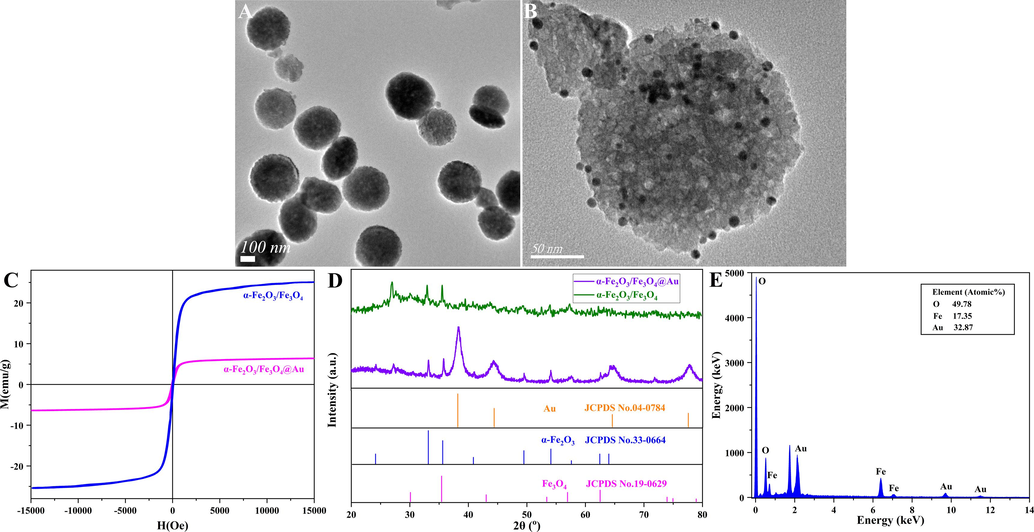
TEM images of magnetic α-Fe2O3/Fe3O4 heterogeneous nanosheets (A) and magnetic α-Fe2O3/Fe3O4@Au nanocomposites (B); the hysteresis loops (C), XRD patterns (D) of magnetic α-Fe2O3/Fe3O4 heterogeneous nanosheets and magnetic α-Fe2O3/Fe3O4@Au nanocomposites; EDS pattern (E) of Fe3O4/α-Fe2O3@Au.
To further investigate the compose of magnetic α-Fe2O3/Fe3O4 heterogeneous nanosheets, the High Resolution Transmission Electron Microscope (HRTEM) image, the UV–vis Diffuse Reflectance Spectroscopy (UV–vis DRS) spectrum, and the X-ray Photoelectron Spectroscopy (XPS) survey were analyzed. The HRTEM image of the magnetic α-Fe2O3/Fe3O4 heterostructure nanosheets was demonstrated in Fig. 2A, where the distinct and well-organized lattice fringes indicated that the nanosheets were well crystallized. The lattice fringes of the heterogeneous nanosheets were measured with widths of 0.272 nm and 0.297 nm, corresponding to the crystallographic planes of α-Fe2O3 at 33.15° (1 0 4) and Fe3O4 at 30.10° (2 2 0), respectively, which corroborated the previous XRD analysis. Fig. 2B showed the absorbance property of the prepared magnetic α-Fe2O3/Fe3O4 heterogeneous nanosheets was measured using UV–vis DRS. It could be observed that the sample exhibited a broad band in the visible region from 250 to 600 nm with a pronounced absorbance at 500 nm, which could be attributed to the d-d jump of Fe. The inset showed the forbidden bandwidth (i.e., bandgap) of the measured sample calculated using the “Tauc plot” method, where the contraction of the bandgap facilitated the electron jumps, and thus enhanced the sensing performance (Galvão et al., 2023; Han et al., 2023).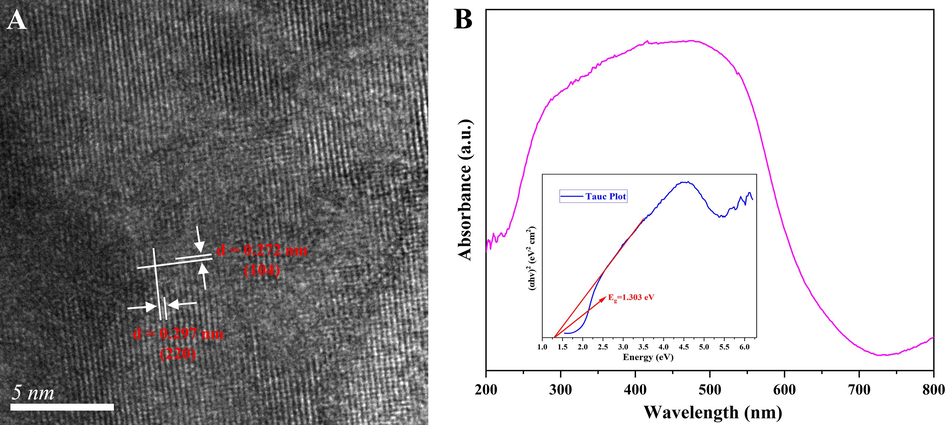
The HRTEM image (A) and the UV–vis DRS spectrum (B) of magnetic α-Fe2O3/Fe3O4 heterogeneous nanosheets.
Since the entire XPS analysis process was performed in an ultravacuum environment (8.9 × 10⁻⁹ torr), all α-Fe2O3/Fe3O4 surfaces were irradiated with monochromatic Al Kα radiation (hν = 1486.6 eV) in the received state and with an electron emission angle of 90°. The samples were sputtered and etched using an Ar + source with an energy level of 3.8 kV and an incidence angle of 45° before analysis. The size of the sample analysis area was 0.3 mm × 0.7 mm, and a charge neutralization gun was used during the XPS analysis in order to mitigate charge effects (Yue et al., 2024). Fig. 3A showed the full spectrum of the original derived XPS measurement, labeling all peaks associated with the chemical structure of the element. Three of the peaks in the spectrum represented the core elements (Fe 2p, O 1s, C 1s), so peaks of the three elements were fitted. The calibrated high-resolution XPS narrow spectrum of the Fe 2p region showed two well-defined peaks at 711.38 eV and 724.98 eV corresponding to Fe 2p3/2 and Fe 2p1/2 in Fig. 3B. In addition, the satellites’ presence of Fe 2p3/2 and Fe 2p1/2 at 718.68 eV and 732.98 eV was also found in Fig. 3B (Sat.). After Gaussian-Lorentzian fitting of the elemental peaks of Fe 2p, the B.E. at 713.28 eV and 737.08 eV corresponded to Fe(III), while the subpeaks located between at 711.08 eV and 724.68 eV were determined to belong to Fe(II), which suggested the formation of a composite nanomaterial composed of Fe(II) and Fe(III). The O 1s fitting spectra were shown in Fig. 3C with three peaks at 530.18 eV, 531.48 eV, and 532.98 eV, which were mainly associated with Fe-O, C-O/O-C, FexOy and H2O.The C 1s fitting spectra were displayed in Fig. 3D, with distinct peaks appeared at 284.78 eV corresponding to the C-C/C-H group, and 258.88 eV corresponding to the C-O group. There was also a peak at 288.98 eV corresponding to the O-C=O functional group (El-Fattah et al., 2024; Kwon et al., 2022).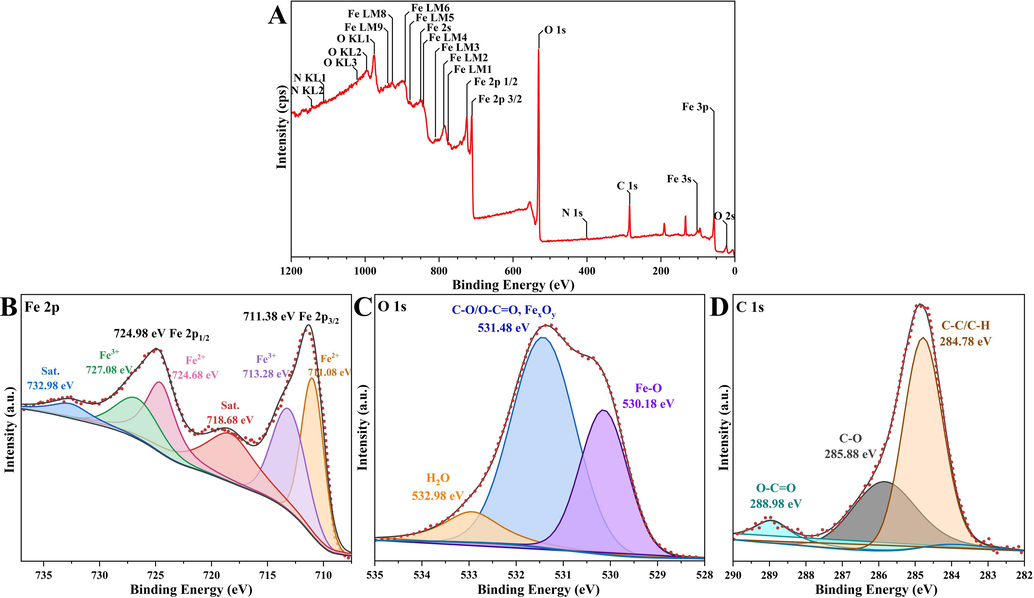
The XPS survey (A) and Fe 2p (B), O 1s (C), and C 1s (D) core-level spectra of magnetic α-Fe2O3/Fe3O4 heterogeneous nanosheets.
3.2 Monitor of the construction process for the electrochemical biosensor
CV and EIS were used to monitor the biosensor during its step-by-step constructions, and the electron transport rate and surface impedance characteristics of each step for the modified electrodes were analyzed. As shown in Fig. 4A, the current intensity of curve b was significantly lower than that of the bare electrode (curve a). The reason for that was the increase of steric resistance of the electrode led to a decrease in current when magnetic α-Fe2O3/Fe3O4 heterogeneous nanosheets were added. As the electrode was modified by magnetic α-Fe2O3/Fe3O4@Au nanocomposites (curve c), the current rapidly increased due to the high conductivity of Au nanoparticles, effectively improving the efficiency of electron transfer (Saber Mirzaei et al., 2024). The current in curve d showed a clear downward trend, the reason was that the addition of the ssDNA probes made [Fe(CN)6]3-/4- redox probes difficult to reach the electrode surface, meaning the increase of the spatial potential resistance (Ye et al., 2024). There was no significant change in the current after adding BSA blocker (curve e) compared with curve d. This phenomenon might be attributed to the insignificance of nonspecific sites, which made the blocking effect of BSA less apparent (Luo et al., 2024). Curve f represented the current after capturing the tDNA (VKORC1*2), which showed a minimum compared with the other modified electrodes. This reason was taht the addition of tDNA increased the steric hindrance, and electrostatic repulsion took place between the negatively charged phosphate skeleton of tDNA and [Fe(CN)6]3-/4-, which also indicated that the ssDNA probes successfully trapped the tDNA.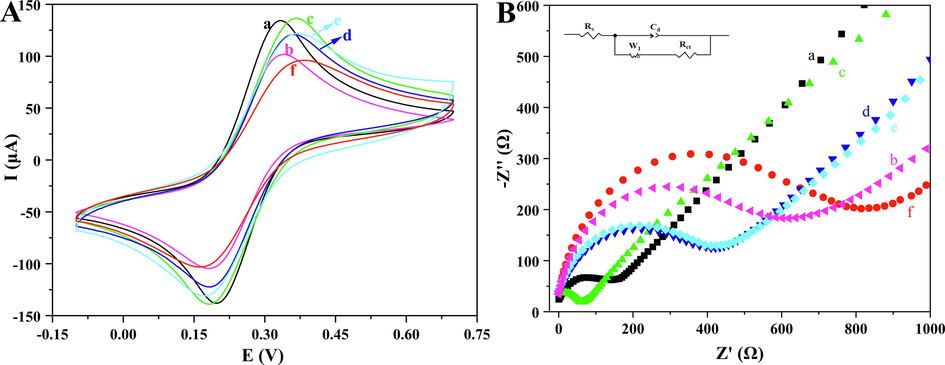
CV (A) and EIS (B) of differently modified electrodes: bare MGCE (a), MGCE/α-Fe2O3/Fe3O4 (b), MGCE/α-Fe2O3/Fe3O4@Au (c), MGCE/α-Fe2O3/Fe3O4@Au/ssDNA (d), MGCE/α-Fe2O3/Fe3O4@Au/ssDNA/BSA (e), MGCE/α-Fe2O3/Fe3O4@Au/ssDNA/BSA/tDNA (f).
In addition, to further verified the successful construction of the proposed electrochemical biosensor, EIS spectra and Randle’s equivalent circuit were investigated. In the EIS spectra, a larger semicircle of the Nyquist plot indicated a higher resistance, and the diffusion of [Fe(CN)6]3-/4- redox probe was limited. The EIS spectra of the electrodes at all modification steps were shown in Fig. 4B, and the change in semicircle diameter was consistent with the trend of current change in the CV plot, which confirmed the successful construction of the biosensor. The circuit parameters were extracted after Randle’s equivalent circuit fitting of the experimental data. In the equivalent circuit, Rs, Rct, W1, and Cd stood for solution resistance, charge transfer resistance, Warburg element, and the constant phase element, respectively. The kinetic parameters for all electrode modification steps were listed in Table 1, and the trend of Rct was consistent with CV and EIS. The time constant τ (calculated in the formula given in equation (1)) represented the diffusion rate of the [Fe(CN)6]3-/4- redox probe in the electrolyte, which lined with experimental expectations. In summary, it provided that the biosensor was successfully constructed and could effectively detect VKORC1*2 (Yadav et al., 2022; Yadav et al., 2021).
Electrode
Rct (Ω)
Rs (Ω)
Cd (μF)
W1 (σ)
τ (s)
Bare MGCE
145.1
140.3
0.842
0.469
122.18
MGCE/α-Fe2O3/Fe3O4
363.6
132.2
0.898
0.202
326.61
MGCE/α-Fe2O3/Fe3O4@Au
123.8
66.55
1.043
0.463
129.12
MGCE/α-Fe2O3/Fe3O4@Au-DNA
407.8
84.39
0.800
0.443
326.35
MGCE/α-Fe2O3/Fe3O4@Au-DNA/BSA
303.6
157.7
0.830
0.221
252.22
MGCE/α-Fe2O3/Fe3O4@Au-DNA/BSA/tDNA
680.8
90.78
0.883
0.385
601.3
The successful construction of this biosensor provided a novel line of development for clinical detection. Compared with other published research works on detection, this biosensor realized a magnetic self-assembly process based on magnetic α-Fe2O3/Fe3O4 heterogenous nanosheets and label-free sensitive detection (Hashem et al., 2022; Lv et al., 2022; Park et al., 2022). Moreover, throughout the course of this research, the raw materials required for matrix nanomaterial preparation were cost-effective and easily accessible. Additionally, gene was not needed to be amplified, and the damage inflicted upon the MGCE was minimal, so this biosensing strategy was low-cost.
3.3 Optimization of the construction conditions for the biosensor
There are four key parameters (the concentrations of α-Fe2O3/Fe3O4@Au and ssDNA probe, the incubation time and incubation temperature of tNDA) for electrochemical biosensor to detecte VKORC1*2, which were related to the sensitivity of biosensor detection.
Fig. 5A showed the line plot of the optimization process of α-Fe2O3/Fe3O4@Au concentration. The concentrations of the nanocomposites explored ranged from 5 mg/mL to 30 mg/mL, and it could be seen that the DPV current value was the largest when its concentration was 15 mg/mL. When the concentration of α-Fe2O3/Fe3O4@Au was too small, the current amplification effect of Au was not fully displayed. Additionally, the DPV value did not increase but decreased when the concentration exceeded 15 mg/mL, this increase in interface resistance might be attributed to the high-density of the nanocomposites (Zakariah et al., 2024). Therefore, 15 mg/mL was selected as the optimal concentration of α-Fe2O3/Fe3O4@Au.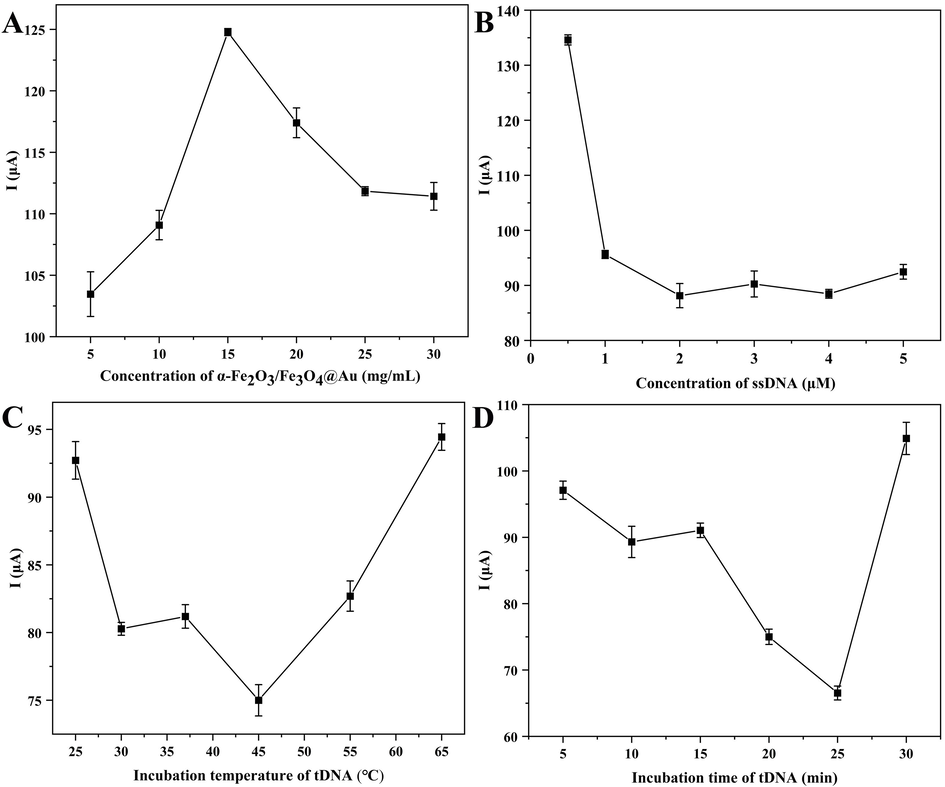
Optimization of the concentrations of α-Fe2O3/Fe3O4@Au (A) and ssDNA (B), incubation temperature (C) and time (D) of tDNA.
The influence of ssDNA probe concentration on detection performance was particularly important. The optimized data of the ssDNA probe concentration were shown in Fig. 5B, where it could be seen that the DPV currents levelled off after its concentration reached 2 μM. The reason might be that the ssDNA probes loaded onto the surface of the nanocomposite have reached a saturation state (Garcia-Melo et al., 2023). Therefore, 2 μM was selected as the optimal concentration of ssDNA probes for subsequent experiments.
The binding of tDNA to the ssDNA probes was related to the final detection of this biosensor, so the incubation temperature and incubation time were optimized (Alharthi et al., 2023). The variation of incubation temperature was shown in the Fig. 5C, and the overall trend of DPV values was downward when the temperature fell below 45 °C. However, the DPV value exhibited a rapid increase as the temperature exceeded 45 °C, potentially attributed the inactivation of tDNA at excessively high temperatures, thereby impeding its ability to bind with the probe. Similarly, the DPV values showed a downward trend when the incubation time was less than 25 min, but the DPV value increased significantly after 25 min (Fig. 5D). The reason for this phenomenon might be that too long incubation time would reduce the tDNA resistance activity. Thus, the optimal incubation temperature and incubation time were 45 ℃ and 25 min, respectively (Futra et al., 2023).
3.4 Performance analysis of the biosensors
To further validate the analytical performance of the proposed biosensor for the detection of VKORC1*2, different concentrations of tDNA were investigated under the other optimized conditions (Amouzadeh Tabrizi, 2023; Cai et al., 2023). As shown in Fig. 6A, the concentration of tDNA ranged from 1 pM − 1 μM, and the DPV value decreased with the increase of its concentration, which was consistent with the principle of the designed biosensor. In addition, DPV value was inversely proportional to the concentration of tDNA (Fig. 6B). The linear regression equation was I (μA) = 87.616 – 3.285 lgC (R2 = 0.996), a low limit of detection (LOD) reached 0.36 pM (LOD = 3σ/slope) and a limit of quantitation (LOQ) achieved 1.19 pM (LOQ = 10σ/slope). The DPV values for tDNA concentrations of 0.1 pM and 2 μM were also shown in Fig. 6B, it could be seen that the relationship was not linear, so it was determined that the linear range of the biosensor detection VKORC1*2 was 1 pM − 1 μM.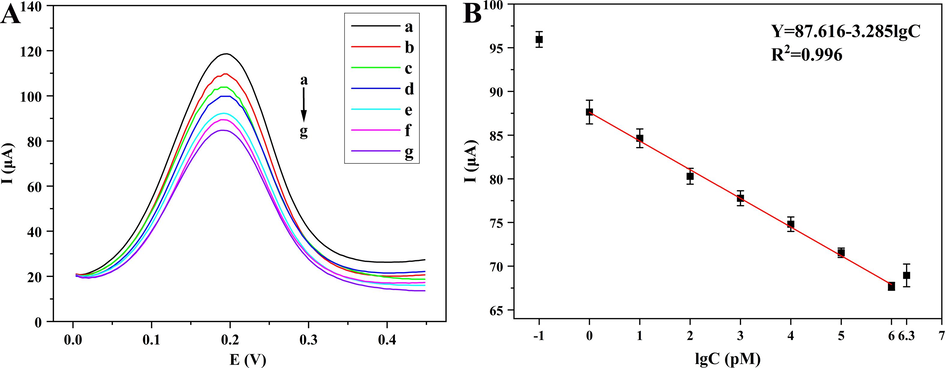
The DPV plots of the biosensor detecting various concentrations of tDNA (A): 1 pM (a), 10 pM (b), 100 pM (c), 1 nM (d), 10 nM (e), 100 nM (f), 1 μM (g), and the linear relationship between the current responses and tDNA (B).
3.5 Researches of selectivity, reproducibility and stability
To improve the accuracy of guiding the use for Warfarin, the selectivity of the proposed biosensor was determined, and the selectivity comparison experiments were performed using wild-type DNA and misaligned base DNA (SBM, DBM, TBM, and NC DNA) by DPV (the used DNA sequences were listed in Table 2). In Fig. 7A, ΔI = I-I1 was used to represent the current difference after tDNA binding, where I represented the measured value and I1 represented the α-Fe2O3/Fe3O4@Au/ssDNA/BSA probes current value. Analytical measurements revealed that only the DPV current value of the wild-type DNA group showed a decrease phenomenon upon binding to the probe, which proved that the biosensor only recognized wild-type tDNA, even with a single mismatched base. These results suggested that the proposed electrochemical biosensor could well identified specific DNA, and the electrochemical biosensor could be applied for clinical detection of VKORC1*2 gene (Wu et al., 2023).
Name
Sequence
SH-DNA (ssDNA)
5′-SH-AACAGAGGATAGCCCAGGT-3′
VKORC1*2 DNA (tDNA)
5′-ACCTGGGCTATCCTCTGTT-3′
SBM
5′-TCCTGGGCTATCCTCTGTT-3′
DBM
5′-TCCTGGGCTTTCCTCTGTT-3′
TBM
5′-TCCTGGGCTTTCCTCTGGT-3′
NC
5′-CGGCTCGCTCTTTGCCTGA-3′
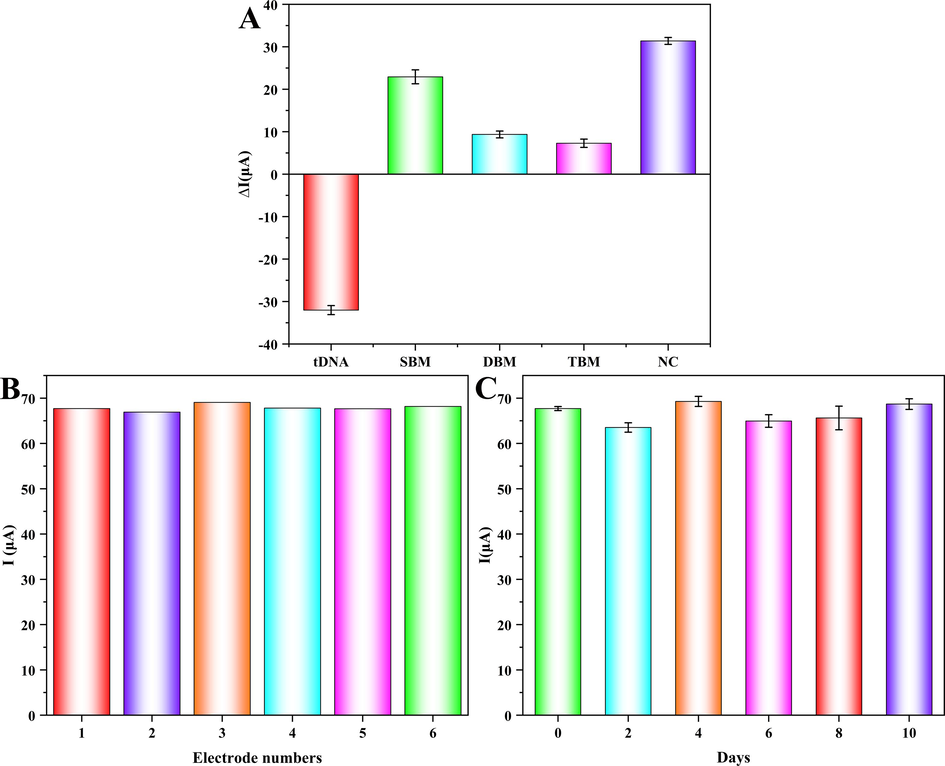
The selectivity (A), reproducibility (B), and stability (C) of the designed tDNA electrochemical biosensor.
To ensure the reproducibility of the biosensor, six different electrodes were used for comparative tests using the same manipulation (Fig. 7B). The RSD was only 1.04 % for six experiments, indicating excellent reproducibility of the biosensor. The stability of detection method was related to the accuracy of detection. Therefore, six sets of α-Fe2O3/Fe3O4@Au/ssDNA/BSA probes prepared under the same conditions were stored at 4 °C, and one set was removed every two days for electrochemical detection after incubation with tDNA. During ten days of storage, the DPV currents of the six measurements fluctuated slightly irregularly (Fig. 7C), but the relative change rate of the current value to the initial value on the tenth day was only 1.47 %, indicating that the biosensor had admirable stability (Mao et al., 2024).
The biosensor had a wide linear range and low detection limit compared with other methods for detecting genes (Table 3). Although there were superior detection methods or strategies, the advantages of low cost and the ease of application were not be ignored at the same time.
Methods
Gene
Linear range (R2)
LOD
References
Dual-channel fluorescence and colori metric sensing strategy
Kras
0.9 pM − 40 pM
0.41 pM
[Liu et al., 2024]
Biosensor
Pax-5a
25 nM − 250 nM
7.6 pM
[Xu et al., 2022]
Electrochemical biosensor
CYP2C9*3
1 pM − 1 µM
0.95 pM
[Liu et al., 2021]
Electrochemical biosensor
MGMT
1 pM – 50 μM
0.86 pM
[Safarzadeh and Pan, 2022]
Electrochemical biosensor
VKORC1*2
1 pM −1 μM
0.36 pM
This work
3.6 Analysis of the real samples
There were many interfering factors in the real sample (serum) that would affect the authenticity of the detection and might be accompanied by false positives, so the real samples were analyzed using the standard spiking method (Scheme 1B). A fixed concentration of tDNA (50 μM) was diluted into spiked samples of different concentrations (0.1 nM, 1 nM, and 10 nM) using human serum diluted 20-fold by PBS buffer, and then assayed using the DPV method. As listed in Table 4, the biosensor yielded recoveries ranging from 96.63 % − 110.57 % (RSD ≤ 3.07 %) using the standard addition method, and comparisons with a clinically standardized test (NGS) revealed similarities in recovery and RSD, demonstrating the reliability of the proposed biosensor. Therefore, it could be judged that this electrochemical biosensor had promising application for the detection of VKORC1*2 gene in real samples (Wu et al., 2023).
Spiked (nM)
α-Fe2O3/Fe3O4 @Au-ssDNA/MCH probes
Next generation sequencing (NGS)
Test value (nM)
Recovery (%)
RSD (%)
Detection value (nM)
Recovery (%)
0.1
0.099
99.18
3.07
0.103
103.0
1
0.966
96.63
1.68
1.007
100.7
10
11.057
110.57
2.48
10.336
103.4
4 Conclusions
In summary, a label-free electrochemical biosensor capable of magnetic self-assembly was developed for the detection of VKORC1*2 based on the suitable magnetic properties ofα-Fe2O3/Fe3O4 heterogeneous nanosheets, and to enhance the detection current signals and the detection performance, α-Fe2O3/Fe3O4@Au/ssDNA/BSA was constructed by Au and ssDNA modifications; to improve the sensitivity and specificity of this biosensor, the construction conditions were optimized: the concentrations of α-Fe2O3/Fe3O4@Au nanocomposites and ssDNA probes, the incubation temperature, and incubation time were 15 mg/mL, 2 μM, 45 °C, and 25 min, respectively. Under the optimal conditions, the electrochemical biosensor demonstrated linear range of 1 pM −1 μM for the detection of VKORC1*2, with a limit of detection (LOD) of 0.36 pM and a limit of quantification (LOQ) of 1.19 pM. In addition, real sample analysis showed that the biosensor had a recovery range of 96.63 % − 110.57 % (RSD ≤ 3.07 %). Overall, this detection strategy provided a method reference for VKORC1*2 detection with a wide range, low detection limit, and good sensitivity. It not only helped to provide a promising support route for warfarin clinical dosing, but also opened up a new development pathway for the detection of other substances.
CRediT authorship contribution statement
Jie Wang: Writing – original draft, Methodology, Investigation, Data curation. Hezhong Ouyang: Writing – review & editing, Resources, Project administration. Zhihao Xu: Investigation, Data curation. Lei Sun: Investigation, Data curation. Dawei He: Writing – review & editing, Supervision, Methodology, Conceptualization. Ruijiang Liu: Writing – review & editing, Visualization, Supervision, Methodology, Funding acquisition, Formal analysis, Conceptualization.
Acknowledgment
This work was supported by the Jiangsu Provincial Postgraduate Scientific Practice and Innovation Project (Grant No. KYCX24_4043).
Declaration of competing interest
The authors declare that they have no known competing financial interests or personal relationships that could have appeared to influence the work reported in this paper.
References
- Biosensing using DNA-based structures integrated with nanosheets. Microchem. J.. 2023;191:108779
- [CrossRef] [Google Scholar]
- Proteomic-based electrochemical non-invasive biosensor for early breast cancer diagnosis. Int. J. Biol. Macromol.. 2023;253:126681
- [CrossRef] [Google Scholar]
- Frequencies of VKORC1-1639G>A and rs397509427 in patients on warfarin and healthy syrian subjects. Cardiovasc. Ther.. 2023;2023:1-7.
- [CrossRef] [Google Scholar]
- An electrochemical PNA-based sensor for the detection of the SARS-CoV-2 RdRP by using surface-initiated-reversible-addition−fragmentation-chain-transfer polymerization technique. Talanta. 2023;259:124490
- [CrossRef] [Google Scholar]
- Outcomes of patients with atrial fibrillation and ischemic stroke while on oral anticoagulation. Eur. Heart J.. 2023;44:1807-1814.
- [CrossRef] [Google Scholar]
- Pharmacogenetics and precision medicine approaches for the improvement of COVID-19 therapies. Front. Pharmacol.. 2022;13:835136
- [CrossRef] [Google Scholar]
- Versatile photoelectrochemical biosensor based on AIS/ZnS QDs sensitized-WSe2 nanoflowers coupled with DNA nanostructure probe for “On−Off” assays of TNF-α and MTase. Biosens. Bioelectron.. 2023;241:115704
- [CrossRef] [Google Scholar]
- Direct oral anticoagulant agents might be safe for patients undergoing endovenous radiofrequency and laser ablation. J. Vasc. Surg.-Venous l.. 2023;11:25-30.
- [CrossRef] [Google Scholar]
- Comparison of maintenance dose predictions by warfarin dosing algorithms based on Chinese and Western patients. J. Clin. Pharma.. 2023;63:569-582.
- [CrossRef] [Google Scholar]
- Probing the influence of graphene oxide sheets size on the performance of label-free electrochemical biosensors. Sci. Rep.. 2020;10:13612.
- [CrossRef] [Google Scholar]
- Novel composite based on cellulose nanomaterial for detection and selective removal of cadmium (II) ions from wastewater. Microchem. J.. 2024;198:110175
- [CrossRef] [Google Scholar]
- Renal function and periprocedural complications in patients undergoing left atrial catheter ablation: A comparison between uninterrupted direct oral anticoagulants and phenprocoumon administration. Clin. Res. Cardiol. 2024
- [CrossRef] [Google Scholar]
- An ultrasensitive voltammetric genosensor for the detection of bacteria vibrio cholerae in vegetable and environmental water samples. Biosensors. 2023;13:616.
- [CrossRef] [Google Scholar]
- Reactive dye degradation using Fe3+ modified membranes obtained from cigarette filters. J. Photoch. Photobio. A. 2023;439:114586
- [CrossRef] [Google Scholar]
- Detection of the p53 gene mutation using an ultra-sensitive and highly selective electrochemical DNA biosensor. J. Mex. Chem. Soc.. 2023;67:33-45.
- [CrossRef] [Google Scholar]
- Small-sized cationic miRi-PCNPs selectively target the kidneys for high-efficiency antifibrosis treatment. Adv. Healthc. Mater.. 2018;7:1800558.
- [CrossRef] [Google Scholar]
- Polydopamine functionalized Ti3AlC2 MAX based electrochemical biosensor for early and sensitive detection of Mycobacterium tuberculosis. Microchem. J.. 2024;197:109899
- [CrossRef] [Google Scholar]
- A label-free ultrasensitive microRNA-21 electrochemical biosensor based on MXene (Ti3C2)-reduced graphene oxide-Au nanocomposites. Microchem. J.. 2023;190:108656
- [CrossRef] [Google Scholar]
- Plasmonic optical wells-based enhanced Rate PCR. Nano Lett.. 2024;24:1738-1745.
- [CrossRef] [Google Scholar]
- Transition metal elements-doped SnO2 for ultrasensitive and rapid ppb-level formaldehyde sensing. Heliyon. 2023;9:e13486
- [CrossRef] [Google Scholar]
- Rapid and sensitive detection of box turtles using an electrochemical DNA biosensor based on a gold/graphene nanocomposite. Beilstein J. Nanotech.. 2022;13:1458-1472.
- [CrossRef] [Google Scholar]
- Optical biosensors and their applications for the detection of water pollutants. Biosensors-Basel. 2023;13:370.
- [CrossRef] [Google Scholar]
- Integrated Rayleigh wave streaming-enhanced sensitivity of shear horizontal surface acoustic wave biosensors. Biosens. Bioelectron.. 2024;247:115944
- [CrossRef] [Google Scholar]
- Automated warfarin dose prediction for Asian, American, and Caucasian populations using a deep neural network. Comput. Biol. Med.. 2023;153:106548
- [CrossRef] [Google Scholar]
- Efficacy and safety of non-vitamin K antagonist oral anticoagulants in patients (≥80 years of age) with atrial fibrillation: systematic review and meta-analysis. Intern. Med. J.. 2023;53:1524-1532.
- [CrossRef] [Google Scholar]
- Novel gene polymorphisms for stable warfarin dose in a korean population: Genome-wide association study. Biomedicines. 2023;11:2308.
- [CrossRef] [Google Scholar]
- Synthesis and characterization of graphene quantum dot/SiNP/carbon nanomaterial composites. Appl. Nanosci.. 2022;12:3219-3228.
- [CrossRef] [Google Scholar]
- Coordinatively self-assembled luminescent gold nanoparticles: Fluorescence Turn-On system for high-efficiency passive tumor imaging. ACS Appl. Mater. Interfaces. 2017;9:5118-5127.
- [CrossRef] [Google Scholar]
- Evolution of carbon nanostructures during coal graphitization: Insights from X-ray diffraction and high-resolution transmission electron microscopy. Energy. 2024;290:130316
- [CrossRef] [Google Scholar]
- A PCR-independent approach for mtDNA enrichment and next-generation sequencing: comprehensive evaluation and clinical application. J. Transl. Med.. 2024;22:386.
- [CrossRef] [Google Scholar]
- Customizable nichrome wire heaters for molecular diagnostic applications. Biosensors. 2024;14:152.
- [CrossRef] [Google Scholar]
- A label-free electrochemical biosensor with magnetically induced self-assembly for the detection of CYP2C9*3 gene. Appl. Surf. Sci.. 2021;537:147868
- [CrossRef] [Google Scholar]
- Structural and cellular basis of vitamin K antagonism. J. Thromb. Haemost.. 2022;20:1971-1983.
- [CrossRef] [Google Scholar]
- Magnetic nanomaterials-mediated cancer diagnosis and therapy. Prog. Biomed. Eng.. 2022;4:012005
- [CrossRef] [Google Scholar]
- Dual-mode detection of KRAS gene by target recycling amplification based on molybdenum disulfide quantum dots and the catalytic reduction of rhodamine B. Sensor Actuat. B-Chem.. 2024;398:134693
- [CrossRef] [Google Scholar]
- Electrochemical Biosensor for the detection of low density lipoprotein based on gold nanoparticles mediated bi-enzymes catalytic silver deposition reaction. Microchem. J.. 2024;199:109927
- [CrossRef] [Google Scholar]
- A novel electrochemical biosensor based on MIL-101-NH2(Cr) combining target-responsive releasing and self-catalysis strategy for p53 detection. Biosens. Bioelectron.. 2022;214:114518
- [CrossRef] [Google Scholar]
- Portable, and ultrasensitive HR-HPV tests based on nucleic acid biosensors. Front. Cell. Infect. Mi.. 2024;14:1357090.
- [CrossRef] [Google Scholar]
- Strategies to develop electrocatalytically active perovskite oxide nanosheets. ChemCatChem. 2024;16:e202301116
- [CrossRef] [Google Scholar]
- Ultrasensitive electrochemiluminescence biosensor to detect ampicillin resistance gene (ARG AMP) based on a novel near-infrared ruthenium carbene complex/TPrA/PEI ternary ECL system. Anal. Chem.. 2024;96:934-942.
- [CrossRef] [Google Scholar]
- Effect and mechanism of paclitaxel loaded on magnetic Fe3O4@mSiO2-NH2-FA nanocomposites to MCF-7 cells. Drug Deliv.. 2023;30:64-82.
- [CrossRef] [Google Scholar]
- A genetically encoded fluorescent sensor for manganese(II), engineered from lanmodulin. P. Natl. Acad. Sci. Usa.. 2022;119 e2212723119
- [CrossRef] [Google Scholar]
- Features of silver-nanoparticle-based electrochemical sensors, shape and size effects. Nanotechnol. Russ.. 2023;18:251-256.
- [CrossRef] [Google Scholar]
- Recent advancements of fluorescent biosensors using semisynthetic probes. Biosens. Bioelectron.. 2024;247:115862
- [CrossRef] [Google Scholar]
- Novel detection of H.pylori using ultrasensitive electrochemical aptasensor based on surface modified graphene oxide doped gold nanoparticles conjugated polythiophene. Microchem. J.. 2024;200:110279
- [CrossRef] [Google Scholar]
- Detection of a Double-Stranded MGMT Gene Using Electrochemically Reduced Graphene Oxide (ErGO) Electrodes Decorated with AuNPs and Peptide Nucleic Acids (PNA) Biosensors. 2022;12:98.
- [CrossRef] [Google Scholar]
- Real-time and label-free detection of VKORC1 genes based on a magnetoelastic biosensor for warfarin therapy. J. Mater. Chem. B. 2020;8:6271-6276.
- [CrossRef] [Google Scholar]
- Faradaic impedimetric immunosensor for label-free point-of-care detection of COVID-19 antibodies using gold-interdigitated electrode array. Biosensors. 2023;14:6.
- [CrossRef] [Google Scholar]
- Nanomaterials enabled and enhanced DNA-based biosensors. J. Mater. Chem. B. 2023;11:6994-7003.
- [CrossRef] [Google Scholar]
- An electrochemical biosensor for T4 polynucleotide kinase activity assay based on host–guest recognition between phosphate pillar [5] arene@MWCNTs and thionine. Analyst. 2024;149:1271-1279.
- [CrossRef] [Google Scholar]
- Integrated analysis of clinical and genetic factors on the interindividual variation of warfarin anticoagulation efficacy in clinical practice. BMC Cardiovasc. Disor.. 2023;23:279.
- [CrossRef] [Google Scholar]
- A stimuli-responsive drug release nanoplatform for kidney-specific anti-fibrosis treatment. Biomater. Sci.. 2019;7:1554-1564.
- [CrossRef] [Google Scholar]
- A near-infrared light responsive temperature-sensing switch in a submicro-channel heterogeneous membrane. J. Mater. Chem. A. 2023;11:18765-18775.
- [CrossRef] [Google Scholar]
- VKORC1: A warfarin‐sensitive enzyme in vitamin K metabolism and biosynthesis of vitamin K‐dependent blood coagulation Factors. Vitam. Horm.. 2008;78:227-246.
- [CrossRef] [Google Scholar]
- Constructing a passive targeting and long retention therapeutic nanoplatform based on water-soluble, non-toxic and highly-stable core–shell poly (amino acid) nanocomplexes. Biomater. Sci.. 2021;9:7065-7075.
- [CrossRef] [Google Scholar]
- Fabrication and characterization of magnetic α-Fe2O3/Fe3O4 heterogeneous nanosheets. J. Inorg. Organomet. P.. 2023;33:783-795.
- [CrossRef] [Google Scholar]
- Recent progress in functional-nucleic-acid-based fluorescent fiber-optic evanescent wave biosensors. Biosensors. 2023;13:425.
- [CrossRef] [Google Scholar]
- Antifouling electrochemiluminescence biosensor based on bovine serum albumin hydrogel for the accurate detection of p53 gene in human serum. ACS Appl. Mater. Interfaces. 2023;15:44322-44330.
- [CrossRef] [Google Scholar]
- A Pax-5a gene analysis approach enabled by selective digestion with lambda exonuclease. Anal. Methods-UK. 2022;14:2415-2422.
- [CrossRef] [Google Scholar]
- Electrophoretically deposited L-cysteine functionalized MoS2@MWCNT nanocomposite platform: a smart approach toward highly sensitive and label-free detection of gentamicin. Mater. Today Chem.. 2021;22:100567
- [CrossRef] [Google Scholar]
- Fabrication of alkoxysilane substituted polymer-modified disposable biosensing platform: Towards sperm protein 17 sensing as a new cancer biomarker. Talanta. 2022;243:123376
- [CrossRef] [Google Scholar]
- Reversal of HMGA1-mediated immunosuppression synergizes with immunogenic magnetothermodynamic for improved hepatocellular carcinoma therapy. ACS Nano. 2023;17:9209-9223.
- [CrossRef] [Google Scholar]
- A novel biomimetic electrochemical taste-biosensor based on conformational changes of the taste receptor. Biosens. Bioelectron.. 2024;249:116001
- [CrossRef] [Google Scholar]
- Constructing an ultra-rapid nanoconfinement-enhanced fluorescence clinical detection platform by using machine learning and tunable DNA xerogel “Probe”. Anal. Chem.. 2023;95:15690-15699.
- [CrossRef] [Google Scholar]
- Construction of a label-free electrochemical biosensing system utilizing Fe3O4/α-Fe2O3@Au with magnetic-induced self-assembly for the detection of EGFR glycoprotein. Vacuum. 2024;222:112975
- [CrossRef] [Google Scholar]
- Highly sensitive of an electrochemical DNA biosensor detection towards toxic dinoflagellates Alexandrium minutum (A. minutum) Microchem. J.. 2024;199:109997
- [CrossRef] [Google Scholar]
- A ferrocene-based hydrogel as flexible electrochemical biosensor for oxidative stress detection and antioxidation treatment. Biosens Bioelectron.. 2024;248:115997
- [CrossRef] [Google Scholar]
- Magnetically induced self-assembly electrochemical biosensor with ultra-low detection limit and extended measuring range for sensitive detection of HER2 protein. Bioelectrochemistry. 2024;155:108592
- [CrossRef] [Google Scholar]
- Comparison of efficacy and safety between aspirin and oral anticoagulants for venous thromboembolism prophylaxis after major orthopaedic surgery: a meta-analysis of randomized clinical trials. Front. Pharmacol.. 2024;14:1326224.
- [CrossRef] [Google Scholar]
- Mechanism of VKORC1 and VKORC1L1 signaling in the effects of sodium dehydroacetate on coagulation factors in rat hepatocytes. Toxicol. In Vitro. 2023;87:105518
- [CrossRef] [Google Scholar]


