

Translate this page into:
Influence of annealing temperature on the mechanical properties and corrosion behavior of Ti-5.5Al-2.0Zr-1.5Sn-0.5Mo-1.5Nb alloy
⁎Corresponding author. kmxh@kust.edu.cn (Han Xiao)
-
Received: ,
Accepted: ,
This article was originally published by Elsevier and was migrated to Scientific Scholar after the change of Publisher.
Abstract
In this work, the effect of annealing temperature of Ti552 titanium alloy is systematically investigated based on mechanical property tests, electrochemical tests and static immersion tests. The results show that after the annealing treatment, the microstructure morphology of the α-phase transforms from striated to equiaxed, and the intergranular β-phase gradually increases. As the annealing temperature increases, the grain size gradually increases and the volume fraction of α-phase gradually decreases. The tensile strength and Vickers hardness are the maximum and the elongation is the minimum in the hot-rolled condition. With increasing annealing temperature, the strength and Vickers hardness of Ti552 alloy gradually decrease, while the elongation gradually increases. In 3.5 wt% NaCl solution, Ti552 alloy has similar corrosion behavior at different annealing temperatures, although its corrosion resistance varies. In potentiodynamic polarization and EIS testing, the annealed Ti552 alloy shows a low corrosion current density (10-6 A/cm2) and a high polarization impedance (106 Ω·cm2), indicating the formation of a dense and stable oxide film. Under annealing at 800 °C, the corrosion resistance is at its highest and the corrosion rate is the lowest, according to electrochemical and static immersion studies. The comprehensive analysis suggests that the corrosion behavior of Ti552 alloy in NaCl solution may be a result of the combined effect of the volume fraction of the β-phase and the grain size of the α-phase.
Keywords
Titanium alloy
Annealing temperature
Mechanical properties
Corrosion resistance

1 Introduction
Titanium and titanium alloys, known for their high strength, low modulus of elasticity, excellent corrosion resistance, and good biocompatibility, are widely used in aerospace, marine engineering, petrochemical industries, engineering components, medical devices, and others (Wu et al., 2022; Gao et al., 2022; Pede et al., 2022). According to previous studies, the microstructure of Ti alloys plays a significant role in their corrosion performance and mechanical properties, and external processes (Gai et al., 2018; Dai et al., 2016) can further modify the microstructure. For instance, heat treatment provides a quick and effective means to adjust and refine the microstructure, thereby enhancing the mechanical properties and corrosion resistance of Ti alloys to meet specific requirements (Jing et al., 2013).
For mechanical properties (Table 1), Bey Vrancken (Vrancken et al., 2012) investigated the effect of annealing temperature on the microstructure and mechanical properties of SLM-treated Ti-6Al-4V and discovered that the primary martensitic α’ phase transforms into a laminar mixture of α and β phases when the annealing temperature is lower than the β phase transformation point. After annealing at 850 °C for 2 h, the elongation can be increased to 12.84 ± 1.36 %, significantly higher than that of the raw material at 7.36 ± 1.32 %. Zhi-feng Shi (Shi et al., 2013) explored the microstructure evolution and mechanical properties of TC21 titanium alloy under different heat treatments and observed that the microstructure of TC21 alloy primarily comprises coarse α-sheet and residual β-matrix strengthened by secondary α-sheet. Both tensile strength and yield strength are observed to decrease with an increase in coarse α-sheets. Shashi Shekhar (Shekhar et al., 2015) conducted research on the effect of solid solution and aging on the microstructure and tensile properties of Ti-5553 alloy. It was found that α + β solid solution treatment results in higher grain size refinement compared to β solid solution treatment, and β solid solution and aging treatment result in higher strength and lower plasticity. Thus, it is imperative to identify the ideal heat treatment parameters and establish a direct correlation between the annealed microstructure and the corrosion behavior.
Literatures
Materials
Heat treatment process
Microstructure
Mechanical properties
(Vrancken et al., 2012)
Ti6Al4V
Heat treatment temperature: below the β transus (650,780,843,850,940), above the β transus (1015, 1020,1040 ℃)
Below the β transus: Martensitic α’ phase transforms into α + β phases
After annealing at 850 °C for 2 h, the elongation can be increased to 12.84 ± 1.36 %
(Shi et al., 2013)
Ti-6Al-2Sn-2Zr-3Mo-1Cr-2Nb–Si
(900 °C, 1 h, AC)+ (590 °C, 4 h, AC), (900 °C, 1 h, AC)+ (590 °C, 4 h, AC), (970 °C, 20 min, AC)+ (590 °C, 4 h, AC), (920 °C, 1 h, AC)+ (900 °C, 1 h, AC)+ (590 °C, 4 h, AC), (970 °C, 20 min, AC)+(900 °C, 1 h, AC)+ (590 °C, 4 h, AC)
Coarse α plates and residual β matrix strengthened by the secondary α platelets
Both tensile strength and yield strength are observed to decrease with an increase in coarse α-sheets.
(Shekhar et al., 2015)
Ti–5Al–5V–5Mo–3Cr
α + β ST1 (825 ℃/4h/WQ), α + β ST2 (800 ℃/4h/WQ), β ST (885 ℃/1h/WQ)
α + β solid solution treatment results in higher grain size refinement compared to β solid solution treatment
β solid solution and aging treatment result in higher strength and lower plasticity
Regarding corrosion resistance, titanium alloys are often referred to as “marine metals”. Consequently, titanium and its alloys are renowned for their exceptional resistance. Literatures suggest that their corrosion resistance is strongly correlated with microstructure (Table 2). Ya Wei (Wei et al., 2022) reported on the microstructure and properties of Ti-3Mo alloy post-annealing at 850–1050 °C, noting that both the corrosion rate and the grain size of the β-phase increases progressively with the annealing temperature. In their study on the corrosion behavior of annealed Ti-6Al-3Nb-2Zr-1Mo alloy in hydrochloric acid, Kang Meng (Meng et al., 2021) identified the relative volume fractions of the α-phase and β-phase, along with grain size, as primary influencing factors. É Martin (Martin et al., 2010) have indicated that duplex microstructures exhibit superior corrosion resistance compared to multilayer and martensite structures. Consequently, the microstructure significantly impacts the corrosion properties of titanium alloys.
Literatures
Materials
Heat treatment process
Microstructure
Corrosion behavior
(Wei et al., 2022)
Ti-3Mo
Annealed at 750 ℃, 850℃, 950 ℃ and 1050 ℃ for 1 h, respectively, and then followed by air cooling to room temperature
From 850 ℃ to 1050 ℃: α-phase lamellar structure and β-phase; The grain size of the β-phase increases progressively
The corrosion rate increases progressively with the annealing temperature
(Meng et al., 2021)
Ti-6Al-3Nb-2Zr-1Mo
Annealed at 800 ℃, 900 ℃, 960 ℃, and 1040 ℃ for 1 h, respectively, and then followed by air cooling to room temperature.
800 ℃ (fine grain structure), 900 ℃ (equiaxed morphology), 960 ℃ (bi-modal structure), 1040 ℃(Widmanstatten structure). Grain size increases with annealing temperature from 800 ℃ to 960 ℃, but decreases at 1040 ℃.
From 800 ℃ to 960 ℃: the corrosion rate increased; 1040 ℃: the lowest corrosion rate
(Huang et al., 2022)
Ti-0.3Mo-0.8Ni
Annealed at 780 ℃ for 2 h followed by air-cooling, furnace-cooling to 160 ℃ and then air-cooling, furnace-cooling to 100 ℃ and then air-cooling, furnace-cooling
The intergranular β phase decreases, the transforms into strip α phase the equiaxed α phase. The longest annealing cooling time: the largest equiaxed α phase
Different annealing cooling methods result in the same corrosion behavior, but the corrosion resistance is different.
Besides microstructure, the corrosion resistance of titanium alloys also depends on their usage environments (Table 3). This aspect has been extensively researched. Baoxian Su investigated the corrosion resistance of Ti80 alloy in various solutions, observing that the potentiodynamic polarization curves of the annealed alloys demonstrate spontaneous passivation in NaCl solution, whereas in HCl solution, a transition from activation to passivation occurs (Su et al., 2021). Yahui Yang demonstrated that the open-circuit potential and polarization curves of Ti-20Zr-6.5Al-4V alloy in NaCl and HCl solutions progressively enhance corrosion resistance with higher annealing temperatures (Yang et al., 2015). Baoxian Su performed electrochemical tests on Ti-6Al-3Nb-2Zr-1Mo alloy, finding that the samples undergo spontaneous passivation in artificial seawater, attributed to a dense passivation film, while in HCl solution, a transition from activation to passivation is observed, linked to porous film formation (Su et al., 2022). Consequently, it is evident that titanium alloys display varied corrosion resistance properties in different environmental conditions.
Literatures
Materials
Thermal processing
Microstructure
Corrosion behavior
Su et al., 2021
Ti-6Al-3Nb-2Zr-1Mo
Annealed at 850 ℃, 900℃, 950 ℃ and 1000 ℃ for 2 h, respectively, and then followed by air cooling to room temperature
Annealed at a higher temperature generates of a higher fraction of β phase and more refined lamellar α phase
The potentiodynamic polarization curves show spontaneous passivation in NaCl solution, whereas a transition from activation to passivation occurs in HCl solution
(Yang et al., 2015)
Ti–20Zr–6.5Al–4V
Annealed at 800, 900, 1000 and 1050 ℃ and then cooled in the furnace.
800 ℃ (Widmanstatten morphology), 900–1000 ℃ (increased equiaxed α phase), 1050℃ (basketweave microstructure)
The open-circuit potential and polarization curves in NaCl and HCl solutions progressively enhance corrosion resistance with higher annealing temperatures
(Su et al., 2022)
Ti-6Al-3Nb-2Zr-1Mo
The wrought sample and the sample electron beam surface melting (EBSM)
The wrought sample (equiaxed α-phase and tiny intergranular retained β-phase), the EBSM sample (Widmanstatten structure)
The wrought and EBSM samples exhibit a spontaneous passive behavior in artificial seawater, compared to the active to passive transition behavior in HCl solution
As indicated by the above research, some articles primarily focus on corrosion resistance (Cui et al., 2023; Cui et al., 2022; Wang et al., 2023; Dai et al., 2017; Qin et al., 2018; Chauhan et al., 2022), while others concentrate specifically on mechanical properties (Shadangi et al., 2020). However, there are relatively few studies on both mechanical properties and corrosion behavior (Shadangi et al., 2015), especially in the context of titanium alloys. For example, Ti552 (Ti-5.5Al-2.0Zr-1.5Sn-0.5Mo-1.5Nb) titanium alloy can be used in engineering equipment for the marine environment due to their notable advantages, including high specific strength and excellent corrosion resistance. In this complex environment (high temperature, high humidity, high salt spray, etc.), Ti552 alloy faces significant practical challenges. Therefore, investigating the mechanical properties and corrosion resistance of Ti552 alloy is essential. Furthermore, there is a scarcity of research on how annealing temperature influences the mechanical properties and corrosion resistance of Ti552 titanium alloy. Consequently, this study investigates the impact of annealing temperature on mechanical properties, considering various annealing processes, and explores its effect on corrosion resistance by simulating marine atmospheric conditions. This present study systematically investigates the impact of annealing temperature on the microstructure, mechanical properties, and corrosion behavior of Ti552 titanium alloy, aiming to offer practical application guidance.
2 Materials and methods
2.1 Materials
The experimental material utilized was a Ti552 alloy sheet, characterized by high strength and corrosion resistance, with a nominal composition of Ti-5.5Al-2.0Zr-1.5Sn-0.5Mo-1.5Nb. The titanium alloy ingot was produced via three rounds of melting in a VAR furnace by Yunnan Titanium Industrial Co. Ltd (detailed in Table 4). Subsequently, the titanium alloy was processed into hot-rolled plates through sequential steps including machining and hot rolling. The chemical composition of Ti552 plate was determined using a chemical analysis method of inductively coupled plasma mass spectrometry (ICP-MS, Thermo Fisher Scientific Inc., Germany), as indicated in Table5, revealing a slight deviation from the target composition. Utilizing Pandat software, The β-phase transition temperature of Ti552 alloy was identified as 986.88 °C.
Number of melting
Crucible specifica-tions/mm
Vacuum degree/Pa
Steady arc current/A
Arcing voltage/V
Arcing current/kA
Melting voltage/V
Air leakage rate/Pa/min
Melting current/KA
Cooling time/h
1
Φ130
<3
6
23–25
4
31–33
0.6
7–8
3.0
2
Φ220
<3
8–10
23–25
2–4
32–34
0.6
9–10
4.0
3
Φ320
<3
8–10
23–25
3–6
33–35
0.6
10–12
3.5
Element
Ti
Al
Zr
Sn
Mo
Nb
Content
Bal.
5.57
2.14
1.46
0.45
1.38
Specimens of various shapes and sizes were prepared using spark electric cutting. Subsequently, the specimens underwent annealing in a box-type muffle furnace. Annealing was performed at selected temperatures of 600, 650, 700, 750 and 800 ℃. The sample was heated to annealing temperature at a heating rate of 10 ℃/min. The holding time for each specimen was set at 1 h, followed by air cooling. Before undergoing heat treatment, the alloy was coated with an MP120 anti-oxidation coating to inhibit oxidation and hydrogen absorption throughout the heating process. Following the heat treatment, the anti-oxidation layer was meticulously removed, and the alloy surface was concurrently polished.
2.2 Microstructure characterization
Physical phase analysis of annealed Ti552 alloy was conducted using X-ray diffractometer (XRD, PANayltical Empyrean). The XRD scanning was performed at a rate of 5°/min and covered an angle range of 30–80°. Microstructural analysis was conducted using Optical Microscopy (OM, Nikon ECLIPSE MA200), Scanning Electron Microscopy (SEM, ZEISS EVO18), and Electron Probe Micro Analyzer (EPMA, SHIMADZU EPMA-1720). Sample preparation (5 × 5 × 3 mm3) involved embedding the specimens in epoxy resin, grinding them to 2000 mesh with SiC sandpaper, and polishing with silica suspension until scratch-free. Subsequently, the specimens were etched in a mixture of water, nitric acid, and hydrofluoric acid (85:10:5 by volume) for 3–5 s. In this study, the TD-ND surface served as the microstructure observation plane, and the phase proportions in the alloy were quantified using Image Pro Plus (IPP) software.
2.3 Mechanical properties test
Room temperature unidirectional tensile tests were conducted using a microcomputer-controlled electro-hydraulic servo universal testing machine (MTS model E45), in accordance with the standard GB/T 228.1-2021 (China). Each tensile test set was conducted at least three times to ensure the accuracy of experimental data, with a tensile rate of 1 mm/min. The dimensions of the tensile specimens are illustrated in Fig. 1. Subsequently, the fracture surface was cleaned and its morphology was characterized. The Vickers hardness of Ti552 alloy was measured a fully automated microhardness tester (HMV-G21S), applying a load of 50 g and a dwell time of 20 s. Each sample was tested at a minimum of 15 locations to ensure reproducibility.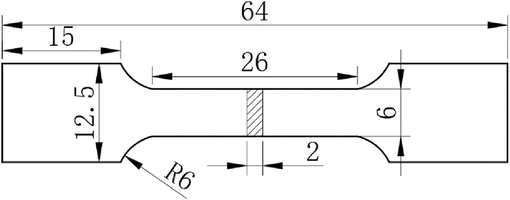
Tensile test specimen at room temperature.
2.4 Electrochemical measurements
Electrochemical tests were conducted using a conventional three-electrode system. The specimen (10 × 10 × 8 mm3) served as the working electrode, with the saturated calomel electrode as the reference electrode and the platinum plate as the auxiliary electrode. For electrochemical testing, specimens were initially ground to 2000 grit SiC, followed by attaching insulated copper wire to the back using conductive resin to mitigate undesirable ohmic effects. Subsequently, the surface of the sample was coated with epoxy resin, leaving an exposed area of 1 cm2. The electrolyte used in the experiments was a 3.5 wt% NaCl solution.
Prior to each electrochemical test, the open circuit potential (OCP) was monitored for 36,000 s to ensure stability. Following the OCP test, potentiodynamic polarization curves were recorded from −1.5 V to 1.5 V vs. SCE. The potential sweep rate of 0.000333 V/s was employed to ensure a near steady-state condition. Electrochemical impedance spectroscopy (EIS) measurements were conducted in the OCP state following a 10-hour immersion. The scanning frequency ranged from 10-2 Hz to 105 Hz, with a peak potential perturbation of 10 mV. The EIS spectra were analyzed using ZSimpWin 3.10 software and a complex nonlinear least squares (CNLS) fitting method. A new working electrode was used for each subsequent test. Each electrochemical experiment, conducted at room temperature, was repeated at least three times to ensure reproducibility.
2.5 Static immersion test
The static immersion test was conducted in accordance with ASTM standard G31-72. The annealed Ti552 samples (10 × 10 × 8 mm3) were initially ground to approximately 50 μm using SiC sandpaper, polished until scratch-free, and then ultrasonically cleaned in alcohol for 5 min. Subsequently, the materials were accurately weighed using an analytical balance with a precision of 0.1 mg. The exposed area of each sample was determined using a vernier caliper before immersion in a 3.5 wt% NaCl solution. Each sample was submerged in a beaker with 100 mL of naturally aerated test solution, adhering to the minimum solution volume to specimen area ratio of 0.20 mL·mm−2. The static immersion experiment was carried out at 25 °C for a duration of 720 h. Over a 30-day period, specimens were removed every two days, sequentially washed with acetone, alcohol, and distilled water to eliminate corrosion products, dried, weighed, and then re-immersed in a freshly prepared solution for the subsequent 2 days. Three replicates were tested for each process to ensure reproducibility.
3 Results and discussion
3.1 Microstructure characterization
Fig. 2a presents the XRD spectra of Ti552 alloy annealed at various temperatures. The positions of the standard peaks of α-Ti (JCPDS 00-44-1294) and β-Ti (JCPDS 00-44-1288), indicative of the phase constitution, are also depicted in Fig. 2a. Analysis of the XRD patterns reveals that the physical phases consist of α/α′-Ti with a hexagonal close-packed structure and β-Ti with a body-centered cubic structure. No other intermetallic compounds and/or phases were detected, which indicated that the alloy only formed the solid solution phase. Notably, the peaks of the α and β phases collectively shift slightly to the lower-angle side compared to their standard positions. As per the Bragg equation, this shift suggests an increase in the lattice parameter, which could be attributed to the larger atomic radius of Zr (0.160 nm) relative to Ti (0.147 nm) (Liu et al., 2019; Su et al., 2021; Yang et al., 2016; Han et al., 2014). Additionally, Fig. 2b shows only a weakly defined β-phase peak at 2θ≈38.4°, indicating the presence of a minor residual β-phase in the preferred (1 1 0) crystal orientation. Specifically, the intensity of β (1 1 0) reflection peak increases with increasing annealing temperature.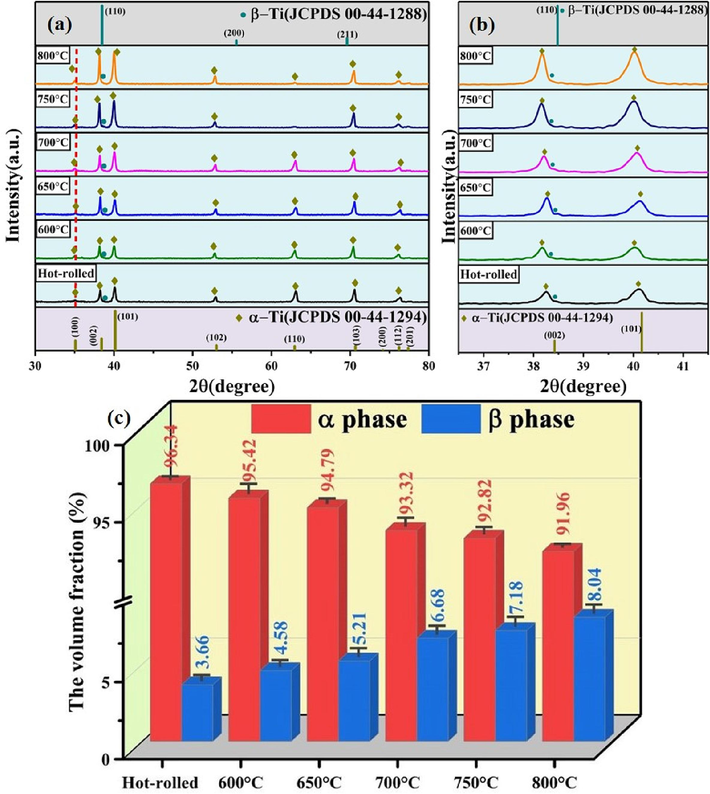
XRD results of Ti552 alloy annealed at various temperatures between 600 and 800 ℃:(a) XRD patterns, the partial XRD patterns are highlighted in (b), (c) calculated volume fraction of α phase and β phase of annealed samples.
To further evaluate the annealing-induced changes, the volume fractions of the phases were calculated by fitting XRD plots (Su et al., 2022; Su et al., 2021), as illustrated in Fig. 2c. The volume fraction of the α-phase is observed to decrease gradually with an increase in annealing temperature, whereas that of the intergranular residual β-phase increases from (3.66 ± 0.35 %) to (8.04 ± 0.64 %). The reason is that, as the annealing temperature increases, the diffusion rate of alloying elements accelerates. Additionally, a rapid cooling rate during air cooling results in excessive β-phase formation, with insufficient time for decomposition into α-phase (Huang et al., 2022). Therefore, this indicates that the formation of β-phase is promoted as the annealing temperature increases.
Fig. 3(a-r) depicts the microstructure of the annealed Ti552 alloy. The grain boundaries are indistinct, attributed to the low energy at the grain boundaries, rendering them less reactive to the corrosion solution. The hot rolled microstructure primarily comprises striated α-phase, with a minor presence of equiaxial α-phase and β-phase interspersed in the α-phase gaps, as illustrated in Fig. 3(a–c). Fig. 3(d–r) presents the microstructure of Ti552 alloy at varying annealing temperatures. It is observed that, compared to hot-rolled alloy, the Ti552 alloy undergoes stages of recovery, recrystallization, and grain growth with increasing annealing temperatures, transitioning from a striated to an equiaxed microstructure. As depicted in Fig. 3(d–f), there is a considerable reduction in the striated α-phase, and the microstructure significantly transitions to a spheroidized, equiaxed state. This phenomenon suggests the occurrence of recovery and recrystallization to a certain extent. At an annealing temperature of 650 °C, there is an increase in recrystallization, leading to further refinement of equiaxial α grains; additionally, some equiaxial α-phase grains grow, and the striated α-phase vanishes (Fig. 3(g–i)). Upon reaching an annealing temperature of 700 °C, the equiaxial α-phase exhibits pronounced grain growth, with larger grains engulfing smaller ones, resulting in a higher degree of grain growth compared to the 650 °C annealed state (Fig. 3(j–l)). At 750 °C, the grain size of the equiaxial α-phase slightly increases compared to the 700 °C annealed state, albeit the change is minimal; the notable homogeneity and consistency of the equiaxial α-phase suggest that the microstructure has experienced adequate plastic deformation (Fig. 3(m–o)). Further enlargement of the equiaxial α-phase grains and the most significant grain growth are observed at an annealing temperature of 800 °C (Fig. 3(p–r)). Additionally, the SEM images reveal an increasing trend in the intergranular β-phase with rising annealing temperatures. In summary, the increase in annealing temperature facilitates recovery, recrystallization, and grain growth within the microstructure, promoting the transformation from a striated to an equiaxed microstructure and resulting in the formation of numerous enlarged equiaxed α-phases. Fig. 4 illustrates the variation in grain size and the volume fraction of the primary α-phase in the Ti552 alloy at various annealing temperatures. Given the minimal content of the β-phase, the grain size of the alloy primarily refers to the average grain size of the primary α-phase. For the hot-rolled specimen, the grain size corresponds to the thickness of the lamellar α-phase. The grain size and area fraction are obtained using the Image-Pro software from at least ten images to eliminate statistical error. As the annealing temperature increases from 600 °C to 800 °C, a rising trend in grain size is observed. Notably, significant grain growth is observed during annealing at 700 °C, 750 °C, and 800 °C, with minor differences in grain size. Additionally, the volume fraction of β-phase, as determined from metallographic images, gradually increases from (4.11 ± 0.25 %) to (8.45 ± 0.38 %). Consequently, these results generally align with those derived from XRD patterns.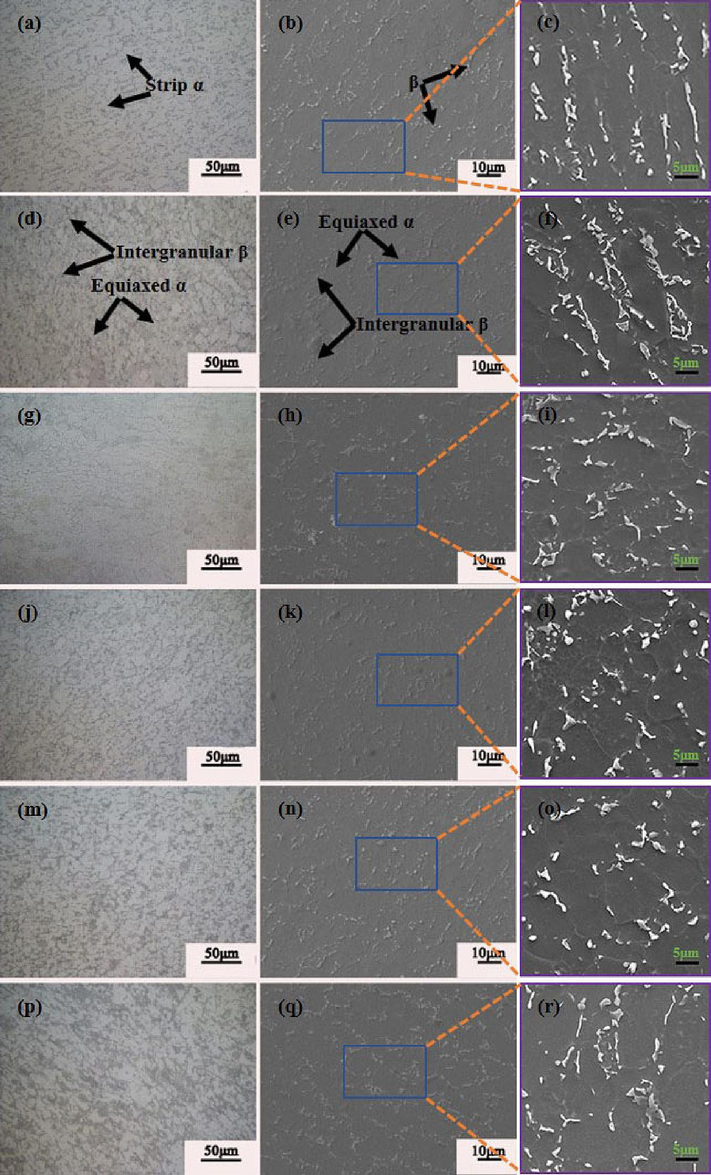
OM (a,d,g,j,m,p) and SEM (b,c,e,f,h,i,k,l,n,o,q,r) images of Ti552 alloy annealed at different temperatures, (a,b,c) Hot-rolled state,(d,e,f) 600 ℃, (g,h,i) 650 ℃, (j,k,l) 700 ℃, (m,n,o) 750 ℃, (p,q,r) 800 ℃. The (c,f,i,l,o,r) images are magnified views of specific regions in (b,e,h,k,n,q). formation of numerous enlarged equiaxed α-phases.
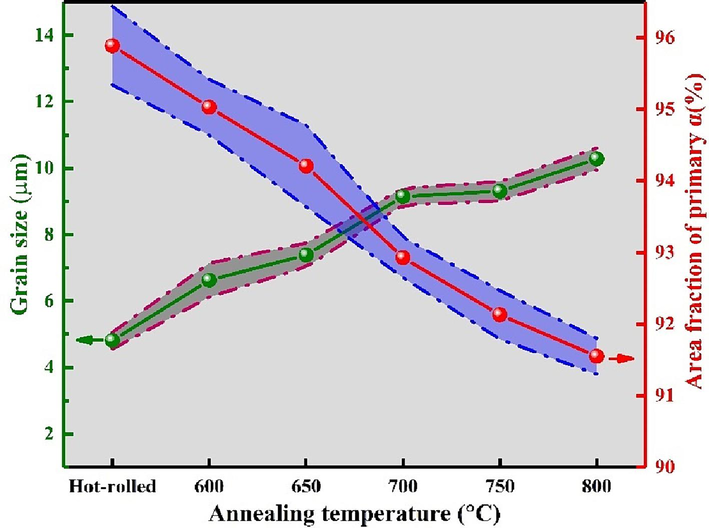
Variation in the volume fraction and grain size of the primary α phase of the Ti552 alloy at different annealing temperatures.
Fig. 5 presents the EPMA results of the Ti552 alloy after annealing at 750 °C. The elemental analysis indicates uniform distribution of Ti throughout the matrix. Al exhibits higher solid solubility in the α-phase compared to the β-phase. Conversely, Zr demonstrates greater solid solubility in the β-phase than in the α-phase.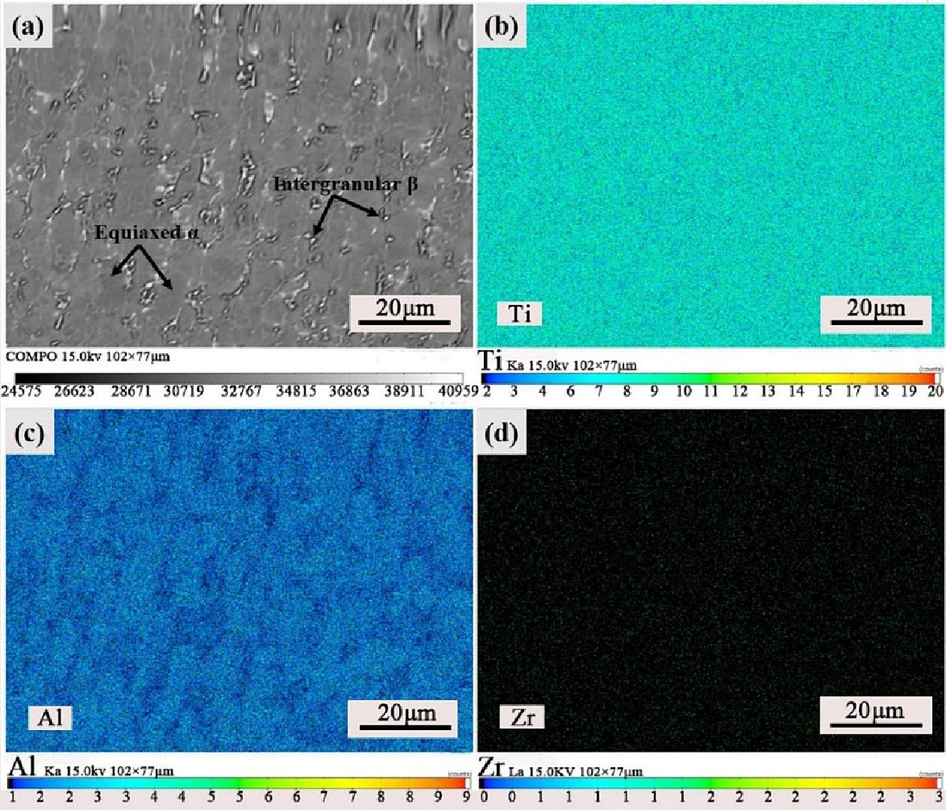
Surface EPMA analysis of Ti552 alloy after annealing at 750 ℃:(a) scanning surface, (b) Ti, (c) Al, and (d) Zr.
3.2 Mechanical properties test
3.2.1 Mechanical properties
Fig. 6a presents the tensile engineering stress–strain curves of the annealed Ti552 alloy. The tensile curves exhibit similar patterns, characteristic of elastic–plastic stress–strain behavior. Under continuous external forces, the tensile curve initially undergoes elastic deformation, followed by yielding and uniform plastic deformation, ultimately leading to fracture. Fig. 6b displays the elongation (EL) and tensile strength values derived from the tensile curves. The EL at various annealing temperatures is observed to be higher than that of the hot-rolled alloy, while the strength values are consistently lower. This phenomenon is attributed to the annealing process, which not only alleviates internal stresses but also diminishes microstructural defects. Additionally, with increasing annealing temperatures, both ultimate tensile strength (UTS) and yielding strength (YS) exhibit a monotonically decreasing trend, whereas EL demonstrates a monotonically increasing trend. This is partly due to the softening effect induced by higher annealing temperatures, which intensifies dislocation slip and climb, as well as grain boundary slip, thereby reducing dislocation density (Ma et al., 2020). In addition, the equiaxed microstructure of the annealed plate becomes more uniform and dense, the grain is more complete, and the internal stresses are eliminated which also leads to the reduction of strength and increase of plasticity (Davari et al., 2017). Fig. 6c illustrates the variation in work hardening rate of the Ti552 alloy in various states. The work hardening rate curves consistently exhibit similar strain-hardening behavior; they rapidly decrease post-yielding (stage 1), stabilize gradually (stage 2), and then slowly decrease (stage 3) until reaching the tensile plastic instability criterion. However, the work-hardening rate progressively improves with increasing annealing temperatures, indicating significant changes in the deformation behavior of the alloy due to annealing.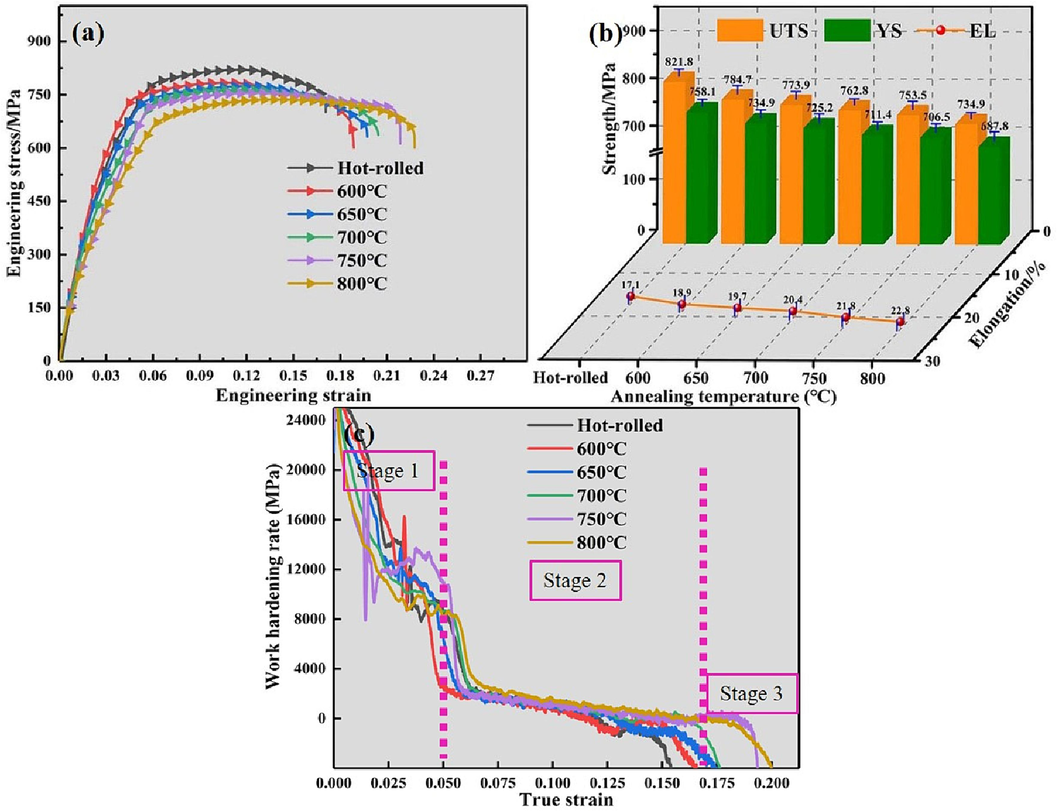
Tensile mechanical properties of Ti552 alloy in different annealing temperatures: (a) the engineering stress–strain curves; (b) elongation and tensile Strength values; (c) Work-hardening rate curves.
Investigating the fracture surface morphology can reveal the differences in plasticity described above. Fig. 7 displays the fracture morphology and dimple size distribution of the Ti552 alloy tensile specimens. The fracture morphology in different states is predominantly characterized by dimples, with pronounced tearing ribs between them, indicative of prolonged plastic deformation, a hallmark of ductile fracture morphology. Additionally, the average dimple diameter progressively increases with rising annealing temperatures. As a result, the plasticity of the Ti552 alloy progressively enhances as the annealing temperature increases.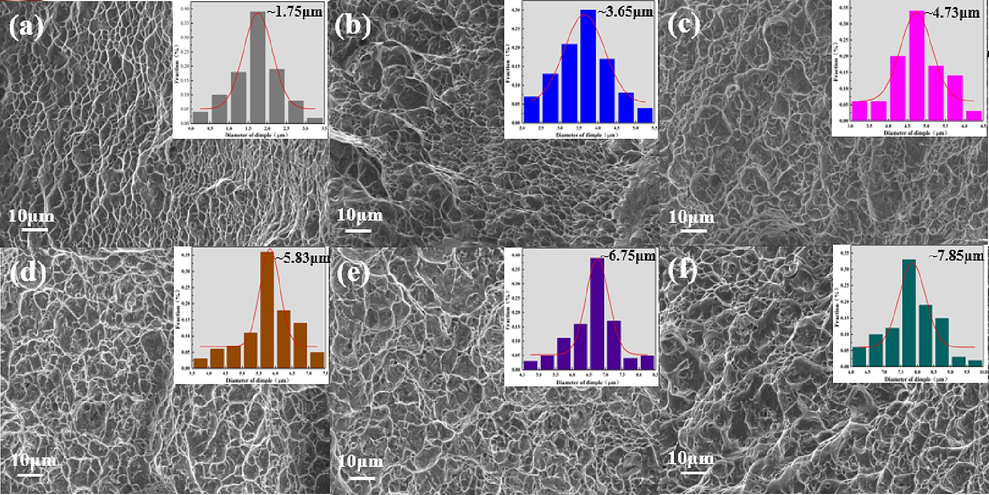
The SEM fracture morphologies of Ti552 alloy with different states: (a)hot-rolled, (b)600 ℃, (c)650 ℃, (d)700 ℃, (e)750 ℃, (f)800 ℃. All the illustrations describe the dimple size distribution obtained from SEM observations.
Fig. 8 presents the Vickers hardness values of the Ti552 alloy in various state. The Vickers hardness value is observed to be highest in the Hot-rolled condition, reaching 428.5 HV. The Vickers hardness value progressively decreases as the annealing temperature increases. This decrease is attributed to the elimination of internal stresses, enhanced recrystallization, and an increase in the equiaxial α-phase due to rising annealing temperatures. Additionally, a positive correlation is observed between the Vickers hardness and the tensile strength.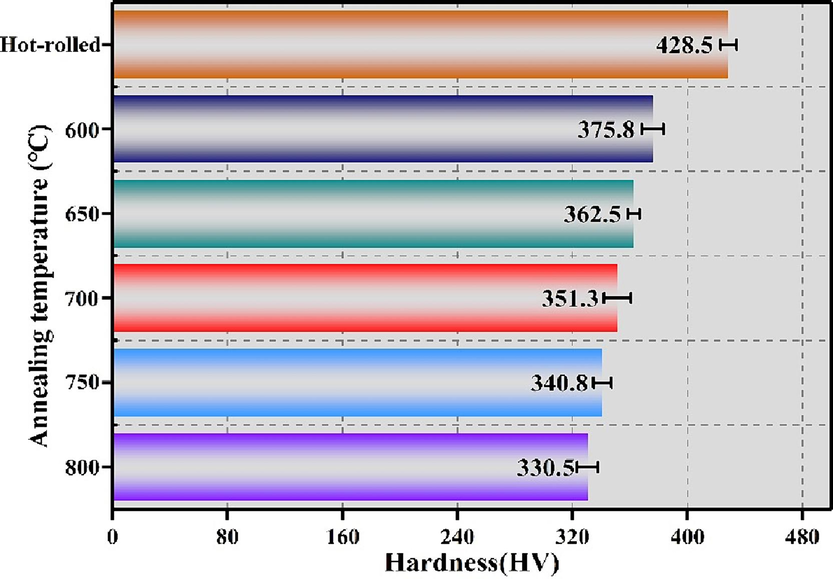
Vickers hardness of Ti552 alloy with different annealing temperatures.
3.2.2 Recovery and recrystallization mechanisms
The findings from the aforementioned studies indicate that as the annealing temperature of the Ti552 alloy increases, there is a decrease in strength and Vickers hardness, alongside an increase in plasticity. The variance in mechanical properties is primarily attributed to alterations in dislocation density, driven by recovery and recrystallization processes. Recovery represents the initial phase of microstructural and property transformations in cold-deformed metals undergoing annealing. The recovery mechanism can be classified into low-temperature, medium-temperature and high-temperature recovery stages. The low-temperature recovery stage is characterized by a marked decrease in the concentration of vacancies. During the medium-temperature recovery stage, dislocation density diminishes as a result of dislocation movement, facilitating the amalgamation of heterogeneous dislocations to neutralize one another, albeit the reduction is modest. Multilateralization serves as the principal mechanism during high-temperature recovery. The recovery mechanism results in the diminution of excess vacancies and a slight reduction in dislocation density, resulting in a modest decrease in both Vickers hardness and strength. Recrystallization involves a process whereby edge-type dislocations acquire sufficient energy to engage in continuous slipping and climbing, ultimately vanishing. It can induce significant alterations in both the microstructure and properties of the material. The microstructure transitions from cold-deformed elongated grains to newly formed equiaxed grains, with a sharp decrease in strength and hardness, alongside a rapid increase in plasticity. Therefore, the recovery and recrystallization mechanisms play an important role in evaluating the mechanical properties of Ti552 alloy by adjusting the change in dislocation density. Observations of the mechanical property changes reveal that with the increase in annealing temperature, the dislocation density in the Ti552 alloy progressively diminishes. Literature (Gu et al., 2018; Shen et al., 2024) also obtained the similar conclusion through TEM observations.
3.3 Corrosion behavior
3.3.1 OCP measurements
Fig. 9 illustrates the OCP curves responses of annealed Ti552 alloy immersed in a 3.5 wt% NaCl solution for 36,000 s. As the soaking time extends, the OCP curves progressively shift towards a more positive direction and eventually stabilize. This indicates the progressive formation of a stable and complete passivation film on the surface of the alloy, which has a protective effect on the material surface (Yu and Scully, 2012). Additionally, the OCP curves show variations, primarily due to the dynamic interplay between film formation and dissolution (Wu et al., 2018). Furthermore, with increasing annealing temperatures, the OCP curves increasingly shift towards the positive direction, suggesting a reduced tendency for electron loss and corrosion tendency. In summary, the alloy exhibits optimal corrosion resistance when annealed at 800 °C.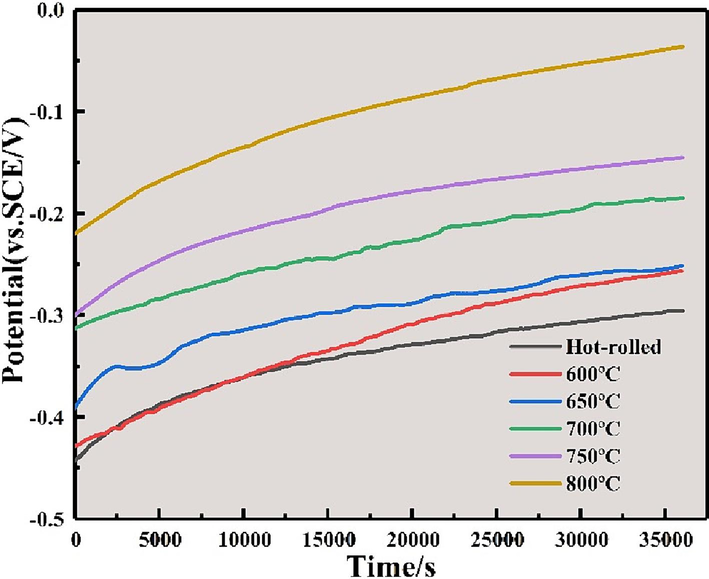
Variations of open circuit potential (OCP) with time for annealed Ti552 alloys in 3.5 wt% NaCl solution.
3.3.2 Potentiodynamic polarization test
Fig. 10a displays the potentiodynamic polarization curves of the Ti552 titanium alloy in various states in a 3.5 wt% NaCl solution. The cathodic polarization curves show no significant differences, indicating a similar cathodic response across all samples. In the anodic region, all polarization curves enter an extensive passivation zone, characteristic of spontaneous passivation behavior, suggesting the formation of a stable protective film (Bai et al., 2017; Wang et al., 2018; Su et al., 2021). This phenomenon is attributed to the hydrolysis of TiCl4 in the NaCl solution (Su et al., 2022; González and Mirza-Rosca, 1999; Chen et al., 2017).
Ti + 4Cl- → [TiCl]4- ↔ TiCl4 + 4e- (1)
TiCl4 + 2H2O → TiO2 + 4Cl-+4H+ (2)
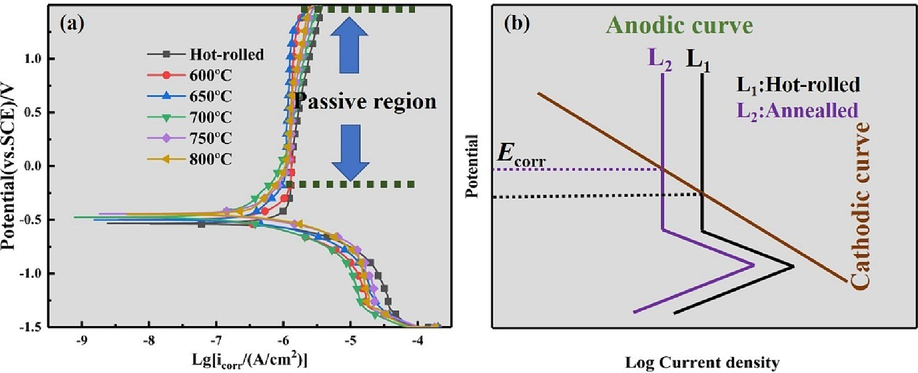
Potentiodynamic polarization tests: (a) potentiodynamic polarization curves of annealed Ti552 alloy in 3.5 wt% NaCl solution; (b) ideal schematic diagrams for the corrosion behavior in NaCl solution based on the mixed potential theory.
The above equation reveals that initially, the abundance of Cl- ions in the NaCl solution promotes the formation of [TiCl]4- ions. Subsequently, the [TiCl]4- ions are converted into TiCl4. In the next step, TiCl4 rapidly undergoes hydrolysis to form a TiO2 passivation film, effectively preventing Cl- ions from eroding the titanium substrate.
Based on the mixed potential theory, Fig. 10b presents an idealized schematic of the corrosion behavior of annealed specimens in NaCl solution. The orange line represents the cathodic curve, L1 denotes the anodic curve of the hot-rolled specimen, and L2 indicates the anodic curve of the annealed specimens. It is observed that there is a single intersection of the cathodic and anodic curves within the passivation zone, indicative of the spontaneous passivation behavior of the specimens in NaCl solution.
Table 6 lists the parameters derived from the potentiodynamic polarization curves mentioned above. These parameters include βa (anodic Tafel slope), βc (cathodic Tafel slope), Ecorr (corrosion potential), and icorr (corrosion current density). The icorr (μA/cm2) value is calculated by extrapolating the Tafel lines from the cathodic and anodic branches of the polarization curves (Mansfeld, 2005; McCafferty et al., 2005).
Materials
Temp-rature
/℃
Ecorr(mv vs.SCE)
icorr(μA·cm−2)
icorr*(10−1 μA·cm−2)
-βc /(mv/dec)
βa/(mv/dec)
Corrosion rate (10−3 mm·year−1)
Obtaind from icorr
Obtained from weight loss
Ti552
Hot-rolled
−509 ± 9
0.532 ± 0.020
4.768 ± 0.081
158.87 ± 0.008
311.78 ± 0.006
6.23 ± 0.25
5.51 ± 0.09
600
−490 ± 8
0.335 ± 0.016
4.097 ± 0.083
151.28 ± 0.005
263.99 ± 0.008
3.96 ± 0.18
4.72 ± 0.07
650
−479 ± 5
0.280 ± 0.012
3.420 ± 0.078
143.21 ± 0.002
422.06 ± 0.006
3.33 ± 0.19
3.94 ± 0.07
700
−463 ± 6
0.256 ± 0.009
2.963 ± 0.066
132.11 ± 0.006
220.03 ± 0.008
3.02 ± 0.15
3.47 ± 0.14
750
−437 ± 9
0.232 ± 0.018
2.284 ± 0.057
118.71 ± 0.009
291.50 ± 0.003
2.73 ± 0.21
2.65 ± 0.08
800
−429 ± 5
0.197 ± 0.016
1.844 ± 0.071
141.56 ± 0.005
489.56 ± 0.008
2.33 ± 0.28
1.96 ± 0.07
Fig. 11 illustrates the variation in icorr values with annealing temperature, providing a clearer visual representation. It is observed that icorr continuously decreases as the annealing temperature increases in a 3.5 wt% NaCl solution. Conversely, as shown in Table 6, Ecorr consistently increases with rising annealing temperatures, indicating a shift of the polarization curves towards more positive potentials. The decreasing icorr and increasing Ecorr unequivocally indicate enhanced corrosion resistance with higher annealing temperatures, both kinetically and thermodynamically. The corrosion rate (CR) can be calculated using the following equation (Yang et al., 2018):
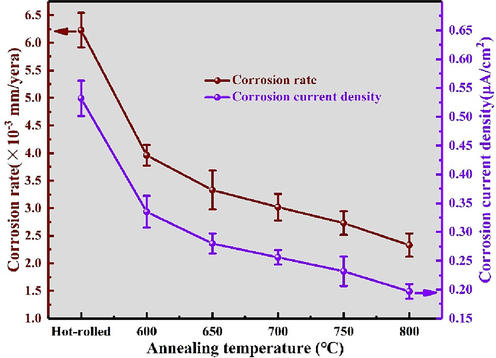
Corrosion rate and corrosion current density of annealed ti552 alloy in electrochemical corrosion.
Here, M represents the atomic weight of Ti (g), n denotes the number of electrons transferred in the corrosion reaction, and ρ signifies the density of Ti (g/cm3). Table 3 enumerates the calculated corrosion rates of the annealed Ti552 alloy in a 3.5 wt% NaCl solution. It is evident that as the annealing temperature increases from 600 °C to 800 °C, the corrosion rate decreases from 12.28 × 10⁻³ to 8.55 × 10⁻³ (mm/year). Consequently, the gradual reduction in corrosion rate indicates that elevating the annealing temperature can enhance the corrosion resistance of the Ti552 alloy. Furthermore, as depicted in Fig. 11, there is a positive correlation between the corrosion rate and corrosion current density with increasing annealing temperatures.
3.3.3 Electrochemical impedance spectroscopy (EIS) measurements
EIS measurements in a 3.5 wt% NaCl solution were conducted to gain a deeper understanding of how different annealing temperatures affect the corrosion resistance of the annealed Ti552 alloy. Fig. 12 presents the Nyquist plots, Bode plots, and the equivalent circuit diagrams.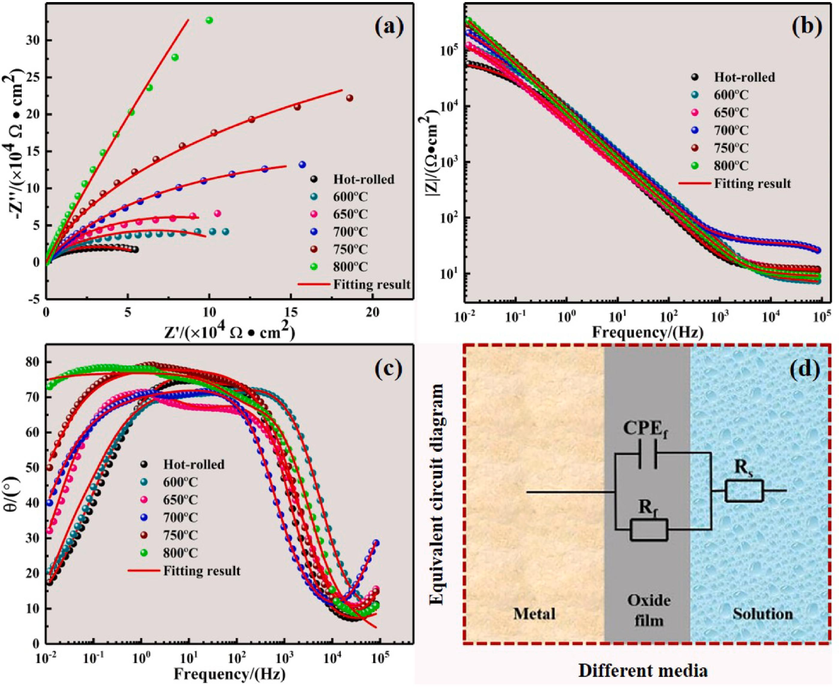
EIS measurements of annealed Ti552 alloy in 3.5 wt% NaCl solution: (a) Nyquist plots; (b) Bode-|Z| plots; (c) Bode-phase plots; (d) Equivalent circuit diagram.
As depicted in Fig. 12a, all Nyquist plots exhibit a single capacitance loop, typically corresponding to a capacitance time constant. This phenomenon is attributed to the formation of a highly stable and dense oxide film on the surface (Wang et al., 2016; Huang et al., 2011). However, the diameters of the capacitive arcs vary. Typically, a larger diameter of the capacitive arc indicates greater resistance (Walter, 1986). Consequently, in impedance spectroscopy, a larger capacitive arc is generally interpreted as indicative of higher corrosion resistance, suggesting that an increase in annealing temperature reduces charge transfer resistance and the dissolution rate of the surface oxide film.
Fig. 12b displays the Bode-|Z| plots of the annealed Ti552 alloy in 3.5 wt% NaCl solution. In the high-frequency region, the curves nearly all overlap and converge towards 0, forming a horizontal line that is independent of frequency. This indicates effective infiltration of the NaCl solution by the Ti552 alloy, with the solution penetration on the alloy surface reaching saturation. In the mid-frequency region, all Bode-|Z| plots show a linear trend with a slope near −1. In the low-frequency region, the impedance value rises with higher annealing temperatures, suggesting that an increase in annealing temperature enhances corrosion resistance of the material. The impedance value at the termination frequency (10−2 Hz) reaches up to 106 (Ω·cm2), which indicates the formation of a highly stable film.
Fig. 12c illustrates the Bode-phase profiles of the Ti552 alloy at various annealing temperatures. All samples exhibit a single peak, indicating a typical single time constant (Hernández et al., 2011). At very high frequencies, the Ti552 alloy displays the lowest phase angle (5°-10°), suggesting that the impedance values in this frequency range are primarily influenced by the electrolyte resistance between the sample and the reference electrode. In the medium frequency region, the phase angles approach 80° across a broad frequency range, signifying the presence of a stable and dense film on the specimen surface in 3.5 wt% NaCl solution. In the low-frequency region, as immersion time increases, phase angles demonstrate a significant downward trend with decreasing frequency. This suggests that the corrosion products may be degraded by Cl- ions and other dissolved ions, thus losing their protective effect and accelerating the corrosion process. A comprehensive analysis reveals that the phase angle trend of the annealed Ti552 alloy is similar to that of other titanium alloys (Karthega et al., 2007; Xu et al., 2012). The phase angle at 800 °C annealing exhibits the largest and widest range in the mid-frequency region, and its downward trend in the low-frequency region is the slowest, indicating superior corrosion resistance.
The equivalent circuit for the annealed Ti552 alloy in a 3.5 wt% NaCl solution, confirmed by Zsimpwin software, simulates its interfacial behavior and elucidates the aforementioned electrochemical impedance measurements. Given the presence of only one time constant, the equivalent circuit (Su et al., 2022) is chosen, as depicted in Fig. 12d. Fig. 12 (a-c) visually demonstrates that the experimental data generally align with the simulated data obtained from complex nonlinear least squares (CNLS) simulations, indicating the suitability of the selected circuit. Detailed EIS fitting data are presented in Table 7. The Chi-square parameter (χ2) values are maintained at 10-3 and the sums of squares (λ2) values converge to 0, indicating a good fit with this circuit. Additionally, Table 7 reveals that the fitting error for each component is less than 10 percent, further indicating the accuracy of the data fitted to this circuit. In this equivalent circuit, Rs represents the solution resistance, Rf signifies the resistance of the dense passivation film formed by oxide/corrosion products, and CPEf represents the constant phase element associated with the oxide/corrosion product passivation film. The CPE is utilized to account for the distribution of time constants arising from surface heterogeneities. The impedance of the CPE is defined as follows (Peng et al., 2019):
Samples
Rs (Ω·cm2)
CPEf (μS·sncm−2)
nf
Rf (106Ω·cm2)
χ2 (10−3)
λ2
Cf (μF·cm−2)
d (nm)
Hot-rolled
11.78
33.88
0.8826
1.483
5.567
0.038
57.04
1.63
0.07
Error%
1.744
1.835
0.406
2.624
600 ℃
6.68
30.95
0.9029
1.684
5.035
0.042
55.89
1.86
0.05
Error%
2.242
1.608
0.329
2.911
650 ℃
11.38
30.08
0.8922
1.802
4.006
0.041
48.73
1.91
0.11
Error%
1.619
1.272
0.313
4.923
700 ℃
8.481
28.65
0.9051
1.913
1.719
0.034
43.59
2.01
0.09
Error%
0.974
0.781
0.171
2.961
750 ℃
11.81
27.36
0.9159
2.121
2.543
0.031
39.72
2.1
0.05
Error%
1.208
0.931
0.213
5.157
800 ℃
9.145
25.73
0.9238
2.238
2.302
0.034
35.95
2.24
0.09
Error%
2.525
0.606
0.303
2.356
Here, Q represents the magnitude of CPE, j is the imaginary unit (j = ), ω denotes the angular frequency (ω = 2πf, where f is the frequency), and n is the CPE exponent, which ranges from − 1 to 1. The exponent n, associated with factors like surface roughness and potential, reflects the degree of deviation of the actual capacitance from the ideal capacitance.
Generally, polarization resistance (Rp) can reflect the corrosion resistance of materials. Higher Rp correlates with improved corrosion resistance (Wang et al., 2014). EIS provides a means to determine the polarization resistance, Rp (Scully, 2000). According to the literature (Wang et al., 2014; King et al., 2014), when fitting the impedance spectrum using the aforementioned equivalent circuit, the polarization resistance is represented as: Rp = Rf. Fig. 13a visually illustrates the variation of Rp values for the annealed Ti552 alloy in a 3.5 wt% NaCl solution. The Rp values range from 1.483 (Ω·cm2) to 2.238 (Ω·cm2) and exhibit an increasing trend, indicating increasing corrosion resistance. The literature (Su et al., 2021) indicates that this phenomenon is primarily due to the increasing thickness of the oxide film. As per the literature (Hirschorn et al., 2010), the thickness of the oxide film on the annealed Ti552 alloy can be calculated using the following equation:
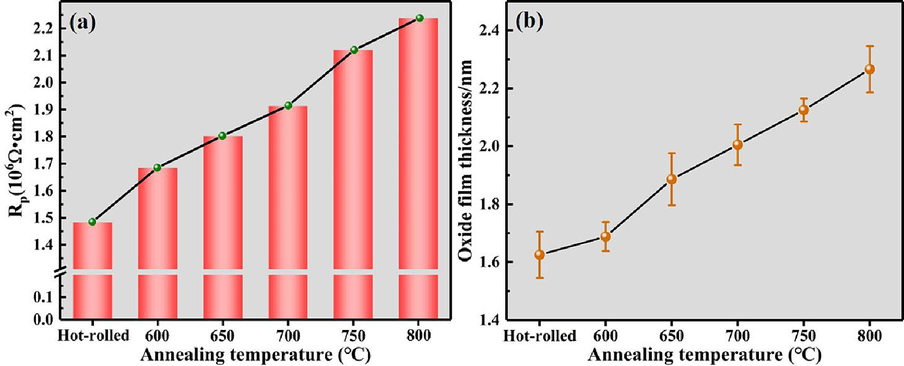
Test results:(a)Variations of polarization resistance as a function of annealing temperature in 3.5 wt% NaCl solution; (b) Average oxide film thickness at different annealing temperatures measured by SEM.
In this equation, d represents the thickness of the oxide film, ε is the relative dielectric constant of the oxide film, ε0 is the free space dielectric constant (8.8542 × 10⁻¹⁴F·cm−1), and C represents the capacitance of the oxide film. Studies (Pan et al., 1994) have shown that the film formed on titanium alloys shares characteristics with rutile, hence the value of ε is taken as 65 (Bolat et al., 2013). According to literature (Orazem et al., 2013), the capacitance C is calculated using the following equation:
Here, Q represents the value of the CPE, n is the index of the CPE, and R is the value of the resistor connected in parallel with CPE. Consequently, the capacitance C and the thickness d of the oxide film can be calculated using Eqs. (5) and (6), as presented in Table 7. It is observed that the oxide film thickness and polarization resistance exhibit the same trend, namely, both increase with rising annealing temperatures. Additionally, the interface of the annealed specimens was imaged using
SEM, and the average oxide film thickness was measured, as illustrated in Fig. 13b. The measured results are found to be generally consistent with the calculated values mentioned above. Therefore, this result reconfirms that the corrosion resistance of the Ti552 titanium alloy enhances with increasing annealing temperatures.
3.3.4 Static immersion testing
To gain a deeper insight into the impact of annealing temperature on the corrosion behavior of Ti552 alloy, static immersion experiments were conducted in a 3.5 wt% NaCl solution. Fig. 14a shows the mass loss of the samples following 30 days of static immersion. It is observed that as the annealing temperature increases from 600 °C to 800 °C, the mass loss decreases from 0.179 to 0.082 (mg/cm2), indicating that higher annealing temperatures enhance the corrosion resistance of the Ti552 alloy. Furthermore, the average corrosion rate of the sample can be calculated based on the mass loss using the following equation:
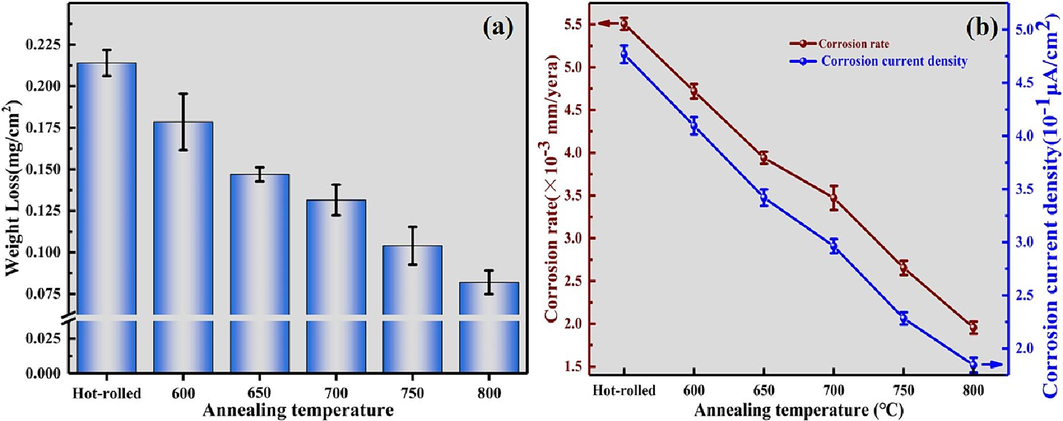
Results of static immersion tests. (a)Variations in loss of mass for annealed Ti552 alloy in 3.5 wt% NaCl solution for 30 days. (b)Varies of corrosion rate and corrosion current density of Ti552 alloy with annealing temperature.
In this equation, I represents the average corrosion rate (mm·year−1); K is a constant (8.76 × 10⁴); W denotes the mass lost (g); A is the surface area of the specimen exposed to the solution (cm2); T refers to the time of immersion in the solution (h); ρ is the density of Ti552 alloy (g/cm3). The average corrosion rates calculated from Eq. (7) for annealed Ti552 alloy are shown in Fig. 14(b). It is clear that the corrosion rate decreases with increasing annealing temperatures. Furthermore, Ti552 alloy, known for its high corrosion resistance, exhibits a corrosion rate ranging from 0.001 to 0.01 (mm/year).
Given that the corrosion rate is directly proportional to the corrosion current density, some studies use thickness loss, calculated from the corrosion rate, to quantify corrosion loss. In reality, the average corrosion current density is more appropriate for evaluating the extent of corrosion damage (Yang et al., 2018). This can be computed using the following equation for comparison with electrochemical test results:
In this equation, icorr* represents the average corrosion current density (A/cm2); Δm is the mass of corrosion loss (g); n is the ionic valence; F is the Faraday constant (96485C/mol); M is the molar mass of Ti (47.87 g/mol); S is the surface area of the specimen exposed to the solution (cm2); and T is the time of immersion in the NaCl solution (h). The calculation results of the average corrosion current density are presented in Table 6, and its trend is depicted in Fig. 14(b). It is observed that with increasing annealing temperatures, the average corrosion current density progressively decreases, signifying a gradual enhancement in corrosion resistance.
Upon comparing the corrosion current densities during immersion and potentiodynamic polarization, it is evident that the trends are alike, albeit with higher corrosion current density values during potentiodynamic polarization. This phenomenon is attributed to the varying accumulation states of corrosion products on the sample surface (Yang et al., 2018). During the mass loss measurements, the samples remain in a stationary solution, and the accumulated corrosion products are not promptly removed from the surface, leading to partial coverage by corrosion products, which inhibits the corrosion process to an extent. Additionally, the impact of other electrochemical reactions on the complex electron migration process is often overlooked during immersion. Conversely, during potentiodynamic polarization, the sample surfaces are freshly polished, resulting in higher corrosion current density values.
3.3.5 Corrosion mechanisms
The above experimental results demonstrated that the corrosion behavior of Ti552 alloy after annealing at different temperatures in 3.5 wt% NaCl solution was similar, but the corrosion rates varied. In the OCP tests, the hot-rolled Ti552 alloy required the longest time to stabilize the potential and exhibited the lowest potential; the potential was highest when annealed at 800 ℃. In the potentiodynamic polarization tests, the hot-rolled Ti552 alloy exhibited the lowest corrosion potential and the highest corrosion current density; this trend was reversed when annealed at 800 ℃. The results of the EIS analysis revealed that the annealed Ti552 alloy demonstrated capacitance. Following 800 ℃ annealing, the alloy exhibited the highest polarization resistance (Rp), which then decreased sequentially with decreasing annealing temperature. The Rp of the hot-rolled alloy proved to be the lowest. The results of weight loss experiments on Ti552 alloy indicated that the fastest corrosion rate occurred in the hot rolled condition and the slowest corrosion rate was observed in the annealed condition at 800 ℃. In summary, the corrosion resistance in the hot-rolled state is the worst, whereas the corrosion resistance following annealing at 800 ℃ is the best. Combining on the content of Section 3.2.2, it can be seen that there exists a negative correlation between the dislocation density of the Ti552 alloy and its corrosion resistance. Dislocations are defects with high energy and will react easily with other substances, so the higher the density of dislocations the worse the corrosion resistance. The observed differences in corrosion resistance between the described alloy samples could be attributed to differences in the corrosion morphology of annealed Ti552 alloy.
According to the studies (Ningshen et al., 2015; Godlewska et al., 2014; Zheng et al., 2015), the native oxide films of annealed Ti552 alloy are primarily consist of TiO2, ZrO2, Al2O3, MoO2 (Park et al., 1996), and Nb2O5. Ti + O2 → TiO2(9) Zr + O2 → ZrO2(10) 2Al + 3/2O2 → Al2O3(11) Mo + O2 → MoO2(12) 2Nb + 5/2O2 → Nb2O5(13)
The end values of the OCP curves (Fig. 9) for Ti552 alloys at different annealing temperatures in 3.5 wt% NaCl solution suggest the thermodynamic stabilization range of TiO2, ZrO2, Al2O3, MoO2, and Nb2O5 (Pourbaix, 1974). Therefore, from a thermodynamic perspective, the native oxide film is capable of stabilized in 3.5 wt% NaCl solution. The OCP curves further demonstrate that there is no significant dissolution of the native oxide film, namely, the potential does not drop sharply in the 3.5 wt% NaCl solution. In addition, the EIS results (Fig. 12(a–c)) reveal that the annealed Ti552 alloy in 3.5 % wt.% NaCl solution demonstrates a low current density (10−6 A/cm2) and high polarization impedance (106 Ω·cm2), as shown in Fig. 11 and Table 6, respectively. These findings indicate that the annealed Ti552 alloy forms a highly densely packed and stable film. Consequently, this annealed alloy exhibits excellent corrosion resistance in NaCl solution. An in-depth study of the corrosion mechanism of the annealed Ti552 alloy was not pursued due to the minimal differences observed in the corrosion surface morphology of the specimens before and after corrosion in different states (Fig. 15).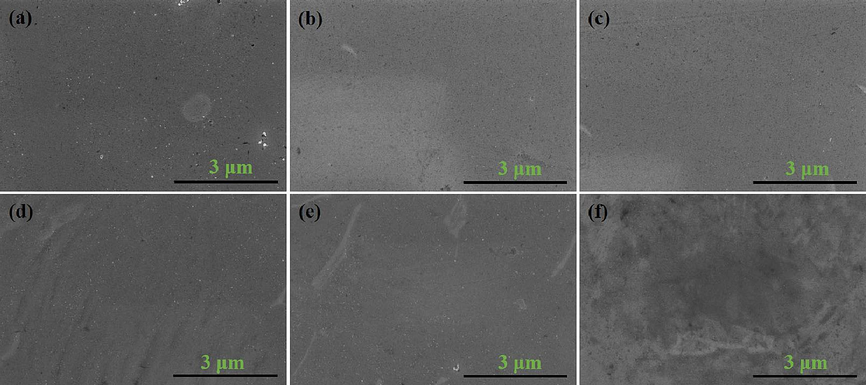
Results of static immersion tests of annealed Ti552 alloy in 3.5 wt% NaCl solution: (a) Hot-rolled state, (b) 600 ℃, (c) 650 ℃, (d) 700 ℃, (e) 750 ℃, (f) 800 ℃.
Nevertheless, the studies (Xia et al., 2016; Wang et al., 2013) have demonstrated that the volume fraction of the β-phase significantly influences the corrosion resistance of titanium alloys. Fig. 16 depicts the correlation between corrosion current density and the volume fraction of the β-phase for annealed Ti552 alloy in 3.5 wt% NaCl solution. Observations indicate that the corrosion current density decreases with an increase in the volume fraction of the β-phase. This phenomenon indicates an enhancement in corrosion resistance as the volume fraction of the β-phase increases. This assertion is further supported by the microstructure evolution illustrated in Fig. 17. The literature (Su et al., 2021) indicates that this phenomenon may be attributed to elemental segregation (Table 5). As illustrated in Fig. 5, a higher concentration of Al element is found in the α-phase and a greater amount of Zr element in the β-phase. In titanium alloys, Mo and Nb elements are also predominantly distributed in the β-phase (Su et al., 2021). However, ZrO2, MnO2, and Nb2O5 exhibit higher stability compared to Al2O3. The oxide film of the β-phase, distributed along the grain boundaries of the α-phase in the annealed Ti552 alloy, is richer in ZrO2, MnO2, and Nb2O5 compared to the α-phase. Consequently, the α-phase undergoes preferential corrosion compared to the β-phase (Meng et al., 2021). This is also corroborated in the literatures (Chen and Tsai, 2011; Guo et al., 2009) through detection methods such as AFM and XPS. M Levy (Levy and Sklover, 1969) demonstrated that micro-galvanic couple effects occur between the α-phase and β-phase, resulting in preferential corrosion of the α-phase, acting as the anode, and a slower corrosion rate of the β-phase, acting as the cathode. Consequently, the volume fraction of the β-phase plays a crucial role in determining the corrosion resistance of annealed Ti552 alloy. Furthermore, the grain size of the α-phase significantly influences corrosion resistance of Ti552 alloy. A smaller grain size results in higher grain boundary densities. Typically, grain boundaries exhibit a higher concentration of dislocations or defects. Some researchers have suggested that passivation initially occurs at the surface crystal defects of Ti (Balyanov et al., 2004). As a result, a decrease in grain size of Ti552 alloy leads to an increases in nucleation sites for the passivation film, thereby resulting in a higher proportion of passivated layers and a reduced corrosion rate (Miyamoto et al., 2008). In summary, it is likely that the volume fraction of the β-phase and the grain size of the α-phase synergistically affect the corrosion resistance of annealed Ti552 alloy.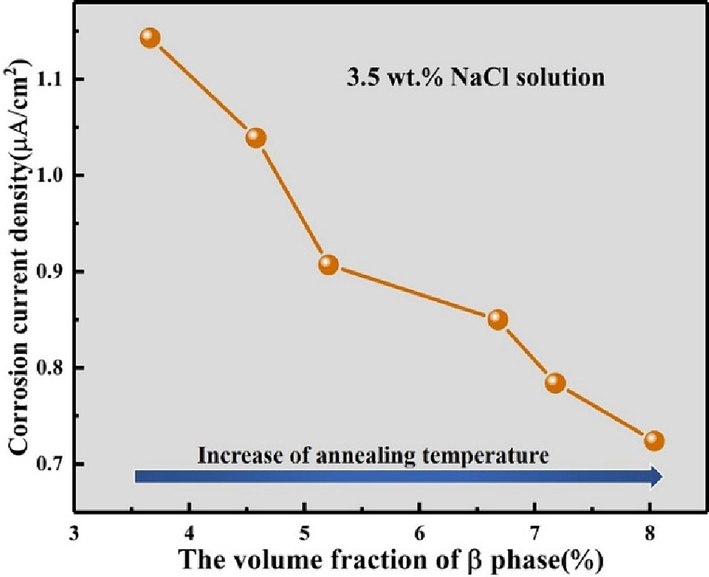
The relationship between the corrosion current density and volume fraction of β phase in 3.5 wt% NaCl solution.
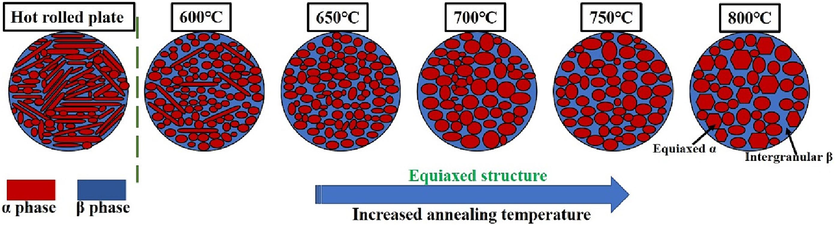
Microstructural evolution of the Ti552 alloy at different annealing temperatures.
4 Conclusions
The effect of annealing temperature on the mechanical properties and corrosion behavior of Ti552 alloy has been evaluated. The main conclusions of this study are as follows:
Microstructural analysis of the Ti552 alloy indicates that the elongated α-phase observedin the hot-rolled state predominantly transitions to an equiaxed α-phase upon annealing, with a concurrent gradual increase in the intergranular β-phase. Upon annealing at 800 °C for 1 h, the grain size attains its maximum, whereas the α-phase content reaches its minimum.
The hot-rolled Ti552 alloy demonstrates the highest levels of strength and hardness, yet exhibits the lowest elongation. With an increase in annealing temperature, the strength and hardness of the Ti552 alloy progressively decrease, whereas its elongation correspondingly increases. Variations in mechanical properties are primarily attributed to changes in dislocation density, driven by recovery and recrystallization processes.
In the anodic branch, the potentiodynamic polarization curve enters directly into a large and stable passivation region, indicating that the Ti552 alloys in various annealed states, when immersed in 3.5 wt% NaCl solution, exhibit spontaneous passivation behavior. This is attributed to the formation of dense oxide films. Similarly, results from electrochemical impedance spectroscopy confirm the formation of a dense oxide film on the annealed Ti552 alloy immersed in 3.5 wt% NaCl solution, attributed to a low current density (10-6 A/cm2) and high polarization impedance (106 Ω·cm2).
Diverse annealing temperatures lead to consistent consistent corrosion behavior but varying levels of corrosion resistance. Both electrochemical and static immersion tests demonstrate that the corrosion resistance of the annealed Ti552 alloy improves as the annealing temperatures increase. A comprehensive analysis suggests that the volume fraction of the β-phase and the grain size of the α-phase could synergistically influence the corrosion resistance of annealed Ti552 alloy.
CRediT authorship contribution statement
Peng Shao: Data curation, Writing – original draft. Han Xiao: Conceptualization, Methodology, Investigation, Validation. Kun Liu: Project administration, Supervision. Xuan Chen: Investigation. Mei-yu Hou: Data curation. Qing-biao Zhang: Data curation. Cheng Qian: Software. Sheng Huang: Software.
Acknowledgments
The work is supported by the Yunnan Provincial Major Science and Technology Special Plan of China (No. 202002AB080016).
Declaration of competing interest
The authors declare that they have no known competing financial interests or personal relationships that could have appeared to influence the work reported in this paper.
References
- Improved corrosion behaviour of electron beam melted Ti-6Al–4V alloy in phosphate buffered saline. Corros. Sci.. 2017;123:289-296.
- [CrossRef] [Google Scholar]
- Corrosion resistance of ultra fine-grained Ti. Scr. Mater.. 2004;51:225-229.
- [CrossRef] [Google Scholar]
- Electrochemical characterization of ZrTi alloys for biomedical applications. Electrochim. Acta. 2013;88:447-456.
- [CrossRef] [Google Scholar]
- Influence of surface nano-structuring on microstructure, corrosion behavior and osteoblast response of commercially pure titanium treated through ultrasonic shot peening. JOM.. 2022;74:584-595.
- [Google Scholar]
- In situ corrosion monitoring of Ti–6Al–4V alloy in H2SO4/HCl mixed solution using electrochemical AFM. Electrochim. Acta. 2011;56:1746-1751.
- [CrossRef] [Google Scholar]
- Corrosion Behaviour of Selective Laser Melted Ti-TiB Biocomposite in Simulated Body Fluid. Electrochim. Acta. 2017;232:89-97.
- [CrossRef] [Google Scholar]
- Metastable pitting corrosion behavior of laser powder bed fusion produced Ti-6Al-4V in Hank’s solution. Corros. Sci.. 2022;203:110333
- [Google Scholar]
- Metastable pitting corrosion behavior and characteristics of passive film of laser powder bed fusion produced Ti–6Al–4V in NaCl solutions with different concentrations. Corros. Sci.. 2023;215:111017
- [Google Scholar]
- Distinction in corrosion resistance of selective laser melted Ti-6Al-4V alloy on different planes. Corros. Sci.. 2016;111:703-710.
- [Google Scholar]
- Heat treatment degrading the corrosion resistance of selective laser melted Ti-6Al-4V alloy. J. Electrochem. Soc.. 2017;164:C428-C434.
- [Google Scholar]
- Effects of annealing temperature and quenching medium on microstructure, mechanical properties as well as fatigue behavior of Ti-6Al-4V alloy. Mater. Sci. Eng. A. 2017;683:1-8.
- [CrossRef] [Google Scholar]
- Electrochemical behaviour of passive film formed on the surface of Ti-6Al-4V alloys fabricated by electron beam melting. Corros. Sci.. 2018;145:80-89.
- [Google Scholar]
- Stress corrosion characteristics of electron beam welded titanium alloys joints in NaCl solution. Mater. Charact.. 2022;192:112126
- [CrossRef] [Google Scholar]
- Hot corrosion of Ti–46Al–8Ta (at.%) intermetallic alloy. Corros. Sci.. 2014;78:63-70.
- [CrossRef] [Google Scholar]
- Study of the corrosion behavior of titanium and some of its alloys for biomedical and dental implant applications. J. Electroanal. Chem.. 1999;471:109-115.
- [CrossRef] [Google Scholar]
- Simultaneously improving mechanical properties and corrosion resistance of pure Ti by continuous ECAP plus short-duration annealing. Mater. Charact.. 2018;138:38-47.
- [Google Scholar]
- Electrochemical and XPS studies of corrosion behavior of Ti–23Nb–0.7Ta–2Zr–O alloy in Ringer’s solution. Mater. Chem. Phys.. 2009;113:816-820.
- [CrossRef] [Google Scholar]
- Effect of zirconium content on the microstructure, physical properties and corrosion behavior of Ti alloys. Mater. Sci. Eng. A. 2014;616:268-274.
- [CrossRef] [Google Scholar]
- Electrochemical impedance spectroscopy investigation of the electrochemical behaviour of copper coated with artificial patina layers and submitted to wet and dry cycles. Electrochim. Acta. 2011;56:2801-2814.
- [CrossRef] [Google Scholar]
- Determination of effective capacitance and film thickness from constant-phase-element parameters. Electrochim. Acta. 2010;55:6218-6227.
- [CrossRef] [Google Scholar]
- Huang, Z., Xiao, H., Yu, J., Zhang, H., Huang, H., Yu, K., Zhou, R., 2022. Effects of different annealing cooling methods on the microstructure and properties of TA10 titanium alloys. J. Mater. Res. Technol. 18, 4859-4870. https://www.sciencedirect.com/science/article/pii/S2238785422006494?via%3Dihub.
- Inhibition effect of inorganic and organic inhibitors on the corrosion of Mg–10Gd–3Y–0.5Zr alloy in an ethylene glycol solution at ambient and elevated temperatures. Electrochim. Acta. 2011;56:10166-10178.
- [CrossRef] [Google Scholar]
- Effect of the annealing temperature on the microstructural evolution and mechanical properties of TiZrAlV alloy. Mater. Des.. 2013;52:981-986.
- [Google Scholar]
- Influence of potential on the electrochemical behaviour of β titanium alloys in Hank’s solution. Acta Biomater.. 2007;3:1019-1023.
- [CrossRef] [Google Scholar]
- Accurate electrochemical measurement of magnesium corrosion rates; a combined impedance, mass-loss and hydrogen collection study. Electrochim. Acta. 2014;121:394-406.
- [CrossRef] [Google Scholar]
- Anodic polarization of titanium and titanium alloys in hydrochloric acid. J. Electrochem. Soc.. 1969;116:323-328.
- [Google Scholar]
- Microstructure, mechanical properties and corrosion behaviors of biomedical Ti-Zr-Mo-xMn alloys for dental application. Corros. Sci.. 2019;161:108195
- [CrossRef] [Google Scholar]
- Investigation of microstructures, textures, mechanical properties and fracture behaviors of a newly developed near α titanium alloy. Mater. Sci. Eng. A. 2020;775:138996
- [CrossRef] [Google Scholar]
- Tafel slopes and corrosion rates obtained in the pre-Tafel region of polarization curves. Corros. Sci.. 2005;47:3178-3186.
- [CrossRef] [Google Scholar]
- Validation of corrosion rates measured by the Tafel extrapolation method. Corros. Sci.. 2005;47:3202-3215.
- [CrossRef] [Google Scholar]
- Effect of annealing temperature on the microstructure and corrosion behavior of Ti-6Al-3Nb-2Zr-1Mo alloy in hydrochloric acid solution. Corros. Sci.. 2021;183:109320
- [CrossRef] [Google Scholar]
- Corrosion of ultra-fine grained copper fabricated by equal-channel angular pressing. Corros. Sci.. 2008;50:1215-1220.
- [CrossRef] [Google Scholar]
- Corrosion performance and surface analysis of Ti–Ni–Pd–Ru–Cr alloy in nitric acid solution. Corros. Sci.. 2015;91:120-128.
- [CrossRef] [Google Scholar]
- Dielectric properties of materials showing Constant-Phase-Element (CPE) impedance response. J. Electrochem. Soc.. 2013;160:C215.
- [Google Scholar]
- Electrochemical and XPS studies of titanium for biomaterial applications with respect to the effect of hydrogen peroxide. J. Biomed. Mater. Res.. 1994;28:113-122.
- [CrossRef] [Google Scholar]
- The corrosion behavior of sputter-deposited Mo-Ti alloys in concentrated hydrochloric acid. Corros. Sci.. 1996;38:1649-1667.
- [CrossRef] [Google Scholar]
- Microstructure and corrosion resistance of novel β-type titanium alloys manufactured by selective laser melting. J. Mater. Res. Technol.. 2022;19:4598-4612.
- [CrossRef] [Google Scholar]
- Optimization of annealing treatment and comprehensive properties of Cu-containing Ti6Al4V-xCu alloys. J. Mater. Sci. Technol.. 2019;35:2121-2131.
- [CrossRef] [Google Scholar]
- Improved corrosion resistance on selective laser melting produced Ti-5Cu alloy after heat treatment. ACS Biomater. Sci. Eng.. 2018;4:2633-2642.
- [Google Scholar]
- Polarization resistance method for determination of instantaneous corrosion rates. Corrosion.. 2000;56:199-218.
- [Google Scholar]
- Effect of LASER shock peening on microstructure, mechanical properties and corrosion behavior of interstitial free steel. Surf. Coat. Technol.. 2015;280:216-224.
- [Google Scholar]
- Microstructural modification and tensile behavior of if steel processed through surface mechanical attrition treatment. JOM.. 2020;72:4330-4339.
- [Google Scholar]
- Effect of solution treatment and aging on microstructure and tensile properties of high strength β titanium alloy, Ti–5Al–5V–5Mo–3Cr. Mater. Des.. 2015;66:596-610.
- [CrossRef] [Google Scholar]
- Annealing microstructure evolution and strength-plasticity enhancement mechanism of a novel titanium alloy Ti6422. Mater. Sci. Eng. A. 2024;897:146338
- [Google Scholar]
- Microstructure and mechanical properties of TC21 titanium alloy after heat treatment. Trans. Nonferrous Met. Soc. China.. 2013;23:2882-2889.
- [CrossRef] [Google Scholar]
- Annealed microstructure dependent corrosion behavior of Ti-6Al-3Nb-2Zr-1Mo alloy. J. Mater. Sci. Technol.. 2021;62:234-248.
- [CrossRef] [Google Scholar]
- Effect of zirconium content on the microstructure and corrosion behavior of as-cast Ti-Al-Nb-Zr-Mo alloy. J. Mater. Res. Technol.. 2021;15:4896-4913.
- [CrossRef] [Google Scholar]
- The corrosion behavior of Ti-6Al-3Nb-2Zr-1Mo alloy: Effects of HCl concentration and temperature. J. Mater. Sci. Technol.. 2021;74(2021):143-154.
- [CrossRef] [Google Scholar]
- Tuning microstructure and enhancing corrosion property of Ti-6Al-3Nb-2Zr-1Mo alloy through electron beam surface melting. Corros. Sci.. 2022;206:110520
- [CrossRef] [Google Scholar]
- Tuning microstructure and improving the corrosion resistance of Ti-6Al-3Nb-2Zr-1Mo alloy using the electron beam freeform fabrication. Chem. Eng. J.. 2022;444:136524
- [CrossRef] [Google Scholar]
- Heat treatment of Ti6Al4V produced by selective laser melting: microstructure and mechanical properties. J. Alloy. Compd.. 2012;541:177-185.
- [CrossRef] [Google Scholar]
- A review of impedance plot methods used for corrosion performance analysis of painted metals. Corros. Sci.. 1986;26:681-703.
- [CrossRef] [Google Scholar]
- The effect of fluoride ions on the corrosion behavior of pure titanium in 0.05M sulfuric acid. Electrochim. Acta. 2014;135:526-535.
- [CrossRef] [Google Scholar]
- Comparison of the corrosion behavior of pure titanium and its alloys in fluoride-containing sulfuric acid. Corros. Sci.. 2016;103:50-65.
- [CrossRef] [Google Scholar]
- Synergistic effects of fluoride and chloride on general corrosion behavior of AISI 316 stainless steel and pure titanium in H2SO4 solutions. Corros. Sci.. 2018;130:203-217.
- [CrossRef] [Google Scholar]
- Corrosion behavior and mechanisms of the heat-treated Ti5Cu produced by laser powder bed fusion. Corros. Sci.. 2023;221:111336.
- [Google Scholar]
- Effect of titanium or chromium content on the electrochemical properties of amorphous carbon coatings in simulated body fluid. Electrochim. Acta. 2013;112:603-611.
- [CrossRef] [Google Scholar]
- Effect of annealing temperatures on microstructural evolution and corrosion behavior of Ti-Mo titanium alloy in hydrochloric acid. Corros. Sci.. 2022;197:110079
- [CrossRef] [Google Scholar]
- The anisotropic corrosion behaviour of wire arc additive manufactured Ti-6Al-4V alloy in 3.5% NaCl solution. Corros. Sci.. 2018;137:176-183.
- [CrossRef] [Google Scholar]
- Vacuum diffusion bonding of TC4 titanium alloy and T2 copper by a slow cooling heat treatment. J. Mater. Process. Technol.. 2022;305:117595
- [CrossRef] [Google Scholar]
- Effect of zirconium content on the microstructure and corrosion behavior of Ti-6Al-4V-xZr alloys. Corros. Sci.. 2016;112:687-695.
- [CrossRef] [Google Scholar]
- Nanocomposite bilayer film for resisting wear and corrosion damage of a Ti–6Al–4V alloy. Surf. Coat. Technol.. 2012;206:4156-4165.
- [CrossRef] [Google Scholar]
- The role of nickel in mechanical performance and corrosion behaviour of nickel-aluminium bronze in 3.5 wt.% NaCl solution. Corros. Sci.. 2018;139:333-345.
- [CrossRef] [Google Scholar]
- Formation and control of martensite in Ti-6Al-4V alloy produced by selective laser melting. Mater. Des.. 2016;108:308-318.
- [CrossRef] [Google Scholar]
- Corrosion behaviour of a quenched and partitioned medium carbon steel in 3.5wt.% NaCl solution. Corros. Sci.. 2018;130:64-75.
- [CrossRef] [Google Scholar]
- Corrosion and passivation of annealed Ti–20Zr–6.5Al–4V alloy. Corros. Sci.. 2015;101:56-65.
- [CrossRef] [Google Scholar]
- Corrosion and passivity of Ti-13% Nb-13% Zr in comparison to other biomedical implant alloys. Corrosion.. 2012;76:965-976.
- [CrossRef] [Google Scholar]
- Isothermal oxidation mechanism of Nb–Ti–V–Al–Zr alloy at 700–1200 C: Diffusion and interface reaction. Corros. Sci.. 2015;96:186-195.
- [CrossRef] [Google Scholar]


