

Translate this page into:
Synthesis of nano calcium silicates from waste calcite and aragonite phases for efficient adsorptive removal of industrial organic pollutants
⁎Corresponding author. shanta_samina@yahoo.com (Samina Ahmed)
-
Received: ,
Accepted: ,
This article was originally published by Elsevier and was migrated to Scientific Scholar after the change of Publisher.
Peer review under responsibility of King Saud University.
Abstract
The present study focuses on the adsorption efficacy of solid-state synthesized calcium silicate for removing congo red dye. Three different sources were used as calcium precursors; one was calcium carbonate, and the other two were natural waste sources, aragonite (P. globosa) and calcite (Eggshells). Structural analysis and functional groups of the samples were carried out by X-ray diffractometer (XRD), and a Fourier Transform Infrared Spectrometer (FTIR). Various well-known models/equations models such as the Liner Straight Line method of Scherrer’s equation (LSLMSE), Sahadat-Scherrer Model (SSM), Monshi-Scherrer model (MSM), Williamson-Hall model (WHM), Size-Strain plot method (SSP), and Halder-Wagner Model (HWM) were applied to compute the crystallite size of the synthesized calcium silicates; the estimated crystallite size range was 8–77 nm. The adsorption efficacy of the synthesized E-CaSiO3, S-CaSiO3, and C-CaSiO3 was assessed under various provisos for eradicating Congo red dye from wastewater. Computed results revealed that the dye removal percentages were approximately 100 % at 120 min and 200 rpm for 0.2 g E-CaSiO3. The point of zero charge evaluation showed that the pH of the adsorbents during maximum dye removal was 7 and was less than the value of pHpzc. Thermodynamics studies confirmed that the adsorption process was spontaneous. The method of adsorption of dye by the adsorbent was more clearly comprehended by Langmuir, Freundlich, and Temkin adsorption isotherm. 151.28 mg/g was the maximum adsorption capacity for S- CaSiO3 depending on the Langmuir isotherm model’s linear form (R2 = 0.924).
Keywords
Aragonite
Calcite
Adsorption
Congo red
X-ray diffraction

Data availability
Data will be made available on request.
1 Introduction
Calcium silicate has diverse applications in several industrial sectors due to its identical properties; such as high chemical stability, thermal stability, corrosion resistance, high-temperature resistance, low thermal conductivity, etc (Palakurthy et al., 2019; Ernawati et al., 2021). They can be used as an adsorbent to remove the dye, as a filling agent in paper, rubber, and plastic, as a milking agent in paint, to shorten the time and baking temperature during the production of ceramic, and so on (Palakurthy et al., 2019; Ernawati et al., 2021).
There are numerous approaches for producing CaSiO3 such as the co-precipitation method, microwave synthesis, sol–gel method, solution combustion method, hydrothermal method, and solid-state reaction (Palakurthy et al., 2019; Abd Rashid et al., 2014). Among all synthesized techniques, the solid-state reaction is preferable and environmentally friendly because, in this reaction, there is no need for any solvent. A variety of starting materials have been employed in several studies to synthesize CaSiO3 such as Phuttawong et al. employed snail shell and rice husk ash (Phuttawong et al., 2015), the picking of eggshell and silica (commercial graded 99 %) was by the team of Vichaphund (Vichaphund et al., 2011), while a choice made by Palakurthy et al. was rice husk and eggshell (Palakurthy et al., 2019). Moreover, various temperature was applied by several researchers including Phuttawong et al. evaluated the calcination temperature of 800 °C to 1000 °C for the formation of calcium silicate (Phuttawong et al., 2015) while 1100 °C to 1450 °C was selected as a calcination temperature for the synthesis of calcium silicate by Rashid et al (Abd Rashid et al., 2014).
Recently, the awareness of environmental issues has renewed interest in minimizing environmental pollution by utilizing natural and waste resources. According to this perspective, in this research work calcite and aragonite were chosen as a calcium source, and commercially graded CaCO3 was used to compare the efficiency of waste-derived starting materials to synthesize CaSiO3 over the synthetic route. The percentages of calcium carbonate in calcite and aragonite are almost 95 and 97 %, respectively (Sahadat Hossain and Ahmed, 2023).
Nowadays, contamination of water by organic pollutants, dyes, phenolic compounds, pharmaceuticals, and personal care products is a significant environmental concern. Moreover, most industries generate huge amounts of contaminated wastewater during manufacturing. Improper disposal of polluted water causes adverse effects not only on the immediate water body but also on the surrounding environment, including soil, air, and water resources. The contamination of water, not only disrupts the ecosystem but also poses significant hazards like mutagenicity, carcinogenesis, and teratogenicity (Anirudhan et al., 2013; You et al., 2019). However, the treatment of water that contains dye such as organic Congo red is very complicated (Gao et al., 2021). For eradicating dyes from wastewater, multiple strategies have been explored including adsorption (Gao et al., 2021; Nodehi et al., 2020), ultrasound irradiation (Li et al., 2008), photocatalysis (Ali et al., 2020), ion exchange (Jia et al., 2020), mineralization (Diby Paul and Sanjay P Govindwar, n.d.), coagulation-flocculation process (Habiba et al., 2017), electrocatalysis (Wang et al., 2023), biodegradation (Wang et al., 2023), etc. Among all treatment techniques, adsorption is more favorable as a dye removal because this process exhibits high efficiency and is a cost-effective method (Afkhami and Moosavi, 2010; Ghosh et al., 2021; Aryee et al., 2022; Liu et al., 2022). As a result, a lot of investigation was executed to evaluate the adsorption process to purify wastewater by removing congo red (Wang et al., 2023; Han et al., 2022).
This research work has focused on the synthesis of calcium silicate utilizing two waste sources e.g eggshells and snail shells. Snail shells and eggshells are the source of calcium carbonate's naturally formed aragonite and calcite phases. Calcium silicate was also considered an efficient adsorbent for removing congo red dye from a solution that will be applicable for treating industrial wastewater. Moreover, to fully comprehend the characteristics of calcium silicate and its adsorption efficacy, some characterization approaches were also applied.
2 Materials and methods
2.1 Materials
Eggshells were accumulated from the nearby restaurants of the Bangladesh Council of Scientific and Industrial Research, Dhaka, Bangladesh. Snail shells were collected from Tangail. Moreover, 99.5 % pure CaCO3 was used to synthesize the desired product, and this chemical was purchased from a store. To experiment, 99 % silicon dioxide and distilled water were utilized.
2.2 Methods
Through the solid-state reaction method, calcium silicate was produced by incorporating calcium carbonate and silicon dioxide which can be expressed by the following reaction: CaCO3 + SiO2 = CaSiO3 + CO2
In this experiment, the molar ratio of CaCO3 and SiO2 was 1:1 and the calcination temperature of the mixture was 1000 °C. To synthesize CaSiO3, commercially graded silicon di-oxide was ground with the powder of calcite, aragonite, and commercially graded calcium carbonate respectively by using a ball mill for 3 h to get homogeneous powder. Then the products were obtained by taking the fine powder into the crucible and placing the crucible in a furnace. The temperature of the furnace was kept at 1000 °C for 4 h. After calcination, the desired products were ground using mortar pastel and stored for further experiment. The overall process for the synthesis of calcium silicate is portrayed in Fig. 1. The synthesized calcium silicate from three sources was symbolized as E-CaSiO3 (E-Eggshells), S-CaSiO3 (S-Snail shells), and C-CaSiO3 (C-Chemical) during characterizations and application.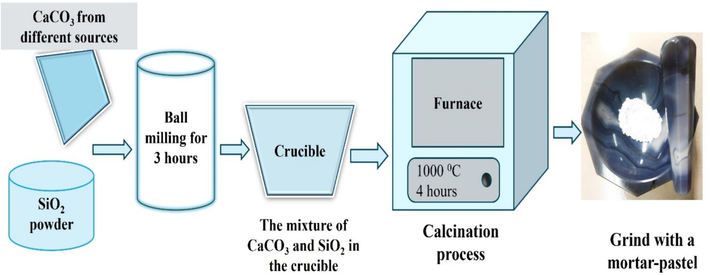
Flow diagram of the synthesis of calcium silicate from different sources.
3 Characterization of the synthesized products
3.1 Characterization through X-ray diffractometer
The phase and crystallographic parameters were examined through an X-ray diffractometer (Model: Rigaku SmartLab SE). During the scanning, the step size was 0.01 and the results were obtained with a scanning range of 2θ = 5–700. The XRD machine was operated at 40 kV and 50 mA while the temperature of the chiller was maintained at 20–25 °C. Cu was utilized as a source to generate radiation of CuKα with a wavelength of 1.5406 Å. Silicon was used as a standard reference to calibrate the XRD machine before the analysis of samples. The obtained reflected peaks were identified depending on the standard ICCD database.
3.2 FTIR analysis
The functional groups of the synthesized samples were explored by using the IR-Prestige 21 machine (Shimadzu, Japan) connected to an attenuated total reflection (ATR) to facilitate the FTIR machine. By retaining the spectral resolution of 4 cm−1, the spectrum of the obtained product was captured and the range of the spectrum was 400–4000 cm−1 wavenumber. Functioning the IR instrument at a standard temperature, the data was collected from 30 scans on average.
3.3 UV–visible spectrophotometer
The adsorption was measured by employing a UV–visible spectrophotometer (HITACHI, U-2910). The wavelength range was 450–550 nm and an optical glass cuvette was used for the investigation. But during the band gap exploration, 190–350 nm was the wavelength extent and a quartz cell (width 1 cm) was employed. During this investigation, two types of lighting sources (involving tungsten and deuterium lamps) functioned as a source of UV–visible light. The adsorption of the dye onto the adsorbent was measured at a maximum wavelength of 495 nm.
3.4 Study of adsorption
For the experiment of adsorption, 40 mL of 10 ppm dye was taken into 100 mL Erlenmeyer flasks, and 0.1 g adsorbent was added to it. Then the flask was placed in an orbital shaker for shaking at 250 rpm under room temperature for about 180 min. After a fixed time, a UV–Vis spectrophotometer was used to compute the absorbance of the decanted solution that was obtained after the settle down of the adsorbent. To calculate the removal percentage and adsorption capacity equations (1) and (2) were applied, (Hossain et al., 2022)
From both equations CO and Ct are the initial concentration and the final concentration at time t respectively. W reveals the weight of the dry adsorbent and V indicates the volume of the dye solution in milliliters.
4 Results and discussion
4.1 Analysis of phase through XRD
To analyze the phase and crystallographic parameters of E-CaSiO3, C-CaSiO3, and S-CaSiO3, the X-ray diffractometer was used, and the obtained crystallographic phase was correlated with the ICCD database (card no:#00-066-0271). After correlation, the reflected peaks and planes of the three samples are enlisted in Table 1. Consequently, the data in Table 1 confirmed that the synthesized samples from three different sources were calcium silicate and the chemical formula in the ICCD card was CaSiO3. Fig. 2, represents the X-ray diffractogram obtained by examining the synthesized three products.
Diffraction angle (2θ)
Planes (h k l)
E-CaSiO3
S-CaSiO3
C-CaSiO3
Standard value (card no:#00–066-0271)
23.123
23.144
23.218
23.13
4 0 0
25.292
25.334
25.388
25.30
0 0 2
26.880
26.880
26.961
26.86
−2 0 2
28.836
28.896
29.026
28.85
2 0 2
29.953
29.997
30.052
29.95
3 2 0
39.047
39.102
39.153
39.08
−2 0 3
41.231
41.260
41.309
41.27
−4 2 2
49.697
49.813
49.858
49.71
0 4 0
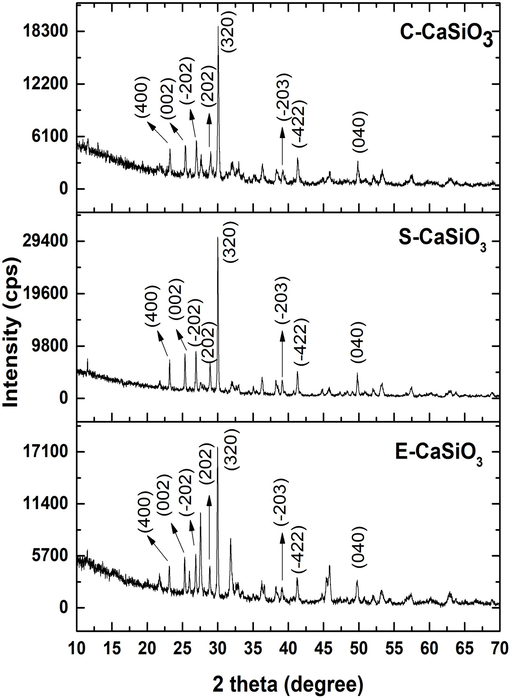
X-ray diffractogram of synthesized samples.
To analyze the crystallographic parameters, equations (3) to (6) were applied (data are shown in Table 2) to calculate the crystallite size, dislocation density, lattice parameter, microstrain, crystallinity index, and volume of the unit cell respectively (Sahadat Hossain and Ahmed, 2023; Sahadat Hossain et al., 2023).
Crystallographic parameters
E-CaSiO3
S-CaSiO3
C-CaSiO3
Crystallite size (nm)
65.24
84.44
49.50
Dislocation density (1015 lines per m2)
0.234
0.14
0.40
Microstrain
0.12
0.0938
0.159
Lattice parameters (Å)
a = 15.43, b = 7.33, c = 7.06
a = 15.40, b = 7.31, c = 7.05
a = 15.29, b = 7.30, c = 7.04
Where, DC = size of crystallite, λ = wavelength (1.4506 Å), K = shape factor (0.90), FWHM = full width at half maxima (in radian), and θ = angle of diffraction (in degree).
Where DC indicates crystallite size.
Where FWHM and θ reveal full width at half maxima (in radian) and angle of diffraction (in degree) respectively.
Lattice parameter equation for monoclinic,
Where, h, k, l = plane of crystals, d = interplanar distance and a, b, c = parameter of lattice
4.2 Calculation of crystallite size
4.2.1 Liner straight-line method of Scherrer’s equation
To compute the size of crystallite, the most common and well-known equation is the Liner straight-line equation of Scherrer. The Scherrer equation was reorganized to calculate the crystallite size of the peaks accurately propagated through the XRD analyzer. To determine the crystallite size, the following equation (7) was applied (Henry M. Otte, n.d.; Monshi et al., 2012);
From equation (7), θ = diffraction angle in degree, K = shape factor, λ = wave-length of X-ray, DC = crystallite size, and β = full width at half maxima in radian. The above equation was correlated with a linear straight line (y = mx + c) equation for computing the size of crystallite. To present the above equation in the graph, the value of cosθ (in degree) and 1/β (in radian) was plotted on the y-axis and the x-axis respectively. The size of crystallites was calculated from the slope that was formed due to the above equation and is represented in Fig. 3 (A) for E-CaSiO3. In the supporting information file, Fig. S_1 (A), and Fig. S_3 (B) are for S-CaSiO3 and C-CaSiO3, respectively. The estimated crystallite size was 1388 nm, 3466 nm, and 69327 nm for three different samples that are included in Table 3. This model was not considered applicable due to its larger crystallite size.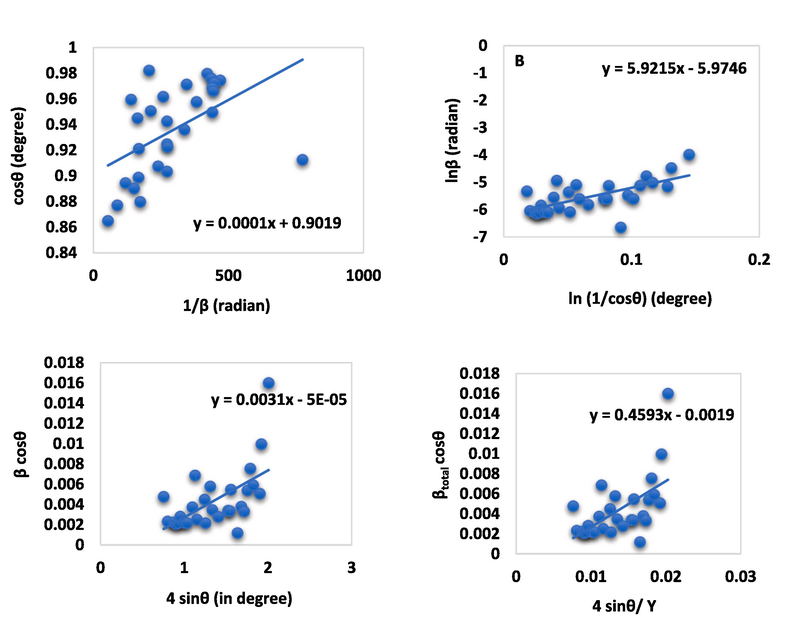
Ascertainment of the size of crystallite through the linear straight-line model of Scherrer equation (A), Monshi-Scherrer equation (B), Uniform deformation model equation (C), and, Uniform stress deformation model equation (D) for E-CaSiO3.
Sample name
Crystal size (nm), Strain (ε), (N/m2), Stress (σ) (N/m2), Energy density (Kj/m3)
LSLM
MSM
WHM
SSM
SSP
HWM
UDM
USDM
UDEDM
E-CaSiO3
D = 1386
D = 54
D = 2773
ε = 0.0031D = 73
ε =
D = 73
μ = 1067
ε =
D = 53
D = 21.66,
ε = 0.0126D = 15.62
S-CaSiO3
D = 69327
D = 47
D = 37
ε = 0.0002D = 37
ε =
D = 37
μ = 2.42
ε =
D = 77
D = 11.09
ε = 0.02D = 8
C-CaSiO3
D = 3466
D = 37
D = 33
ε = 0.0002D = 33
ε =
D = 33
μ = 2
ε =
D = 49
D = 16.50
ε = 0.0189D = 11.9
4.2.2 Monshi-Scherrer method
The modified version of the Scherrer model known as the Monshi-Scherrer method was constructed by reordering and taking the logarithm on both sides of the Scherrer equation to compute the crystallite size precisely. Mathematically generated Monshi-Scherrer equation can be expressed by equation (8) which was the modification form of the Scherrer equation (7) (Monshi et al., 2012; Nasiri et al., 2023).
To ascertain the slope by correlating the above equation with the equation of the straight line (y = mx + c), , and were plotted on the x-axis as well as on the y-axis respectively. As a result, graphs were generated in Fig. 3 (B), Fig. S_1 (B), and Fig. S_3 (B) for E-CaSiO3, S-CaSiO3, and C-CaSiO3, respectively in which the intercept was . Through measuring the intercept of equation (8), the size of crystallites was computed for the corresponding three samples that are enlisted in Table 3.
4.2.3 Williamson-Hall method
Scherrer’s equation examines the impact of the size of crystallite on XRD peak widening without considering the structural strain of nanocrystals. According to the Williamson-Hall method, the reflection broadening in the XRD pattern is influenced by both crystal size and microstrain (Khorsand Zak et al., 2011). So, depending on the Williamson-Hall method, peak broadening is the sum of strain broadening and size broadening that can be represented by the equation (9),
For computing the crystallite size and strain, there are three distinct sub-models depending on the Williamson-Hall method such as the Uniform deformation model (UDM), the Uniform stress deformation model (USDM), and the Uniform deformation energy density model (UDEDM).
4.2.3.1 Uniform deformation model (UDM)
To estimate the crystallite size and strain, the Williamson-Hall model was utilized in that case intrinsic strain was considered (Sahadat Hossain and Ahmed, 2023; Himabindu et al., 2021). The mathematical formula of the Williamson-Hall model has been exposed in equation (10).
In the plot of βtotal cosθ against 4sinθ, a linear straight line was generated that was compared with the equation of y = mx + c for calculating the size of crystallites and intrinsic strain. From the calculation, the strain may be a positive or negative value. In that case, when the value of strain is positive, the crystals are in the state of tensile mode (Sahadat Hossain and Ahmed, 2023). On the other hand, compressive strain is the reason for the negative value of the slope that represents the diffraction line moving on the right of the planes (Nasiri-Tabrizi, 2014). The computed crystallite sizes and obtained graphs of several samples are given in Table 3 and Fig. 3 (C), Fig. S_1 (C), and Fig. S_3 (C) for E-CaSiO3, S-CaSiO3, and C-CaSiO3, respectively.
4.2.3.2 Uniform stress deformation model (USDM)
Stress because of lattice deformation is assumed to be identical in all directions across the entire crystallite (Mohamed Racik and Hamza Irfan, n.d.). But, according to Hook’s law, stress is correlated with strain, and because of the correlation, the obtained mathematical relationship can be represented as, (Khorsand Zak et al., 2011)
After reorganizing the equation (11)
Here, ε = strain, σ = stress, and
= Young’s modulus or modulus of elasticity with the value of 99 GPa for wollastonite (Anon, n.d.; Karamanov and Pelino, 2008). Now by putting the strain term in equation (10), the obtained Uniform stress deformation model equation can be expressed the equation (12),
Fig. 3 (D), Fig. S_1 (D), and Fig. S_3 (D) for E-CaSiO3, S-CaSiO3, and C-CaSiO3, respectively, exhibits the plot of equation (13) , and which was plotted on the Y-axis and X-axis respectively. The crystallite size and stress value were computed from the intercept and slope of the straight line respectively and the calculated values are included in Table 3.
4.2.3.3 Uniform deformation energy density model (UDEDM)
For real crystals, the two modes of crystal such as anisotropic and isotropic may not be found because of the presence of numerous defects as well as dislocations (Sahadat Hossain and Ahmed, 2023). Consequently, to determine the microstrain and energy density of a crystal, the Uniform deformation energy density model is applied. The energy density can be revealed by equation (14) depending on the Hook’s law (Bindu and Thomas, 2014).
By rearranging the equation (14), the microstrain can be expressed as,
Here, μ = energy density, ε = strain, and
= Young’s modulus or modulus of elasticity with the value of 99 GPa for wollastonite (Anon, n.d.; Karamanov and Pelino, 2008). Now by putting the strain term in equation (10), the obtained Uniform deformation energy density model equation can be expressed in equation (16),
To compute the crystallite size and the energy density,
and
were plotted on the X-axis and Y-axis respectively. The crystallite size and strain value were calculated from the intercept and slope of the straight line respectively, and the calculated values are included in Table 3. In addition, the generated graphs after plotting all values are displayed in Fig. 4 (A), Fig. S_2 (A), and Fig. S_4 (A) for E-CaSiO3, S-CaSiO3, and C-CaSiO3, respectively.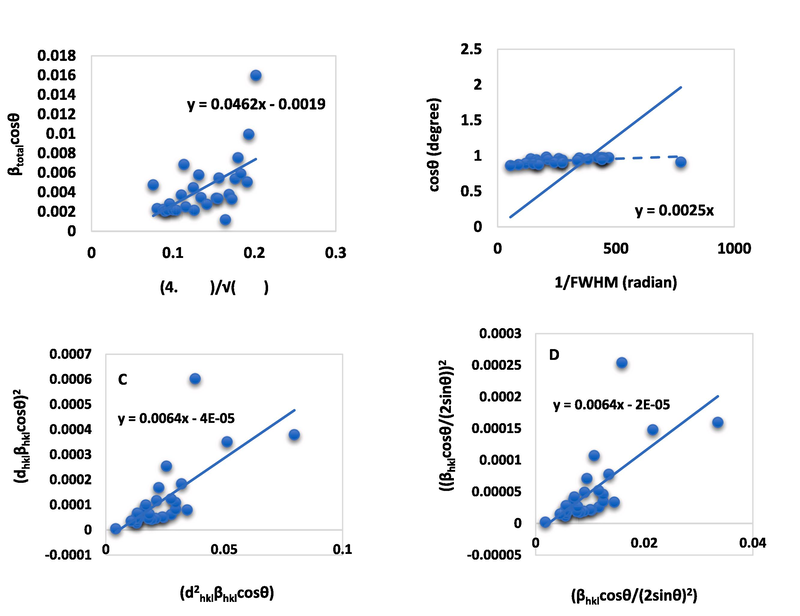
Ascertainment of the size of crystallite through the Uniform deformation energy density model equation (A), Sahadat-Scherrer equation (B), size-strain plot equation (C), Halder-Wagner equation (D) for E-CaSiO3.
4.2.4 Sahadat-Scherrer method
A new model known as the Sahadat-Scherrer model was applied to compute the size of crystallites precisely and the model is based on the Scherrer equation (Sahadat Hossain and Ahmed, 2023). The mathematical expression of the Sahadat-Scherrer model is presented in equation (17). From the Scherrer Equation, a straight line was generated but due to the Sahadat-Scherrer model, a new straight line was formed that passed the origin (Sahadat Hossain and Ahmed, 2023). The Scherrer’s equation was improved because of crossing a straight line through the origin that was generated due to the Sahadat-Scherrer model.
To build a graph from this model, 1/FWHM and cosθ were plotted on the x-axis and y-axis respectively producing a straight line at the same time an intercept was generated that crossed the origin. To calculate the crystallite size, the generated intercept was correlated with the equation of y = mx + c. The estimated crystallite size from this model is included in Table 3 and the consisted graphs are exhibited in Fig. 4 (B), Fig. S_2 (B), and Fig. S_4 (B) for E-CaSiO3, S-CaSiO3, and C-CaSiO3, respectively.
4.2.5 Size-strain plot method
To evaluate peak broadening in XRD analysis, the crucial aspect is the size of the crystallite and the strain of the lattice. The crystallite size and lattice strain are revealed by the Lorentzian function and Gaussian function respectively (Thool et al., 2014). To estimate the size and strain in anisotropic crystal, the size strain plot method was established based on a hypothesis in which a lower angle is more fruitful than a greater angle (Prabhu et al., 2014). So, the crystallite size and strain may be computed precisely by applying a lower angle range of the peaks. The correlation between the size of crystallite and strain based on the Lorentzian function and Gaussian function respectively can be expressed by equations (18), and (19) (Nath et al., 2020; Vinod Kumar, n.d.).
Where, = interplanar distance, = peak broadening, θ = diffraction angle, K = constant, λ = wavelength on X-ray, D = size of crystallite, and ε = strain. was plotted on the X-axis and on the Y-axis. After plotting, the obtained graph is given in Fig. 4 (C), Fig. S_2 (C), and Fig. S_4 (C) for E-CaSiO3, S-CaSiO3, and C-CaSiO3, respectively, and the computed crystallite size and strain are included in Table 3.
4.2.6 Halder-Wagner method
In the size-strain plot method, peak profile strain widening was expressed as a Gaussian function, and size broadening as a Lorentz function. Depending on the reciprocal lattice point and cell, Halder-Wagner concocted a new concept to overcome the limitations of the SSP model. According to the Halder-Wagner method, the peak profile was neither a Gaussian function nor a Lorentz function because the XRD peak region matches the Gaussian function while the tail resembles the Lorentz function perfectly (Mohamed Racik and Hamza Irfan, n.d.; Karamanov and Pelino, 2008). Following the assumption of the Halder-Wagner method, Voigt function characterizes peak broadening that can be represented as (Rabiei et al., 2020);
Where βL and βG are full widths at half maxima of Lorentz and Gaussian functions respectively. To estimate the crystallite size and intrinsic strain, the Halder-Wagner equation can be expressed as,
By plotting and on the X-axis and Y-axis respectively (shown in Fig. 4 (D), Fig. S_2 (D), and Fig. S_4 (D) for E-CaSiO3, S-CaSiO3, and C-CaSiO3, respectively), the computed crystallite size and strain from the graph are enlisted in Table 3.
4.3 Exploration of functional group
Fig. 5 represents the characteristics functional group of the synthesized E-CaSiO3, S-CaSiO3, and C-CaSiO3 in their FTIR spectra. At 1000 0C calcination temperature, the FTIR spectrum of calcium silicate revealed the absorption band at several wavenumbers. For the corresponding three samples, wavenumber ranges 992–1067 cm−1 and 643–685 cm−1 were due to the asymmetric stretching mode and symmetric stretching vibration of Si-O-Si respectively. Such asymmetric stretching mode and symmetric stretching vibration have been documented in prior investigations (Palakurthy et al., 2019; Li et al., 2016). Absorption bands 898–951 cm−1 represented Si-O-Ca bonds with non-bridging oxygen and wavenumber 718 cm−1 indicated the stretching mode of O-Si-O bonds. The absorption band at 559 cm−1 exhibited Si-O-Si bending vibration whereas 474 cm−1 ascribed to the bending mode of O-Si-O and Si-O-Si bonds. The previous literature also revealed similar peaks (Palakurthy et al., 2019; Anjaneyulu et al., 2013). In addition, Ca-O stretching vibration occurred at the wavenumber of 495 cm−1 which was closely related to the previous study (Ernawati et al., 2021).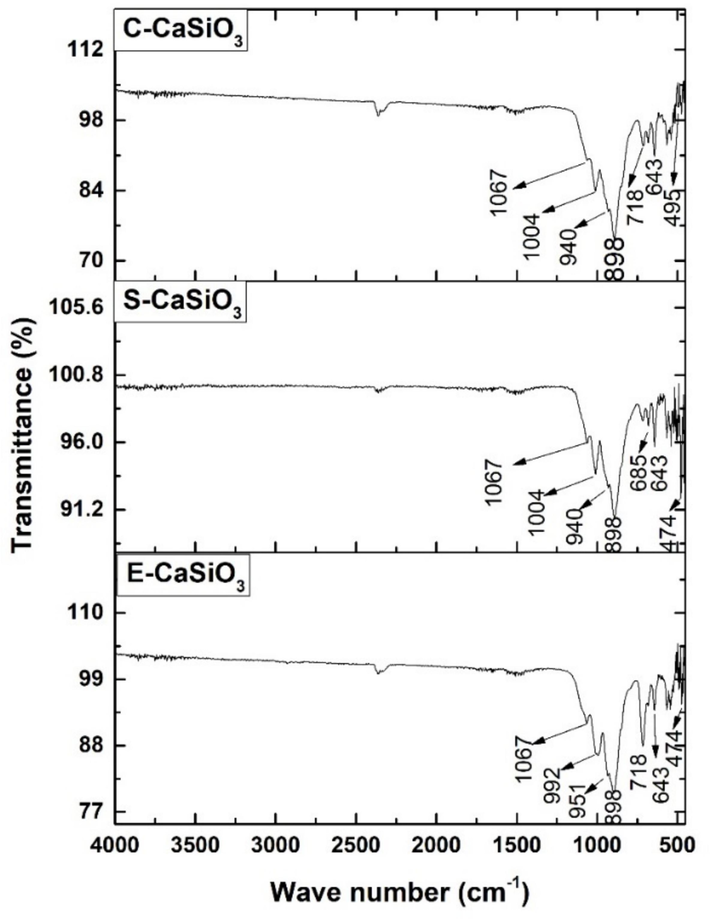
FTIR spectra of the synthesized E-CaSiO3, S-CaSiO3, and C-CaSiO3.
4.4 Inspection of optical band gap
The absorption wavelength of the UV–visible spectrophotometer explored the optical band gap of the synthesized E-CaSiO3, S-CaSiO3, and C-CaSiO3. To figure out the optical band gap, a mathematical expression was familiar as the Tauc method which is given in the equation (23) (Mir, 2014; Kaviti and Akkala, 2023);
From equation (23), α = absorption co-efficient, ϑ = frequency of the photon, h = Plank’s constant, A = constant, Eg = band gap energy, and n = 2 or 1/2 in that case 2 for direct band gap and 1/2 for indirect band gap. Through origin software, hϑ and (αhϑ)2 were plotted on the x-axis and y-axis respectively to estimate the band gap. The computed band gap energy of generated samples is included in Table 4, and the graphical representation is enlisted in the supporting information file (Fig. S_5). There were no significant changes in the band gap of the synthesized three samples.
Name of the sample
Band gap energy (eV)
E-CaSiO3
6.18
S-CaSiO3
6.20
C-CaSiO3
6.14
4.5 Point of zero charge
The point of zero charge (pHpzc) is the pH at which the adsorbent’s surface charge is zero. The charge of the adsorbent may be positive or negative because it depends on the value of pH and pHpzc. When the value of pH becomes less than the value of pHpzc, the adsorbent’s surface charge will be positive (Ahmad et al., 2012). On the contrary, the adsorbent’s surface charge becomes negative when the PH value becomes more than the value of pHpzc. As a result, a positive charge-carrying adsorbent will interact with anionic dye effectively (Aldahash et al., 2022). To carry out this experiment 0.1 M NaCl (30 mL) was taken with 0.02 g adsorbent in a conical flask. The initial pHi (5, 7, 9, and 11) of this mixture was maintained by adding 1 M HNO3 and 0.25 M NaOH. Then the conical flask was placed for shaking for 30 min in the orbital shaker. After 30 min, again the pHf of the sample was checked to evaluate the ΔpH (ΔpH = pHf − pHi). By plotting pHi, and ΔpH on the X-axis, and Y-axis, respectively; a line with a point of intersection (Fig. 6) was found from which the value of pHpzc was explored. The pHpzc values of the synthesized E-CaSiO3, S-CaSiO3, and C-CaSiO3 are 8.4, 7.9, and, 8.1, respectively. The maximum removal percentage was found at pH 7 in the batch experiment for the three categories of adsorbent. The pH was lower than the values of pHpzc, so the positively charged adsorbent surface interacted with anionic congo red dye more effectively.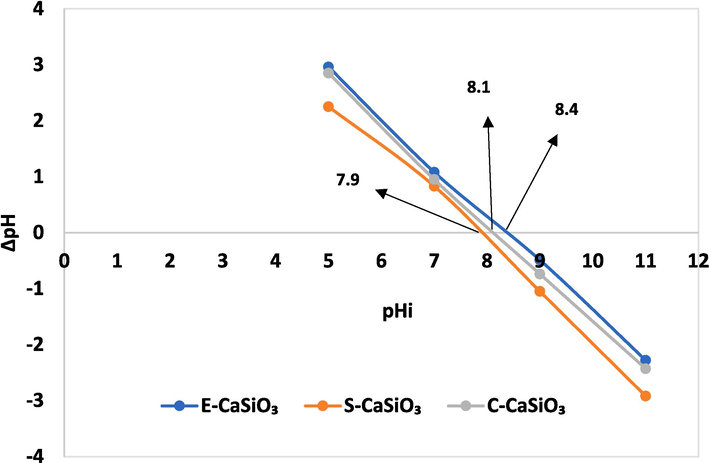
Point of zero charges of the synthesized E-CaSiO3, S-CaSiO3, and C-CaSiO3.
4.6 Studies of adsorption
4.6.1 Effect of time interval on adsorption
Time has an impact on adsorption efficacy so the removal percentage and adsorption capacity will change due to the variation of time. The removal percentage and adsorption capacity for E-CaSiO3, S-CaSiO3, and C-CaSiO3 escalated dramatically with increasing time. The maximum removal percentage was 97 % for 0.1 g C-CaSiO3 at a time of 180 min whereas the minimum one was 79 % for 0.1 g C-CaSiO3 at a time of 60 min. Fig. 7 illustrates that at 120 and 180 min, the removal percentages were almost identical. This happens as a result of dye molecules inhibiting the adsorbent's active sites over time (Adeogun et al., 2018). Consequently, a balance was revealed.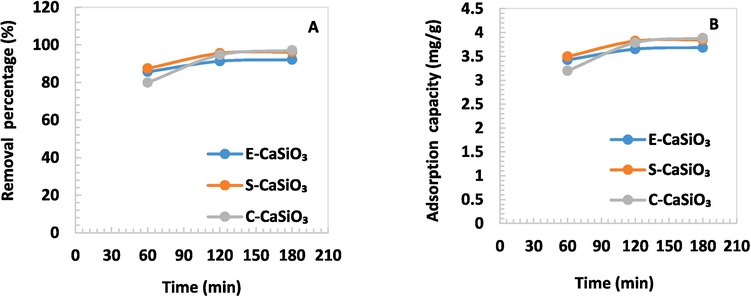
(A) Removal percentage and (B) Adsorption capacity of 0.1 g adsorbent in terms of time variation.
4.6.2 Impact of shaking speed
Due to the variation of the speed of the orbital shaker (rpm), the adsorbent interacted with the adsorbate properly. Consequently, with increasing speed, the percentage of removal and adsorption capacity was changed moderately. For E-CaSiO3 and S-CaSiO3, the removal percentage and adsorption capacity climbed significantly due to the elevation of speed but at the speed of 250 rpm, the value fell modestly. This phenomenon happens because the kinetic energy between the dye molecules and the adsorbent particles is enhanced when increasing the shaking speed. Consequently, the contact also intensifies, thereby enhancing the adsorption capacity. Following optimal circumstances, both the adsorbent and the adsorbate have higher kinetic energies, but the adsorbent molecules become apart from the least constrained dye molecules (Jamil et al., 2014). 98 % and 61 % were the maximum and minimum removal percentages respectively for 0.1 g S- CaSiO3 adsorbent at the speed of 200 rpm and 50 rpm respectively. Fig. 8 represents the removal percentage and adsorption capacity for different speeds (rpm).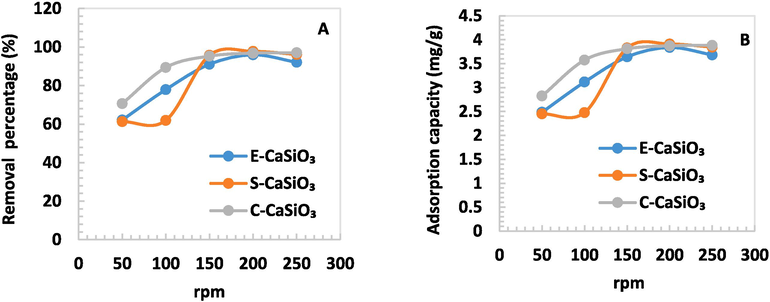
(A) Removal percentage and (B) Adsorption capacity of 0.1 g adsorbent in terms of several speeds (rpm).
4.6.3 Effects of different doses of adsorbent
The effect of adsorbent doses on the removal percentage and adsorption capacity was observed by taking various doses of adsorbent that limit was 0.025 to 0.3 g. With raising adsorbent doses, the percentage of removal went up substantially for the three different adsorbents but it dropped a bit due to the 0.3 g adsorbent. The highest removal percentage was fairly 99 % for 0.1 g of C-CaSiO3 adsorbent as well and the lowest one was 73 % for 0.05 g of E-CaSiO3 adsorbent. For 0.2 g of adsorbent, the removal percentage was more than 0.3 g of adsorbent. In that case, the adsorbents are agglomerated in the case of 0.3 g of adsorbent. As a result, the adsorbent's active sites are mitigated, and the dye removal percentage likewise drops (You et al., 2019). In addition, adsorption capacity dropped gradually with increasing the amount of catalyst and the maximum was 14.920 mg/g for 0.025 g C-CaSiO3. For additional inspection, 0.2 g adsorbent, 180 min, and 200 rpm were taken as fixed depending on the percentage of removal and adsorption capacity. Fig. 9 represents the removal percentage and adsorption capacity for diverse adsorbent doses.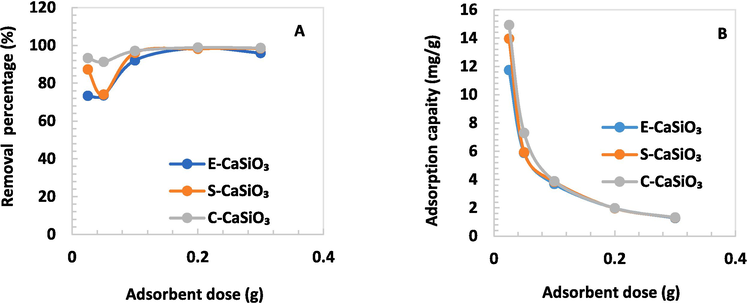
(A) Removal percentage and (B) Adsorption capacity of several adsorbent doses at a fixed speed of 200 rpm and time of 180 min.
4.6.4 Impact of different dye concentrations
To observe the effect of dye concentration on the removal percentage and adsorption capacity, several dye concentrations were chosen for experiments. For this purpose, some parameters were static as previously mentioned. With rising dye concentrations, the removal percentage fluctuated, and the maximum was approximately 100 % for E-CaSiO3 adsorbent. For the S-CaSiO3 adsorbent, the removal percentage and adsorption capacity climbed modestly but the percentage declined dramatically because of the increasing concentration of dye. The removal percentage for C-CaSiO3 rose and fell due to the variation of concentration of dye and the maximum removal percentage was 99 % at 30 ppm. The dye removal percentage falls gradually with rising dye concentration. This happens because the molecules of dye block the active site of the adsorbents (Bin Mobarak et al., 2023). As a result, the interaction between dye molecules and adsorbent declines with increasing the concentration of dye. The impact of several dye concentrations on removal percentage and adsorption capacity is represented in Fig. 10.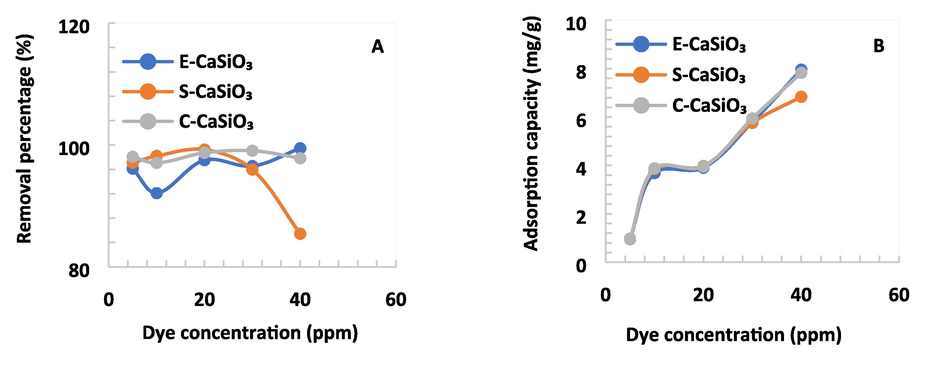
(A) Removal percentage and (B) Adsorption capacity of several dye concentrations at a fixed speed of 200 rpm, time of 180 min, and amount of adsorbent 0.2 g.
4.6.5 Effect of several pH limits
The removal percentage and adsorption capacity are significantly influenced by the solution's different pH limits. Fig. 11 displays that for E-CaSiO3, the removal percentage and adsorption capacity rose minimally but it came down at pH 9. This phenomenon occurs as a result of the adsorbent surface becoming positively charged when the pH level is low. At lower pH, H+ ions induce surface active sites to become protonated (Nath et al., 2021). Inevitably, the surface of the adsorbent becomes positively charged. Conversely, the surface of the adsorbent turns into a negative charge at high pH due to the presence of OH– ions (Jamil et al., 2014). Congo red is an anionic dye, so the conjunction between the molecules of dye (negatively charged) and adsorbent (positively charged) becomes strong (Al-Degs et al., 2008). Consequently, the removal percentage of dye becomes higher when the pH level is low. At pH 7, the maximum removal percentage was 97 % to nearly 99 % for the E-CaSiO3, S-CaSiO3, and C-CaSiO3. Moreover, to prepare a pH 7 solution, there was no need to add extra acid or base for this reason pH 7 was kept fixed.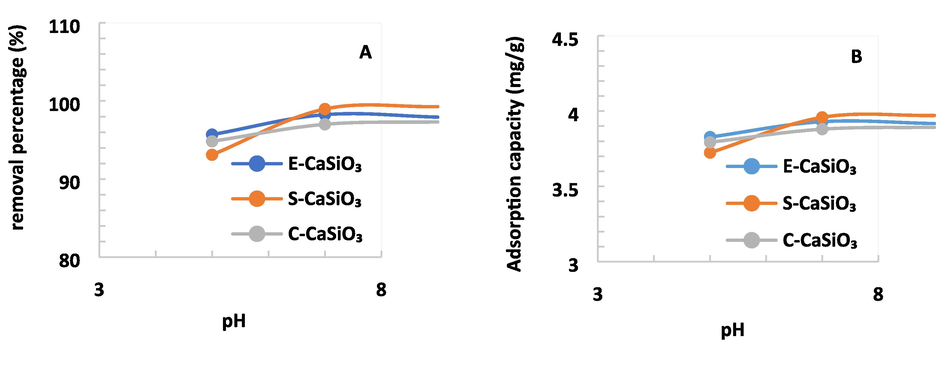
(A) Removal percentage and (B) Adsorption capacity of 0.2 g adsorbent at a fixed speed of 200 rpm, time of 180 min under various pH limits.
4.7 Adsorption isotherm
Through isotherm models, it is possible to assess the equilibrium adsorption data. Moreover, adsorption isotherm models can convey qualitative information about the adsorption capacity of adsorbents. To evaluate the adsorption equilibrium data in the case of adsorption of Congo red dye onto the surface of the desired product, Langmuir adsorption isotherm (including linear and non-linear), Freundlich isotherm (involving linear and non-linear), and Temkin isotherm were frequently employed.
4.7.1 Langmuir adsorption isotherm
4.7.1.1 Linear form of Langmuir adsorption isotherm
The linear form of Langmuir adsorption isotherm is presented in the equation (24), (Hu et al., 2017)
Where,
= equilibrium concentration of Congo red adsorbed (mg/g),
= equilibrium concentration of Congo red in the solution (mg/L),
= maximum adsorption capacity of the synthesized product (mg/g), and
= constant of the Langmuir isotherm model (mg/L). After plotting 1/Ce and 1/qe on the X-axis and Y-axis respectively, a straight line was generated (displayed in Fig. 12). By comparing the generated straight line with the straight equation (y = mx + c), the value of slope and intercept were estimated by Origin Pro 9 software which is enlisted in Table 5. Depending on the Langmuir adsorption constant (KL), the dimensionless equilibrium parameter (RL) was calculated by applying equation (25) (Hossain et al., 2022).
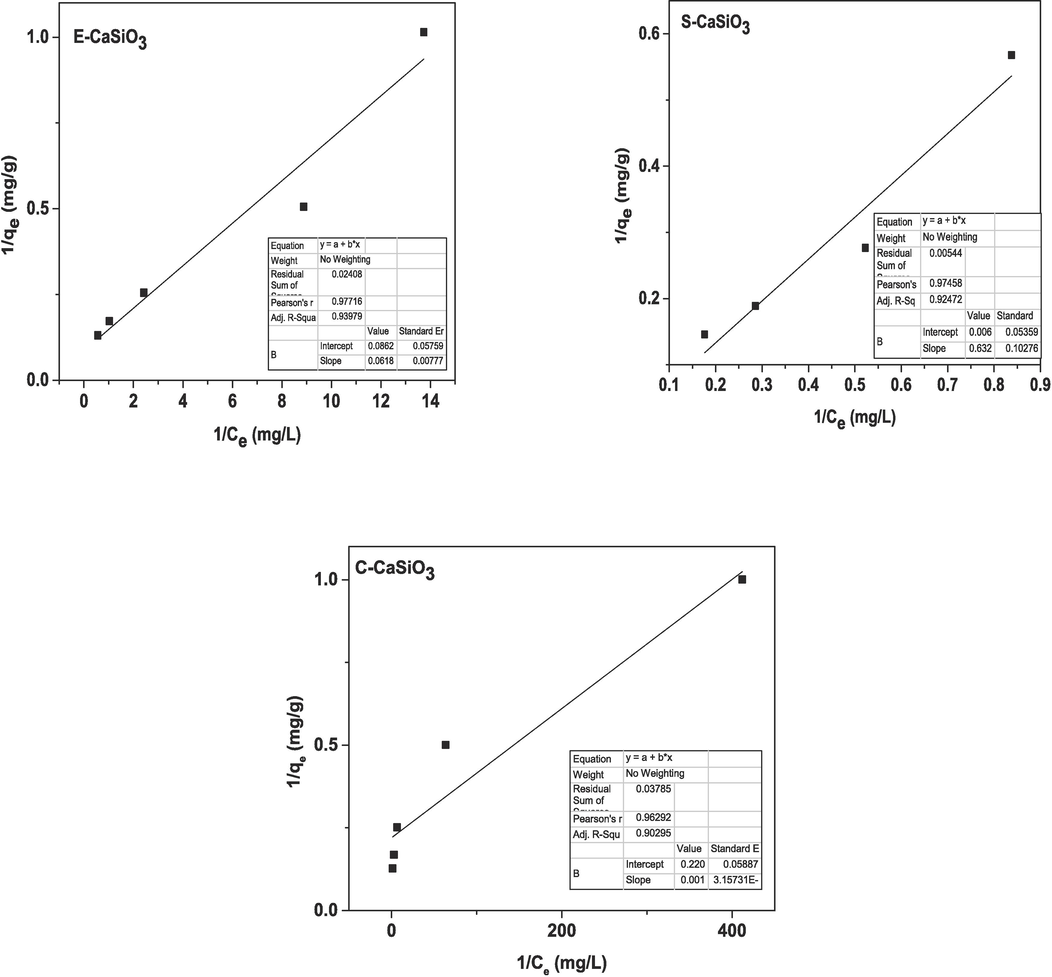
Graphical representation of the linear form of Langmuir adsorption isotherm.
Isotherm model
Fitting of curve
Sample name
Intercept value
Slope value
Adj. R-Square
Langmuir
Linear
E-CaSiO3
0.08625
0.06188
0.93979
S-CaSiO3
0.00661
0.63223
0.92472
C-CaSiO3
0.22011
0.00195
0.90295
Non-linear
E-CaSiO3
10.02532
1.60597
0.98448
S-CaSiO3
15.90793
0.13716
0.96343
C-CaSiO3
9.33832
5.58132
0.88791
Freundlich
Linear
E-CaSiO3
0.77206
0.59628
0.94392
S-CaSiO3
0.24324
0.84031
0.90799
C-CaSiO3
0.92303
0.35313
0.99547
Non-linear
E-CaSiO3
5.77164
1.93296
0.98345
S-CaSiO3
2.04386
1.40002
0.9404
C-CaSiO3
8.68647
2.63548
0.9939
Temkin
Linear
E-CaSiO3
6.09899
1.97872
0.97985
S-CaSiO3
1.3251
3.20938
0.99327
C-CaSiO3
7.16597
1.12937
0.87933
Here, reveals the maximum initial concentration of dye. Depending on the dimensionless equilibrium parameter (RL), the situation of adsorption can be expressed such as RL = 1 reveals the linear isotherm and 0 < RL < 1 indicates appropriate adsorption. Moreover, RL > 1 and RL = 0 explain disagreeable and irreversible adsorption respectively (Bin Mobarak et al., 2023).
4.7.1.2 Non-linear form of Langmuir adsorption isotherm
The non-linear form of Langmuir adsorption isotherm equation is revealed in the equation (26), (Pinky et al., 2023; Salihi, n.d.)
Here, Qm is the maximum adsorption capacity of the synthesized product. Through plotting Ce and qe on the X-axis and Y-axis respectively, a straight line was generated (exhibited in Fig. 13) that was compared with the straight-line equation (y = mx + c) for estimating the value of slope and intercept. The obtained values through Origin Pro 9 software are given in Table 5 and after fitting (linear and non-linear) all calculated values are included in Table 6.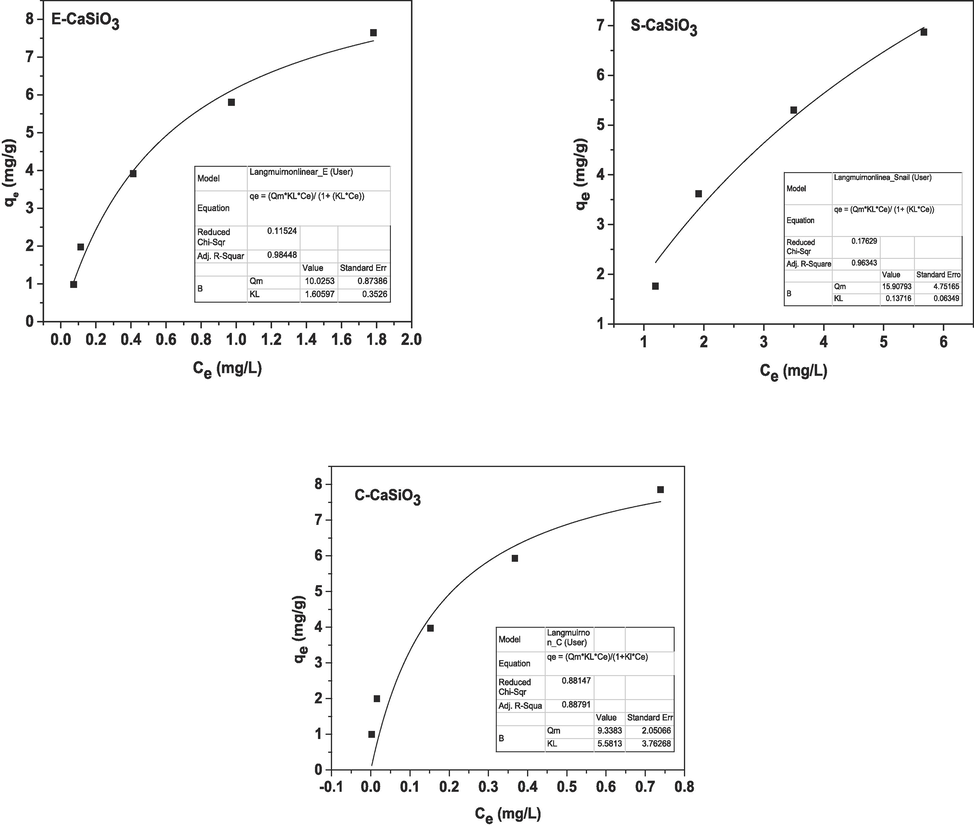
Graphical representation of the non-linear form of Langmuir adsorption isotherm.
Isotherm model
Fitting of curve
Sample name
Parameters value
qm (mg/g)
KL (mg/L)
RL
Langmuir
Linear
E-CaSiO3
11.59420
1.39382
0.07048
S-CaSiO3
151.28593
0.01045
0.70511
C-CaSiO3
4.54318
113.16044
0.00022
Non-linear
E-CaSiO3
10.02532
1.60597
−
S-CaSiO3
15.90793
0.13716
−
C-CaSiO3
9.33832
5.58132
−
Sample name
Parameters value
Kf (mg/L)
n
Freundlich
Linear
E-CaSiO3
5.91643
1.67706
S-CaSiO3
1.75081
1.19003
C-CaSiO3
8.37587
2.83181
Non-linear
E-CaSiO3
5.77164
1.93296
S-CaSiO3
2.04386
1.40002
C-CaSiO3
8.68647
2.63548
Sample name
Parameters value
BT (J/mol)
AT (L/mg)
Temkin
Linear
E-CaSiO3
1.97872
21.8083
S-CaSiO3
3.209
1.511196
C-CaSiO3
1.1293
569.8854
4.7.2 Freundlich isotherm
4.7.2.1 Linear form of Freundlich adsorption isotherm
Through the Freundlich adsorption isotherm equation, it is possible to evaluate the heterogeneous surface with multilayer adsorption. Mathematically the equation can be expressed as,
By taking logarithms on both sides of the equation (27), the newly formed equation can be presented as,
By rearranging equations (28) and (29), the Linear form Freundlich isotherm of the equation will be, (Bagal and Raut-Jadhav, 2021)
Here,
= Freundlich constant (mg/L), n = constant of the intensity of the adsorption,
= adsorption capacity (mg/g), and Ce = adsorbate concentration (mg/L). The value of n explains the adsorption process including an intricate adsorption process (n < 1), relatively complicated adsorption (1 < n < 2), or favorable adsorption (2 < n < 10) (Pinky et al., 2023; Shayesteh et al., 2016). By plotting
on the X-axis and
on the Y-axis, a straight was produced that is represented in Fig. 14. After plotting, the slope and intercept were obtained by applying Origin Pro 9 software, and all the obtained values are enlisted in Table 5.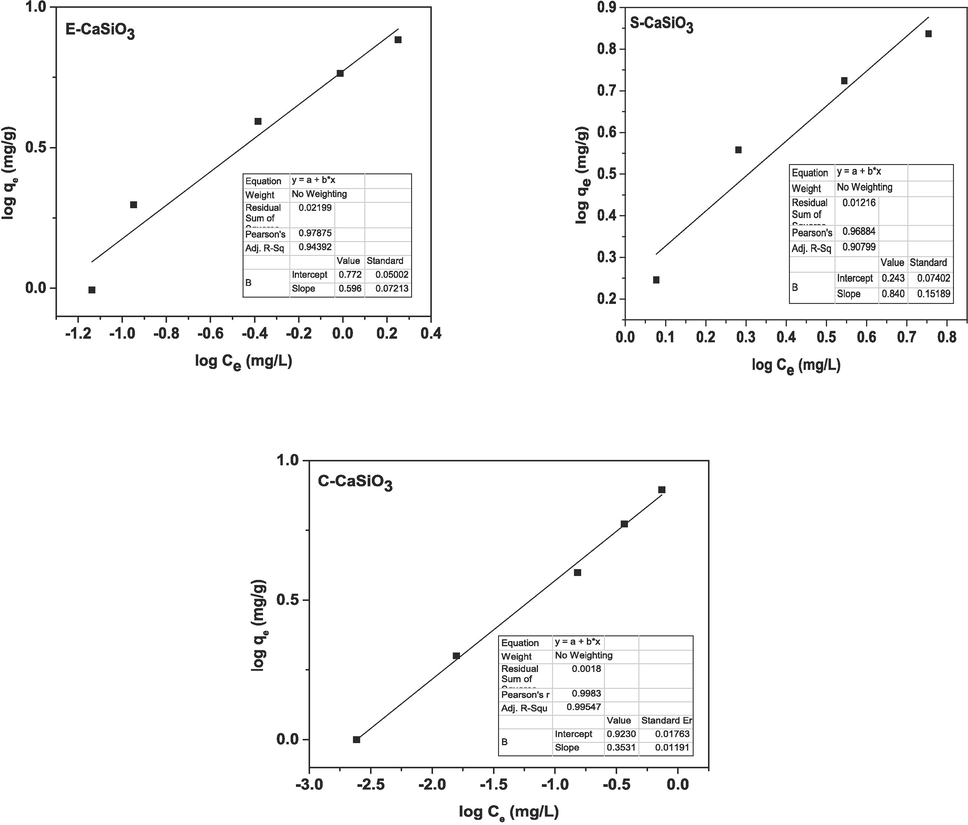
Graphical representation of the linear form of Freundlich adsorption isotherm.
4.7.2.2 Non-linear form of Freundlich adsorption isotherm
The non-linear form of the Freundlich adsorption isotherm equation can represented by the following equation, (Vitek and Masini, 2023)
The value of
and
were plotted on the X-axis and Y-axis respectively. After plotting, the generated graphs are represented in Fig. 15 and yielded all values from Origin Pro 9 software given in Table 5. Moreover, the computed parameters after linear and non-linear fitting are enlisted in Table 6.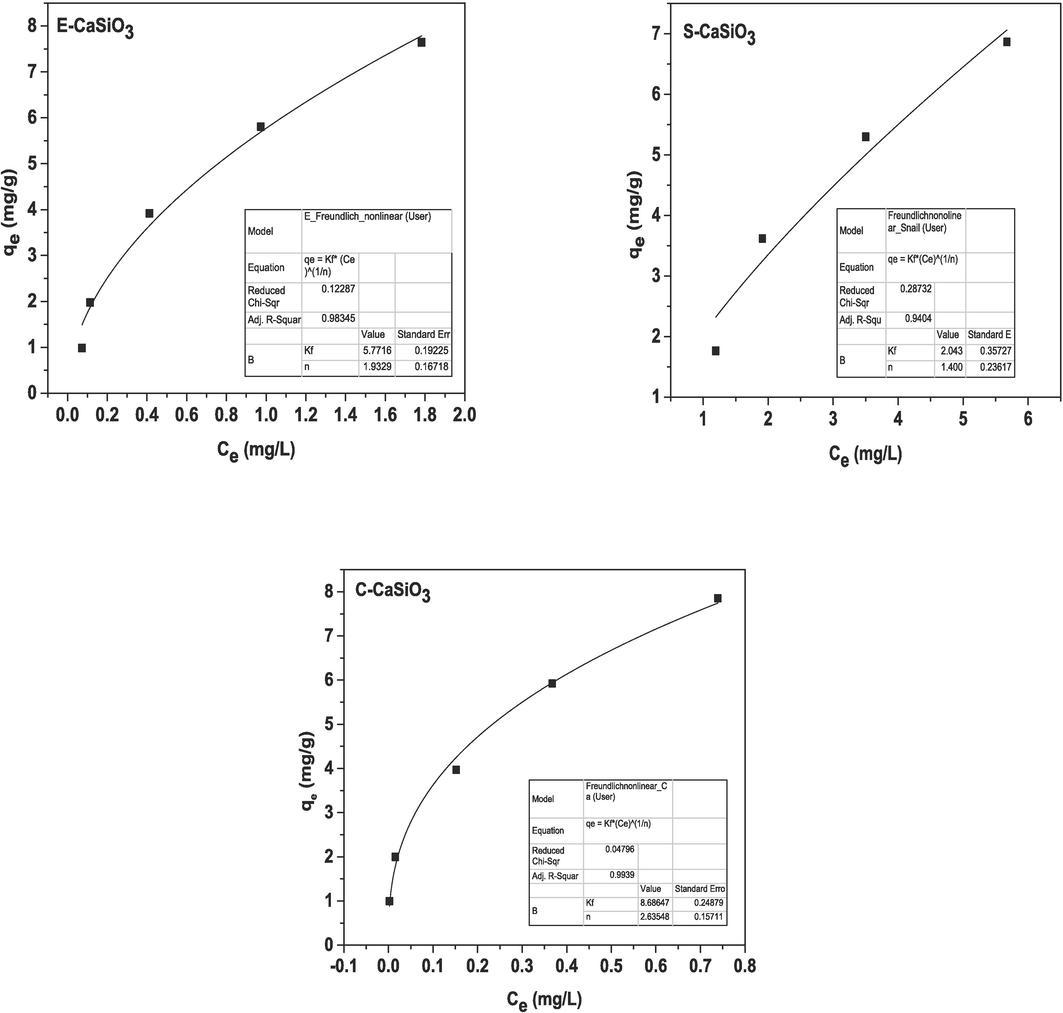
Graphical representation of the non-linear form of Freundlich adsorption isotherm.
4.7.3 Temkin isotherm model
The Temkin isotherm equation is mathematically expressed by the equation (34) (Anon (2), n.d.);
Here, b = Temkin isotherm constant,
=
= constant connected to the heat of adsorption (J/mol),
= Temkin isotherm equilibrium binding constant (L/mg), R = universal gas constant (J/mol K), and T = temperature (K). Now by placing the values of
on the X-axis and
on the Y-axis, a straight line was generated after linear fitting which is presented in Fig. 16. The estimated isotherm parameters after fitting are included in Table 6.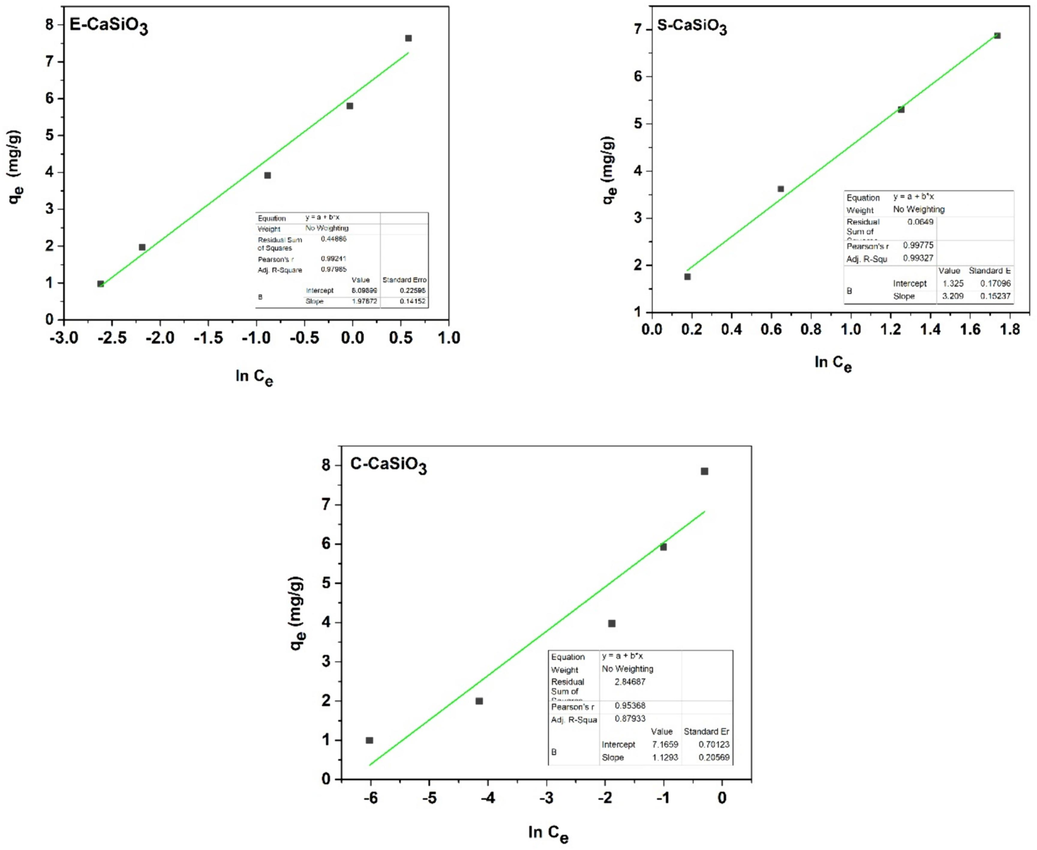
Graphical representation of Temkin isotherm model of E-CaSiO3, S-CaSiO3, and C-CaSiO3 samples.
4.7.4 Thermodynamics studies
The thermodynamic parameter ΔG0 (standard Gibbs free energy) was calculated utilizing equation (35) which comprehends the mode of adsorption on the synthesized adsorbent (Ghasemi et al., 2014).
In equation, = standard Gibbs free energy (KJ/mol), T = absolute temperature (298 K), R = universal gas constant (8.314 Jmol−1 K−1), and K = thermodynamic equilibrium constant derived from several isotherm models (Langmuir, Freundlich, and Temkin isotherm model).
The computed values of
are enlisted in Table 7. The negative
values signified that the adsorption onto the adsorbent was thermodynamically effective. Moreover, it indicated the spontaneous adsorption process (Ebisike et al., 2023). The
values for the adsorbents were negative according to Langmuir, Freundlich, and Temkin isotherm models. But the
values of S-CaSiO3 adsorbent were positive in the case of Langmuir linear and non-linear isotherm model so the adsorption process was not spontaneous. A comparative study between the present work and the previous work is registered in Table 8.
Isotherm model
Fitting of curve
Sample name
Constant
ΔG0 (KJ/mol)
Langmuir
Linear
E-CaSiO3
1.39382
−0.82267
S-CaSiO3
0.01045
+11.30585
C-CaSiO3
113.16044
−11.71604
Non-linear
E-CaSiO3
1.60597
−1.17369
S-CaSiO3
0.13716
+4.92196
C-CaSiO3
5.58132
−4.25999
Freundlich
Linear
E-CaSiO3
5.91643
−4.40446
S-CaSiO3
1.75081
−1.38763
C-CaSiO3
8.37587
−5.26571
Non-linear
E-CaSiO3
5.77164
−4.34307
S-CaSiO3
2.04386
−1.77106
C-CaSiO3
8.68647
−5.35593
Temkin
Linear
E-CaSiO3
21.8083
−7.63659
S-CaSiO3
1.511196
−1.02299
C-CaSiO3
569.8854
−15.72127
Adsorbent
Source
Adsorbate
Removal percentage (%)
Langmuir maximum adsorption capacity, qm (mg/g)
Reference
E-CaSiO3
Eggshells
Congo red
98.65
11.59420
This study
S-CaSiO3
Snail shell
98.21
151.28593
C-CaSiO3
Raw chemical
98.88
4.54318
Modified chicken feathers
Chicken feathers
Cu (Ⅱ)
98.9
200
(Chakraborty et al., 2020)
Urea-calcium alginate beads
Brown algae and bivalve shells
Congo red
90.3
441
(Elgarahy et al., 2020)
Modified eggshells
Eggshells
Reactive Blue 198
96.40
0.80
(Zonato et al., 2022)
Calcined eggshells
Eggshells
Basic yellow 28
> 90
28.87
(Slimani et al., 2014)
Modified snail shell
Snail shell
Congo red
95.02
526.31
(Zwier and AL-Da’amy, 2023)
4.7.5 Regeneration and reusability test
For preserving the environment and considering monetary feasibility, the reusability of adsorbent is a crucial factor. The reusability activity of the synthesized adsorbent (E-CaSiO3, S-CaSiO3, and C-CaSiO3) was observed which is depicted in Fig. 17. This figure represents that the three adsorbents maintained their active behavior following the cycle of regeneration. For this experiment, 0.2 g of adsorbent, and 20 ppm of congo red dye solution (40 mL) were placed in a conical flask. Afterward, the solution was agitated on an orbital shaker at a speed of 200 rpm for 180 min. Three cycles were carried and the adsorbent was washed with deionized water after each cycle. After washing, the adsorbent was dried in an oven at 100 °C for 2 h for the next cycle. The removal percentage was above 97 % for the three adsorbents in the first cycle. But it dropped gradually in the third cycle; the removal percentage became 80 %, 67 %, and 72 % for E-CaSiO3, S-CaSiO3, and C-CaSiO3, respectively. At the same, the adsorption capacity decreased modestly. This happened due to the removal of active SiO2 during washing after each cycle as reported in the previous literature (Zhao et al., 2017).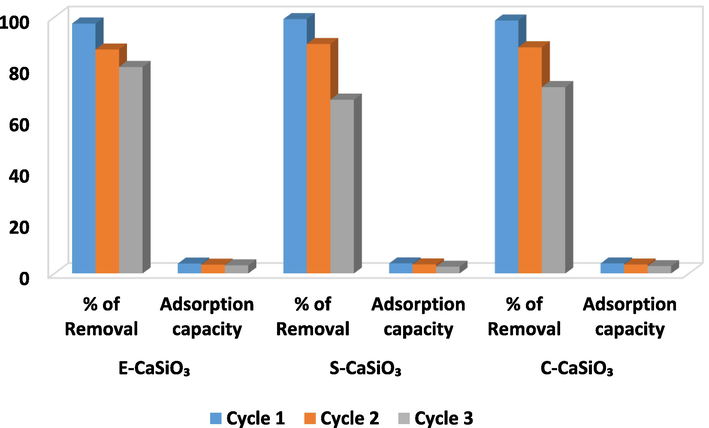
Regeneration and reusability test of the adsorbents.
4.7.6 Adsorption mechanism
The strong electrostatic attraction between the dye's negative charge and the adsorbent's positive charge can interpret the adsorption mechanism of congo red dye and adsorbent. The interaction between adsorbent and adsorbate occurs due to hydrogen bonding and ion exchange (Adebayo et al., 2022). Hydrogen bonding mainly happens between hydrogen atoms of dye and the SiO3 part of CaSiO3, whereas ion exchange occurs between CaSiO3 (adsorbent) and dye solution ions. The Ca part of CaSiO3 can form a chelation bond with the sulfonate, amino, or azo groups on the surface of the adsorbent (Bin Mobarak et al., 2023). The dye can cling to the surface of the adsorbent by an interchanging mechanism. The overall adsorption mechanism is portrayed in Fig. 18.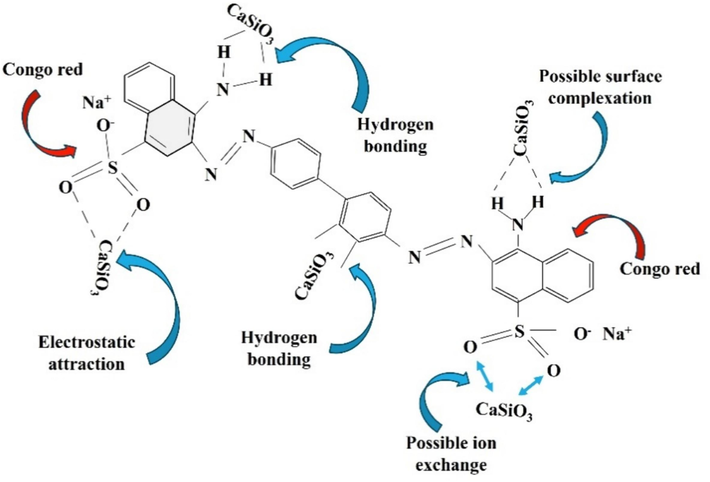
Congo red dye adsorption mechanism by CaSiO3. (For interpretation of the references to colour in this figure legend, the reader is referred to the web version of this article.)
4.7.7 FTIR analysis after the adsorption and recycling process
The functional group of the synthesized E-CaSiO3, S-CaSiO3, and C-CaSiO3 after adsorption of congo red dye (A) and after recycling three cycle steps (B) are portrayed in Fig. 19. The functional groups of the adsorbent after the adsorption process and after the reusability test were mostly similar to the FTIR data of the raw adsorbent except band at 1473 cm−1. The absorption band at 1473 cm−1 revealed the stretching vibration of N = N due to the presence of congo red dye. The reason for this additional peak was also shown in past research (Harja et al., 2022; Moon et al., 2018). Moreover, in the FTIR spectrum, there were very minor peaks due to the presence of a minor amount of dye in the solution.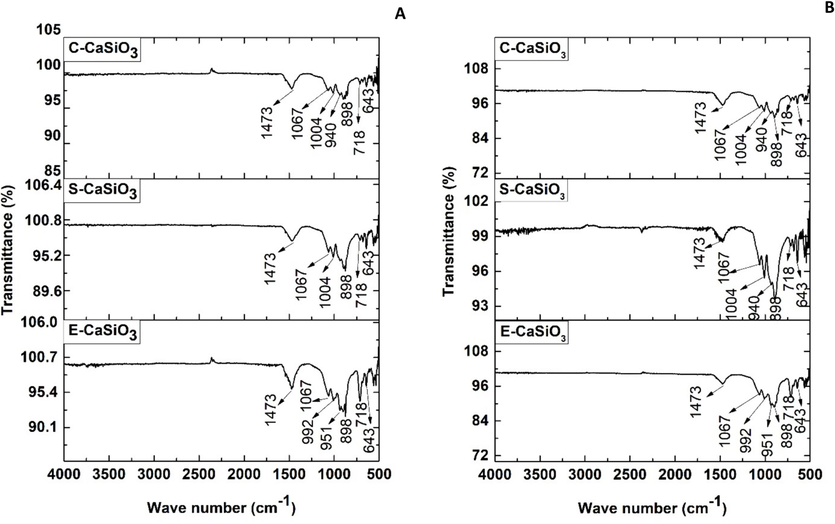
FTIR spectra of the synthesized adsorbent after adsorption of congo red dye (A) and after recycling process (B).
4.7.8 XRD analysis after the adsorption and recycling process
XRD analysis of E-CaSiO3 was executed after the adsorption and recycling process and the obtained X-ray diffractogram is represented in Fig. 20. The X-ray diffractogram of E-CaSiO3 after the adsorption and recycling process did not show any discernible change. Consequently, it confirmed that the crystal structure of the adsorbent was unaffected after completing the recycling and adsorption process.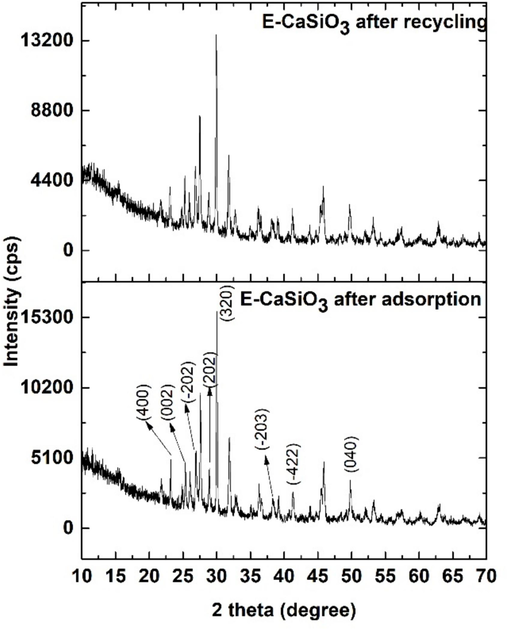
X-ray diffractogram of E-CaSiO3 after the adsorption and recycling process.
4.7.9 Economic analysis
In this research, we have mainly focused on the synthesis of calcium silicate utilizing waste sources such as eggshells and snail shells. Eggshells and snail shells are utilized as a source of calcium carbonate. Eggshells are one of the most available food-processing waste products, whereas snail shells are natural waste products. So, these two waste products are cost-effective and eco-friendly for industrial-scale applications. Moreover, through the adsorption process, the sample can be utilized several times for removing dye from wastewater.
5 Conclusion
Through a solid-state reaction, calcium silicates were synthesized from three identical sources without using any hazardous chemicals which was confirmed by XRD and FTIR. The crystallite sizes of the desired products were less than 80 nm. The adsorption efficacy was impacted by some parameters such as contact time, adsorbent dose, shaking speed, dye concentration, and pH of the solution. The removal percentage for the three types of adsorbents was nearly 100 %. The maximum adsorption capacity (qm) was 151.28593 mg g−1 with Langmuir linear fitting. Moreover, the reusability tests ensured that the adsorbent was cost-effective and eco-friendly. So, this research will attract greater attention because of utilizes food-processing waste (eggshells) and natural waste (snail shells) to synthesize adsorbents that can eradicate anionic congo red dye from wastewater.
CRediT authorship contribution statement
Sumaya Tabassum: Writing – review & editing, Writing – original draft, Validation, Investigation, Formal analysis, Data curation. Md. Sahadat Hossain: Writing – review & editing, Methodology, Conceptualization. Mashrafi Bin Mobarak: Data curation. Farah Nigar: Writing – review & editing. Samina Ahmed: Supervision, Funding acquisition.
Acknowledgments
The authors are grateful to Bangladesh Council of Scientific and Industrial Research (BCSIR) authority for support through the R & D project (ref. no. 39.02.00000.011.14.134.2021/900; Date: 30.12.2021) and (ref. no. 39.02.0000.011.14.157.2022/172; Date: 10.11.2022). Sumaya Tabassum is also grateful to the BCSIR authority for approving Nurul Afsar Khan Post Graduate fellowship.
Declaration of competing interest
The authors declare that they have no known competing financial interests or personal relationships that could have appeared to influence the work reported in this paper.
References
- Low temperature production of wollastonite from limestone and silica sand through solid-state reaction. J. Asian Ceram. Soc.. 2014;2:77-81.
- [Google Scholar]
- Adebayo M, Jabar J, Amoko J, Openiyi E and Shodiya O 2022 Coconut husk-raw clay-Fe composite: preparation, characteristics and mechanisms of Congo red adsorption Scientific Reports 12.
- Biowaste-derived hydroxyapatite for effective removal of Reactive Yellow 4 dye: Equilibrium, kinetic, and thermodynamic studies. ACS Omega. 2018;3:1991-2000.
- [Google Scholar]
- Adsorptive removal of Congo red, a carcinogenic textile dye, from aqueous solutions by maghemite nanoparticles. J. Hazard. Mater.. 2010;174:398-403.
- [Google Scholar]
- Ahmad R, Kumar R and Haseeb S 2012 Adsorption of Cu2+ from aqueous solution onto iron oxide coated eggshell powder: Evaluation of equilibrium, isotherms, kinetics, and regeneration capacity Arabian Journal of Chemistry 5 353–9.
- Fabrication of polyamide-12/cement nanocomposite and its testing for different dyes removal from aqueous solution: Characterization, adsorption, and regeneration studies. Sci. Rep.. 2022;12:13144.
- [Google Scholar]
- Effect of solution pH, ionic strength, and temperature on adsorption behavior of reactive dyes on activated carbon. Dyes Pigm.. 2008;77:16-23.
- [Google Scholar]
- Photocatalytic degradation of Congo Red dye from aqueous environment using cobalt ferrite nanostructures: Development, characterization, and photocatalytic performance. Water Air Soil Pollut.. 2020;231:50.
- [Google Scholar]
- Adsorptive separation of myoglobin from aqueous solutions using iron oxide magnetic nanoparticles modified with functionalized nanocrystalline cellulose. J. Chem. Eng. Data. 2013;58:1329-1339.
- [Google Scholar]
- Sol-gel combustion synthesis of nanocrystalline Wollastonite by using glycine as a fuel and its in vitro bioactivity studies. Trans. Indian Ceram. Soc.. 2013;72:257-260.
- [Google Scholar]
- Anon (2) (PDF) Langmuir, Freundlich, Temkin and Dubinin–Radushkevich Isotherms Studies of Equilibrium Sorption of Zn 2+ Unto Phosphoric Acid Modified Rice Husk.
- Anon Characterizing the Young’s Moduli of Polypropylene–Acicular Wollastonite Crystal Composites: Multiscale Simulation and Experiment | Multiscale Science and Engineering.
- Magnetic biocomposite based on peanut husk for adsorption of hexavalent chromium, Congo red and phosphate from solution: Characterization, kinetics, equilibrium, mechanism and antibacterial studies. Chemosphere. 2022;287:132030
- [Google Scholar]
- Bagal M V and Raut-Jadhav S 2021 Chapter 31 - The process for the removal of micropollutants using nanomaterials Handbook of Nanomaterials for Wastewater Treatment Micro and Nano Technologies ed B Bhanvase, S Sonawane, V Pawade and A Pandit (Elsevier) pp 957–1007.
- Environmental remediation by hydroxyapatite: Solid state synthesis utilizing waste chicken eggshell and adsorption experiment with Congo red dye. J. Saudi Chem. Soc.. 2023;27:101690
- [Google Scholar]
- Bindu P and Thomas S 2014 Estimation of Lattice Strain in ZnO Nanoparticles: X-ray Peak Profile Analysis Journal of Theoretical and Applied Physics 8.
- Intensified elimination of aqueous heavy metal ions using chicken feathers chemically modified by a batch method. J. Mol. Liq.. 2020;312:113475
- [Google Scholar]
- Diby Paul H S L and Sanjay P Govindwar IJERPH | Free Full-Text | Mineralization and Detoxification of the Carcinogenic Azo Dye Congo Red and Real Textile Effluent by a Polyurethane Foam Immobilized Microbial Consortium in an Upflow Column Bioreactor.
- Ebisike K, Elvis Okoronkwo A, Kanayo Alaneme K and Jeremiah Akinribide O 2023 Thermodynamic study of the adsorption of Cd2+ and Ni2+ onto chitosan – Silica hybrid aerogel from aqueous solution Results in Chemistry 5 100730.
- Multifunctional eco-friendly sorbent based on marine brown algae and bivalve shells for subsequent uptake of Congo red dye and copper(II) ions. J. Environ. Chem. Eng.. 2020;8:103915
- [Google Scholar]
- Wollastonite (CaSiO 3)-based composite particles for synthetic food dyes (Brilliant Blue) removal in aquatic media: Synthesis, characterization and kinetic study. IOP Conf. Ser.: Mater. Sci. Eng.. 2021;1053:012001
- [Google Scholar]
- Gao H J, Wang S F, Fang L M, Sun G A, Chen X P, Tang S N, Yang H, Sun G Z and Li D F 2021 Nanostructured spinel-type M(M = Mg, Co, Zn)Cr2O4 oxides: novel adsorbents for aqueous Congo red removal Materials Today Chemistry 22 100593.
- A novel agricultural waste based adsorbent for the removal of Pb(II) from aqueous solution: Kinetics, equilibrium and thermodynamic studies. J. Ind. Eng. Chem.. 2014;20:454-461.
- [Google Scholar]
- Elucidation of selective adsorption study of Congo red using new Cadmium(II) metal-organic frameworks: Adsorption kinetics, isotherm and thermodynamics. J. Solid State Chem.. 2021;296:121929
- [Google Scholar]
- Synthesis of chitosan/polyvinyl alcohol/zeolite composite for removal of methyl orange, Congo red and chromium(VI) by flocculation/adsorption. Carbohydr. Polym.. 2017;157:1568-1576.
- [Google Scholar]
- Spinel CuB2O4 (B = Fe, Cr, and Al) oxides for selective adsorption of Congo Red and photocatalytic removal of antibiotics. ACS Appl. Nano Mater.. 2022;5:11194-11207.
- [Google Scholar]
- Recent advances in removal of Congo Red dye by adsorption using an industrial waste. Sci. Rep.. 2022;12:6087.
- [Google Scholar]
- HENRY M. OTTE Lattice Parameter Determinations with an X‐Ray Spectrogoniometer by the Debye‐Scherrer Method and the Effect of Specimen Condition | Journal of Applied Physics | AIP Publishing.
- Microstructural parameters from X-ray peak profile analysis by Williamson-Hall models; A review. Mater. Today: Proc.. 2021;47:4891-4896.
- [Google Scholar]
- Enhancement of photocatalytic efficacy by exploiting copper doping in nano-hydroxyapatite for degradation of Congo Red dye. RSC Adv.. 2022;12:34080-34094.
- [Google Scholar]
- Ceria hollow spheres as an adsorbent for efficient removal of acid dye. ACS Sustain. Chem. Eng.. 2017;5:3570-3582.
- [Google Scholar]
- Removal of direct red 16 (textile dye) from industrial effluent by using feldspar. J. Chem. Soc. Pak.. 2014;36:191-197.
- [Google Scholar]
- Performances and mechanism of Methyl Orange and Congo Red adsorbed on the magnetic ion-exchange resin. J. Chem. Eng. Data. 2020;65:725-736.
- [Google Scholar]
- Induced crystallization porosity and properties of sintereds diopside and wollastonite glass-ceramics. J. Eur. Ceram. Soc.. 2008;28:555-562.
- [Google Scholar]
- Influence of anodization time on Al2O3 nanoporous morphology and optical properties using energy band gap at room temperature. Results Eng.. 2023;17:100816
- [Google Scholar]
- Khorsand Zak A, Abd. Majid W H, Abrishami M E and Yousefi R 2011 X-ray analysis of ZnO nanoparticles by Williamson–Hall and size–strain plot methods Solid State Sciences 13 251–6.
- Li H C, Wang D G, Chen C Z, Weng F and Shi H 2016 Influence of different amount of Na 2 O additive on the structure, mechanical properties and degradability of bioactive wollastonite Ceramics International 42 1439–45.
- Decolorizing of azo dye Reactive red 24 aqueous solution using exfoliated graphite and H2O2 under ultrasound irradiation. Ultrason. Sonochem.. 2008;15:717-723.
- [Google Scholar]
- Liu H, Wang S, Gao H, Yang H, Wang F, Chen X, Fang L, Tang S, Yi Z and Li D 2022 A simple polyacrylamide gel route for the synthesis of MgAl2O4 nanoparticles with different metal sources as an efficient adsorbent: Neural network algorithm simulation, equilibrium, kinetics and thermodynamic studies Separation and Purification Technology 281 119855.
- Transparent wide band gap crystals follow indirect allowed transition and bipolaron hopping mechanism. Results Phys.. 2014;4:103-104.
- [Google Scholar]
- K. Mohamed Racik S A and Hamza Irfan Full article: Microstructural evaluation of CoAl2O4 nanoparticles by Williamson–Hall and size–strain plot methods.
- Modified Scherrer equation to estimate more accurately nano-crystallite size using XRD. WJNSE. 2012;02:154-160.
- [Google Scholar]
- Comparison of dye degradation potential of biosynthesized copper oxide, manganese dioxide, and silver nanoparticles using Kalopanax pictus plant extract. Korean J. Chem. Eng. 2018:35.
- [Google Scholar]
- Nasiri S, Rabiei M, Palevicius A, Janusas G, Vilkauskas A, Nutalapati V and Monshi A 2023 Modified Scherrer equation to calculate crystal size by XRD with high accuracy, examples Fe2O3, TiO2 and V2O5 Nano Trends 3 100015.
- Thermal treatment effect on structural features of mechano-synthesized fluorapatite-titania nanocomposite: A comparative study. J. Adv. Ceram.. 2014;3:31-42.
- [Google Scholar]
- Removal of methylene blue from water using okra (Abelmoschus esculentus L.) mucilage modified biochar. Bioresour. Technol. Rep.. 2021;14:100689
- [Google Scholar]
- X-ray diffraction analysis by Williamson-Hall, Halder-Wagner and size-strain plot methods of CdSe nanoparticles- a comparative study. Mater. Chem. Phys.. 2020;239:122021
- [Google Scholar]
- Enhanced adsorption of congo red using cationic surfactant functionalized zeolite particles. Microchem. J.. 2020;153:104281
- [Google Scholar]
- Palakurthy S, K. V G R, Samudrala R K and P. A A 2019 In vitro bioactivity and degradation behaviour of β-wollastonite derived from natural waste Materials Science and Engineering: C 98 109–17.
- Synthesis and characterization of calcium silicate from rice husk ash and shell of snail Pomacea Canaliculata by solid state reaction. Adv. Mat. Res.. 2015;1103:1-7.
- [Google Scholar]
- Facile preparation of micro-porous biochar from Bangladeshi sprouted agricultural waste (corncob) via in-house built heating chamber for cationic dye removal. Arab. J. Chem.. 2023;16:105080
- [Google Scholar]
- X-ray analysis by Williamson-Hall and size-strain plot methods of ZnO nanoparticles with fuel variation. World J. Nano Sci. Eng.. 2014;04:21-28.
- [Google Scholar]
- Comparing methods for calculating nano crystal size of natural hydroxyapatite using X-ray diffraction. Nanomaterials. 2020;10:1627.
- [Google Scholar]
- Easy and green synthesis of TiO2 (Anatase and Rutile): Estimation of crystallite size using Scherrer equation, Williamson-Hall Plot, Monshi-Scherrer Model, Size-Strain Plot, Halder- Wagner Model. Results Mater.. 2023;20:100492
- [Google Scholar]
- Crystallographic characterization of naturally occurring aragonite and calcite phase: Rietveld refinement. J. Saudi Chem. Soc.. 2023;27:101649
- [Google Scholar]
- Sahadat Hossain Md, Jahan S A and Ahmed S 2023 Crystallographic characterization of bio-waste material originated CaCO3, green-synthesized CaO and Ca(OH)2 Results in Chemistry 5 100822.
- Salihi I U, Bala N, Danlami N and Abdulfatah A Y Comparison of Linear and Non-Linear Methods of Freundlich and Langmuir Isotherm Models for the Adsorption of Lead Using Sugarcane Bagasse.
- Shayesteh H, Rahbar-Kelishami A and Norouzbeigi R 2016 Evaluation of natural and cationic surfactant modified pumice for congo red removal in batch mode: Kinetic, equilibrium, and thermodynamic studies Journal of Molecular Liquids 221 1–11.
- Calcined eggshells as a new biosorbent to remove basic dye from aqueous solutions: Thermodynamics, kinetics, isotherms and error analysis. J. Taiwan Inst. Chem. Eng.. 2014;45:1578-1587.
- [Google Scholar]
- Facile synthesis of flat crystal ZnO thin films by solution growth method: A micro-structural investigation. J. Saudi Chem. Soc.. 2014;18:712-721.
- [Google Scholar]
- Microwave synthesis of wollastonite powder from eggshells. J. Eur. Ceram. Soc.. 2011;31:2435-2440.
- [Google Scholar]
- Vinod Kumar S S (PDF) X-ray Analysis of NiFe 2 O 4 Nanoparticles by Williamson-Hall and Size-Strain Plot Method.
- Nonlinear regression for treating adsorption isotherm data to characterize new sorbents: Advantages over linearization demonstrated with simulated and experimental data. Heliyon. 2023;9:e15128.
- [Google Scholar]
- Wang S, Li M, Gao H, Yin Z, Chen C, Yang H, Fang L, Jagadeesha Angadi V, Yi Z and Li D 2023 Construction of CeO2/YMnO3 and CeO2/MgAl2O4/YMnO3 photocatalysts and adsorption of dyes and photocatalytic oxidation of antibiotics: Performance prediction, degradation pathway and mechanism insight Applied Surface Science 608 154977.
- Wang S, Liu H, Li M, Han M, Gao H, Yang H, Fang L, Zhang H, Jagadeesha Angadi V, Manjunatha S O, Cai C and Li D 2023 Various carbon-based MgAl2O4 adsorbents and their removal efficiency of CR dye and antibiotics in aqueous media: High selective adsorption capacity, performance prediction and mechanism insight Ceramics International 49 26734–46.
- Removal of Congo Red from wastewater using ZnO/MgO nanocomposites as adsorbents: Equilibrium isotherm analyses, kinetics and thermodynamic studies. J. Nano Res.. 2023;77:65-86.
- [Google Scholar]
- You Y, KeqiQu, Huang Z, Ma R, Shi C, Li X, Liu D, Dong M and Guo Z 2019 Sodium alginate templated hydroxyapatite/calcium silicate composite adsorbents for efficient dye removal from polluted water International Journal of Biological Macromolecules 141 1035–43.
- Bisphenol A adsorption properties of mesoporous CaSiO3@SiO2 grafted nonwoven polypropylene fiber. Ind. Eng. Chem. Res.. 2017;56:2549-2556.
- [Google Scholar]
- Zonato R de O, Estevam B R, Perez I D, Aparecida dos Santos Ribeiro V and Boina R F 2022 Eggshell as an adsorbent for removing dyes and metallic ions in aqueous solutions Cleaner Chemical Engineering 2 100023.
- Zwier F B and AL-Da’amy M A 2023 preparation and evaluation of thermodynamics studies of congo red dye adsorption onto chemically modified snail, journal of aeronautical materials, 6(3) 367-375.
Appendix A
Supplementary material
Supplementary data to this article can be found online at https://doi.org/10.1016/j.arabjc.2024.105901.
Appendix A
Supplementary material
The following are the Supplementary data to this article:Supplementary Data 1
Supplementary Data 1


