

Translate this page into:
Studies on adsorption of Brilliant Green from aqueous solution onto nutraceutical industrial pepper seed spent
⁎Corresponding authors. akheelahmed54@gmail.com (Akheel Ahmed Syed), Muhammad.Ali@atu.ie (Muhammad Mahmood Ali), nasir@yonsei.ac.kr (Muhammad Nasir Bashir)
-
Received: ,
Accepted: ,
This article was originally published by Elsevier and was migrated to Scientific Scholar after the change of Publisher.
Abstract
The study proposed the removal of Brilliant Green, a cationic dye, by adsorption process from wastewater solution utilizing a low-cost adsorbent such as Nutraceutical Industrial Pepper Seed Spent (NIPSS). The study comprises an investigation of the parametric influence on the adsorption process. The parameters identified are pH, dye concentration, process temperature, quantity of the adsorbent, and particle size. The study of statistics found from experiments was carried out by incorporating Freundlich, Brouers-Sotolongo, Langmuir, Toth, Sips, Jovanovic, and Redlich-Peterson isotherm models. The adsorption kinetics were determined by implementing pseudo-first-order and second-order models, diffusion film models, and Dumwald-Wagner and Weber-Morris models. The experimental adsorption capacity qe was found to be about 130 mg/g. This value was closest to the maximum adsorption of 144.6mg/g predicted by the Brouers-Sotolongo isotherm which had a correlation coefficient (R2) of 0.998. The adsorption kinetics data was confirmed to be a pseudo-second-order model. The change in free energy, enthalpy change, and entropy change were vital thermodynamic factors in concluding that adsorption is almost spontaneous and endothermic process. Change in enthalpy (ΔH°) reduced value indicates the physical nature of the process. The adsorption of BG dye on the adsorbent surface was authenticated by FTIR spectroscopy and SEM imaging. A Central Composite Design (CCD) Quadratic model under Response Surface Methodology (RSM) was implemented for statistical optimization of adsorption capacity for the five parameters studied, namely, time, temperature, concentration of the dye, weight of the adsorbent, and pH. Software Design Expert 7.0 was used to evaluate 3D contour plots. The process of optimization yielded a value of 350 mg/g. Thus, incrementing the adsorption process by 84.2 %. The study provides insights on various dye and adsorbent interaction possibilities and derives that NIPSS is an efficient adsorbent to extract BG dye from wastewater solutions.
Keywords
Adsorption isotherm models
Brilliant Green
Adsorption kinetics
Nutraceutical industrial pepper seed spent
Valorisation

1 Introduction
India is ranked 15th among the world’s paper-producing countries and has been projected as a rapidly advancing paper market with an annual 6 % growth rate. Paper and paperboard production is a primitive Indian industrial sector, with 11.4 × 10⁷ tons of domestic production contributing to 2.6 % of the world’s paper production and a projected 23.5 × 10⁷ tons spike in production by 2024–25. Presently, paper consumption is estimated at 11 kg per capita. An increment of 1 kg per capita consumption will shoot the requirement by 1.25 × 10⁷ tons annually. The average per capita consumption of paper is about 56 kg globally and 40 kg in Asia (Ezeudu et al., 2019).
Paper production requires water of about 905.8 million m3. Of which, 700 million m3 of water is discharged as wastewater by this sector. Amongst various chemicals used, dyes are integral constituents of paper making industry. There are different classes of dyes used in paper industries of which, triphenylaryl dyes are prominent. Amongst the list of triphenylaryl dyes Brilliant Green (BG) is widely preferred in paper manufacturing industry. Less than a kilogram of dye is consumed for one ton of paper production (Mane et al., 2007).
The deep green, solid-shiny texture signifies the name Brilliant Green (BG). It is soluble in water (Ghaedi et al., 2011; Chieng et al., 2015). It is poisonous, carcinogenic, and even mutagenic across living organisms in the aquatic environment and any physical contact with or ingestion of BG can cause severe health problems (Salem et al., 2016). Thus, the removal of BG from paper industry effluent is of paramount importance for the safety of human beings (Enache et al., 2023; Gul et al., 2023).
Treatment of industrial waste water to extract dye remnants has been implemented utilizing biological, physical, and chemical modes. The literature highlights the adsorption and degradation techniques used for this purpose. One paper specifies the involvement of ANN and RSM to improve the efficiency of dye resulting from electrocoagulation (Singh et al., 2017). The degradation techniques are the cavitation-based technique (Thakare and Jadhav, 2013) and photocatalytic degradation using cerium oxide/Zeolite–NaX Catalyst (Sudha and Subramanian, 2015).
Adsorption technique is extensively used as a conventional methodology because of its low cost. Various adsorbents used may well be broadly classified into activated carbons and agricultural based biomass. The feasibility of activated carbon use is hindered by the cost and spent regeneration process complexity (New Zanella et al., 2014). The low-cost agricultural based biomasses used are of two types; chemically treated and chemically untreated biomasses. The latter have a low adsorption capacity. An ideal adsorbent must be easily sought at a considerably less price, have minimum alternate applications, have no pre-processing requisites, and have a porous structure to enhance adsorption. The adsorbent must be capable of associating with available technologies used for the handling of slurry recycling. In addition to being a ready-to-use biosorbent due to its previous mechanical, thermal, and chemical processing, Nutraceutical Industrial Pepper Seed Spent (NIPSS) seems to be a good candidate with the necessary qualities. This eliminates the need for additional chemical pre-treatment, which lowers the E-factor (Sheldon, 1992).
Nutraceutical is a broad umbrella term that is used to describe any product derived from food sources with extra health benefits in addition to the basic nutritional value found in foods. The US and Asia-Pacific regions are home to the rapidly expanding nutraceutical industrial sector, whose market is projected to reach US$ 278.96 billion by 2021 at a compound annual growth rate (CAGR) of 7.3 % (https://www.prnewswire.com/2015). The spent materials created by the nutraceutical business could make excellent adsorbents for cleaning up colors found in paper industry effluents. Although the amount of biomass generated and probably accessible for processing is not officially known, it is estimated that millions of tons of spent are produced each year and that biomass is a renewable resource. Due to the thermal, mechanical, and chemical processes it underwent, there is no manurial or feed value to the generated nutraceutical industrial spent (NIS). It is a massive burden for the nutraceutical sector to dispose of the vast volumes of waste and/or money created. Because of its porous structure, it is currently employed as a low calorific fuel in boilers, which increases its carbon footprint.
Our research school is the first to demonstrate the use of nutraceutical industrial spent (NIS) as filler material in the fabrication of green composites (Taqui et al., 2019; Pashaei et al., 2017). Further, the school has demonstrated that NIS as an adsorbent in the removal of toxic and hazardous dyes from textile industrial effluent (Taqui et al., 2019; Taqui et al., 2021; Sulthana et al., 2022). Also, we have demonstrated that the resulting sludge after the elimination of the dyes from TIE can be used as filler material in the fabrication of green composites. We are the first to demonstrate the concept of Circular Economy using the data generated from our studies (Taqui et al., 2022).
As part of our ongoing research, we are reporting on NIPSS's potential as an inexpensive biosorbent for the extraction of harmful BG from waste water solutions and its prospective use in industrial effluents. Since the procedure is straightforward, affordable, and environmentally beneficial, the suggested template might be expanded as a sustainable technique to treat paper sector industrial effluents. The utilisation of the proposed technology which is sustainable can have a significant impact on the economic feasibility and social significance of addressing environmental issues in human society.
Black pepper (Piper nigrum) an intensely grown tropical region crop, is of South Indian origin. India produces 65,000 tons of black pepper annually, ranking second in the world. Black Pepper, a flowering vine, belongs to the Piperaceae family. Piperine is the active ingredient in pepper responsible for its typical spiciness. Black pepper contains approximately 6 % piperine, 12 % oleoresin, and about 4 % essential oil (I Indian Institute of Spices Research and Kozhikode, 2015). About 78 % of pepper is discarded as pepper seed is spent. The spent contains invariably organic solvents; hence, it cannot be used as manure, fertilizer, or fuel. The use of the latter is further restricted due to the entrapment of moisture in the pores of NIPSS, resulting in reduced calorific content. Upon incineration, it releases toxic substances. Hence, disposal of spent is a major problem for the nutraceutical industry.
2 Materials and methods
The absorbance of the colored solution was measured at 625 nm along with distilled water as a reference using a UV–Vis spectrophotometer (Lambda 25, PerkinElmer, USA). Fourier transform infrared spectra were recorded in the 4,000–600 cm−1 region by a PerkinElmer Spectrum two, USA, Fourier transform infrared (FTIR) spectrometer. The adsorbent surface morphology was visualized by Zeiss scanning electron microscope Evo /LS15. pH was measured by a pH meter using Systronics-802, India.
2.1 Adsorbate
Cationic dye (BG), [M.F. = C27H33N2HO4S, M.W. = 482.64 g/mol, λmax = 625 nm], purchased from Powai, a Mumbai based company, Sigma Aldrich Pvt. Ltd., India. To create an aqueous solution, a determined amount of BG dye was dissolved in double distilled water. Brilliant Green dye molecular structure is represented by Fig. 1.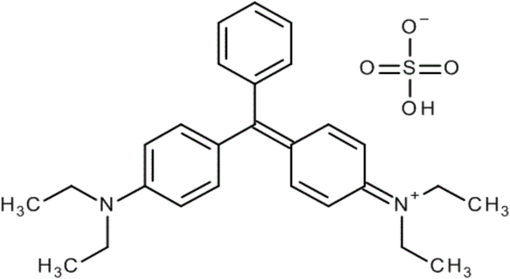
Brilliant Green Molecular Structure.
2.2 Pre-processing of adsorbent
NIPSS bought locally was treated for 24 h at 60 °C and later powdered. Fine powder ≤177 µm particle size was sieved out using a sieve of mesh size ASTM 80. The processed powder was stored in plastic bottles without any further chemical/physical treatments.
2.3 Characterization of spent
NIPSS morphological study was carried out using a Zeiss scanning electron microscope Evo /LS15. The SEM images are illustrated in Figs. 2a and 2b. Fig. 3 demonstrates the FTIR analysis done using a FTIR spectrometer. Some of the characterisation techniques of dye with agricultural biomass have been published elsewhere (Rehman et al., 2019; Kanwal et al., 2018).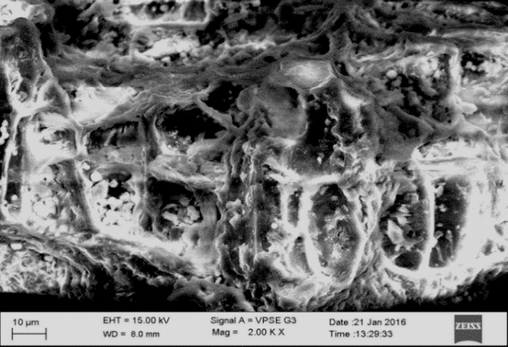
Unadsorbed NIPSS SEM image.
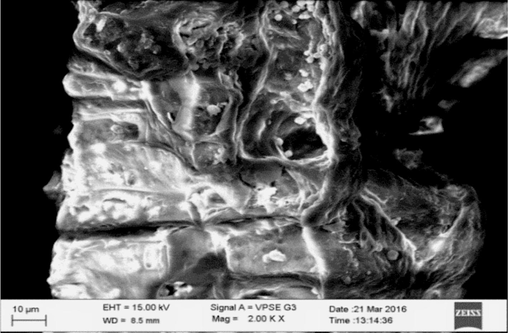
Adsorbed NIPSS SEM image.
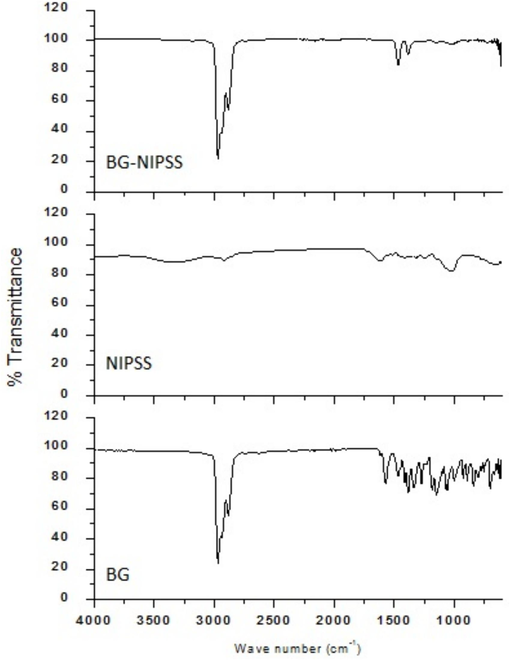
FTIR plot of (i) BG (ii) NIPSS (iii) BG adsorbed NIPSS.
2.4 Process of adsorption
To investigate the BG adsorption process in industrial wastewater, the batch adsorption method was used. Parametric influence was analyzed. Dye concentration, quantity of adsorbent, temperature variation, pH level, and size of particle were the parameters identified for analysis.
50 mL dye of initial concentration (25–300 mg/L) is taken in an erlenmeyer flask of 250 mL, to which a known quantity (50 mg) of NIPSS is added. The mixture at 25 ± 2 °C is thoroughly stirred in an orbital shaker for 3 h at 180 rpm, to attain equilibrium. Centrifuging of the samples at 8000 rpm for 10 min was done. A micropipette was used to skim out the unadsorbed dye solution. A UV/Vis double-beam spectrophotometer was utilized to measure the colored solution absorbance at 625 nm
The system was recurring for a kinetic study with pre-set durations for aqueous samples. The BG concentration measurements were done in a similar manner using a UV/Visible double-beam spectrophotometer. The study was organized at intervals of 5 min for duration of a 1 h with initial dye concentration considerations of 50 mg/L, 100 mg/L, and 200 mg/L. 50 mL solution of dye with varying NIPSS quantities (0.025–0.200 g/L) under equilibrium was used to investigate the feasible adsorbent quantity required for a unit mass of adsorbate. The pH influence on adsorption was determined by thoroughly mixing a solution concentration of 200 mg/L, containing 50 mg NIPSS and 50 mL dye. The solution was stirred, maintaining a pH 2–12. HCl was diluted and NaOH was utilized to adjust the pH value. The solution was continuously agitated for 3 h. Equilibrium was attained at constant shaking for 140–150 min at 170 rpm. The duration of solution stirring and rpm were maintained for all studies. At 625 nm, the dye concentration was measured with a twin-beam UV/Vis spectrophotometer. The results were tabulated as averages, after three experimental repetitions. Experiments were done in triplicate and the averages were reported. The coefficients of variation of results did not exceed in all cases ±2 % error.
2.5 Study of adsorption models
2.5.1 Isotherms
Adsorption isotherms define the system interaction between the adsorbent and the adsorbate. Parametric study for various models generates data regarding collaborative mechanisms, property changes at the interface, and adsorbent affinity. The usually implemented models for surface adsorption understanding are the Freundlich model and the Langmuir model. In addition to these Brouers-Sotolongo, Redlich-Peterson, Jovanovic, Toth, and Sips models were incorporated to adjudicate adsorption equilibrium at room temperature. The equations of all isotherm models are published elsewhere (Taqui et al., 2019). The complete explanation of isotherm models is published elsewhere (Korde et al., 2020).
2.5.2 Kinetics of adsorption
Data fitting with first- and second-order pseudo kinetics provides adsorption process controlling figures. The diffusion effect was analyzed using film diffusion, Dumwald-Wagner, and Weber-Morris models. The kinetic models governing equations and parameters are shown in Table 1. The non-linear least square method was adopted for curve fitting. The adsorption controlling mechanism was determined by experimental data fitting using a proper kinetic equation. k1 = pseudo-first order adsorption rate constant; k2 = pseudo-second order adsorption rate constant; h0 = initial rate of adsorption; R| = constant of film diffusion; kint = diffusion rate constant; K = rate constant of adsorption.
Pseudo-first order
Pseudo-second order
Film Diffusion model
Weber- Morris model
Dumwald-Wagner diffusion model
2.5.3 Thermodynamic parameters
Process entropy and free energy can be used to estimate the viability of the adsorption process and its regulating mechanism. In the current study, estimated thermodynamic parameters were used for adsorption percentage and enthalpy evaluation. The free energy change (ΔG0), change in enthalpy (ΔH0), and change in entropy (ΔS0) were estimated using rate law and kinetic data.
3 Results and discussion
3.1 Spent surface characterization
3.1.1 Scanning electron microscopy (SEM)
NIPSS morphology was studied using SEM for adsorbed and unadsorbed BG conditions. NIPSS consists of a fibrous structure with some channels and pores as shown in Fig. 2a. As seen in Fig. 2b, every pore and void were covered by the adsorbed dye (Doondani et al., 2022; Doondani et al., 2022; Nandanwar et al., 2023).
3.1.2 FTIR spectroscopy
As seen in Fig. 3, the broad band around 329 cm−1 in NIPSS results due to hydroxyl groups at the surface, bonded with adsorbed water and cellulose. The band corresponding to 2920 cm−1 represents the vibrational enlarging of —CH bonds in alkyl and alkane assemblies. The band representing 1615 cm−1 is dedicated to olefin C⚌C stretching. Methyl groups were designated by band at 1417 cm−1. The band related to 1026 cm−1 attributed to the existence of cellulose in the adsorbent.
After BG adsorption, the two bands present at 2967 cm−1 and 2881 cm−1 resemble –CH bond vibrational stretch in alkane and alkyl resulting from to bonding of carbon with hydrogen bonds clarifying the BG adsorption. Band related to 1569 cm−1 represents the ***C⚌C bond vibration stretch in the BG quinoid structure. Lowering of band wave number post-dye adsorption shows the quinoid structure’s presence in adsorption. The bands at 1467 cm−1 and 1384 cm−1 were initiated by dye molecules, C—N stretching, and C—H deformation, resulting in no critical shift. Peak shifting and regeneration were noticed in the results, which are due to functional group involvement in adsorption. Following the chemical alteration, the absorption bands between 1000 cm−1 and 800 cm−1 were altered. FTIR spectroscopy was utilized for adsorbent and adsorbate group identification, vital in dye adsorption.
3.1.3 Zero charge point
Zero charge point (pHz) determination is a means to identify the NIPSS surface charge. NaOH and diluted HCl were utilized to maintain the pH of 0.1 M KCl inside 2.0–12.0. To flasks of 250 mL, 50 mL KCl and 50 mg NIPSS is added. After a reaction period of 24 h, a pH meter is utilized to measure the pH value. The initial pH and final pH graphs are plotted, with pHinitial along the abscissa and pHfinal along the ordinate. It can be observed from Fig. 4, that the curves intersect at 7.1, indicating the NIPSS zero charge point, pHz = 7.1.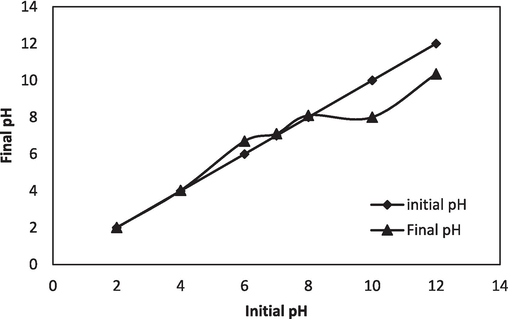
NIPSS Zero Point Charge.
3.2 Batch adsorption experimental study
3.2.1 Dye concentration and duration of contact effects
An increase of dye concentration to 300 mg/L from an initial concentration of 25 mg/L instigated adsorption to 130 mg/g, from 15 mg/g. The binding theory is that enhanced stimulation is caused by an increase in concentration gradient and reaches a constant rate at equilibrium time. The observations of Fig. 5a, specify that more duration of contact improved the BG adsorption. For a contact duration of 3 h, an extreme quantity of BG removal from the solution was noticed. Further increase in contact time reduced the rate of biosorption, finally attaining a constant rate. The process of dye adsorption was expedited initially and later because dye molecules were accumulating on the inner surface, the rate of adsorption decreased. The gathering of dye particles filled the active sites, creating the repulsion of bulk phases by the solute molecules (Nandi et al., 2009).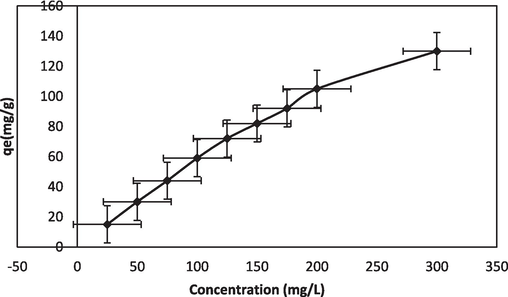
Initial concentration effect of BG-NIPSS.
3.2.2 Influence of adsorbent quantity
Among the various parametric effect investigations conducted in batch studies, adsorbent dosage is a critical parameter. 0.025–0.2 g of adsorbent quantity was taken to study its effect on BG dye adsorption. The results obtained are shown in Fig. 5b. It can be summarized that with an increased adsorbent amount, the surface area, hence the adsorption sites, increased. This facilitated BG sorption onto the NIPSS surface. It was observed that with dosage increments the adsorption had no significant change. This could be attributed to the equilibrium phase of dye molecule adsorption onto the NIPSS surface (Kumar et al., 2014).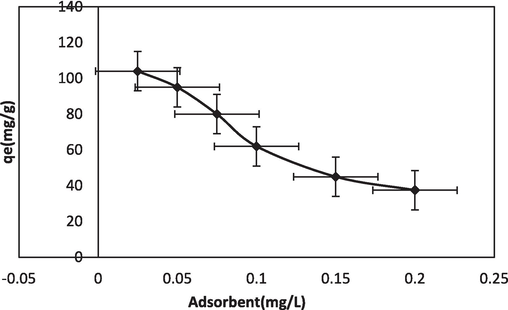
Adsorbent quantity effect of BG-NIPSS.
3.2.3 Temperature effect
The impact of temperature on dye adsorption is examined in the range of 30–50 °C. The plotting of the results is displayed in Fig. 5c. It was noted that when the temperature increased, the molecular mass transfer was stimulated resulting in enhanced dye adsorption. Adsorption increases at elevated temperatures, which makes the process endothermic.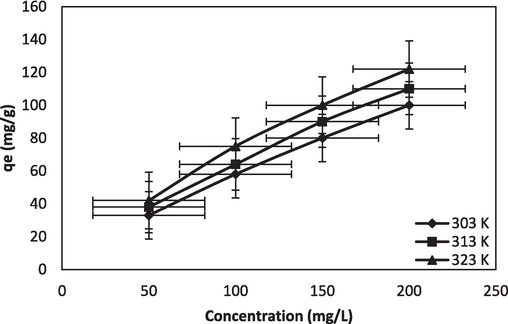
Temperature effect of BG-NIPSS.
3.2.4 pH effect
The initial pH of the dye solution plays an important role in the adsorption process. It is likely to influence the adsorption capacity, surface charge of the adsorbent, and extent of ionization of the dye present in the solution. It is likely to influence the ionization/dissociation of the functional group(s) on the active sites of the adsorbent and solution chemistry of the dyes. The adsorption process is influenced by the pH value of the solution by ionization, which affects the surface properties and stability of the BG structure (Sudha et al., 2015). The pH optimum value was found to be 3–4 to maintain stability in the BG solution. An increase or decrease in pH value made the BG solution unstable. It was observed that with a pH increase, adsorption improved, and peak capacity was marked at 4 pH. At pH 8 the BG solution started decolorizing. Beyond pH 9, the solution was unstable, developing turbidity and finally leading to precipitation (Kismir and Aroguz, 2011). Thus, it may be inferred that pH has a profound influence on the structural stability of BG, as shown in Fig. 5d.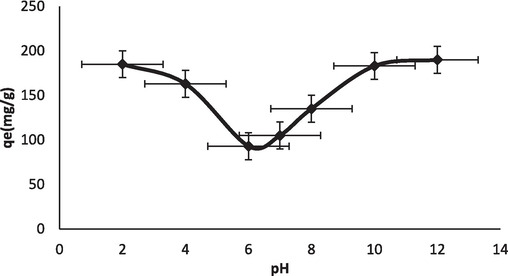
pH effect of BG-NIPSS.
3.2.5 Particle size effect
Five NIPSS mesh particle sizes (x), 90 μm ≤ x ≥ 125 μm; 125 μm ≤ x ≥ 177 μm; x ≥ 177, x ≤ 355; 355 μm ≤ x ≥ 500 μm and 500 μm ≤ x ≥ 710 μm, effect on process of the adsorption was investigated at 300 mg L−1 concentration of BG. The particle size effect on adsorption of dye is represented by Fig. 5e. With an increase in particle size dye adsorption declines, and as a result, the dye removal percentage likewise declines. The reason is the increased area of the surface as particle size reduces. The resistance of bigger particles to mass transfer by diffusion is higher, thus resulting in less dye quantity adsorption.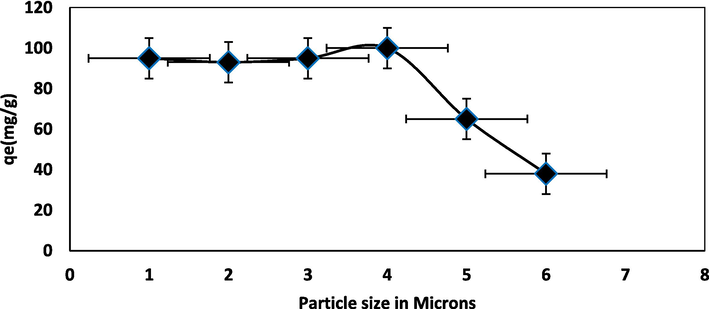
Particle size effect of BG-NIPSS.
3.3 Adsorption isotherms
The parameters mentioned are important for understanding adsorbate and adsorbent interaction. Various isotherm models have been implemented to recognize BG adsorption onto NIPSS. Langmuir model is applied widely (Langmuir, 1916). RL values calculated fall within 0.816 and 0.270, resembling favorable adsorption (Webber and Chakkravorti, 1974).
The Freundlich isotherm model assumes a heterogeneous surface for adsorption (Freundlich, 1906). The current study specifies physisorption is based on normal Langmuir Isotherm. Fig. 6a presents the results. The BG adsorption onto NIPSS is physisorption and under favorable experimental conditions.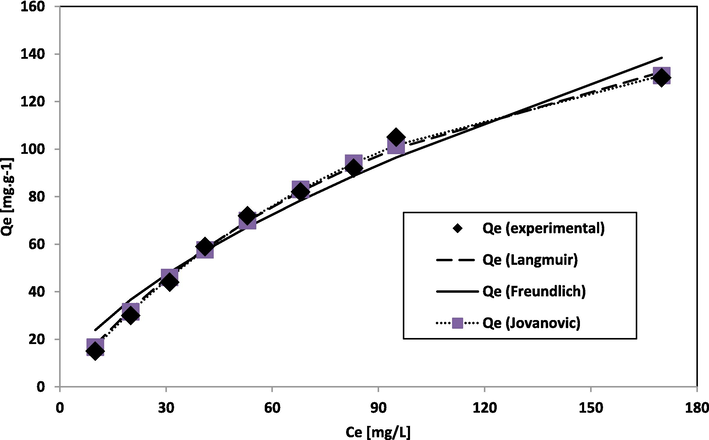
Graph of adsorption data fit of Jovanovic, Freundlich, and Langmuir isotherm.
Jovanovic isotherm is an extended form of Langmuir isotherm (Jovanović, 1969). It is considered a monolayer surface sans lateral interaction. The Toth isotherm (Toth, 1971) is a modified Langmuir isotherm model to achieve better data fit, and the model assumes heterogeneous adsorption systems. Sips isotherm (Sips, 1948) represents Langmuir isotherm combined with Freundlich isotherm (Fig. 6b).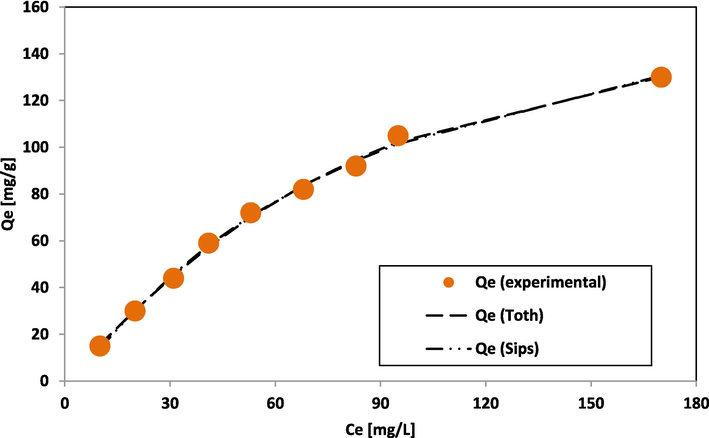
Graph of adsorption data fit of Toth and Sips isotherm.
The Redlich–Peterson isotherm is an improved Langmuir-Freundlich equation fit (Redlich and Peterson, 1959) (Fig. 6c). The Brouers-Sotolongo isotherm (Brouers et al., 2005) tends towards the Freundlich isotherm. The Qm values depicted in Tables 2a and 2b for 2-parameter and 3-parameter models show that the 3-parameter isotherm model specifically, Brouers-Sotolongo gave an improved fitting for the investigation carried out.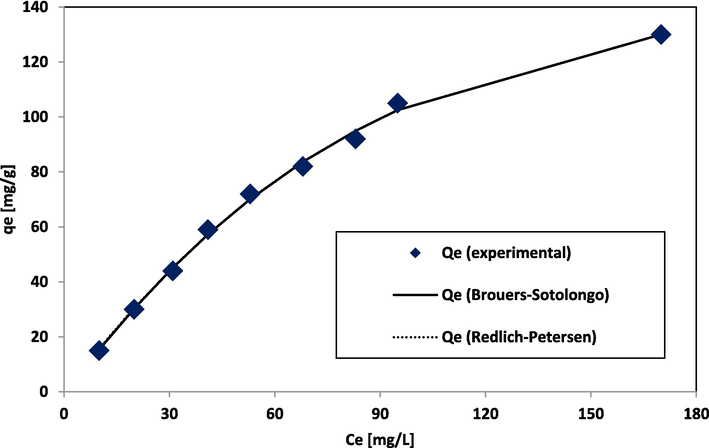
Fittings of adsorption data to Brouers-Sotolongo and Redlich Peterson isotherm.
Langmuir
Freundlich
Jovanovic
Qm
223.599
KF
5.721
Qm
152.0
Ka
0.009
nF
1.612
KJ
0.0116
Redlich-Peterson
Toth
Brouers-Sotolongo
Sips
ARP
1.60489
Qm
161.25
Qm
144.60
Qm
196.16
BRP
0.00084
nT0
1.668
KBS
0.0096
KS
0.0169
g
1.39705
bT0
2277.89
α
1.0655
MS
1.3626
In brief, the Langmuir, Freundlich, and Javanovic models reveal that BG and NIPSS interaction is linear, physical, and favourable. Both Jovanovic and Brouers-Sotolongo model gave better fits to the system, the results are presented in Tables 2a and 2c. However, Brouers-Sotolongo model provides a good fit. Peak adsorption capacity qe = 130 mg/g is nearer to Qm = 144.6 mg/g, obtained using Brouers-Sotolongo isotherm.
Isotherms
Langmuir
Freundlich
Jovanovic
Redlich-Peterson
Toth
Brouers-Sotolongo
Sips
SSE
57.7
419.6
33.1
26.6
26.3
184.0
27.5
R2
0.995
0.971
0.997
0.998
0.998
0.998
0.997
χ2
1.236
9.017
0.625
0.366
0.341
0.330
0.381
3.4 Adsorption kinetics
In kinetic investigations, BG concentrations of 50, 100, and 200 ppm were employed (Hameed and El-Khaiary, 2008; Ahmad and Kumar, 2010). Changes in adsorption rate were obtained from the kinetic study at 303 K, 313 K, and 323 K temperatures. Nonlinear analysis on kinetic data of adsorption was conducted utilizing pseudo-first order model (Lagergren, 1898), pseudo-second order model (Ho and McKay, 1998), and intra-particle diffusion by Weber-Morris model (Alkan et al., 2007); Dumwald-Wagner model (Wang et al., 2004) and Film Diffusion model (Boyd et al., 1947). Tables 3 and 4 show the estimated parameters. Figs. 7a, 7b and 7c shows kinetic fits at 50, 100 and 200 ppm respectively.
Initial Concentration of BG
Temp
Pseudo-first order
Pseudo-second order
[ppm]
[K]
Qeexpt
[mg/g]
Qepred
[mg/g]
k1
R2
χ2
Qepred
[mg/g]
k2
R2
χ2
50
303
33
31.71
4.80E−02
0.98
1.23
39.46
1.26E−03
0.98
0.94
313
38
33.82
4.87E−02
0.96
2.49
41.29
1.30E−03
0.97
1.22
323
42
37.29
5.05E−02
0.99
0.51
46.18
1.14E−03
0.99
0.21
100
303
58
50.37
4.20E−02
0.98
2.49
63.38
6.68E−04
0.98
1.53
313
65
54.04
5.20E−02
0.96
3.81
65.60
8.85E−04
0.97
1.77
323
75
66.90
4.84E−02
0.97
3.35
82.45
6.26E−04
0.99
1.37
200
303
100
83.30
4.69E−02
0.97
4.89
102.95
4.82E−04
0.98
2.82
313
110
91.25
4.65E−02
0.94
9.38
111.58
4.56E−04
0.95
5.65
323
122
96.06
4.62E−02
0.95
7.92
118.18
4.20E−04
0.97
4.46
Initial BG Concentration
Temp
Film diffusion model
Weber-Morris model
Dumwald-Wagner
[ppm]
[K]
R| [min−1]
R2
kist [mg g−1 s−0.5]
R2
K [min−1]
R2
50
303
0.0209
0.98
3.13
0.94
0.0127
0.99
313
0.0234
0.89
3.1
0.97
0.0086
0.98
323
0.0233
0.87
3.39
0.95
0.01
0.99
100
303
0.0302
0.99
5.3
0.96
0.0066
0.95
313
0.0309
0.98
5.7
0.99
0.007
0.99
323
0.0266
0.99
6.8
0.97
0.009
0.99
200
303
0.0327
0.99
8.46
0.96
0.0059
0.97
313
0.0199
0.95
8.86
0.97
0.0062
0.98
323
0.0228
0.82
9.23
0.96
0.008
0.95
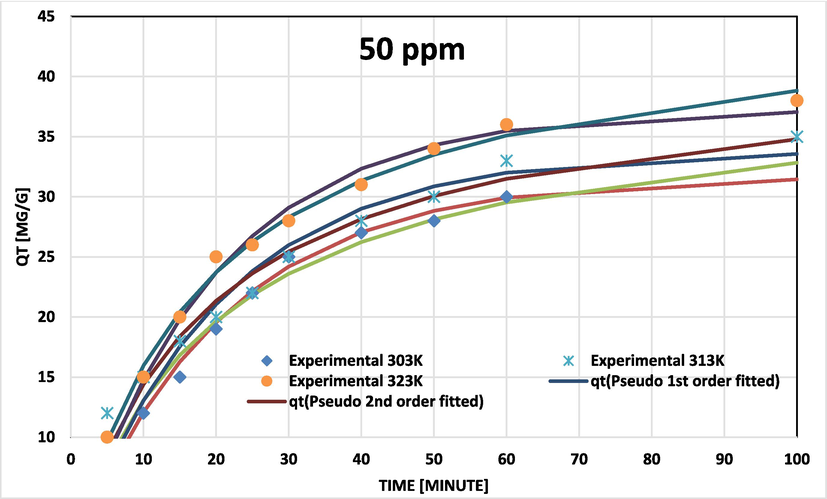
BG on NIPSS kinetic model fits at various temperatures for initial concentration 50 ppm.
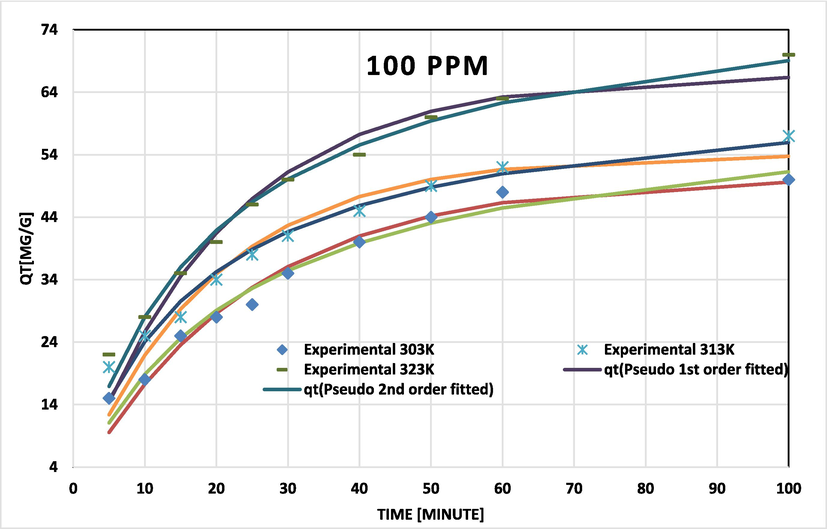
BG on NIPSS kinetic model fits at various temperatures for initial concentration 100 ppm.
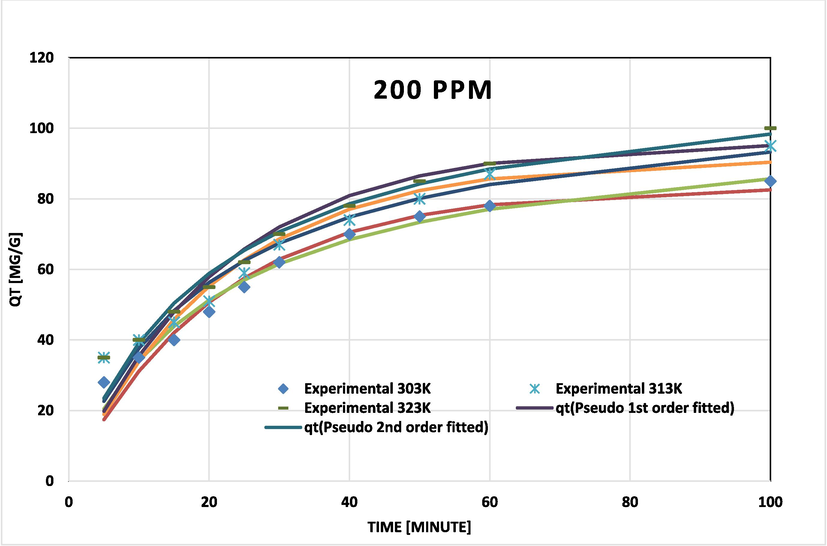
BG on NIPSS kinetic model fits at various temperatures for initial concentration 200 ppm.
Pseudo-second order data related to coefficients of determination (R2) and chi-square (χ2) fit the experimental results more closely for BG concentrations of 50, 100, and 200 ppm (Figs. 7a, 7b, and 7c). The adsorption rate peaked to maximum and later decelerated reaching a constant rate. With temperature rise the capacity of adsorption (qe) increased (Table 3). Results confirm that the process of adsorption was not rate-limiting.
The molecular movement of solute molecules to a solid surface and diffusion to NIPSS pores was witnessed in the adsorption process. The solute movement was understood by analyzing data to find out the effects of diffusion.
The Dumwald-Wagner model (Fig. 8) was used to calculate the actual constant of absorption rate (K) including the diffusion effect corrections. The model proposed by Weber-Morris, shown in Fig. 9 can be used to describe molecular diffusion. The kinetics of adsorption are not dependent on any sole mechanism. The experimental data clarifies that multiple linearity levels exist at all concentrations of solute. At initial concentrations of 50 ppm, the rate of adsorption process was high at low temperatures. A linear rate change was observed which stabilized relative to time. Linearity was noticed at elevated temperatures, but no significant rate change was recorded at solute concentrations >200 ppm. These observations were made during data fitting of high temperature to diffusion models. Fig. 10 shows compatibility with model having higher R2, χ2, and diffusion constant R|. At elevated temperatures, diffusion limitations slightly reduce the rate of adsorption. Diffusion is thus inferred as rate restrictive process. The rate of adsorption is decelerated due to the initial adherence of solute on the particle surface. Table 4 presents the results.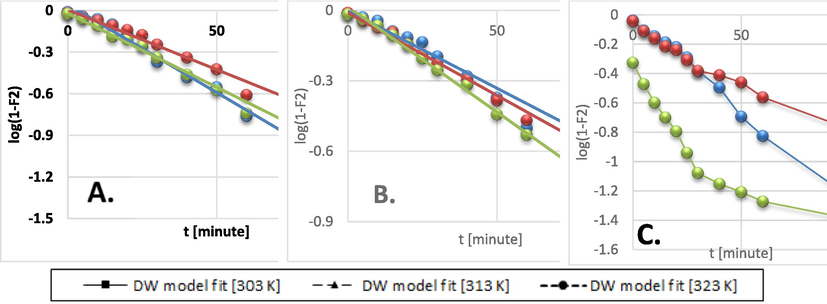
Dumwald-Wagner model kinetics data fit for: A) 50 ppm, B) 100 ppm, C) 200 ppm initial BG concentration.
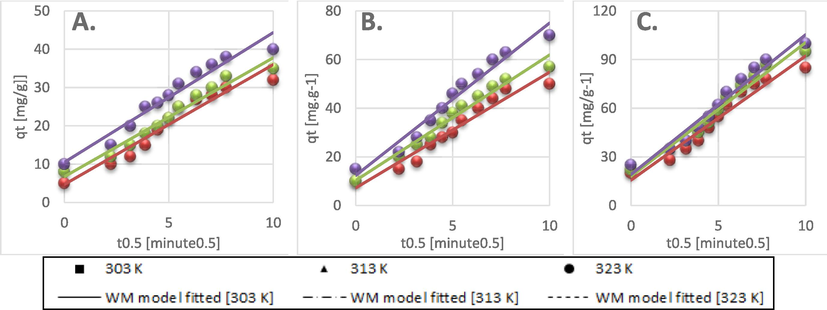
Weber- Morris model kinetics data fit for: A) 50 ppm, B) 100 ppm, C) 200 ppm initial BG concentration.
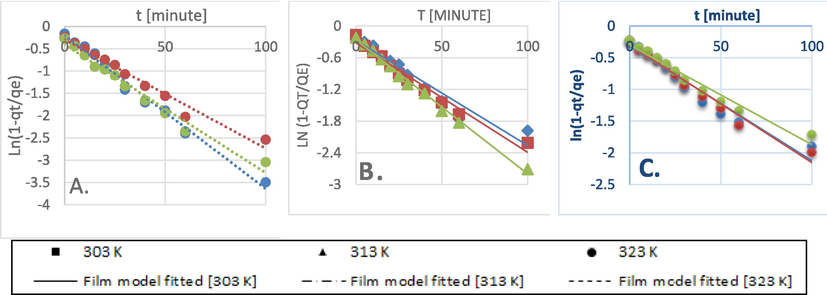
Film diffusion model kinetics data fit for: A) 50 ppm, B) 100 ppm, C) 200 ppm initial BG concentration.
3.5 Effect of adsorption thermodynamics
Parameters like free energy (ΔG°), change in enthalpy (ΔH°) and entropy (ΔS°) influence the thermodynamic aspects of adsorption. Table 5 shows the values of thermodynamic parameters.
Concentration of BG (mg/l)
ΔH0 (kJ/mol)
ΔS0 (J/mol /K)
ΔG0 (kJ/mol)
303 K
313 K
323 K
50
40.27
151.67
−5.68
−7.20
−8.71
100
31.14
118.43
−4.73
−5.92
−7.10
150
22.64
89.14
−4.36
−5.25
−6.15
200
18.06
72.89
−4.02
−4.75
−5.48
Where KL is the thermodynamic equilibrium constant (L mol−1) and T is the temperature (K). Co and Ce are initial and equilibrium concentrations (mg L−1) of dye in solution, respectively. ΔH° and ΔS° can be determined from the slope and the intercept of the Van’t Hoff plots of ln (KL) vs. 1/T and Ea can be determined from the slope and the intercept of the Van’t Hoff plots of ln (K2) vs. 1/T.
The adsorption process is endothermic as evident from ΔH° positive values, conversely, it is physical a change in enthalpy is >200 kJ/mol also extent of adsorption enhances with temperature rise. Adsorbate affinity with adsorbent at the surface is highly random which is identified by positive ΔS°. Contrasting to this discussion negative ΔG° resembles reduced free energy which acts as an indicator of process spontaneity and feasibility. It is also noted that for all temperatures ΔG° is negative, which attributes BG adsorption on NIPSS to be random and improving. A decrease in ΔG° when there is rise in temperature, represents improved adsorption at elevated temperatures.
3.6 Statistical optimization by response surface Methodology (RSM) using Central Composite Design (CCD)
A CCD Quadratic model under Response Surface Methodology (RSM) was implemented for statistical optimization of adsorption capacity. Table 6 lists the 134 studies study design, experimental, and projected values. Contour plots in 3D to evaluate the response of independent variables were done using a software Design Expert (7.0.0).
Standard Order
A
TimeB
TemperatureC
ConcentrationD
Adsorbent DosageE
pHActual value (%)
Predicted value (%)
1
180
27
25
0.05
7
15
12.1
2
180
27
50
0.05
7
30
27.8
3
180
27
75
0.05
7
44
42.7
4
180
27
100
0.05
7
59
56.7
5
180
27
125
0.05
7
72
69.8
6
180
27
150
0.05
7
82
82.1
7
180
27
175
0.05
7
92
93.5
8
180
27
200
0.05
7
105
104.0
9
180
27
300
0.05
7
130
137.5
10
180
27
200
0.05
2
185
191.1
11
180
27
200
0.05
4
163
133.2
12
180
27
200
0.05
6
93
106.0
13
180
27
200
0.05
7
105
104.0
14
180
27
200
0.05
8
135
109.7
15
180
27
200
0.05
10
183
144.1
16
180
27
200
0.05
12
190
209.2
17
180
27
200
0.025
7
104
123.2
18
180
27
200
0.05
7
95
104.0
19
180
27
200
0.075
7
80
86.9
20
180
27
200
0.1
7
62
72.0
21
180
27
200
0.15
7
45
48.4
22
180
27
200
0.2
7
37
33.2
23
180
27
200
0.3
7
28
28.2
24
180
30
50
0.05
7
33
29.0
25
180
30
100
0.05
7
58
57.9
26
180
30
150
0.05
7
80
83.5
27
180
30
200
0.05
7
100
105.5
28
180
40
50
0.05
7
38
34.3
29
180
40
100
0.05
7
64
63.7
30
180
40
150
0.05
7
90
89.6
31
180
40
200
0.05
7
110
112.1
32
180
50
50
0.05
7
42
42.0
33
180
50
100
0.05
7
75
71.8
34
180
50
150
0.05
7
100
98.2
35
180
50
200
0.05
7
122
121.1
36
0
30
50
0.05
7
5
3.7
37
5
30
50
0.05
7
10
6.9
38
10
30
50
0.05
7
12
10.0
39
15
30
50
0.05
7
15
12.9
40
20
30
50
0.05
7
19
15.7
41
25
30
50
0.05
7
22
18.4
42
30
30
50
0.05
7
25
20.9
43
40
30
50
0.05
7
27
25.4
44
50
30
50
0.05
7
28
29.4
45
60
30
50
0.05
7
30
32.8
46
100
30
50
0.05
7
32
40.8
47
0
40
50
0.05
7
8
5.9
48
5
40
50
0.05
7
12
9.3
49
10
40
50
0.05
7
15
12.4
50
15
40
50
0.05
7
18
15.4
51
20
40
50
0.05
7
20
18.3
52
25
40
50
0.05
7
22
21.0
53
30
40
50
0.05
7
25
23.6
54
40
40
50
0.05
7
28
28.4
55
50
40
50
0.05
7
30
32.5
56
60
40
50
0.05
7
33
36.1
57
100
40
50
0.05
7
35
44.7
58
0
50
50
0.05
7
10
10.6
59
5
50
50
0.05
7
15
14.0
60
10
50
50
0.05
7
20
17.2
61
15
50
50
0.05
7
25
20.3
62
20
50
50
0.05
7
26
23.3
63
25
50
50
0.05
7
28
26.1
64
30
50
50
0.05
7
31
28.8
65
40
50
50
0.05
7
34
33.7
66
50
50
50
0.05
7
36
38.0
67
60
50
50
0.05
7
38
41.8
68
100
50
50
0.05
7
40
51.1
69
0
30
100
0.05
7
10
15.2
70
5
30
100
0.05
7
15
18.9
71
10
30
100
0.05
7
18
22.5
72
15
30
100
0.05
7
25
25.9
73
20
30
100
0.05
7
28
29.2
74
25
30
100
0.05
7
30
32.3
75
30
30
100
0.05
7
35
35.3
76
40
30
100
0.05
7
40
40.8
77
50
30
100
0.05
7
44
45.8
78
60
30
100
0.05
7
48
50.2
79
100
30
100
0.05
7
50
62.0
80
0
40
100
0.05
7
10
17.9
81
5
40
100
0.05
7
20
21.7
82
10
40
100
0.05
7
25
25.3
83
15
40
100
0.05
7
28
28.8
84
20
40
100
0.05
7
34
32.2
85
25
40
100
0.05
7
38
35.4
86
30
40
100
0.05
7
41
38.5
87
40
40
100
0.05
7
45
44.2
88
50
40
100
0.05
7
49
49.3
89
60
40
100
0.05
7
52
53.9
90
100
40
100
0.05
7
57
66.4
91
0
50
100
0.05
7
15
23.0
92
5
50
100
0.05
7
22
26.8
93
10
50
100
0.05
7
28
30.6
94
15
50
100
0.05
7
35
34.2
95
20
50
100
0.05
7
40
37.6
96
25
50
100
0.05
7
46
40.9
97
30
50
100
0.05
7
50
44.1
98
40
50
100
0.05
7
54
49.9
99
50
50
100
0.05
7
60
55.2
100
60
50
100
0.05
7
63
60.0
101
100
50
100
0.05
7
70
73.1
102
0
30
200
0.05
7
20
27.9
103
5
30
200
0.05
7
28
32.5
104
10
30
200
0.05
7
35
37.1
105
15
30
200
0.05
7
40
41.5
106
20
30
200
0.05
7
48
45.7
107
25
30
200
0.05
7
55
49.8
108
30
30
200
0.05
7
62
53.8
109
40
30
200
0.05
7
70
61.2
110
50
30
200
0.05
7
75
68.1
111
60
30
200
0.05
7
78
74.5
112
100
30
200
0.05
7
85
94.0
113
0
40
200
0.05
7
22
31.4
114
5
40
200
0.05
7
35
36.2
115
10
40
200
0.05
7
40
40.8
116
15
40
200
0.05
7
45
45.2
117
20
40
200
0.05
7
51
49.6
118
25
40
200
0.05
7
59
53.8
119
30
40
200
0.05
7
67
57.8
120
40
40
200
0.05
7
74
65.4
121
50
40
200
0.05
7
80
72.5
122
60
40
200
0.05
7
87
79.0
123
100
40
200
0.05
7
95
99.3
124
0
50
200
0.05
7
25
37.3
125
5
50
200
0.05
7
35
42.2
126
10
50
200
0.05
7
40
46.9
127
15
50
200
0.05
7
48
51.4
125
20
50
200
0.05
7
55
55.8
126
25
50
200
0.05
7
62
60.1
127
30
50
200
0.05
7
70
64.2
128
40
50
200
0.05
7
78
72.1
129
50
50
200
0.05
7
85
79.3
130
60
50
200
0.05
7
90
86.0
131
100
50
200
0.05
7
100
106.9
132
180
27
25
0.05
7
15
12.1
133
180
27
50
0.05
7
30
27.8
134
180
27
75
0.05
7
44
42.7
The study presents an experimental investigation considering six variables, their individual effect, and their collaborated influence. Table 7 is a representation of variance analysis, clarifying the significance of the parametric effect. The factor's criticality was evaluated at a 95 % confidence interval and p < 0.05 %. The quadratic regression analysis was conducted for A, B, C, D, E, AC, A2, C2, and E2 model considering their significance. Cross products AD, AE, BD, BE, BF, CD, CE, CF, and DE are zero and omitted in the regression equation. The F-value of the RSM model is noted as 232. R2 = 89.05 % is approximately near to the corrected value of 95.76 %. Peak value of R2 = 96.2 %, variance coefficient (CV) = 14.5 %, and feasible data fit regarding models compatibility in design space. The plot of actual v/s predicted results shown in Fig. 11, highlights compatibility among experimental and predicted responses. The equation for the regression study is as follows:
Adsorption = −24.0 + 33.6*A+6.4*B+40.0*C-47.5*D+9.1*E+1.8*AB+24.0*AC+1.4*BC-23.3*A2 + 1.6*B2-13.1*C2 + 31.9*D2 + 96.1*E2
Significant figures. + Suggestive significance (p value: 0.05 < p < 0.10). * Moderately significant (p value: 0.01 < p ≤ 0.05). ** Strongly significant (p value: p ≤ 0.01).
Source
Sum of Squares
Degree of freedom
Mean Square
F Value
P- Value
Model
170143.5
13
13088.0
232.0
<0.001**
A
43591.5
1
43591.5
772.6
<0.001**
B
1646.8
1
1646.8
29.2
<0.001**
C
16477.4
1
16477.4
292.0
<0.001**
D
9280.9
1
9280.9
164.5
<0.001**
E
230.4
1
230.4
4.1
0.0455*
AB
97.7
1
97.7
1.7
0.1908
AC
7001.4
1
7001.4
124.1
<0.001**
BC
24.2
1
24.2
0.4
0.5142
A^2
6864.2
1
6864.2
121.7
<0.001**
B^2
40.5
1
40.5
0.7
0.3984
C^2
589.2
1
589.2
10.4
<0.001**
D^2
1156.7
1
1156.7
20.5
<0.001**
E^2
16843.0
1
16843.0
298.5
<0.001**
Residual
6770.6
120
56.4
Lack of Fit
6703.9
118
56.8
1.7
0.4422
Total
176914.1
133
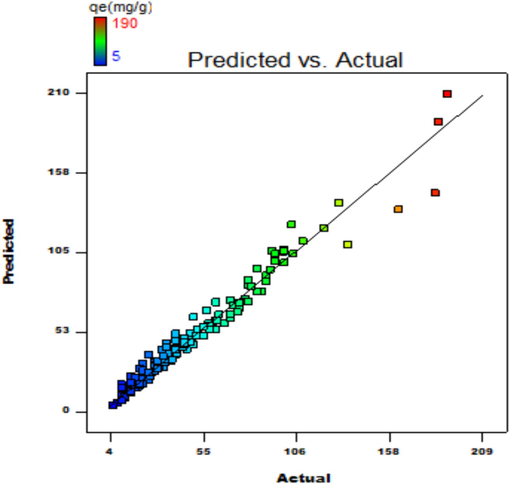
Graph of actual v/s predicted.
The CCD based multi regression analysis of interaction terms and second order polynomial equation maximization was interpreted to obtain optimal values. By statistical experiment, the adsorption peak value obtained was 350 mg g−1. The supporting parametric condition maintained was as follows pH=11.74, adsorbent dosage = 0.03 g L−1, particle size = 175 µ and initial concentration of dye = 482 mg L−1, set at adsorption duration of 200 min for 76 °C and 165 rpm orbital shaking.
The response to parametric interaction was studied through 3D surface and contour plots and the diagrams are presented in Figs. 12a-12j The statistical analysis was done for two parameter interactions while others were paused.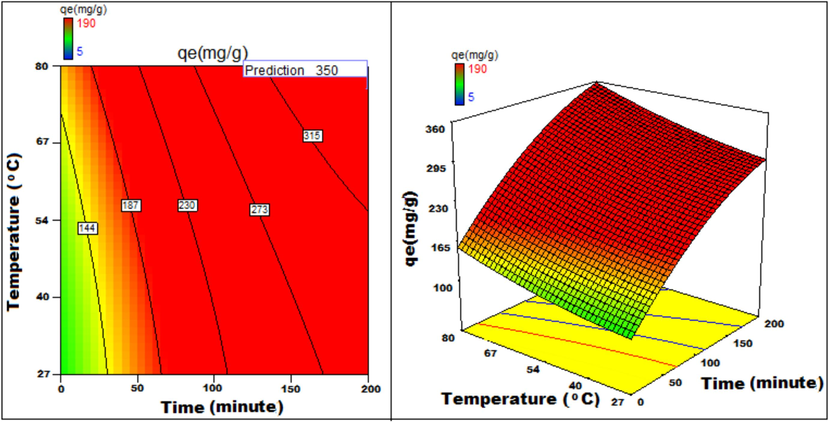
Temperature v/s Time 3D surface and contour plots showing variation in adsorption capacity.
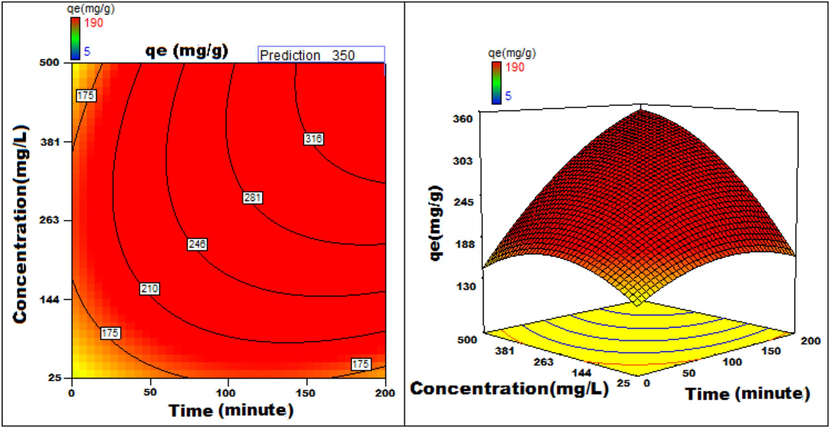
Concentration v/s Time 3D surface and contour plots showing variation in adsorption capacity.
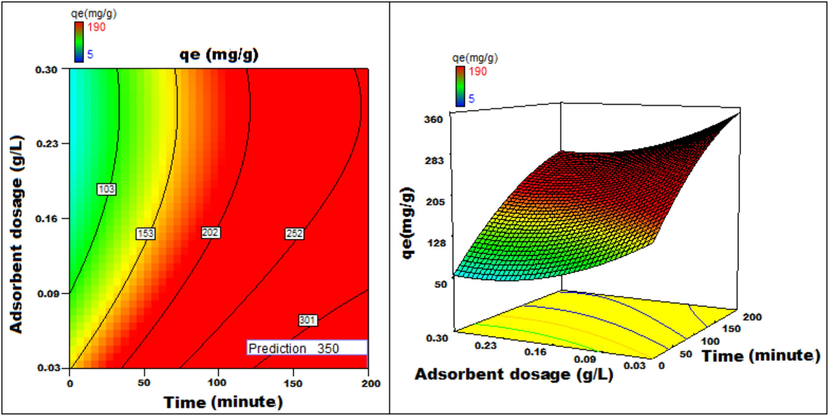
Adsorbent dosage v/s Time 3D surface and contour plots showing variation in adsorption capacity.
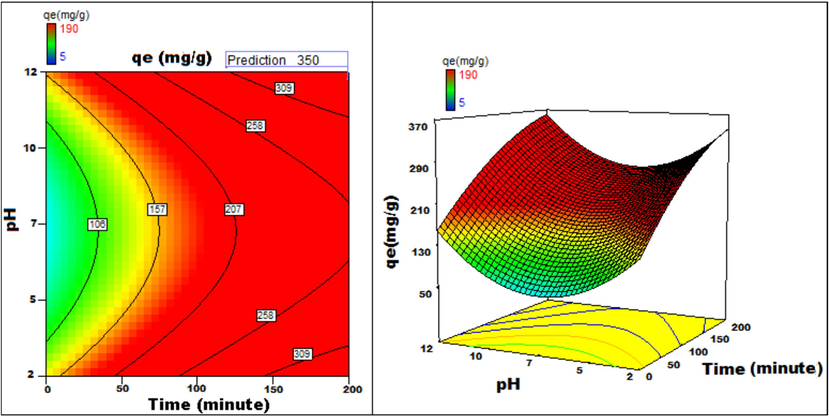
pH v/s Time 3D surface and contour plots showing variation in adsorption capacity.
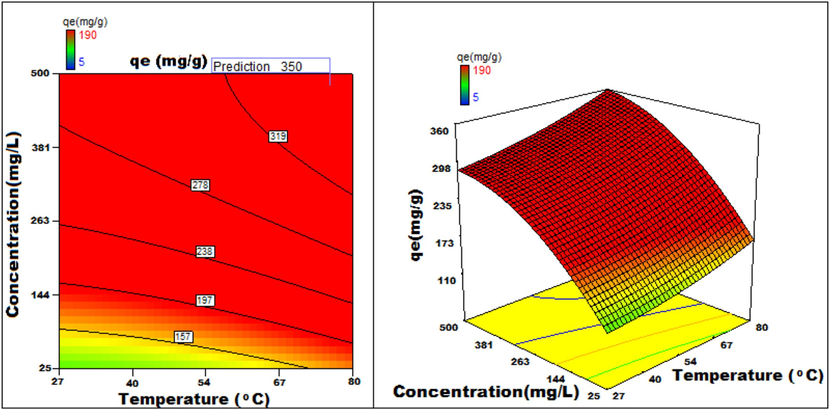
Temperature v/s concentration 3D surface and contour plots showing variation in adsorption capacity.
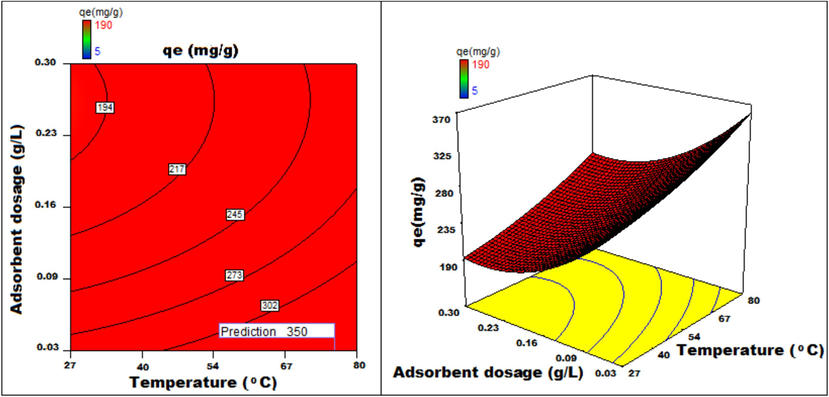
Temperature v/s adsorbent dosage 3D surface and contour plots showing variation in adsorption capacity.
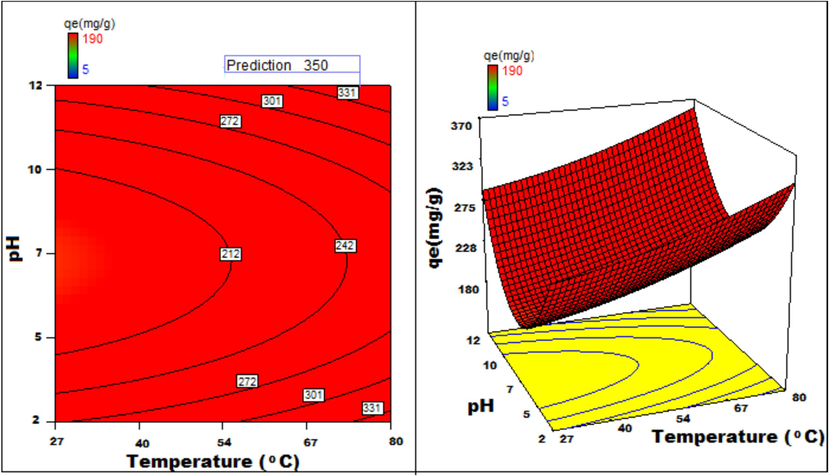
Temperature v/s pH 3D surface and contour plots showing variation in adsorption capacity.
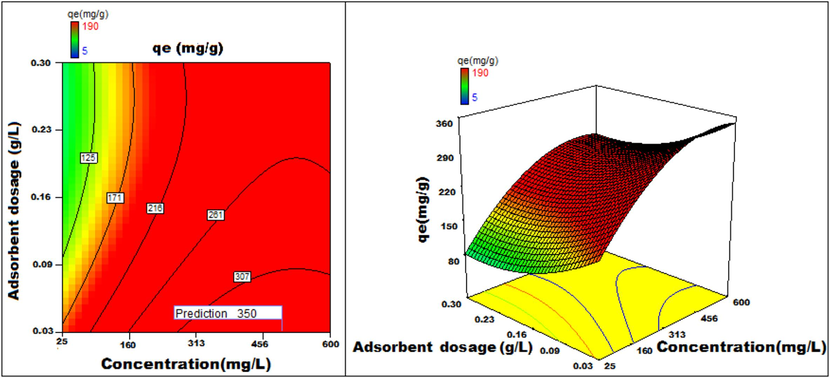
Adsorbent dosage v/s concentration 3D surface and contour plots showing variation in adsorption capacity.
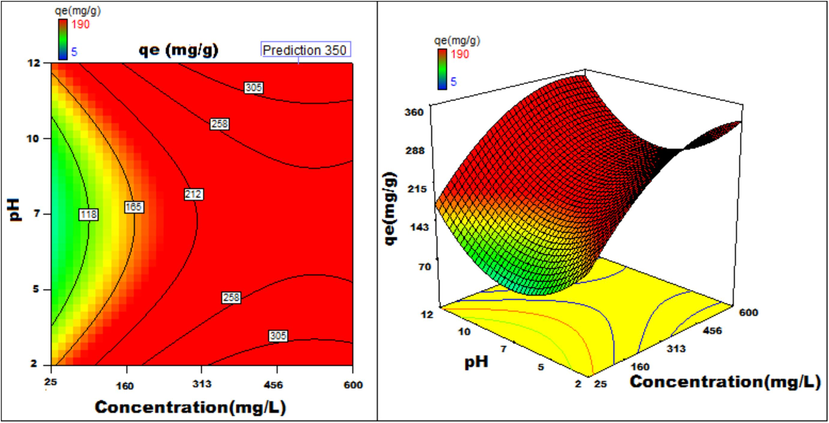
pH v/s concentration 3D surface and contour plots showing variation in adsorption capacity.
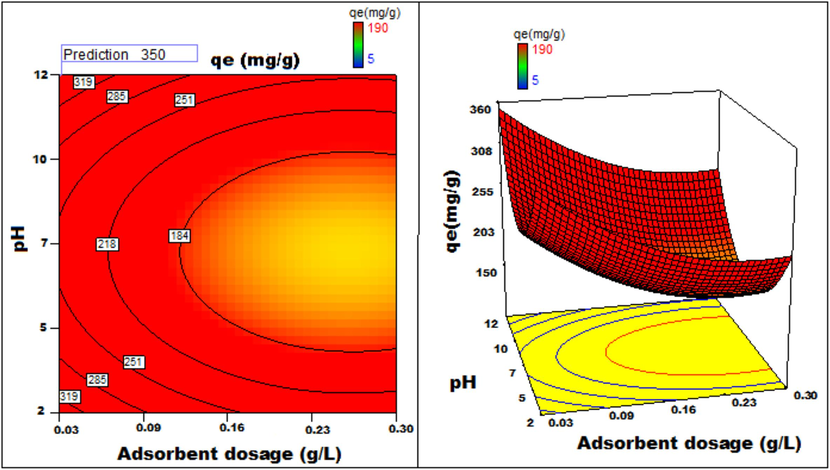
Adsorbent dosage v/s pH 3D surface and contour plots showing variation in adsorption capacity.
Apart from optimal condition determination, statistical optimization is feasible for understanding the parameter influence on the process of adsorption. 3D plots of duration versus other factors specify that time has a significant influence on adsorption. With an increment of time, temperature, concentration, and size of particle, the adsorption process can be enhanced. Peak adsorption activity was noticed for a time period of 200 min. The higher the initial concentration of dye, the greater will be the adsorption. It is evident from the time v/s adsorbent dosage graph, that more duration improves the process of adsorption but an increase in the amount of adsorbent has adverse effects. An increment of pH value facilitates the sorption process till a maximum pH = 12. Temperature variation has induced a positive influence with all variables considered. A similar effect is noticed with initial dye concentration. An increase in the concentration advances the adsorption under the influence of other variables. In fact, with higher initial dye concentration, adsorption capacity can be greatly increased. Positive values of regression coefficients indicate process enhancement, as can be analysed from an example, increase in Temperature (B) results in an adsorption capacity increase. Conversely, a negative value represents a degradation effect, as evident from adsorption dosage (D), i.e., more adsorption dosage diminishes the adsorbent capacity to adsorb. Thus (Figs. 12a-12j) are surface and contour plots viewing the influence of two parameters on biosorption.
The process optimization is well understood from the quadratic model. The peak capacity of adsorption and parameter response to interaction are clarified by this model. The optimization obtained is 190–350 mg/g, incrementing the adsorption process by 84.2 %.
3.7 Adsorption mechanism of BG dye onto NIPSS
The process of adsorption of the dye onto the adsorbent is governed by mass transfer phenomena. According to the experimental findings and statistical optimization of process parameters, the mechanism of adsorption involves the following steps: Mass transfer of AV49 dye from bulk solution onto the adsorbent is fast at the initial stages. The monolayer is formed. Mechanical agitation has a profound influence on mass transfer. Diffusion is a slow process. The hydrogen bonds are formed. The influence of weak Van der Waals forces plays a major role. Based on the above, the physical interaction of Brilliant Green and NIPSS model is shown in Fig. 13.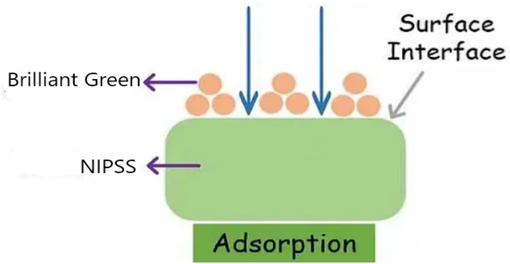
Schematic representation of hydrogen bonding between Brilliant Green on NIPSS.
3.8 Adsorbent regeneration and costing
The regeneration of NIPSS will facilitate its recovery and reuse, but the processing cost estimated is too high compared to the adsorbent itself. The processing cost is much higher compared to the recovered adsorbent cost (<1 US $ for 50 kg of NIPSS). Conversely, it enhances the E-factor, which increases environmental toxicants. This is undesirable, thus an alternative proposed to improve the usage of waste recycled process materials is one presently under development for thermoset and thermoplastic fabrication (Shekhawat et al., 2023; Gomase et al., 2022).
The scanty literature and limitations of the methods reported have encouraged the authors to use NIPSS for BG dye extraction from industrial wastewater. Several agricultural waste materials and/or by-products (treated and untreated) were implemented in the separation process of BG dye. The details are presented in Table 8. The values indicate that NIPSS is superior to all the adsorbents reported in the literature.
Adsorbent
Langmuir adsorption capacity Qm (mg/g)
Reference
Untreated
Saklikent mud
1.18
(Kismir and Aroguz, 2011)
Shrimp shell
10.60
(Sawasdee and Watcharabundit, xxxx)
Rice husk ash (RHA)
21.60
(Mane et al., 2007)
Water melon rind
92.60
(Mane et al., 2007)
Durian rind
95.20
(Mohammed et al., 2012)
Neem leaves
133.69
(Bhattacharyya and Sarma, 2003)
Treated
Acorn-based AC
1.73
(Rehman et al., 2012)
Eugenia jambolina leaves
5.128
(Lakdawala and Patel, 2012)
Bagasse flyash
13.94
(Mane and Babu, 2011)
Activated rice husk
55.60
(Oguntimein, 2015)
treated sawdust
58.48
(Lakshmipathy et al., 2015)
sunflower seed hull
169.50
(Haris and Sathasivam, 2009)
Water melon rind
188.60
(Calvete et al., 2010)
NIPSS
223.59
Present work
4 Conclusion
Studies on kinetics and thermodynamics have shown that adsorption follows second-order kinetics and is primarily a physical process. To achieve maximum adsorption of 130 mg g−1 of BG on NIPSS, the Brouers-Sotolongo isotherm was applied. A quadratic model using Central Composite Design (CCD) within Response Surface Methodology (RSM) was employed to statistically optimize the adsorption capacity. Five parameters were investigated: time, temperature, dye concentration, adsorbent weight, and pH. Software Design Expert 7.0 was utilized to generate 3D contour plots. The optimization achieved resulted in an adsorption capacity of 350 mg g−1, representing a substantial increase of 269.2 % in the adsorption process. We found the adsorption process to be endothermic and spontaneous. The low ΔH0 value indicates that it is predominantly a physical process. FTIR spectra confirmed that BG adhered to NIPSS guidelines. NIPSS has proven to be an effective and economical adsorbent for removing BG from aqueous solutions. Additionally, ongoing research at our school aims to use dye-adsorbent fillers that are environmentally friendly. Therefore, proposing an uncontaminated, inexpensive, and realistic solution for disposing of waste from the nutraceutical sector will fulfill sustainability requirements, including financial benefits, environmental responsibility, and social obligations.
In summary, the search for low-cost adsorbents derived from renewable resources is gaining importance due to the high costs associated with adsorbents used in dye remediation and stringent environmental regulations. Using industrial waste from the nutraceutical sector as a source of new adsorbents offers significant advantages, including high availability, low cost, and renewability. Stringent regulations, increasing pollution from the textile industry, and the high cost of activated charcoal have led to renewed interest in Nutraceutical Industrial Spent as a readily available, low-cost biomass that can serve as a superior alternative to biosorbents made from agricultural waste currently on the market. NIPSS is a highly effective adsorbent, reduces the E-factor, minimizes grey water footprints, and enhances water sustainability for the paper industry sector.
CRediT authorship contribution statement
Razia Sulthana: Writing – review & editing, Writing – original draft, Methodology, Investigation, Funding acquisition, Formal analysis, Data curation, Conceptualization. Syed Noeman Taqui: Writing – review & editing, Writing – original draft, Methodology, Investigation, Data curation, Conceptualization. Rayees Afzal Mir: Writing – original draft, Visualization, Validation, Software, Investigation, Data curation, Conceptualization. Akheel Ahmed Syed: Writing – review & editing, Visualization, Validation, Software, Resources, Project administration. M.A. Mujtaba: Writing – review & editing, Writing – original draft, Validation, Software, Resources, Conceptualization. Mohammed Huzaifa Mulla: Writing – review & editing, Writing – original draft, Supervision, Resources, Formal analysis, Data curation. Laxmikant D. Jathar: Writing – review & editing, Visualization, Validation, Resources, Investigation, Funding acquisition, Data curation. Reji Kumar Rajamony: Writing – original draft, Visualization, Supervision, Resources, Formal analysis, Conceptualization. Yasser Fouad: Writing – original draft, Visualization, Project administration, Methodology, Data curation. Sagar Shelare: Writing – original draft, Visualization, Validation, Supervision, Project administration, Methodology, Investigation. Muhammad Mahmood Ali: Writing – review & editing, Writing – original draft, Visualization, Validation, Supervision, Conceptualization. Muhammad Nasir Bashir: Writing – review & editing, Writing – original draft, Visualization, Validation, Supervision, Conceptualization.
Acknowledgement
The authors thank the Researchers Supporting Project number (RSPD2025R698), King Saud University, Riyadh, Saudi Arabia, for funding this research.
Declaration of competing interest
The authors declare that they have no known competing financial interests or personal relationships that could have appeared to influence the work reported in this paper.
References
- Adsorption studies of hazardous malachite green onto treated ginger waste. J. Environ. Manage.. 2010;91(4):1032-1038.
- [Google Scholar]
- Adsorption kinetics and thermodynamics of an anionic dye onto sepiolite. Micropor. Mesopor. Mater.. 2007;101(3):388-396.
- [Google Scholar]
- Adsorption characteristics of the dye, Brilliant Green, on Neem leaf powder. Dyes Pigm.. 2003;57(3):211-222.
- [Google Scholar]
- The exchange adsorption of ions from aqueous solutions by organic zeolites. II. kinetics. J. Am. Chem. Soc.. 1947;69(11):2836-2848.
- [Google Scholar]
- Microporous and heterogeneous surface adsorption isotherms arising from Levy distributions. Phys. A. 2005;349(1):271-282.
- [Google Scholar]
- Removal of brilliant green dye from aqueous solutions using home made activated carbons. Clean-Soil, Air, Water. 2010;38(56):521-532.
- [Google Scholar]
- Effective adsorption of toxic brilliant green from aqueous solution using peat of Brunei Darussalam: isotherms, thermodynamics, kinetics and regeneration studies. RSC Adv.. 2015;5(44):34603-34615.
- [Google Scholar]
- Chitosan coated cotton-straw-biochar as an admirable adsorbent for reactive red dye. Results Eng.. 2022;15:100515
- [Google Scholar]
- Chitosan/graphite/polyvinyl alcohol magnetic hydrogel microspheres for decontamination of reactive orange 16 dye. Water. 2022;14(21):3411.
- [Google Scholar]
- Adsorption of brilliant green dye onto a mercerized biosorbent: kinetic, thermodynamic, and molecular docking studies. Molecules. 2023;28(10):4129.
- [Google Scholar]
- Sustainable production and consumption of paper and paper products in Nigeria: a review. Resources. 2019;8(1):53.
- [Google Scholar]
- A novel acorn based adsorbent for the removal of brilliant green. Desalination. 2011;281:226-233.
- [Google Scholar]
- Sequential modifications of chitosan biopolymer for enhanced confiscation of Cr (VI) Inorg. Chem. Commun.. 2022;145:110009
- [Google Scholar]
- Removal of brilliant green dye from water using Ficus benghalensis tree leaves as an efficient biosorbent. Materials. 2023;16(2):521.
- [Google Scholar]
- Malachite green adsorption by rattan sawdust: Isotherm, kinetic and mechanism modeling. J. Hazard. Mater.. 2008;159(2–3):574-579.
- [Google Scholar]
- The removal of methyl red from aqueous solutions using banana pseudostem fibers. Am. J. Appl. Sci.. 2009;6(9):1690.
- [Google Scholar]
- Indian Institute of Spices Research, Kozhikode, Black pepper, Extension pamphlet, 2015. Jovanović, D. S. (1969). Physical adsorption of gases. Kolloid-Zeitschrift und Zeitschrift für Polymere, 235(1), 1203-1213.
- Physical adsorption of gases. Kolloid-Zeitschrift Und Zeitschrift Für Polymere. 1969;235(1):1214-1225.
- [Google Scholar]
- Batch wise sorptive amputation of diamond green dye from aqueous medium by novel Polyaniline-Alstonia scholaris leaves composite in ecofriendly way. J. Clean. Prod.. 2018;196:350-357.
- [Google Scholar]
- Adsorption characteristics of the hazardous dye Brilliant Green on Saklıkent mud. Chem. Eng. J.. 2011;172(1):199-206.
- [Google Scholar]
- Novel mesoporous chitosan-zirconia-ferrosoferric oxide as magnetic composite for defluoridation of water. J. Environ. Chem. Eng.. 2020;8(5):104360
- [Google Scholar]
- Adsorption of brilliant green by surfactant doped polyaniline/MWCNTs composite: evaluation of the kinetic, thermodynamic, and isotherm. Ind. Eng. Chem. Res.. 2014;53(17):7167-7175.
- [Google Scholar]
- About the theory of so-called adsorption of soluble substances. Kungliga Svenska Vetenskapsakademiens Handlingar. 1898;24:1-39.
- [Google Scholar]
- The effect of low cost material bagasse fly ash to the removal of COD contributing component of combined waste water of sugar industry. Arch. Appl. Sci. Res.. 2012;4(2):852-857.
- [Google Scholar]
- Optimization of brilliant green biosorption by native and acid-activated watermelon rind as low-cost adsorbent. Desalin. Water Treat.. 2015;54(1):235-244.
- [Google Scholar]
- The constitution and fundamental properties of solids and liquids. J. Am. Chem. Soc.. 1916;38(11):2221-2295.
- [Google Scholar]
- Studies on the adsorption of Brilliant Green dye from aqueous solution onto low-cost NaOH treated saw dust. Desalination. 2011;273(2–3):321-329.
- [Google Scholar]
- Use of bagasse fly ash as an adsorbent for the removal of brilliant green dye from aqueous solution. Dyes Pigm.. 2007;73(3):269-278.
- [Google Scholar]
- Kinetic and equilibrium isotherm studies for the adsorptive removal of Brilliant Green dye from aqueous solution by rice husk ash. J. Environ. Manage.. 2007;84(4):390-400.
- [Google Scholar]
- Chitosan-biopolymer-entrapped activated charcoal for adsorption of reactive orange dye from aqueous phase and CO2 from gaseous phase. J. Compos. Sci.. 2023;7(3):103.
- [Google Scholar]
- Adsorption characteristics of brilliant green dye on kaolin. J. Hazard. Mater.. 2009;161(1):387-395.
- [Google Scholar]
- Desorption-and decomposition-based techniques for the regeneration of activated carbon. Chem. Eng. Technol.. 2014;37(9):1447-1459.
- [Google Scholar]
- Biosorption of dye from textile wastewater effluent onto alkali treated dried sunflower seed hull and design of a batch adsorber. J. Environ. Chem. Eng.. 2015;3(4):2647-2661.
- [Google Scholar]
- Studies on coconut shell powder and crysnanoclay incorporated acrylonitrile butadiene rubber/styrene butadiene rubber (NBR/SBR) green nanocomposites. Polym. Compos.. 2017;38(4):727-735.
- [Google Scholar]
- Isothermal modeling of batch biosorption of Brilliant Green dye from water by chemically modified Eugenia jambolana leaves. J. Chem. Soc. Pak.. 2012;34(1):136-143.
- [Google Scholar]
- Use of agro-waste Musa acuminata and Solanum tuberosum peels for economical sorptive removal of emerald green dye in ecofriendly way. J. Clean. Prod.. 2019;206:819-826.
- [Google Scholar]
- Adsorption of brilliant green dye by polyaniline/silver nanocomposite: kinetic, equilibrium, and thermodynamic studies. Eur. Polym. J.. 2016;75:577-590.
- [Google Scholar]
- Sawasdee S., Watcharabundit, P. Effect of Temperature on Brilliant Green Adsorption by Shrimp Shell: Equilibrium and Kinetics.
- Adsorptive removal of As (III) by cellulose-Sn (IV) biocomposite. J. Compos. Sci.. 2023;7(1):19.
- [Google Scholar]
- Optimisation of brilliant green dye removal efficiency by electrocoagulation using artificial neural networking and comparison with response surface methodology. Int. J. Eng. Sci. 2017
- [Google Scholar]
- Combined form of Langmuir and Freundlich equations. J. Phys. Chem.. 1948;16(429):490-495.
- [Google Scholar]
- Development of iron oxide/zeo-NaX nano photocatalyst from coal fly ash and its activity assessment by methylene blue dye degradation. Int. Res. J. Nat. Appl. Sci. 2015;2(2):114-128.
- [Google Scholar]
- Synthesis, characterization and photocatalytic study of cerium oxide/zeolite-NaX catalyst with brilliant green dye degradation. J. Adv. Chem. Sci. 2015:117-120.
- [Google Scholar]
- Biosorption of crystal violet by nutraceutical industrial fennel seed spent equilibrium, kinetics, and thermodynamic studies. Biocatal. Agric. Biotechnol.. 2022;43:102402
- [Google Scholar]
- Adsorption of Acid Blue 113 from aqueous solution onto nutraceutical industrial coriander seed spent: Isotherm, kinetics, thermodynamics and modeling studies. Desalin. Water Treat.. 2019;153:321-337.
- [Google Scholar]
- A novel sustainable design to develop polypropylene and unsaturated polyester resin polymer composites from waste of major polluting industries and investigation on their physicomechanical and wear properties. Polym. Compos.. 2019;40(3):1142-1157.
- [Google Scholar]
- Sustainable adsorption method for the remediation of crystal violet dye using nutraceutical industrial fenugreek seed spent. Appl. Sci.. 2021;11(16):7635.
- [Google Scholar]
- Bioremediation of textile industrial effluents using nutraceutical industrial spent: laboratory-scale demonstration of circular economy. Nanomaterials. 2022;12(10):1684.
- [Google Scholar]
- Degradation of brilliant green dye using cavitation based hybrid techniques. Int. J. Adv. Eng. Technol.. 2013;31:36.
- [Google Scholar]
- State equation of the solid-gas interface layers. Acta Chim. Hung.. 1971;69:311-328.
- [Google Scholar]
- Study on thermodynamics and kinetics of adsorption of p-toluidine from aqueous solution by hypercrosslinked polymeric adsorbents. Environ. Chem.. 2004;23(2):188-192.
- [Google Scholar]
- Pore and solid diffusion models for fixed-bed adsorbers. Am Inst Chem Eng J. 1974;20:228-238.
- [Google Scholar]


