

Translate this page into:
A comparison study of adsorptive transfer voltammetry and solution phase voltammetry for the determination of caffeic acid
⁎Corresponding author. maslanoglu@harran.edu.tr (Mehmet Aslanoglu)
-
Received: ,
Accepted: ,
This article was originally published by Elsevier and was migrated to Scientific Scholar after the change of Publisher.
Peer review under responsibility of King Saud University.
Abstract
This study reports a comparison of adsorptive transfer and solution phase voltammetric methods for the study of caffeic acid. For this purpose, a platform was prepared by the modification of glassy carbon electrodes (GCEs) with MWCNTs and samarium nanoparticles (SmNPs) by means of an ultrasonic bath. The surface morphology of the platform was characterized using SEM, EDX and XRD. The adsorptive transfer voltammetric method was based on the adsorption of caffeic acid (CFA) at the surface of the modified electrode by keeping it into a solution of CFA. Afterwards, the modified electrode was transferred with the adsorbed species in a cell containing only 0.1 mol L−1 phosphate buffer solution (PBS) for the analysis. The current response of CFA was found to be linear over a concentration from 5.0 × 10⁻¹⁰ mol L−1 to 1.0 × 10⁻⁷ mol L−1. The values of the limit of detection (LOD) and limit of quantification (LOQ) were 2.0 × 10⁻¹⁰ mol L−1 and 6.67 × 10⁻¹⁰ mol L−1, respectively. The adsorptive transfer method using the modified electrode (SmNPs/MWCNTs/GCE) has successfully been applied to food samples for determining CFA. The solution phase voltammetry was carried out by dipping the electrode into a voltammetric cell containing CFA. The plot of peak currents was linear over the concentration range of 5.0 × 10⁻⁹ mol L−1 –8.0 × 10⁻⁸ mol L−1. The values of LOD and LOQ were 2.0 × 10⁻⁹ mol L−1 and 6.67 × 10⁻⁹ mol L−1 for CFA using a classical solution phase voltammetry at the proposed platform. It was shown that the LOD obtained at adsorptive transfer voltammetry was 10-fold lower when compared to classical solution phase voltammetry.
Keywords
Adsorptive transfer
Solution phase
Caffeic acid
Food samples
Samarium nanoparticles

1 Introduction
Caffeic acid (CFA), a phenolic compound, is naturally present in spices, herbs and seeds. It serves as an antioxidant and available in drinks and other food samples including wine, tea, coffee, olive oil (Sun et al., 2018). CFA has also antioxidant, anti-inflammatory, antibacterial, anticarcinogenic and immunomodulatory properties (Aguilar-Hernández et al., 2017; Manikandan et al., 2018). More recently, a comprehensive study has revealed that CFA could block HIV replication with moderate anti-HIV activity in cell cultures (Sonar et al., 2017). Thus, a sensitive determination of CFA is of importance for analytical and therapeutic interests as well as safety and quality of food samples. Recently, a number of methods including capillary electrophoresis, spectrophotometry and chromatography were appeared for the determination of CFA herbs and wine samples (Wang et al., 2004; Aguilar-Hernández et al., 2017; Şanli et al., 2016). However, these methods suffer from a number of disadvantages including time consuming steps for derivatization or extraction steps. However, voltammetric techniques enable rapid analysis on food samples with high precision and accuracy (Bianchini et al., 2014; Liu et al., 2016a; Zhang et al., 2013; Chen et al., 2019; Filik et al., 2013; Gao et al., 2018). Voltammetric behavior of CFA has been reported and its mechanism has been studied (Robledo et al., 2016; Trabelsi et al., 2004; Karabozhikova and Tsakova, 2019). Different electrochemical methods have been developed for the determination of CFA in in wine, tea, coffee, olive oil, juice, plants and pharmaceuticals (Ciepiela et al., 2016; Vilian et al., 2014; Fernandez et al., 2018; Velmurugan, 2017; Tyszczuk et al., 2011; Li et al., 2017). Various electrode materials such as carbon nanotubes, r-GO, graphite, carbon black, polymers, chitosan, graphene and metallic nanoparticles were utilized for the determination of CFA (Shi et al., 2018; Titretir Duran et al., 2017; David et al., 2015; Thangavelu et al., 2017; Jing et al., 2017; Sakthinathan et al., 2017; Pandian et al., 2019; Zhao et al., 2019; Karabiberoğlu et al., 2013; Liu et al., 2016b). However, previous studies revealed that the electrochemical platforms based on carbon nanotubes and metallic/metallic oxide nanoparticles exhibited excellent reproducibility and low detection limits for various species in electroanalysis (Wang et al., 2016; Messaoud et al., 2017). For instance, Guo et al. have presented a voltammetric procedure based on gold nanoparticles and multi-walled carbon nanotubes as an enhanced material for the sensitive detection of tryptophan and a nano-molar level of detection was reported (Guo et al., 2010). A modified electrode constructed with carbon nanotubes and zinc oxide has appeared in the literature for the sensitive detection of citalopram (Ghaedi et al., 2016). Sunder and co-workers have also developed an electrochemical method based on graphene oxide/yttrium oxide modified glassy carbon electrode for the selective determination of L-DOPA (Sunder et al., 2019). In addition, it has been reported that samarium oxide exhibited excellent catalytic activity and high conductivity (Gao et al., 2002; Constantinescu et al., 2012). Samarium nanoparticles also provide thermal and chemical stability, as well as considerable surface area when used in composite electrodes (Dezfuli et al., 2017). In this study, a voltammetric sensing platform based on modifying glassy carbon electrodes (GCEs) with multi-walled carbon nanotubes (MWCNTs) and samarium nanoparticles (SmNPs) was prepared using an ultrasonic bath. Then, the proposed platform (SmNPs/MWCNTs/GCE) was utilized for a comparison of adsorptive transfer voltammetric method and classical solution phase voltammetry for the study of CFA. The adsorptive transfer voltammetric method was successfully applied for the determination of CFA in various food samples such as coffee, tea and herbals.
2 Experimental
2.1 Chemicals
Caffeic acid (CFA), uric acid (UA), ascorbic acid (AA), paracetamol (PAR) and tryptophan (TRP) were all purchased from Sigma-Aldrich Chemical Company (Germany). Multi-walled carbon nanotubes and samarium oxide powder (15–45 nm) were obtained from US-Nano Materials Company (USA). Acetone, ethanol, chloroform, nitric acid, perchloric acid, disodium hydrogen phosphate and potassium dihydrogen phosphate obtained from Merck (Germany) were of analytical grade. Samples of clove buds, cinnamon, ginger, turmeric, Turkish coffee, Turkish black tea, Turkish green tea and rosehip were purchased from a local store. Caffeic acid tablets were kindly obtained from a local herbal product and vitamins shop. Stock solutions of CFA, UA, TRP, PAR and AA were prepared using 0.1 mol L−1 phosphate buffer solution (PBS). Ultrapure water was used for the preparation of phosphate buffer. Oxygen-free nitrogen was bubbled through the voltammetric cell prior to each measurement.
2.2 Instrumentation
Voltammetry was performed using an Ecochemie Autolab PGSTAT-12 potentiostat/galvanostat (Netherlands). Glassy carbon electrodes (GCEs) with 3 mm in diameter (Bioanalytical Systems, USA) served as working electrodes. Ag/AgCl in 3 mol L−1 KCl was used as a reference electrode while a Pt rod served as auxiliary electrode in voltammetric measurements. Both reference and counter electrodes were purchased from Metrohm (Switzerland). A Metrohm brand pH meter was utilized for pH measurements. Images of scanning electron microscopy (SEM) and the spectrum of energy dispersive X-ray analysis (EDX) were performed on Zeiss EVO 50 Research Grade Variable Pressure Scanning Electron Microscope (USA). The pattern of X-ray diffraction (XRD) was recorded on Rigaku Ultima III X-ray Diffractometer (USA).
2.3 SmNPs/MWCNTs/GCE platform preparation
Glassy carbon electrodes (GCEs) were polished on a pad with 1 µm and 0.3 µm alumina powders. Then, the GCEs were subjected to sonication for 5 min in ethanol and then rinsed with ultra-pure water. The GCEs were then activated in a voltammetric cell containing 0.1 mol L−1 PBS in a large potential window at a scan rate of 100 mV/s by cyclic voltammetry (CV). MWCNTs were subjected to sonication in a mixture of 7:3 ratio (v/v) of HNO3 and HClO4 for 5 h. 5 mg MWCNTs and 1 mg Sm were weighed and placed in a flask containing 10 mL chloroform and kept under sonicaation for 45 min. Finally, 5 µL of suspension of SmNPs/MWCNTs was pipetted and then placed on GCE surface. Then, the modified electrode was dried under pure nitrogen gas. The proposed platform was denoted as SmNPs/MWCNTs/GCE and washed with ultra-pure water before use. The modified electrode (SmNPs/MWCNTs/GCE) was then subjected to activation by CV in an electrochemical cell at a potential range from −0.4 to +1.0 V at a scan rate of 100 mV/s. The preparation of SmNPs/MWCNTs/GCE and the measurement have been illustrated in Scheme 1.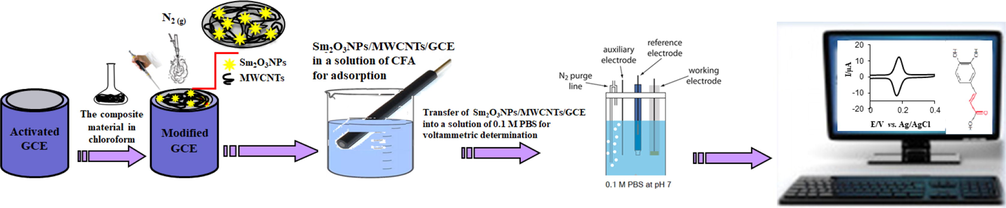
A schematic preparation of the platform and the study of caffeic acid.
2.4 Optimization of adsorption time
Voltammetry of CFA exhibited that an optimal ratio of 5:1 of the mixture of multi-walled carbon nanotubes and SmNPs was appropriate for determining CFA with the lowest peak potential separation (Fig. 1A). In addition, the results showed that 5 µL of composite suspension was appropriate to improve the response for CFA (Fig. 1B). The highest current response with good precision was obtained using 5 µL of composite suspension. A plot of peak current versus time for the adsorption of 2.0 × 10⁻⁸ mol L−1 CFA at the proposed platform is given in Fig. 1C. It was concluded that the adsorption was completed after 10 min of dipping the proposed platform into a solution containing CFA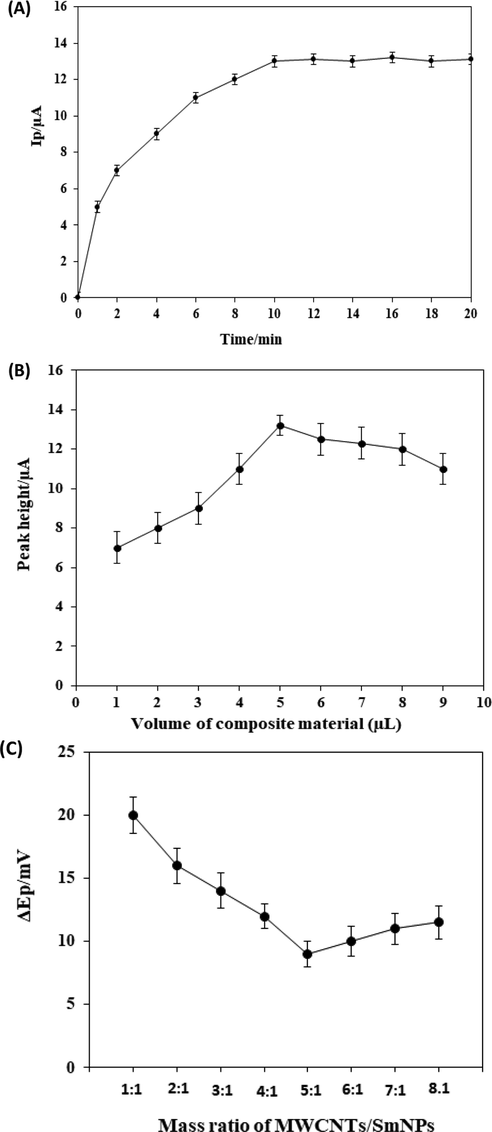
A plot of peak currents versus adsorption time for 2.0 × 10⁻⁸ mol L−1 CFA (A). A plot of peak current versus the volume of composite material for the adsorption of 2.0 × 10⁻⁸ mol L−1 CFA (B). A plot of the separation in the peak potential versus the mass ratio for the adsorption of 2.0 × 10⁻⁸ mol L−1 CFA (C).
2.5 Voltammetric measurements
The proposed platform (SmNPs/MWCNTs/GCE) was placed in an electrochemical cell containing 0.1 mol L−1 PBS at pH 7.0 for the activation of its surface by cyclic voltammetry. In adsorptive transfer voltammetric method, CFA was adsorbed at modified electrode after keeping it into a solution of CFA for 10 min. Afterwards, electrodes were washed with ultrapure water and transferred in a voltammetric cell containing only a buffer solution for the voltammetric analysis. Cyclic voltammograms were obtained at GCE, MWCNTs/GCE and SmNPs/MWCNTs/GCE for a comparison. The mechanism of CFA at SmNPs/MWCNTs/GCE was obtained using cyclic voltammetry at various scan rates. Voltammetry was performed in buffer solutions at various pH values to determine the number of proton transferred in the electrode reaction of CFA. Square wave voltammetry was then performed to obtain the linear current-concentration equation for CFA. Prior to the voltammetric analysis, CFA was extracted from food samples. Solution phase voltammetry was carried out by dipping the modified electrode into an electrochemical cell containing CFA.
2.6 Sample preparation
Prior to the voltammetric analysis, CFA was extracted from food samples such as clove buds, cinnamon, ginger, turmeric, Turkish coffee, Turkish black tea, Turkish green tea and rosehip. For this purpose, 0.5 g of each sample was weighed and then placed into a flask and diluted with methanol. Then, it was diluted with 0.1 mol L−1 PBS at pH 7.0, the adjustment of pH was carried out using HCl or NaOH. Afterwards, it was sonicated in an ultrasonic bath for 10 min followed by stirring for over 2 h. Then, each sample was filtered to remove any solid. Then, a known volume of the supernatant was added to a beaker containing 50 mL of 0.1 mol L−1 PBS at pH 7.0. The modified electrode was then kept in a solution of the food sample for 10 mins. Afterwards, the modified electrode was rinsed with water and transferred into a voltammetric cell containing 0.1 mol L−1 PBS at pH 7.0, and then the voltammetric analysis was performed. Then, standard addition method was applied for the recovery of CFA in each food sample. Also, five caffeic acid tablets (each containing 300 mg CFA) were weighed and crushed in a mortar. Then, an appropriate amount was dissolved in a 25 mL of 0.1 mol L−1 PBS at pH 7.0. Afterwards, an appropriate volume of supernatant was transferred into a beaker containing 50 mL of 0.1 mol L−1 PBS at pH 7.0. Then, the analysis was performed for the determination of CFA in tablets.
3 Results and discussion
3.1 Characterization of platform material
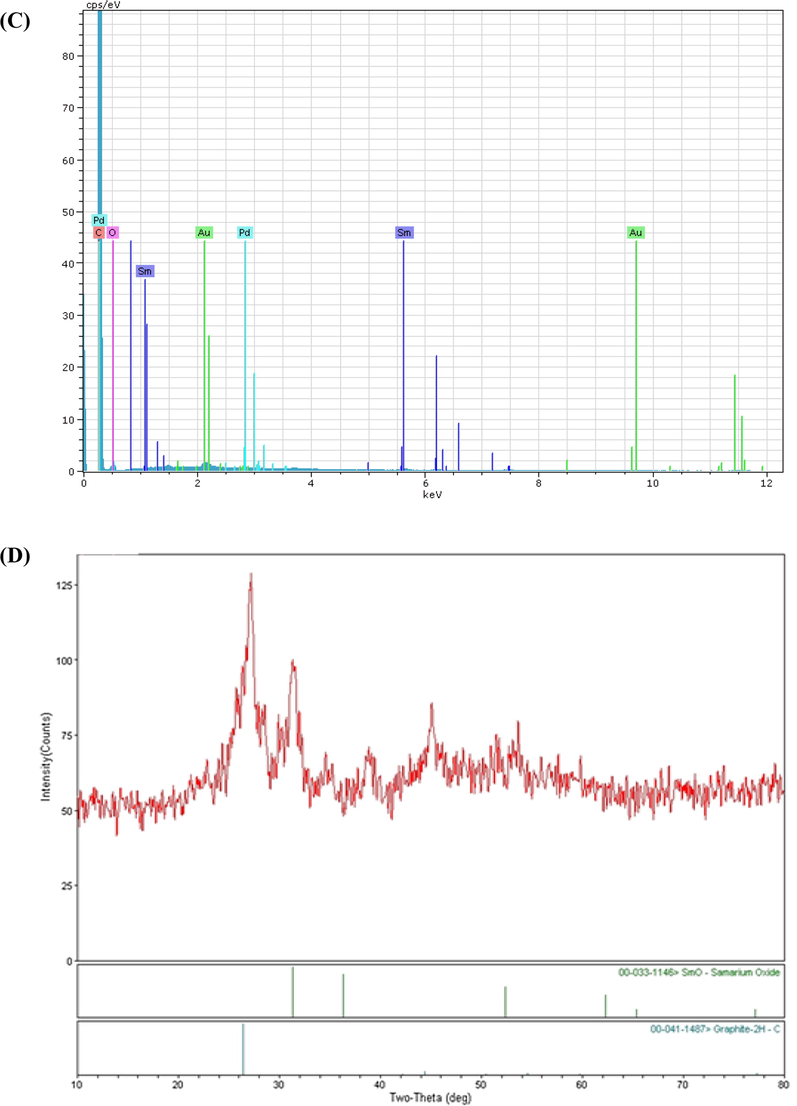
The characterization of SmNPs/MWCNTs was performed by scanning electron microscopy (SEM). Fig. 2A exhibits an image for SmNPs/MWCNTs. Data revealed the dispersion of Sm nanoparticles on MWCNTs. The energy dispersive X-ray analysis (EDX) is given in Fig. 2B. The data showed that Sm, C, Au and Pd were exhibited in a spectrum of EDX. Au and Pd were appeared due to the gold coating before the SEM measurements. The XRD spectrum of the electrode material was presented in Fig. 2C. The peak exhibited at 26° is due to the hexagonal structure of MWCNTs. However, the other peaks located at 2θ = 32°, 36°, 52° and 62° can be assigned to samarium.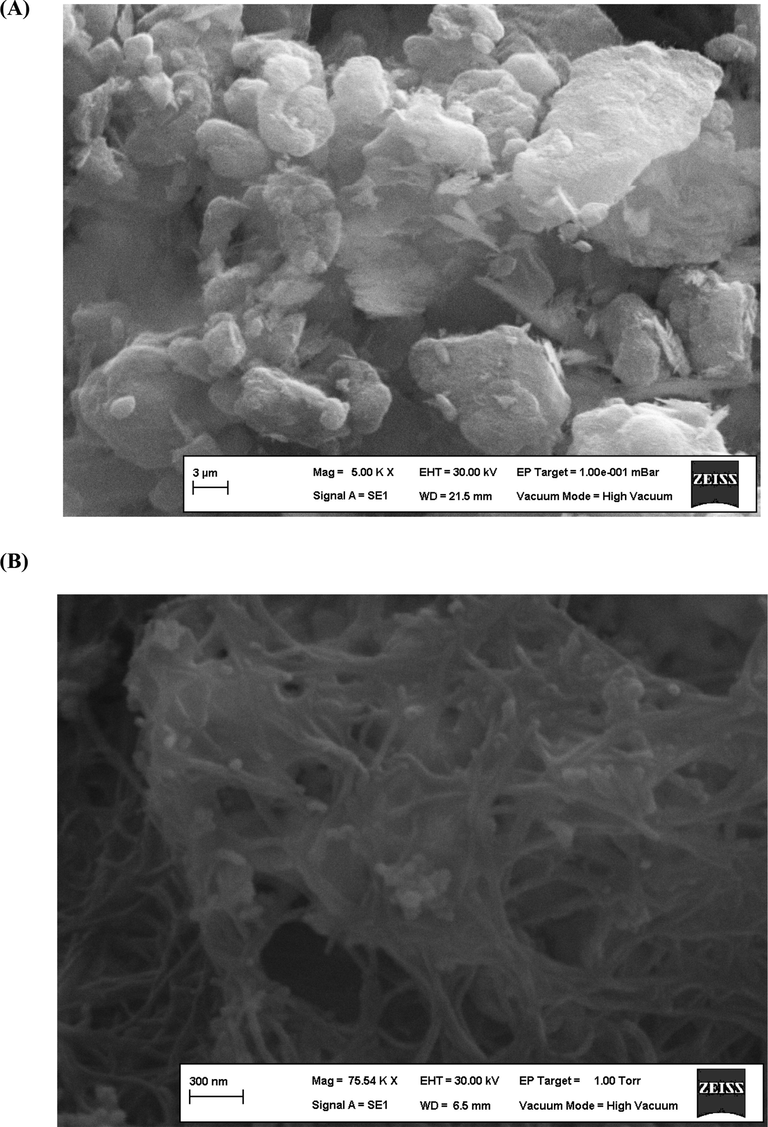
The SEM image (A), EDX spectrum (B) and the XRD pattern (C) of SmNPs/MWCNTs.
The SEM image (A), EDX spectrum (B) and the XRD pattern (C) of SmNPs/MWCNTs.
3.2 Voltammetric behaviour of caffeic acid
Typical background cyclic voltammograms of unmodified GCE (a), GCE modified with MWCNTs (b) and GCE modified with a composite of SmNPs/MWCNTs (c) in 0.1 mol L−1 PBS at pH 7.0 are presented in Fig. 3A. No peaks are observed in the absence of CFA. However, adsorptive transfer cyclic voltammetry was performed to examine the electrode behaviour of CFA at different electrodes. Firstly, CFA was adsorbed at modified electrode surface by keeping the electrode into a solution of CFA for 10 min. Then, the modified electrode was washed with ultra-pure water and transferred with the adsorbed species in a voltammetric cell containing 0.1 mol L−1 PBS at pH 7.0, and then the voltammetry was performed in this medium. Cyclic voltammograms of CFA at GCE (a), MWCNTs/GCE (b) and SmNPs/MWCNTs/GCE (c) are given in Fig. 3B. As shown, no peaks were appeared at unmodified GCE (voltammogram a). Meanwhile, MWCNTs/GCE exhibited an oxidation peak at 0.186 V and a reduction peak at 0.173 V. ΔEp was about 13 mV for CFA at MWCNTs/GCE as given in Fig. 3B (voltammogram b). The SmNPs/MWCNTs/GCE system exhibited a sharp, an improved and a well-defined oxidation peak at 0.174 V and a reduction peak at 0.165 V with an ΔEp of 9 mV for the two electron process of the redox couple of CFA as shown in Fig. 3B (voltammogram c). The ratio of anodic and cathodic peak currents was close to 1 for the redox process of CFA. In addition, the peak separation was decreased to 9 mV at the surface of SmNPs/MWCNTs/GCE. The observation of the decrease in ΔEp at SmNPs/MWCNTs/GCE system was an evidence of the acceleration of the redox process. The voltammetric platform has also enhanced current response of CFA in comparison with MWCNTs/GCE. Experimental results showed that the SmNPs/MWCNTs/GCE system was more appropriate for the voltammetric studies of CFA as the proposed platform exhibited decreased overpotential, good catalytic effect, large current response and the decrease in ΔEp for CFA. The increase in current intensities is probably related to the increase of the electroactive area of the electrode promoted by samarium nanoparticles.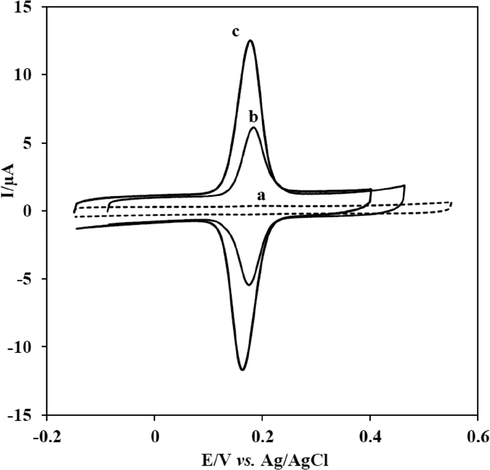
(A) Cyclic voltammograms of 1.0 × 10⁻⁸ mol L−1 CFA at bare GCE (a), MWCNTs/GCE (b) and SmNPs/MWCNTs/GCE (c) in 0.1 M PBS at pH 7.0. Scan rate: 50 mV/s.
Various scan rates were applied to the cyclic voltammetry of CFA to acquire the possible electrode mechanism (Fig. 4). The peak current was linear with scan rates over a range from 25 to 200 mV/s. This behaviour indicated that the electrode process of CFA at the SmNPs/MWCNTs/GCE system was surface-controlled. In addition, the ratio of peak currents was maintained and no shifts were observed in anodic and cathodic peak potentials of CFA with increasing scan rates. Thus, the separation in peak potentials of CFA was constant at increasing scan rates. This indicated a reversible redox behaviour for the electrode process of CFA using the adsorptive transfer voltammetry at the proposed platform (Elgrishi et al., 2018). In addition, cyclic voltammograms of CFA at various scan rates using a classical voltammetric method are presented in Fig. 4B. As clearly seen that peak potentials are shifted with increase in scan rate and consequently ΔEp increases. This shows that the reversibility of CFA is not maintained using a classical voltammetric method at the proposed electrode. The adsorptive transfer voltammetric procedure was also performed for the investigation of the influence of solution pH on Ep of 1.0 × 10⁻⁸ mol L−1 CFA. The voltammograms at different pH values are given in Fig. 5A. The shifts in peak potentials with the change in pH clearly indicate that a number of protons are transferred accompanying electrons. The slope of the plot of Ep versus pH was −61.8 mV pH−1 indicated that the ratio of the number of protons and the number of electrons was 1:1 in the process of CFA. These results reveal that the reaction of CFA undergoes with two protons as two electrons are transferred in the electrode process as shown in Scheme 2 (Gao et al., 2018).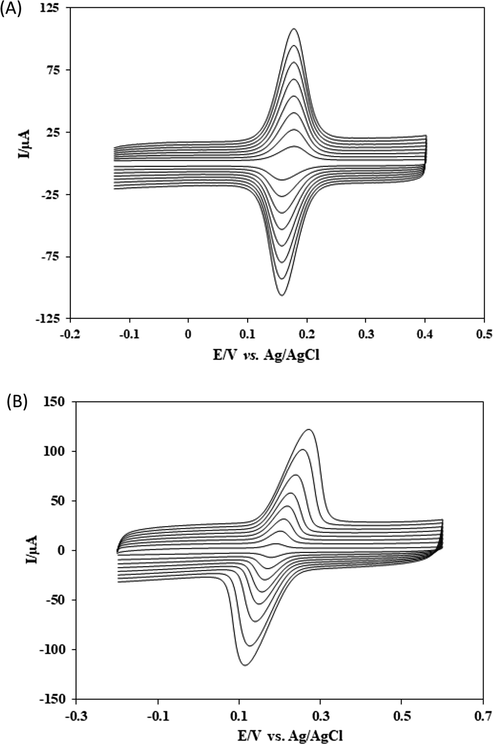
(A) Cyclic voltommograms of 1.0 × 10⁻⁸ mol L−1 CFA at SmNPs/MWCNTs/GCE in 0.1 mol L−1 PBS at pH 7.0. Scan rates increasing from 25 mV/s to 200 mV/s. (B) Classical solution phase cyclic voltommograms of 1.0 × 10⁻⁸ mol L−1 CFA at SmNPs/MWCNTs/GCE in 0.1 mol L−1 PBS at pH 7.0. Scan rates increasing from 25 mV/s to 200 mV/s.
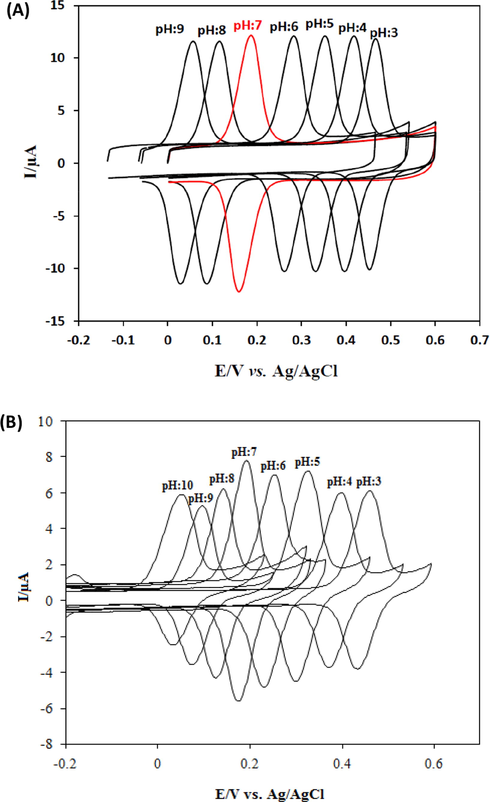
(A) CVs of 1.0 × 10⁻⁸ mol L−1 CFA at SmNPs/MWCNTs/GCE in 0.1 mol L−1 PBS at various pH values. Scan rate: 50 mV/s. (E) A plot of anodic peak potentials of CFA vs pH. (F) Cyclic voltammograms of 1.0 × 10⁻⁸ mol L−1 CFA at various pH values using the classical solution phase voltammetry. Scan rate: 50 mV/s.
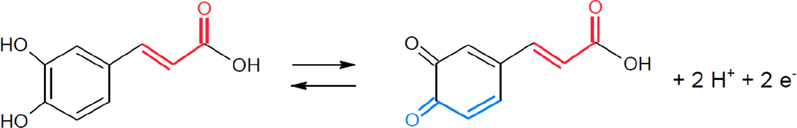
Possible electron transfer reaction at the proposed platform.
In addition, cyclic voltammograms of 1.0 × 10⁻⁸ mol L−1 CFA at various pH values using the classical solution phase voltammetry are given in Fig. 5B. A slope was −62.1 mV pH−1 was obtained in classical solution phase voltammetry. Different current values were obtained using the classical solution phase voltammetry for the pH studies of CFA when compared to the current response obtained by the adsorptive transfer voltammetry.
3.3 Determination of caffeic acid
The adsorptive transfer voltammetry at the SmNPs/MWCNTs/GCE system was performed to obtain a calibration plot for CFA. Square wave voltammograms of various concentrations of CFA are given in Fig. 6A. A plot of anodic currents versus concentrations was linear over the range of 5.0 × 10⁻¹⁰ mol L−1 –1.0 × 10⁻⁷ mol L−1 (Fig. 6B). A detection limit (LOD) of 2.0 × 10⁻¹⁰ mol L−1 was obtained. The detection limit was calculated based on 3Sb/m where Sb was the standard deviation of blank and m was the slope of Fig. 6B. The results yielded a linear equation of Ip(µA) = 1.0277C(nmol L−1) + 0.1328 with a correlation coefficient of 0.9990. A comparison of the proposed electrode with previously published electrodes in LOD point of view is presented in Table 1. The results yielded a limit of quantification (LOQ) of 6.67 × 10⁻¹⁰ mol L−1. The experimental results indicate that the adsorptive transfer voltammetry with the proposed electrode enables a lower detection limit and is well compared to the previously published results for the detection of CFA (Jing, 2017; Karikalan et al., 2017; Karthik et al., 2017; Sivasankar et al., 2018; Liu et al., 2016a; Karabiberoğlu et al., 2013; Tyszczuk et al., 2011; Zhang et al., 2013). The performance of the adsorptive transfer voltammetry was also compared with a classical solution phase voltammetry for the determination of CFA. Square wave voltammograms of various concentration of CFA using a classical solution phase voltammetry are given in Fig. 6C. The plot of peak currents was linear over the range of 5.0 × 10⁻⁹ mol L−1 –8.0 × 10⁻⁸ mol L−1 (Fig. 6D). The values of LOD and LOQ were 2.0 × 10⁻⁹ mol L−1 and 6.67 × 10⁻⁹ mol L−1 for CFA using a classical solution phase voltammetry at the proposed platform. The results clearly indicated that the performance of the proposed adsorptive transfer voltammetric method was excellent and much superior when compared to a classical solution phase voltammetry.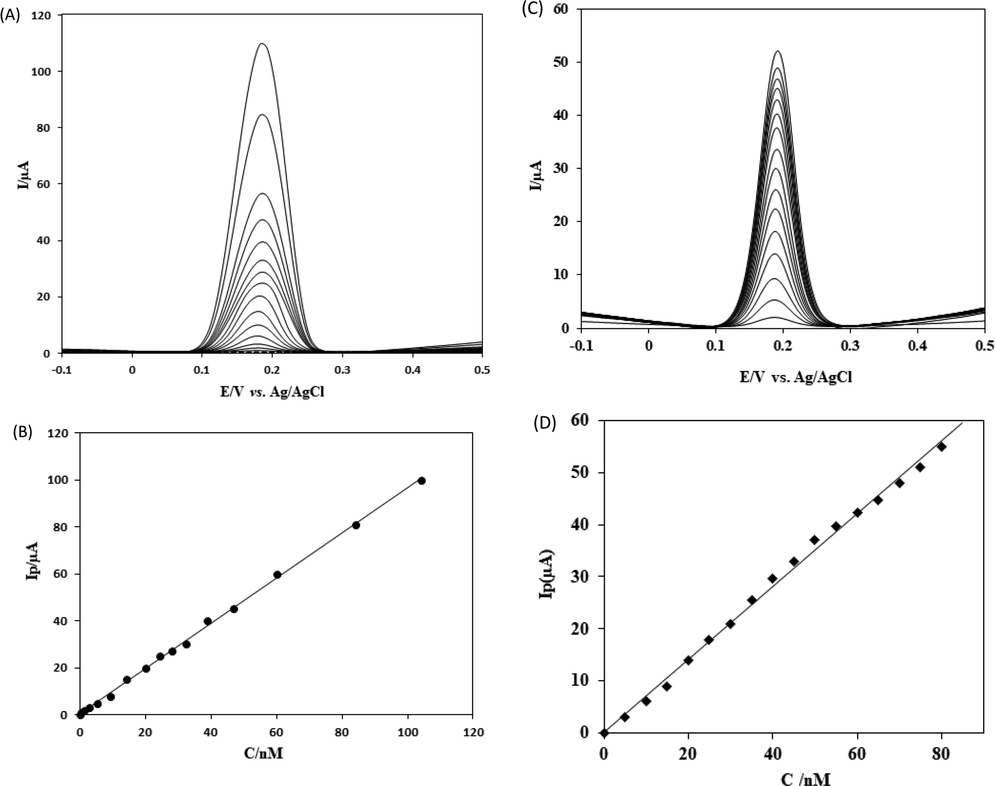
(A) Square wave voltammograms (SWVs) of various CFA concentrations at SmNPs/MWCNTs/GCE in 0.1 mol L−1 PBS at pH 7.0. Frequency: 20 Hz. Step potential: 5 mV. Amplitude: 20 mV. CFA concentrations: 0.0 mol L−1; 5.0 × 10⁻¹⁰ mol L−1; 1.0 × 10⁻⁹ mol L−1; 2.0 × 10⁻⁹ mol L−1; 3.0 × 10⁻⁹ mol L−1; 5.0 × 10⁻⁹ mol L−1; 9.0 × 10⁻⁹ mol L−1; 1.5 × 10⁻⁸ mol L−1; 2.0 × 10⁻⁸ mol L−1; 2.2 × 10⁻⁸ mol L−1; 2.7 × 10⁻⁸ mol L−1; 4.0 × 10⁻⁸ mol L−1; 4.5 × 10⁻⁸ mol L−1; 6.0 × 10⁻⁸ mol L−1; 8.0 × 10⁻⁸ mol L−1; 1.0 × 10⁻⁷ mol L−1. (B) A plot of peak currents against the concentrations of CFA. (C) Classical solution phase square wave voltammograms (SWVs) of various CFA concentrations at SmNPs/MWCNTs/GCE in 0.1 mol L−1 PBS at pH 7.0. Frequency: 20 Hz. Step potential: 5 mV. Amplitude: 20 mV. CFA concentrations: 0.0 mol L−1; 5.0 × 10⁻⁹ mol L−1; 1.0 × 10⁻⁸ mol L−1; 1.5 × 10⁻⁸ mol L−1; 2.0 × 10⁻⁸ mol L−1; 2.5 × 10⁻⁸ mol L−1; 3.0 × 10⁻⁸ mol L−1; 4.0 × 10⁻⁸ mol L−1; 4.5 × 10⁻⁸ mol L−1; 5.0 × 10⁻⁸ mol L−1; 5.5 × 10⁻⁸ mol L−1; 6.0 × 10⁻⁸ mol L−1; 6.5 × 10⁻⁸ mol L−1; 7.0 × 10⁻⁸ mol L−1; 7.5 × 10⁻⁸ mol L−1; 8.0 × 10⁻⁸ mol L−1. (D) A plot of peak currents against the concentrations of CFA using the solution phase voltammetry.
Electrode
Technique
Linear range (mol L−1)
Detection limit (mol L−1)
Reference
Pd-Au-PEDOT-graphene/GCE
DPV
1.0 × 10⁻⁹–5.5 × 10⁻⁷
3.7 × 10⁻¹⁰
(Liu et al., 2016a)
Ag-poly(thiophene)/GCE
DPV
1.0 × 10⁻⁸–4.3 × 10⁻⁶
5.3 × 10⁻⁹
(Karabiberoğlu et al., 2013)
Pd-film/GCE
SWV
1.0 × 10⁻⁸–5.0 × 10⁻⁷
4.0 × 10⁻⁹
(Tyszczuk et al., 2011)
g-C3N4/chitosan/GCE
DPV
5.5 × 10⁻⁶–1.6 × 10⁻⁴
1.9 × 10⁻⁶
(Jing et al., 2017)
SrV2O6/GCE
Amperometry
1.0 × 10⁻⁸–2.07 × 10⁻⁴
4.0 × 10⁻⁹
(Karthik et al., 2017)
HMGO/GCE
Amperometry
1.0 × 10⁻⁸–6.08 × 10⁻⁴
4.0 × 10⁻⁹
(Sivasankar et al., 2018)
Au-graphene/GCE
SWV
5.0 × 10⁻⁷–5.0 × 10⁻⁵
5.0 × 10⁻⁸
(Zhang et al., 2013)
NDC/GCE
DPV
1.0 × 10⁻⁸–3.5 × 10⁻⁴
2.4 × 10⁻⁹
(Karikalan et al., 2017)
SmNPs/MWCNTs/GCE
SWV
5.0 × 10⁻¹⁰–1.0 × 10⁻⁷
2.0 × 10⁻¹⁰
This work
3.4 Repeatability, stability and selectivity
Adsorptive transfer cyclic voltammetry was performed to study the repeatability of the proposed voltammetric platform. For this purpose, repetitive voltammograms of CFA were recorded (Fig. 7A). The results showed that the decrease in the current response of CFA was almost negligible. The results yielded a relative standard deviation (RSD) of 0.1% for the 10 repetitive runs for 5 nmol L−1 CFA indicated that the repeatability of the proposed adsorptive transfer voltammetric method with the proposed modified electrode was excellent. Cyclic voltammograms of repetitive runs for 5 nmol L−1 CFA using the classical voltammetric procedure are presented in Fig. 7B. The RSD was 5.6% for CFA using the classical method. This indicated that the repeatability of the proposed adsorptive transfer method is superior when compared to a classical voltammetric procedure. In addition, the RSD% of three different electrodes was only 4.2%. The results indicated that both reproducibility and repeatability was excellent for CFA using the adsorptive transfer voltammetry at SmNPs/MWCNTs/GCE.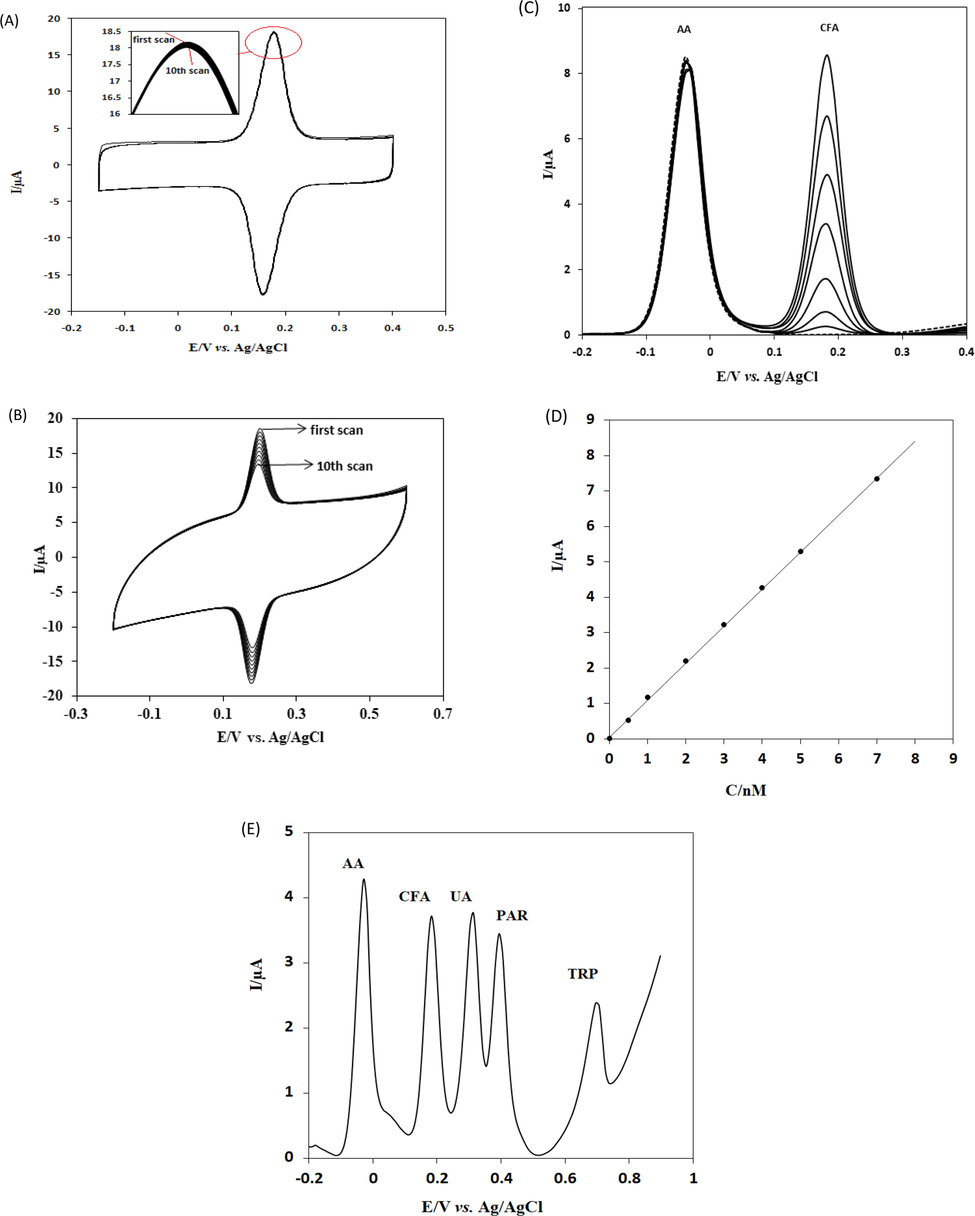
(A) Repetitive adsorptive transfer cyclic voltammograms of CFA. Scan rate: 100 mV/s. (B) Repetitive classical solution phase cyclic voltammograms of CFA. Scan rate: 100 mV/s. (C) SWVs of increasing concentrations of CFA in the presence of 2.0 × 10⁻⁵ mol L−1 AA at SmNPs/MWCNTs/GCE in 0.1 mol L−1 PBS at pH 7.0. CFA concentrations: 0.00 mol L−1; 5.0 × 10⁻¹⁰ mol L−1; 1.0 × 10⁻⁹ mol L−1; 2.0 × 10⁻⁹ mol L−1; 3.0 × 10⁻⁹ mol L−1; 4.0 × 10⁻⁹ mol L−1; 5.0 × 10⁻⁹ mol L−1; 7.0 × 10⁻⁹ mol L−1. Scan rate: 50 mV/s. (D) A plot of peak currents versus the concentration of CFA. (E) SWVs of 1.0 × 10⁻⁵ mol L−1 AA, 3.0 × 10⁻⁹ mol L−1 CFA 1.0 × 10⁻⁵ mol L−1 UA, 1.0 × 10⁻⁷ mol L−1 PAR and 1.0 × 10⁻⁶ mol L−1 TRP at SmNPs/MWCNTs/GCE in 0.1 mol L−1 PBS at pH 7.0. Frequency: 20 Hz, Step potential: 5 mV, Amplitude: 20 mV.
The stability of SmNPs/MWCNTs/GCE was examined in PBS for 15 days. The decrease of the response of CFA was less than 7–8%. Such a slight decrease in current response of CFA indicated good stability of SmNPs/MWCNTs/GCE by the adsorptive transfer voltammetric method. The results showed that citric acid, lactic acid and glucose had no remarkable influence on the behaviour and determination of CFA. This indicated that the selectivity of the adsorptive transfer voltammetric method at SmNPs/MWCNTs/GCE was excellent. Furthermore, square wave voltammograms of various concentrations of CFA in the presence of 2.0 × 10⁻⁵ mol L−1 ascorbic acid (AA) are shown in Fig. 7C. The results indicate no interference of AA on the electrode process of CFA at SmNPs/MWCNTs/GCE. A plot of peak currents versus the concentration of CFA in the presence of 2.0 × 10⁻⁵ mol L−1 AA is given in Fig. 7D. A linear equation of Ipa(µA) = 1.0442C(nmol L−1) + 0.063 (R2 = 0.9982) was obtained in the presence of AA. This shows that the slope of external calibration is similar to the slope obtained in the presence of AA. The values of LOD and LOQ were calculated as 1.97 × 10⁻¹⁰ mol L−1 and 6.6 × 10⁻¹⁰ mol L−1 for CFA in the presence of AA. Data indicated that the sensitive determination of CFA was also possible in the presence of AA. Also, a square wave voltammogram of the mixture of 1.0 × 10⁻⁵ mol L−1 AA, 3.0 × 10⁻⁹ mol L−1 CFA, 1.0 × 10⁻⁵ mol L−1 uric acid (UA), 1.0 × 10⁻⁷ mol L−1 paracetamol (PAR) and 1.0 × 10⁻⁶ mol L−1 tryptophan (TRP) is given in Fig. 7E. The modified electrode exhibited four well-defined anodic peaks at −0.03 V, 0.18 V, 0.31 V, 0.39 V and, 0.70 V for AA, CFA, UA, PAR and TRP respectively. In addition, Fig. 6D shows increasing concentrations of AA, CFA, UA, PAR and TRP using the proposed method. It is clear that different molar ratios of AA, UA, PAR and TRP have no influence on the determination of CFA. This clearly shows that the selectivity of proposed adsorptive transfer voltammetric method at SmNPs/MWCNTs/GCE is excellent and the procedure can be successfully applied for the determination of CFA in mixtures.
3.5 Determination of caffeic acid in food samples
The adsorptive transfer voltammetry at SmNPs/MWCNTs/GCE was performed for the determination of CFA in several food samples such as clove buds, cinnamon, ginger, turmeric, Turkish coffee, Turkish black tea, Turkish green tea and rosehip. The results are presented in Table 2. The total amount of CFA determined at SmNPs/MWCNTs/GCE in each sample was referred to the regression equation obtained in the calibration study. Recovery values were obtained by the addition of a known amount of CFA standard solutions to the food samples. The recoveries were between 97.0% and 101.0%. The accuracy of the proposed method was also assured for the determination of CFA in tablets (Table 3). A mean recovery of %97.5 with an RSD% of 2.8% was obtained for the analysis of tablets. The reasonable values of recoveries and RSDs% calculated at the proposed voltammetric platform demonstrate that the adsorptive transfer voltammetric method of analysis is accurate and precise for determining CFA. Mean ± standard deviation (n = 5).
Sample
Added (nmol L−1)
Expected (nmol L−1)
Found (nmol L−1)
Recovery%
RSD%
Clove buds
–
–
2.5
–
2.4
5
7.5
7.3
97.3
2.8
10
12.5
12.3
98.4
2.6
20
22.5
22.2
98.5
2.3
Cinnamon
–
–
9.7
–
3.0
10
19.7
18.8
95.3
3.1
20
20.7
28.6
96.2
2.8
40
49.7
48.4
97.3
2.5
Ginger
–
–
3.9
–
3.1
4
7.9
7.7
97.5
3.3
8
11.9
11.7
98.0
2.8
16
19.9
20.1
101.0
2.5
Turmeric
–
–
8.5
–
2.9
10
18.5
18.1
98.0
3.0
20
28.5
28.1
98.3
2.6
40
48.5
47.8
98.6
2.2
Turkish coffee
–
–
15.2
–
2.0
15
30.2
29.9
99.0
2.6
30
45.2
44.6
98.7
2.4
60
75.2
74.4
99.0
2.2
Turkish black tea
–
–
4.8
–
2.5
5
9.8
9.7
97.0
2.3
10
14.8
14.5
98.0
2.1
20
24.8
24.4
98.5
2.0
Turkish green tea
–
–
5.1
–
2.5
5
10.1
9.8
97.0
3.0
10
15.1
14.8
98.0
2.7
20
25.1
24.9
99.2
2.2
Rosehip
–
–
7.3
–
3.0
10
17.3
16.9
97.8
3.0
20
27.3
26.8
98.0
2.5
30
37.3
36.5
97.9
2.3
Sample
Content (mg)
Found (mg)
Recovery%
RSD%
Caffeic acid tablets
300
292.5 ± 8.19
97.5
2.8
4 Conclusions
A comparison of adsorptive transfer and solution phase voltammetric methods for the study of CFA was carried out. For this purpose, a voltammetric sensing platform was prepared by the modification of glassy carbon electrodes (GCEs) with multi-walled carbon nanotubes (MWCNTs) and samarium nanoparticles (SmNPs) by means of an ultrasonic bath. The solution phase voltammetry was carried out by dipping the modified electrode into a voltammetric cell containing CFA. The plot of peak currents was linear over the range of 5.0 × 10⁻⁹ mol L−1 –8.0 × 10⁻⁸ mol L−1. The values of LOD and LOQ were 2.0 × 10⁻⁹ mol L−1 and 6.67 × 10⁻⁹ mol L−1 for CFA using a classical solution phase voltammetry at the proposed platform. In case of adsorptive transfer voltammetry, CFA was adsorbed at the surface of the proposed voltammetric platform by keeping it into a solution of CFA. Then, the platform was transferred with the adsorbed species in an electrochemical cell containing only 0.1 mol L−1 phosphate buffer solution (PBS) for the voltammetric analysis. The current response of CFA was found to be linear over a concentration from 5.0 × 10⁻¹⁰ mol L−1 to 1.0 × 10⁻⁷ mol L−1 with a detection limit of (LOD) of 2.0 × 10⁻¹⁰ mol L−1. The LOQ was calculated as 2.0 × 10⁻¹⁰ mol L−1. The modified electrode (SmNPs/MWCNTs/GCE) has successfully been applied to various food samples for the determination of CFA. It was shown that the LOD obtained at adsorptive transfer voltammetry was 10-fold lower than that calculated at classical solution phase voltammetry.
Acknowledgements
The financial support by the University of Harran is greatly acknowledged (Project no – HUBAK).
Declaration of Competing Interest
The authors declare that they have no known competing financial interests or personal relationships that could have appeared to influence the work reported in this paper.
References
- Surface enhanced Raman spectroscopy of phenolic antioxidants: A systematic evaluation of ferulic acid, p-coumaric acid, caffeic acid and sinapic acid. Vib. Spectrosc.. 2017;89:113-122.
- [Google Scholar]
- Determination of caffeic acid in wine using PEDOT film modified electrode. Food Chem.. 2014;156:81-86.
- [Google Scholar]
- Sonochemical synthesis of graphene oxide sheets supported Cu2S nanodots for high sensitive electrochemical determination of caffeic acid in red wine and soft drinks. Compos. B Eng.. 2019;158:419-427.
- [Google Scholar]
- Principal components - based techniques in voltammetric determination of caffeic, Syringic and Vanillic Acids. Electroanalysis. 2016;28(3):546-554.
- [Google Scholar]
- Morphological, optical and electrical properties of samarium oxide thin films. Thin Solid Films. 2012;520(20):6393-6397.
- [Google Scholar]
- Rapid determination of total polyphenolic content in tea samples based on caffeic acid voltammetric behaviour on a disposable graphite electrode. Food Chem.. 2015;173:1059-1065.
- [Google Scholar]
- Anchoring samarium oxide nanoparticles on reduced graphene oxide for high-performance supercapacitor. Appl. Surf. Sci.. 2017;402:245-253.
- [Google Scholar]
- A practical beginner’s guide to cyclic voltammetry. J. Chem. Educat.. 2018;95:197-206.
- [Google Scholar]
- Rapid determination of hydrophilic phenols in olive oil by vortex-assisted reversed-phase dispersive liquid-liquid microextraction and screen-printed carbon electrodes. Talanta. 2018;181:44-51.
- [Google Scholar]
- Square-wave stripping voltammetric determination of caffeic acid on electrochemically reduced graphene oxide-Nafion composite film. Talanta. 2013;116:245-250.
- [Google Scholar]
- Preparation of samarium oxide nanoparticles and its catalytic activity on the esterificatio. Mater. Chem. Phys.. 2002;77:65-69.
- [Google Scholar]
- Pt-PEDOT/rGO nanocomposites: One-pot preparation and superior electrochemical sensing performance for caffeic acid in tea. J. Electroanal. Chem.. 2018;816:14-20.
- [Google Scholar]
- Construction of novel sensitive electrochemical sensor for electro-oxidation and determination of citalopram based on zinc oxide nanoparticles and multi-walled carbon nanotubes. Mater. Sci. Eng., C. 2016;59:847-854.
- [Google Scholar]
- Gold nanoparticle/carbon nanotube hybrids as an enhanced material for sensitive amperometric determination of tryptophan. Electrochim. Acta. 2010;55(12):3927-3931.
- [Google Scholar]
- Simultaneous quantitation of caffeic acid and ferulic acid based on graphite-like C3N4/chitosan modified film. Int. J. Electrochem. Sci. 2017:8504-8515.
- [Google Scholar]
- Electroanalysis of caffeic acid in red wine and investigation of thermodynamic parameters using an Ag nanoparticles modified poly(thiophene) film glassy carbon electrode. Electroanalysis. 2013;25(8):1933-1945.
- [Google Scholar]
- Electroanalytical determination of caffeic acid – Factors controlling the oxidation reaction in the case of PEDOT-modified electrodes. Electrochim. Acta. 2019;293:439-446.
- [Google Scholar]
- A voltammetric determination of caffeic acid in red wines based on the nitrogen doped carbon modified glassy carbon electrode. Sci. Rep.. 2017;7:1-10.
- [Google Scholar]
- A selective electrochemical sensor for caffeic acid and photocatalyst for metronidazole drug pollutant - A dual role by rod-like SrV2O6. Sci. Rep.. 2017;7:7254-7265.
- [Google Scholar]
- Facile synthesis of MnO2-embedded flower-like hierarchical porous carbon microspheres as an enhanced electrocatalyst for sensitive detection of caffeic acid. Anal. Chim. Acta. 2017;985:155-165.
- [Google Scholar]
- Facile one-pot preparation of Pd–Au/PEDOT/graphene nanocomposites and their high electrochemical sensing performance for caffeic acid detection. RSC Adv.. 2016;6(92):89157-89166.
- [Google Scholar]
- Facile one-pot synthesis of Au–PEDOT/rGO nanocomposite for highly sensitive detection of caffeic acid in red wine sample. Electrochim. Acta. 2016;196:1-12.
- [Google Scholar]
- Nanomaterial based electrochemical sensors for the safety and quality control of food and beverages. Analyst. 2018;143(19):4537-4554.
- [Google Scholar]
- Electrochemical sensor based on multiwalled carbon nanotube and gold nanoparticle modified electrode for the sensitive detection of bisphenol A. Sens. Actuators, B. 2017;253:513-522.
- [Google Scholar]
- Voltammetric determination of caffeic acid by using a glassy carbon electrode modified with a chitosan-protected nanohybrid composed of carbon black and reduced graphene oxide. Mikrochim. Acta. 2019;186(2):54-62.
- [Google Scholar]
- Characterization of the surface redox process of caffeic acid adsorbed at glassy carbon electrodes modified with partially reduced graphene oxide. J. Electroanal. Chem.. 2016;783:258-267.
- [Google Scholar]
- Hydrothermal synthesis of three dimensional graphene-multiwalled carbon nanotube nanocomposite for enhanced electro catalytic oxidation of caffeic acid. Electroanalysis. 2017;29(4):1103-1112.
- [Google Scholar]
- Visible light enhanced electrochemical detection of caffeic acid with waxberry-like PtAuRu nanoparticles modified GCE. Sens. Actuators, B. 2018;272:135-138.
- [Google Scholar]
- Synthesis of hierarchical mesoporous graphite oxide/Al2O3 from MIL-100(Al) for the electrochemical determination of caffeic acid in red wine samples. J. Taiwan Inst. Chem. Eng.. 2018;84:188-195.
- [Google Scholar]
- Natural product-inspired esters and amides of ferulic and caffeic acid as dual inhibitors of HIV-1 reverse transcriptase. Eur. J. Med. Chem.. 2017;130:248-260.
- [Google Scholar]
- Fluorescent carbon dots as cost-effective and facile probes for caffeic acid sensing via a fluorescence quenching process. J. Fluoresc.. 2018;28(2):523-531.
- [Google Scholar]
- Selective determination of L-DOPA at a graphene oxide/yttrium oxide modified glassy carbon electrode. Electrochim. Acta. 2019;30:192-199.
- [Google Scholar]
- Development and validation of a green capillary electrophoretic method for determination of polyphenolic compounds in red wine samples. Chromatographia. 2016;79(19–20):1351-1358.
- [Google Scholar]
- Nanomolar electrochemical detection of caffeic acid in fortified wine samples based on gold/palladium nanoparticles decorated graphene flakes. J. Colloid Interface Sci.. 2017;501:77-85.
- [Google Scholar]
- Synthesis, characterization of guar-containing polyurethane films and their non-enzymatic caffeic acid sensor applications. Polym.-Plast. Technol. Eng.. 2017;56(16):1741-1751.
- [Google Scholar]
- Electrochemical behavior of caffeic acid. Electrochim. Acta. 2004;49(9–10):1647-1654.
- [Google Scholar]
- Voltammetric method using a lead film electrode for the determination of caffeic acid in a plant material. Food Chem.. 2011;125(4):1498-1503.
- [Google Scholar]
- Determination of caffeic acid in wine samples based on the electrochemical reduction of graphene oxide modified screen printed carbon electrode. Int. J. Electrochem. Sci. 2017:4173-4182.
- [Google Scholar]
- An electrocatalytic oxidation and voltammetric method using a chemically reduced graphene oxide film for the determination of caffeic acid. J. Colloid Interface Sci.. 2014;423:33-40.
- [Google Scholar]
- Determination of rosmarinic acid and caffeic acid in aromatic herbs by HPLC. Food Chem.. 2004;87(2):307-311.
- [Google Scholar]
- Voltammetric determination of 4-chlorophenol using multiwall carbon nanotube/gold nanoparticle nanocomposite modified glassy carbon electrodes. RSC Adv.. 2016;6:34692-34698.
- [Google Scholar]
- Electrochemical behavior of caffeic acid assayed with gold nanoparticles/graphene nanosheets modified glassy carbon electrode. Electroanalysis. 2013;25(5):1230-1236.
- [Google Scholar]
- Electrochemical behavior and determination of four drugs using multi-wall carbon nanotubes modified glassy carbon electrode. Int. J. Electrochem. Sci. 2019:506-515.
- [Google Scholar]


