

Translate this page into:
A comprehensive approach in perceiving the chelation of Cu(II) and Zn(II) with Alizarin Red S using pH-oscillotitrimetric and volumetric-oscillographic methods
⁎Corresponding author at: Department of Solar Energy, School of Technology, Pandit Deendayal Energy University; PDEU, Gandhinagar 382007, Gujarat, India. nour_ragif@hotmail.com (Nour Mohammad-Sadik Ali)
-
Received: ,
Accepted: ,
This article was originally published by Elsevier and was migrated to Scientific Scholar after the change of Publisher.
Peer review under responsibility of King Saud University.
Abstract
In order to understand the chelation process and investigate the intermediate species as a step towards verifying the exact functional groups that are involved in bonding with transition metals, specifically Cu(II) and Zn(II), pH-oscillotitrimetric (pHOT) and volumetric-oscillographic (VOG) methods have been profoundly used. Alizarin Red S (ARS) - as one of the chameleon compounds (chromogenic) - confirms its different approach of bonding with copper and zinc in different mediums. These two methods thoroughly confirm the adequate conditions for each metal to chelate with ARS. pH is responsible for the ambience in which the formation energy in its less value for the salt or complex to be formed, confirming that pH = 5 is the value that allows Cu(II) to bond with ARS, whereas Zn(II) bonds at pH = 6. A new approach has been also suggested as to how to discuss the titrimetric curves in both methods, taking into account the importance of ‘volumetric-oscillographs’ that give more information when analysed appropriately. Volumetric-oscillographs have been shown and utilized as fingerprint spectrums to track any change in the solutions and firmly expect the compounds that can be step-by-step formed during titration operation. The resulting-in rules have been suggested during reading the graphs. Moreover, the competition between these two metals to chelate with ARS has been extensively studied.
Keywords
pH-oscillotitrimetric
Volumetric-oscillography
Alizarin Red S
Cu(II)-Zn(II) chelating competition

1 Introduction
Alizarin Red S (ARS) is considered as one of the anthraquinonoid derivatives, functional electrochemically (Faouzi et al., 2007; Turcanu and Bechtold, 2011; Deffo et al., 2022; Güneş et al., 2022; Si et al., 2022) and has been used to trace arylboronic acids electrochemically (Bonne et al., 2010; Huang et al., 2010). To detect some organic materials or metal ions (Puchtler et al., 1969) like Ca (Paul et al., 1983), Sn (Ali et al., 2016) and Cu, ARS has been utilized to facilitate the electrochemical reductions in diversified arrangements (Mouchrek et al., 1999; Ardakani et al., 2008; Deng et al., 2008). The bonding process between ARS and arylboronic acids (BA) and the preferred path for both to link with saccharides or cis-diol compounds in order to determine the correlation constants, the exact formula, pH, pKa effects, etc. (Springsteen et al., 2001; Schumacher et al., 2011; James et al., 2006; Springsteen and Wang, 2002; Freeman and Willner, 2009; Deore and Freund, 2005; Sano et al., 2000; Breton et al., 2008; Tan et al., 2009; Wang et al., 2006; Ding et al., 2009; Fatibello-Filho et al., 1999) have been thoroughly studied. ARS has been additionally used in the displacement assay of D-fructose at pH=7.4 for the highest biological interest (Schumacher et al., 2011) and in the spectrophotometric method as a determination of many metals such as Cd in urine, human blood and water (Ullah and Haque, 2010), adequate buffer, ARS concentration, the stability duration and Th concentration for the formation of Th-ARS complex (Fouad1 et al., 2015).
More recently, FT-IR spectroscopy, scanning electron microscopy (SEM) and electrothermal atomic absorption spectrometry (ETAAS) have been dedicated for the characterization of imprinted nanoadsorbent (polymer doped with ARS) with a view to trace and quantify Zn(II) (Afshar et al., 2017). A modified Bio-matrix of rice husk with ARS (RH@MCM-41@ARS) was used to capture Pd(II) using transmission electron microscope (TEM), Fourier-transform infrared spectroscopy (FTIR), (SEM), X-ray diffraction (XRD), energy dispersive X-ray spectrometer (EDX) and surface area studies (Nabieh et al., 2021). Also, in biomaterials science and its nanotechnologies, the potential imaging of cellular Cu(II) has been investigated via a nanoindicator from ARS‑borono-peptide (ARS/BP), where the fluorescent nanoparticles have an intense response to Cu(II) and offer the possibility to detect Cu(II) in cancer cells (Feng et al., 2021). For the same osteology purposes, ARS is stained (Booth et al., 2022) in dorsal aspect head bone of zebrafish larvae in order to follow the peptides’ effects (Chen et al., 2020), and for marking Salmo Trutta (Jurgelėnė et al., 2022). In vitro evaluation and to detect any effect of Ag3PO4 in carbonate apatite artificial bone, the calcification of MC3T3-E1 cells has been assessed by monitoring the colour change of the deposits. As a result, ARS stained area percentage remains approximately 100%, referring to that the cellular differentiation, adhesion, proliferation and calcification are not affected by 0.1−0.3% Ag3PO4 content (Shimabukuro et al., 2022).Y. Kong et. al. have used ARS as a stainer for Fe–catechin nanoparticles (Fe-cat NPs) that rearrange the osteogenic immune micro-ambience through resisting the inflammation and fostering remarkably the curative influence (Kong et al., 2021). Moreover, for more environment-friendly metallurgical treatment of batteries’ wastes and for flexible supercapacitors (Wang et al., 2022; Wang et al., 2022), some metals have been recovered such as Fe, Mn, Co, Ni, Ce and La from waste nickel metal hydride (NiMH) battery in a three-step aqueous biphasic system (ABS) forming salt anion and ARS (Vargas et al., 2021). Additionally, N.M.-S. Ali et. al. have studied the complex formation between ARS and Cu(II) using Direct Current (DC) and Deferential Pulse (DP) Polarographic techniques (Ali et al., 2022). As a further step, P. Singh and N. Naskar have tabulated some studies during their research to detect F- using In(III)-ARS complex at pH=7 (Singh and Naska, 2021). For the detection of ARS itself, nitrogen-doped MXene quantum dots (N-MQDs) has been utilized at the detection limit of 1.21 μM (Yan et al., 2021).
Many studies have been also devoted for the purpose of ARS removal (Sahib et al., 2022; Hussain et al., 2022) in which Hui-Yu Jiang et. al. used the photofading phenomenon (Jiang et al., 2021),A.R.K. Gollakota et. al., S.K. Kansal et. al. and R. Nodehi et. al. used metal oxides or zeolites’ derivatives (Gollakota et al., 2021; Kansal et al., 2013; Nodehi and Shayesteh, 2021), G.R. Delpiano et. al. used a metal organic framework (Delpiano et al., 2021), K.J. Al-Salihi with W.R. Alfatlawi (Al-Salihi and Alfatlawi, 1094) and S. Saghir with Z. Xiao (Saghir and Xiao, 2021) used a layered double hydroxide (LDH) and M. Ghaedi et. al. and F.M. Machado et. al. used carbon nanotubes (Ghaedi et al., 2011; Machado et al., 2016).
In this work, authors have investigated in detail how ARS bonds with Zn(II) and Cu(II) and the reasons behind that, determining the functional groups that are involved to form those bonds in different mediums and exploring the possibilities of forming salts or complexes using very sensitive physicochemical methods that are pH-oscillotitrimetry (pHOT) and volumetric-oscillography (VOG). These methods provide a huge amount of data that can be deeply interpreted into very useful information about the dyes in aqueous solutions. Furthermore, these methods are greatly an opening-up methodologies for further studies to track the metals and fully understand the mechanism of the bonding between dyes and other materials, metals in specific, for different futuristic purposes; for example, electrodeposition of metals and alloys, biosensing applications, the removal and separation of metals from aqueous media in general, conceiving the keys for degradations of dyes’ complexes, etc.
2 Materials and methods
2.1 Materials, apparatuses and tools of physicochemical investigations
To accomplish this work, 1,2-dihydroxy-9,10-anthraquinone-3-sulfonate as sodium salt (ARS) (Sigma-Aldrich), CuCl2.2H2O (Sigma-Aldrich, ≥ 99.0%), Calmagite (Calm.), poly(ethylene glycol) (PEG) with different molecular weights; 400g/mol (BioUltra, liquid, product of Belgium), 2000g/mol and 4000g/mol (BioUltra, powder, product of Germany), ZnCl2.2H2O (Sigma-Aldrich, ≥ 99.0%) and NaOH (Merck, pellets, ≥ 97%) were used without any further purification. Also, TIS60 Thermal Imager Camera (Model No. FLUKE TIS60 9HZ) and pH/Conductivity Meter produced by Thermo Scientific (Model No. Orion Star A215) have been utilized to carry out the experiments.
2.2 Physicochemical methods
The following steps have been studied using three different methods namely pH-oscillotitrimetric (pHOT), volumetric-oscillographic (VOG) and pH/electroconductivity methods (Their values’ indications, pHCD, ECD and EAO): studying the general effect of the light on the ligands namely ARS, Calmagite, PEG (400, 2000 and 4000 g/mol), studying the solution of ZnCl2 and the mixtures of (ARS + ZnCl2) and (ARS + CuCl2 + ZnCl2), the indications of the pH values on the solutions and mixtures of ARS and zinc chloride, the indications of the electro-conductivity values on the solutions and mixtures of ARS and zinc chloride, the indications of the pH values in studying the competition between copper and zinc ions to bond with ARS simultaneously and the indications of the electro-conductivity values in studying the competition between copper and zinc ions to bond with ARS simultaneously. On the other hand, the correlation ratios have been determined for Zn with ARS and among Zn, Cu and ARS in the same solution.
The experiments of the pH and conductivity titrations have been set-up for all solutions against 0.01M NaOH, where these solutions consist of ZnCl2, CuCl2, ARS and their mixtures. Thereafter, the first and second [pH-oscillotitrimetric graph (pHOT) and volumetric-oscillograph (VOG)] derivatives have been calculated for the values of each titration curve, where the value 25 has been added each time to the subsequent curves’ values in order to separate these curves from each other and set them up in the same figure. Accordingly, Gran plots have been also drawn for each curve.
3 Results and discussion
3.1 Physicochemical methods
3.1.1 pH-oscillotitrimetric (pHOT) and volumetric-oscillographic (VOG) methods
3.1.1.1 The general effect of the light on the ligands
The 4x10⁻³M stock solutions of ARS, Calmagite, PEG (400, 2000 and 4000g/mol), CuCl2, SnCl2 and ZnCl2 have been prepared to always start with them in various experiments. Therefore, the stability of those solutions has been studied in terms of unsuitable preservation conditions, the light exposure along with the temperature in specific, to get the limitations signs of those solutions endurance, where the change in the solutions’ colours, especially the dyes’ colours, has not been observed as an indication to the structures’ stability of those compounds as it is shown in Figs. 1 and 2. The solutions have been exposed to the light beams for 20 hours in which Calmagite and PEG (400, 2000 and 4000g/mol) have been used as a comparison between different organic compounds, consequently those beams heated the samples up to 55-60°C at the distance of 40cm from the light source, which has the temperature of ∼150°C at its center (see Figs. 1, 2 and 3). TIS60 Thermal Imager Camera (Model No. FLUKE TIS60 9HZ) has been used as a temperature detector for this experiment, where it was located adjacent to the light source to measure temperature degrees of both; the samples and the light source.![The solutions colors before the exposure to the light. 1: The solution of [4x10⁻³M PEG(4000) 0.5ml + 75ml DI water], 2: The solution of [4x10⁻³M PEG(2000) 0.5ml + 75ml DI water], 3: The solution of [4x10⁻³M PEG(400) 0.5ml + 75ml DI water], 4: The solution of [4x10⁻³M ARS 0.5ml + 75ml DI water], 5: The solution of [4x10⁻³M Calm 0.5ml + 75ml DI water].](/content/184/2022/15/8/img/10.1016_j.arabjc.2022.104016-fig1.png)
The solutions colors before the exposure to the light. 1: The solution of [4x10⁻³M PEG(4000) 0.5ml + 75ml DI water], 2: The solution of [4x10⁻³M PEG(2000) 0.5ml + 75ml DI water], 3: The solution of [4x10⁻³M PEG(400) 0.5ml + 75ml DI water], 4: The solution of [4x10⁻³M ARS 0.5ml + 75ml DI water], 5: The solution of [4x10⁻³M Calm 0.5ml + 75ml DI water].
![The solutions colors after the exposure to the light for 20 hours. 1: The solution of [4x10⁻³M PEG(4000) 0.5ml + 75ml DI water], 2: The solution of [4x10⁻³M PEG(2000) 0.5ml + 75ml DI water], 3: The solution of [4x10⁻³M PEG(400) 0.5ml + 75ml DI water], 4: The solution of [4x10⁻³M ARS 0.5ml + 75ml DI water], 5: The solution of [4x10⁻³M Calm 0.5ml + 75ml DI water].](/content/184/2022/15/8/img/10.1016_j.arabjc.2022.104016-fig2.png)
The solutions colors after the exposure to the light for 20 hours. 1: The solution of [4x10⁻³M PEG(4000) 0.5ml + 75ml DI water], 2: The solution of [4x10⁻³M PEG(2000) 0.5ml + 75ml DI water], 3: The solution of [4x10⁻³M PEG(400) 0.5ml + 75ml DI water], 4: The solution of [4x10⁻³M ARS 0.5ml + 75ml DI water], 5: The solution of [4x10⁻³M Calm 0.5ml + 75ml DI water].
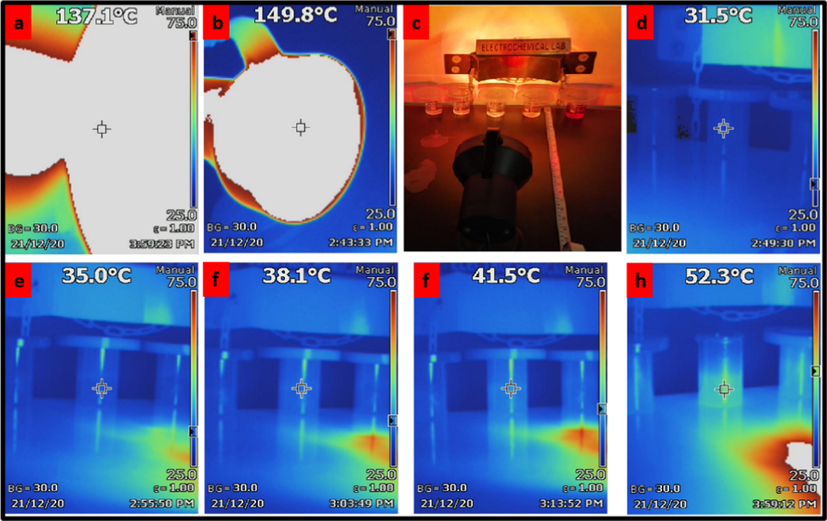
The process of exposing the samples to the light; a: the temperature around the center of the light source. b: the temperature of the center of the light source. c: the exact setup of the sample for the exposure process to the light. d-h: the gradual increase in the temperature of the samples.
The data in Table 1 show unsignificant differences in the pH values and consequently the electrode potential (EP), and that indicates again to the stability of the solutions in case they are exposed to bearable conditions such as light and heat, whilst the data exhibit the differences between the temperature and conductivity values before and after the exposure to the light and after cooling down the samples naturally for 3 hours on the second day. Basically, when the temperature of a liquid increases, the conductivity also increases. Hence, to know better about the relationship between both factors, the concern is to identify the difference range that the temperature makes for the same solution. For example, for Calm., the assumption can be as in equation (1).
Solution
Before the light exposure
After the light exposure for 20h
4x10⁻³M Calm 0,5ml + 75ml DI water
pH = 5,97
T = 24.3˚C
pH = 6.18
T = 27.3˚C
EP = 84.1mV
Cond. = 27.11 μS/cm
EP = 89.4mV
Cond. = 159.5 μS/cm
4x10⁻³M ARS 0,5ml + 75ml DI water
pH = 5,43
T = 24.1˚C
pH = 5,36
T = 28.2˚C
EP = 92.0mV
Cond. = 25.48 μS/cm
EP = 97.4mV
Cond. = 134.4 μS/cm
4x10⁻³M PEG(400) 0,5ml + 75ml DI water
pH = 5,44
T = 24.2˚C
pH = 5,36
T = 28.2˚C
EP = 91.3mV
Cond. = 25.71 μS/cm
EP = 97.4mV
Cond. = 134.4 μS/cm
4x10⁻³M PEG(2000) 0,5ml + 75ml DI water
pH = 5,57
T = 24.2˚C
pH = 5,64
T = 27.1˚C
EP = 84.1mV
Cond. = 11.68 μS/cm
EP = 84.1mV
Cond. = 83.19 μS/cm
4x10⁻³M PEG(4000) 0,5ml + 75ml DI water
pH = 5,61
T = 24.1˚C
pH = 5,62
T = 26.4˚C
EP = 81.7mV
Cond. = 57.27 μS/cm
EP = 81.5mV
Cond. = 123.5 μS/cm
The same for all solutions has been done and the calculations are expressed in equation (2).
The average rate (AR) of the 1°C variations in the conductivity can be referred to as in equation (3), where CTCOC is the conductivity/temperature change of an organic compound.
Given that, the 1°C increase can practically increase the solutions’ conductivity by approximately 5-15 times comparing to the conductivity of DI water, which realistically varies from 2 μS/cm to 6 μS/cm as an acceptable value.
3.1.2 The indications of the pH values on the solutions and mixtures of ARS and zinc chloride
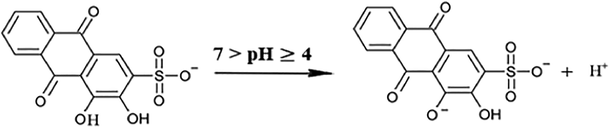
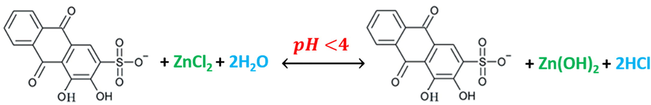
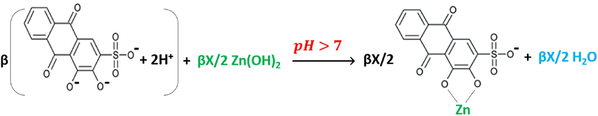
Zinc chloride is very soluble in water, and its solutions cannot be considered to contain simply solvated Zn2+ ions and Cl− ions, where ZnClxH2O(4−x) species are also present (Irish et al., 1963; Yamaguchi et al., 1989; Pye et al., 2006). Aqueous solutions of ZnCl2 are acidic, where 6M aqueous solution has pH =1 (Holleman and Wiberg, 2001). As it is shown in Fig. 4, for the first solution that consists of 100% ZnCl2, the solution is acidic. That can be interpreted as the solution can afterward react with the water molecules as in reaction (4).
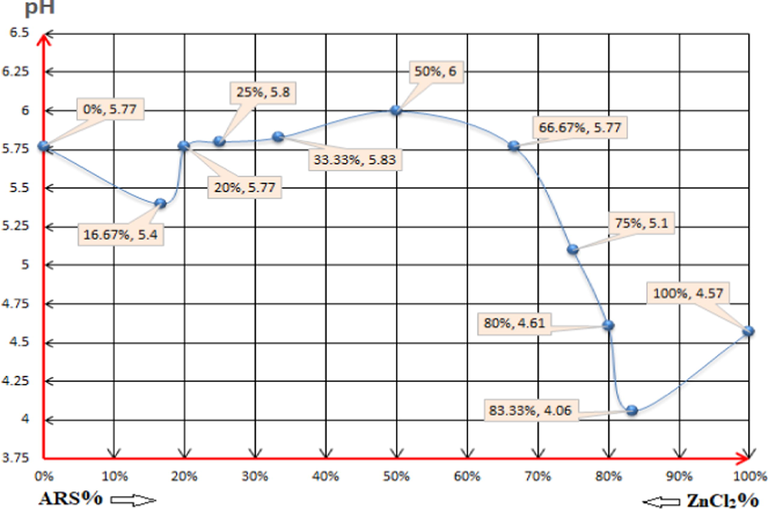
The pH values of the following solutions: (0%, 5.77): 4x10⁻³M ZnCl2 0.5ml + 79.5ml DI water. (16.67%, 5.4) (1:5): 4x10⁻³M ARS 0.5ml + 4x10⁻³M ZnCl2 2.5ml + 77ml DI water. (20%, 5.77) (1:4): 4x10⁻³M ARS 0.5ml + 4x10⁻³M ZnCl2 2ml + 77.5ml DI water. (25%, 5.8) (1:3): 4x10⁻³M ARS 0.5ml + 4x10⁻³M ZnCl2 1.5ml + 78ml DI water. (33.33%, 5.83) (1:2): 4x10⁻³M ARS 0.5ml + 4x10⁻³M ZnCl2 1ml + 78.5ml DI water. (50%, 6) (1:1): 4x10⁻³M ARS 0.5ml + 4x10⁻³M ZnCl2 0.5ml + 79ml DI water. (66.67%, 5.77) (2:1): 4x10⁻³M ARS 1ml + 4x10⁻³M ZnCl2 0.5ml + 78.5ml DI water. (75%, 5.1) (3:1): 4x10⁻³M ARS 1.5ml + 4x10⁻³M ZnCl2 0.5ml + 78ml DI water. (80%, 4.61) (4:1): 4x10⁻³M ARS 2ml + 4x10⁻³M ZnCl2 0.5ml + 77.5ml DI water. (83.33%, 4.06) (5:1): 4x10⁻³M ARS 2.5ml + 4x10⁻³M ZnCl2 0.5ml + 77ml DI water. (100%, 4.57): 4x10⁻³M ARS 0.5ml + 79.5ml DI water.
Reaction (4) reveals that the medium is acidic in its nature more than being alkali or neutral, which means pH < 7.
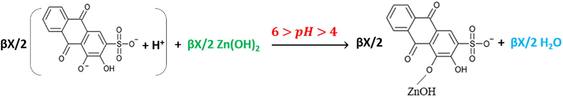
For the first mixture (ARS 1:5 ZnCl2), the pH value goes down comparing to the 100% ZnCl2 solution and goes up when it is compared with the 100% ARS solution. At this point the reagent displaces for the first (-OH)-group since the mixture has a weak acidity (Ali et al., 2016). According to that, the elucidation of that process happening in the mixture is according to reaction (5).
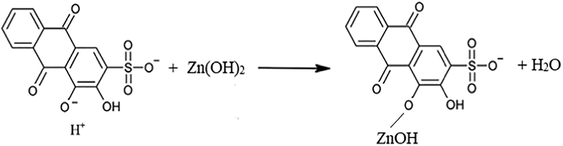
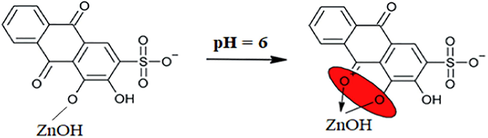
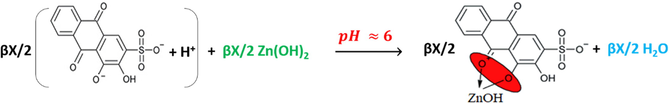
The formation of the water molecules in reaction (5) is the reason behind the increase in the pH of the first mixture, diluting it consequently. Therefore, the situation remains as per this reaction for the next three mixture (1:4), (1:3) and (1:2) until having the mixture of (1:1) with pH=6. This bids the most sufficient stoichiometry of the reactions as it gives the largest amount of water molecules to increase the pH of the mixture. Given that and at this point, the assumption is that the reagent starts to chelate with zinc ion via forming the covalent bond, formed by the oxygen atom in the near ketone group as in reaction (6).
For the rest of the mixtures, ARS ions continue to liberate protons into the solutions without any further chelation process with Zn ions as long as the concentration increases, and this allows the pH value to be dropped rather than being increased. Thus, in these mixtures the dominant reaction is expressed in reaction (7), where pKa = 6.17 (Ali et al., 2016).
3.1.3 The indications of the pH-titrimetric and pH-oscillotitrimetric (pHOT) graphs of the solutions and mixtures of ARS and zinc chloride
The pH-titrimetric curves in Fig. 5. bid what exactly happens in the solutions and mixtures. For curve 1 and 2, it can demonstrate the precise understanding of the titration processes that are of the weak diprotic (polyprotic) acids (pH > 4.5) after dissolving in DI water and do not exhibit full titration leaps of the first displacements. That appears by examining the pH-titration curves’ offsets. In curve 1, ARS starts as a half leap that indicates that the first hydroxyl-group has been already titrated, and the half way to the second hydroxyl-group is not the real pKa2. In such cases, the half way is just pKa1, and pKa2 can be approximately determined using the following equation: 2pKa1 ± 1. Up to this point, ARS displaces according to reaction (7) by adding the first two drops of the hydroxide. By that, the hydroxide is consumed for the titration of the second displacement of the second hydroxyl group. pKa1 is, therefore, the half way to the second equivalence point (at pH ≈ 8.7), which means pKa1 = (pH at Veq,2/2) = [pH at (9.62/2 = 4.8mL)] ≈ 6.35 ± 0.1. pKa2 = 2pKa1 ± 1 ≈ 12.7 ± 1. However, the first derivative shows more accurate value of the second equivalence point, which is 9.5mL, and the pH-Oscillotitrimetric graph gives even more precise value, which is 9.267mL as in Fig. 7. Hence, pKa1 and pKa2 would change accordingly, where pKa1 ≈ 6.3 and pKa2 ≈ 12.6 ± 1. For curve 3 and 4 in Fig. 5, ZnCl2 takes considerably longer buffer region to be completely titrated, and that is because the hydroxide is consumed to titrate a strong acid as a result of ZnCl2 being dissolved in DI water according to reaction (4), and it is as per reaction (8).
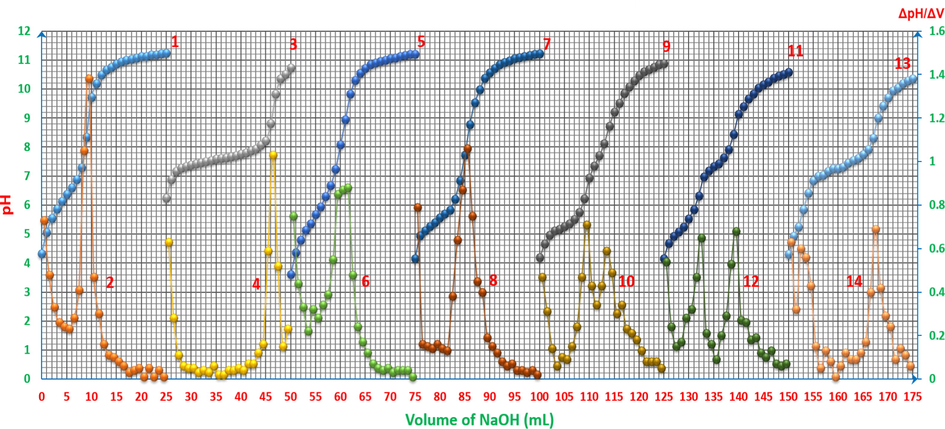
pH-titrimetric curves of ARS, ZnCl2 and their mixtures vs. 0.01M NaOH with the first derivatives: 1 and 2: 4x10⁻³M ARS 25ml. 3 and 4: 4x10⁻³M ZnCl2 25ml. 5 and 6: 4x10⁻³M ZnCl2 5ml with 4x10⁻³M ARS 20ml. 7 and 8: 4x10⁻³M ZnCl2 10ml with 4x10⁻³M ARS 15ml. 9 and 10: 4x10⁻³M ZnCl2 12.5ml with 4x10⁻³M ARS 12.5ml. 11 and 12: 4x10⁻³M ZnCl2 15ml with 4x10⁻³M ARS 10ml. 13 and 14: 4x10⁻³M ZnCl2 20ml with 4x10⁻³M ARS 5ml. The curves (3-14) are extracted after adding 25 to each value of horizontal axis (volume axis) consecutively.
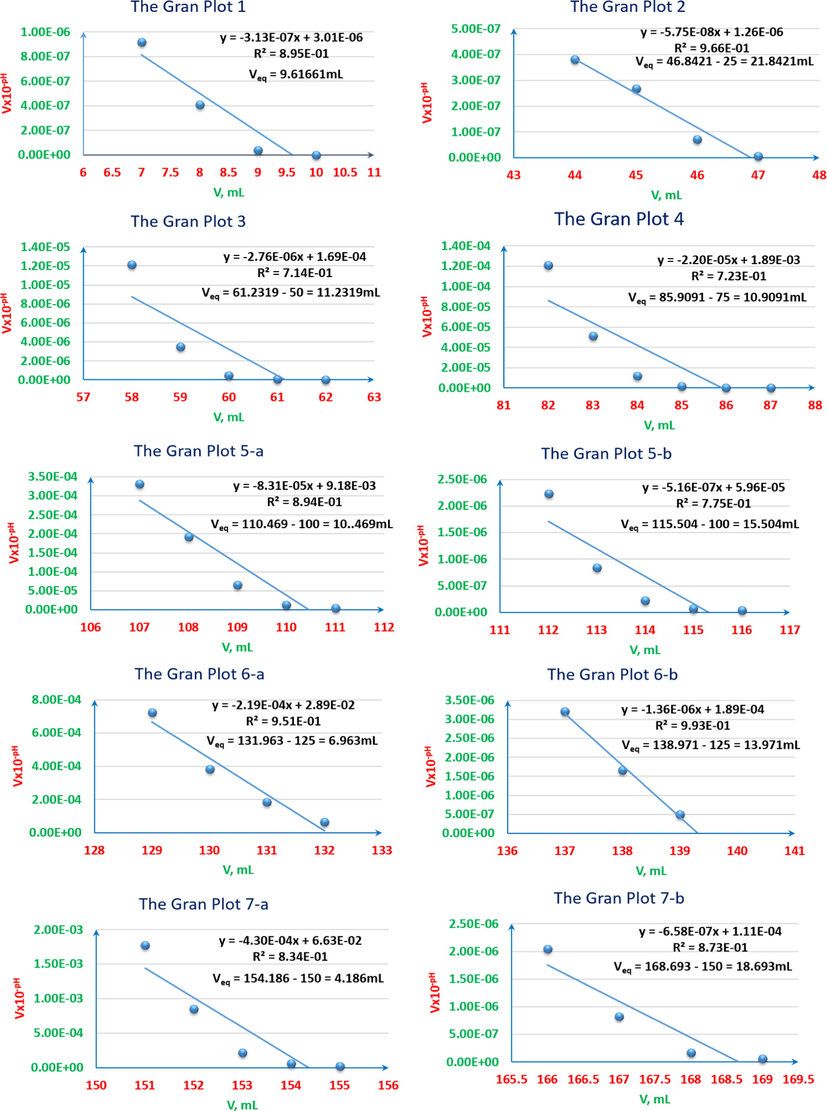
pH-titrimetric Gran plots of ARS, ZnCl2 and their mixtures vs. 0.01M NaOH. 1: 4x10⁻³M ARS 25ml. 2: 4x10⁻³M ZnCl2 25ml. 3: 4x10⁻³M ZnCl2 5ml with 4x10⁻³M ARS 20ml. 4: 4x10⁻³M ZnCl2 10ml with 4x10⁻³M ARS 15ml. 5-a: first equivalence point of 4x10⁻³M ZnCl2 12.5ml with 4x10⁻³M ARS 12.5ml. 5-b: second equivalent point of 4x10⁻³M ZnCl2 12.5ml with 4x10⁻³M ARS 12.5ml. 6-a: first equivalence point of 4x10⁻³M ZnCl2 15ml with 4x10⁻³M ARS 10ml. 6-b: second equivalence point of 4x10⁻³M ZnCl2 15ml with 4x10⁻³M ARS 10ml. 7-a: first equivalent point of 4x10⁻³M ZnCl2 20ml with 4x10⁻³M ARS 5ml. 7-b: second equivalence point of 4x10⁻³M ZnCl2 20ml with 4x10⁻³M ARS 5ml.
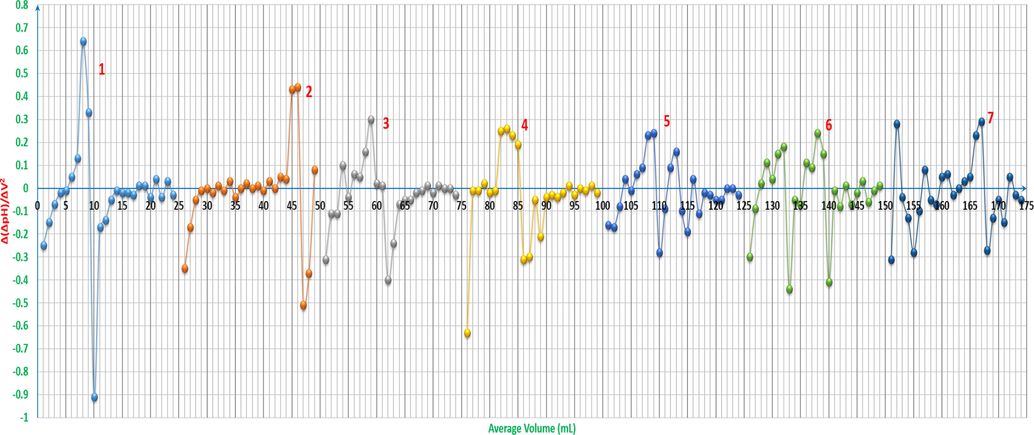
pH-oscillotitrimetric graphs (pHOT) of ARS, ZnCl2 and their mixtures vs. 0.01M NaOH: 1: 4x10⁻³M ARS 25ml. 2: 4x10⁻³M ZnCl2 25ml. 3: 4x10⁻³M ZnCl2 5ml with 4x10⁻³M ARS 20ml. 4: 4x10⁻³M ZnCl2 10ml with 4x10⁻³M ARS 15ml. 5: 4x10⁻³M ZnCl2 12.5ml with 4x10⁻³M ARS 12.5ml. 6: 4x10⁻³M ZnCl2 15ml with 4x10⁻³M ARS 10ml. 7: 4x10⁻³M ZnCl2 20ml with 4x10⁻³M ARS 5ml. The curves (2-7) are extracted after adding 25 to each value of horizontal axis (volume axis) consecutively.
The equivalence point is referred to be ≈ 21.84mL, while the first derivative refers to 21.5mL, and the pH-oscillotitrimetric graph’s Gran plot 2 in Fig. 8 refers to ≈ 21.4mL. It is worth mentioning that for considering the fluctuation in the pHOT plot to be as a sign referring to a chemical process happening during the titration, the difference between two positive and negative points has to be Δ(ΔpH)/ΔV2 ≥ 0.35, otherwise it does not refer to any change or to a point that can be taken into account.
pH-oscillotitrimetric graphs’ Gran plots (VOGs’ Gran plots) of ARS, ZnCl2 and their mixtures vs. 0.01M NaOH. 1: 4x10⁻³M ARS 25ml. 2: 4x10⁻³M ZnCl2 25ml. 3: 4x10⁻³M ZnCl2 5ml with 4x10⁻³M ARS 20ml. 4: 4x10⁻³M ZnCl2 10ml with 4x10⁻³M ARS 15ml. 5-a: first equivalence point of 4x10⁻³M ZnCl2 12.5ml with 4x10⁻³M ARS 12.5ml. 5-b: second equivalence point of 4x10⁻³M ZnCl2 12.5ml with 4x10⁻³M ARS 12.5ml. 6-a: first equivalence point of 4x10⁻³M ZnCl2 15ml with 4x10⁻³M ARS 10ml. 6-b: second equivalence point of 4x10⁻³M ZnCl2 15ml with 4x10⁻³M ARS 10ml. 7-a: first equivalence point of 4x10⁻³M ZnCl2 20ml with 4x10⁻³M ARS 5ml. 7-b: second equivalence point of 4x10⁻³M ZnCl2 20ml with 4x10⁻³M ARS 5ml.
From the next titration curves, when the metal salts’ solutions are mixed with the organic compound’s solutions in different ratios, the concentrations are as in Table 2.
Volume (mL)
Concentration (M)
Material
Material
Concentration (M)
Volume (mL)
5
8x10⁻⁴
←ZnCl2
ARS→
32x10-4
20
10
16x10-4
←ZnCl2
ARS→
24x10-4
15
12.5
2x10⁻³
←ZnCl2
ARS→
2x10⁻³
12.5
15
24x10-4
←ZnCl2
ARS→
16x10-4
10
20
32x10-4
←ZnCl2
ARS→
8x10⁻⁴
5
It has been noticed that 18mL and 6mL of the hydroxide are required to reach the offset of the peak in the first derivative curve when titrating 25mL of ZnCl2 and 25mL of ARS respectively, and the required volumes to titrate each total bulk of the materials are as in Table 3.
Initial Volume (mL)
Required hydroxide volume (mL)
Material
Difference in the required hydroxide volume (mL)
Total required hydroxide volume (mL)
Material
Required hydroxide volume (mL)
Initial Volume (mL)
5
3.6
←ZnCl2
4.8 - 3.6 = 1.2
4.8 + 3.6 = 8.4
ARS→
4.8
20
10
7.2
←ZnCl2
7.2 - 3.6 = 3.6
7.2 + 3.6 = 10.8
ARS→
3.6
15
12.5
9
←ZnCl2
9 - 3 = 6
9 + 3 = 12
ARS→
3
12.5
15
10.8
←ZnCl2
10.8 – 2.4 = 8.4
10.8 + 2.4 = 13.2
ARS→
2.4
10
20
14.4
←ZnCl2
14.4 – 1.2 = 13.2
14.4 + 1.2 = 15.6
ARS→
1.2
5
As per it is shown in Table 3, neither the usual pH-titrimetric nor the first derivative or the pHOT graphs can sense and separate the two pH hops of the mixtures unless the difference is dVoff-Veq(1,2) ≥ 6mL between the offsets of the leaps according to (12.5:12.5 v/v) ratio, where the two leaps start to be separated. For curves 5-6 in Fig. 5, reaction (9) is deployed at the beginning and before starting the titration.
Reaction (9) shows that ARS is not displaced for the first hydroxyl-group as the ambient pH is unsuitable for that. The reaction seems to be more displaced to the right side to form more hydrochloric acid, where zinc hydroxide is more stable in these conditions. HCl concentration in this case is equal to 5x10⁻⁴M and Zn(OH)2 concentration is 25x10-5M. That means that HCl concentration is higher, which gives the acidic properties to the overall solution. By starting the pH-titrimetric process with adding the first mL of the hydroxide, reactions (10) and (11) carry out.

Reactions (10) and (11) continue to be the dominant ones until reaching the pH leaps, but by dropping the sixth mL of the hydroxide, the last reaction turns to be as reaction (12), where the pH value is suitable to form the complex. The same is proposed for curves 7 and 8 in Fig. 5 by adding the seventh mL of the hydroxide as in reaction (12).
As it can be noticed from Table 3, HCl is titrated completely before the complete titration of ARS for the first ratio (5:20 v/v), and the hydroxide starts to be consumed first to titrate ARS for all next ratios. That is because the required volume of the hydroxide to titrate HCl is less than that are required to titrate it for the remaining ratios. However, as long as the difference is inappropriate to distinguish the two leaps of titrating HCl and ARS, and both leaps are overlapped for the first two ratios; (5:20 v/v, 10:15 v/v), pH-titrimetric method and even with the help of the first derivative and pHOT graphs cannot sense the difference to separate those two leaps. Instead, only the overall volume that is required to titrate both HCl and ARS can be determined. In most cases, the first derivatives are more accurate than the normal pH-titrimetric curves in determining the equivalence point. However, if there is an overlapping process, neither the pH-titrimetric curves nor the first derivatives are accurate enough in comparison with the pHOT graphs in determining the overall equivalence point of overlapped leaps. Hence, the Gran plots 3 and 4 in Fig. 6 of the pH-titrimetric curves 5 and 7 in Fig. 5 refer to Veq, overall(5) ≈ 11.23mL and Veq, overall(7) ≈ 10.91mL respectively, while the first derivatives in Fig. 5 and the Gran plots 3 and 4 of the pHOT graphs in Fig. 8 refer to [Veq, overall(6) ≈ 11.5mL, Veq, overall(8) ≈ 10.5mL] and [Veq, overall(3) ≈ 10.2mL, Veq, overall(4) ≈ 10.7mL] respectively.
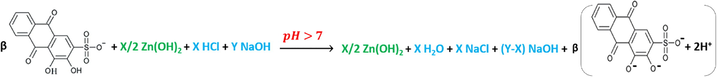
After passing the overall equivalence points of (5:20 v/v, 10:15 v/v) ratios, as their curves 5 and 7 indicate in Fig. 5, the pH curves start to tend to be more stabilized at approximately pH ≈ 10.5, and the final products in the solution are supposed to be as in reactions (13) and (14).
An interesting fact can be noticed when different species start to have the same concentrations, or when having a weak organic acid’s (ARS) concentration lesser than that of an added salt (ZnCl2) which, by dissolving it in the same aqueous solution, results a formation of a strong inorganic acid (HCl). This fact has at least three factors to be taken into account to prognosticate the results prior to the titration of the mixtures. The first factor is the length of the buffer regions of both materials when titrated individually with the same concentration against the same concentration of a standard solution, the second is the strength of both acidic materials and their products after dissolving in eques solutions and the third is the number of the displacements appeared as leaps on the titration curves that both materials have when titrated individually. According to the previous discussion, the added hydroxide is consumed to titrate the components that are of lesser concentrations, which means in the current case that ARS is titrated first and its leap is appeared before the titration leap of HCl resulted from ZnCl2 which was previously dissolved in the solution as a precursor.
For the rest of the pH-titrimetric curves; 9, 11 and 13 in Fig. 5, depending on what has been discussed earlier on, there is no complex formation, and also the titration of the weak acid, which is of equal or less concentration, carries on indirectly with the help of titrating the strong acid. The following explanations exhibit the mechanism of what carries on before and during the titration. Before titrating the mixtures, as it is shown from the initial pH value of the solution, ARS is already displaced for the first hydroxyl-group, and that means that the solution already has the formation of the salt which forms between Zn(OH)2 and ARS- in accordance with reaction (15).
As it can be seen from the curves of these last three mixtures, the first leaps start from pH ≈ [5.25-5.5]. Therefore, the pH values are not suitable for the formation of the complex. Thereafter, the reactions remain as the same as reactions (13) and (14) with only the difference of having some of HCl concentration gets titrated before and after the second displacement of ARS to form the salts in reaction (14) until finishing the titration of the entire species of HCl which is expressed by the second leaps of those three curves.
α.3- The indications of the electro-conductivity values on the solutions and mixtures of ARS and zinc chloride:
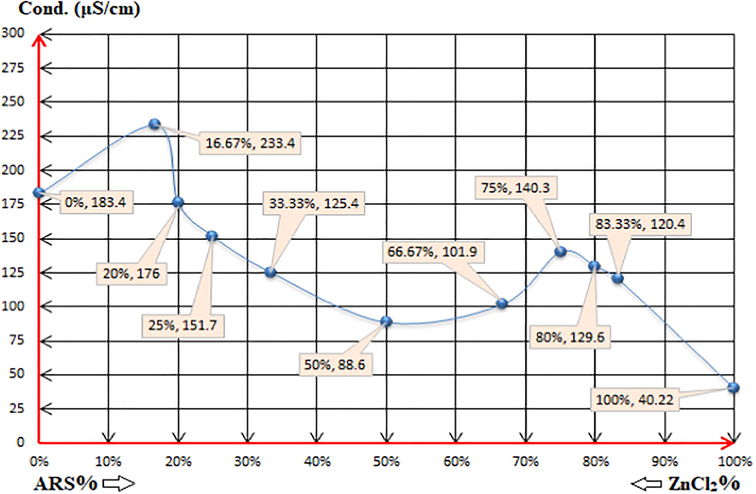
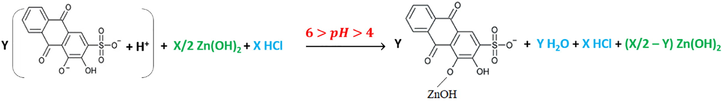
Fig 9 as electro-conductivity method reveals more accuracy than pH-metric method to either interpret the reasons behind the statuses of the mixtures at some points or to confirm the same. For the first five mixtures namely (1:5), (1:4), (1:3), (1:2) and (1:1), the conductivity decreases with the decrease of the zinc chloride percentage and with the increase of ARS per cent. This process confirms reactions (4) and (5) until (1:1) stoichiometry at which reaction (6) is provided to be the dominant one in this case. Thereafter, ARS contributes more to the conductivity value of the mixture with the increase of its percentage, which causes the increase in the conductivity as long as there is no more sufficient molecules of zinc hydroxide to react with. Hence, ARS ions confer more protons from the first displacement of their (-OH)-groups according to reaction (7), increasing the conductivity of (2:1) and (3:1) mixtures. The accuracy is revealed when studying the following-up mixtures; (4:1) and (5:1). The conductivity starts to decrease again although the percentage of ARS increases, and this is the proof of the suppression of the first displacement of ARS in which it begins to initiate its functionality partially. This implementation of that partial inhibition is due to the unsuitability of the pH value, which is intrinsically required to induce that displacement reaction further. In other words, reaction (7) is likely to be a reversible reaction (16).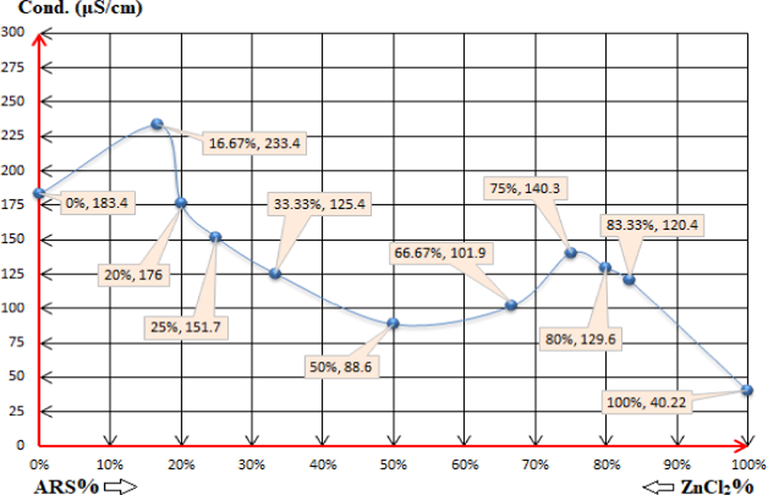
The electro-conductivity values of the solutions: (0%, 5.77): 4x10⁻³M ZnCl2 0.5ml + 79.5ml DI water. (16.67%, 5.4) (1:5): 4x10⁻³M ARS 0.5ml + 4x10⁻³M ZnCl2 2.5ml + 77ml DI water. (20%, 5.77) (1:4): 4x10⁻³M ARS 0.5ml + 4x10⁻³M ZnCl2 2ml + 77.5ml DI water. (25%, 5.8) (1:3): 4x10⁻³M ARS 0.5ml + 4x10⁻³M ZnCl2 1.5ml + 78ml DI water. (33.33%, 5.83) (1:2): 4x10⁻³M ARS 0.5ml + 4x10⁻³M ZnCl2 1ml + 78.5ml DI water. (50%, 6) (1:1): 4x10⁻³M ARS 0.5ml + 4x10⁻³M ZnCl2 0.5ml + 79ml DI water. (66.67%, 5.77) (2:1): 4x10⁻³M ARS 1ml + 4x10⁻³M ZnCl2 0.5ml + 78.5ml DI water. (75%, 5.1) (3:1): 4x10⁻³M ARS 1.5ml + 4x10⁻³M ZnCl2 0.5ml + 78ml DI water. (80%, 4.61) (4:1): 4x10⁻³M ARS 2ml + 4x10⁻³M ZnCl2 0.5ml + 77.5ml DI water. (83.33%, 4.06) (5:1): 4x10⁻³M ARS 2.5ml + 4x10⁻³M ZnCl2 0.5ml + 77ml DI water. (100%, 4.57): 4x10⁻³M ARS 0.5ml + 79.5ml DI water.
3.1.4 The indications of the electroconductivity titrimetric and volumetric-oscillographs (VOG) (fingerprint spectrums) of the solutions and mixtures of ARS and zinc chloride
As it can be seen from Figs. 10a and 10b, when there is Zn(OH)2 in the solution, the fluctuations of the mixtures’ electroconductivity increases depending on the concentrations of the both species; ARS and Zn(OH)2. Also, when both species are close in concentration to each other, there are clear fluctuations at the equivalence points. That means ARS restrains the fluctuations when it has more concentration in the solution, and even when it has less concentrations, it prevents the electroconductivity from being disturbed the way it is when having only ZnCl2 solution. This is a good sign that ARS firstly increases the conductivity and secondly plays a stabilization role. On the other hand, comparing the fluctuations when both species have the same concentration as in curves 9 and 10 with other curves, the strength of these two curves’ fluctuations is due to the clear start of the separation between two equivalence points as it is shown from curve 10 in Fig. 5, but they are still close to each other. Another reason for that, as it has been discussed earlier from curves 9, 11 and 13 in Fig. 5, is that there is no complex formation before or near the two equivalence points along with having these two points still close to each other. Forming a complex gives more stability to the curve in such cases.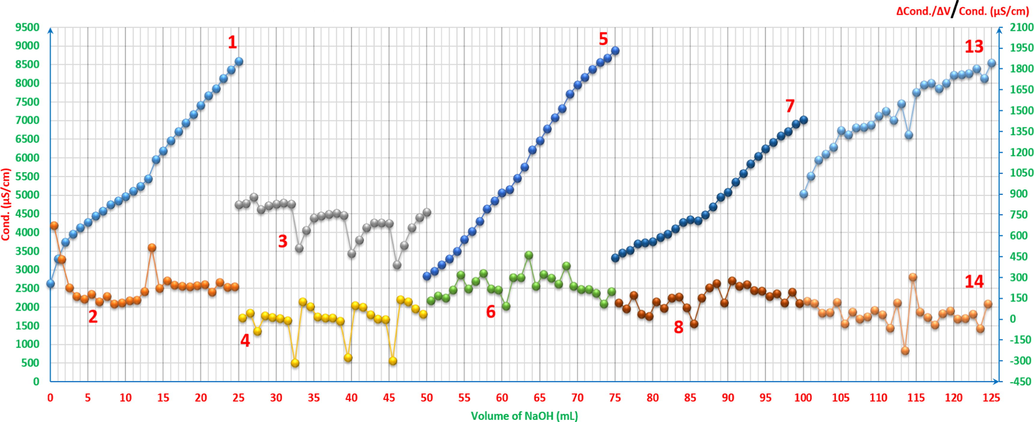
Electroconductivity titrimetric graphs of ARS, ZnCl2 and their mixtures vs. 0.01M NaOH with the first derivatives: 1 and 2: 4x10⁻³M ARS 25ml. 3 and 4: 4x10⁻³M ZnCl2 25ml. 5 and 6: 4x10⁻³M ZnCl2 5ml with 4x10⁻³M ARS 20ml. 7 and 8: 4x10⁻³M ZnCl2 10ml with 4x10⁻³M ARS 15ml. 13 and 14: 4x10⁻³M ZnCl2 20ml with 4x10⁻³M ARS 5ml. The curves (3-8, 13, 14) are extracted after adding 25 to each value of the horizontal axis (volume axis) consecutively. The curves 3 and 13 are of the secondary axis on the right.

Electroconductivity titrimetric curves of ARS, ZnCl2 and their mixtures vs. 0.01M NaOH with the first derivatives: 9 and 10: 4x10⁻³M ZnCl2 12.5ml with 4x10⁻³M ARS 12.5ml. 11 and 12: 4x10⁻³M ZnCl2 15ml with 4x10⁻³M ARS 10ml. The curves (11, 12) are extracted after adding 25 to each value of the horizontal axis (volume axis) consecutively.
For a complete study of what happens in the solutions while electroconductotitrating against the hydroxide, the second derivatives offer stunning information that push towards higher level of interpretations. The peaks areas have been marked and named to start the analysis process as it is shown in Figs. 11a and 11b. Some rules have been set to understand the plots and to explain the line-graphs in clear and stable way. The small peaks (fluctuations) have to be more than 300 as a difference between the bottom values of the peaks and their top values; Δ(ΔCond.)/ΔV2 > 300, to be considered as either a new formation of a new species that can affect the conductivity in obvious way or as an equivalence point, otherwise; Δ(ΔCond.)/ΔV2 ≤ 300, it is indicated as pKa for weak acids or the start of forming new species that can be formed in different stages or forms later on, or it is the finish of the titration when the solution has accumulated amount of the hydroxide and the pH value is above 10. Curve 1 shows three significant areas of changes, where a is indicated at approximately 4-6mL of the hydroxide to be the pKa of ARS, the second area b is where ARS is completely titrated and c is where the titration finishes due to the accumulation of hydroxide species. Curve 2 has four areas. Starting with area a, this indicates to the initiation stage of Zn(OH)x which slightly drops the electroconductivity and makes small fluctuations in the curve. Hence, when it reaches to area b and c, here comes the stage of the clear Zn chemistry to form the hydroxide in different forms, where white gelatinous zinc hydroxides precipitate as in Fig. 12.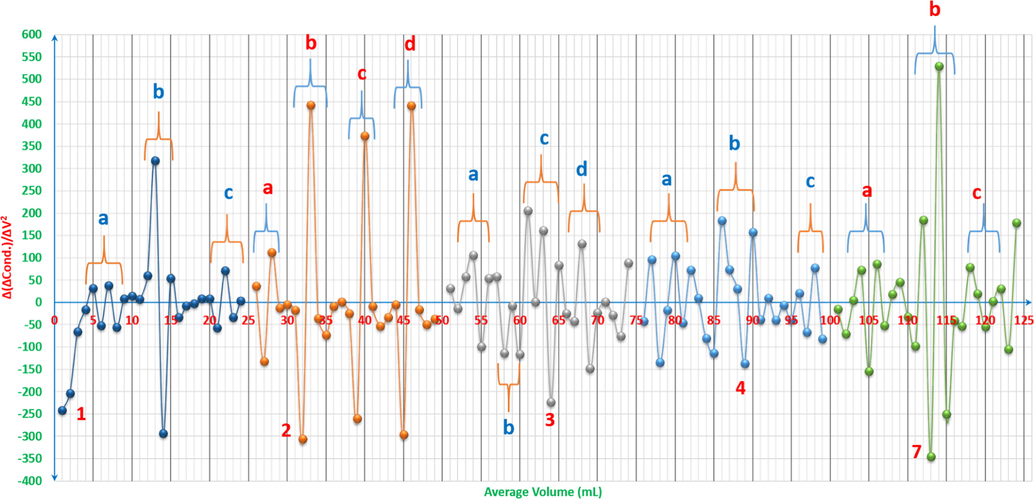
Volumetric-oscillographs (VOGs) (fingerprint spectrums) of ARS, ZnCl2 and their mixtures vs. 0.01M NaOH: 1: 4x10⁻³M ARS 25ml. 2: 4x10⁻³M ZnCl2 25ml. 3: 4x10⁻³M ZnCl2 5ml with 4x10⁻³M ARS 20ml. 4: 4x10⁻³M ZnCl2 10ml with 4x10⁻³M ARS 15ml. 7: 4x10⁻³M ZnCl2 20ml with 4x10⁻³M ARS 5ml. The curves (3-4, 7) are extracted after adding 25 to each value of the horizontal axis (volume axis) consecutively.
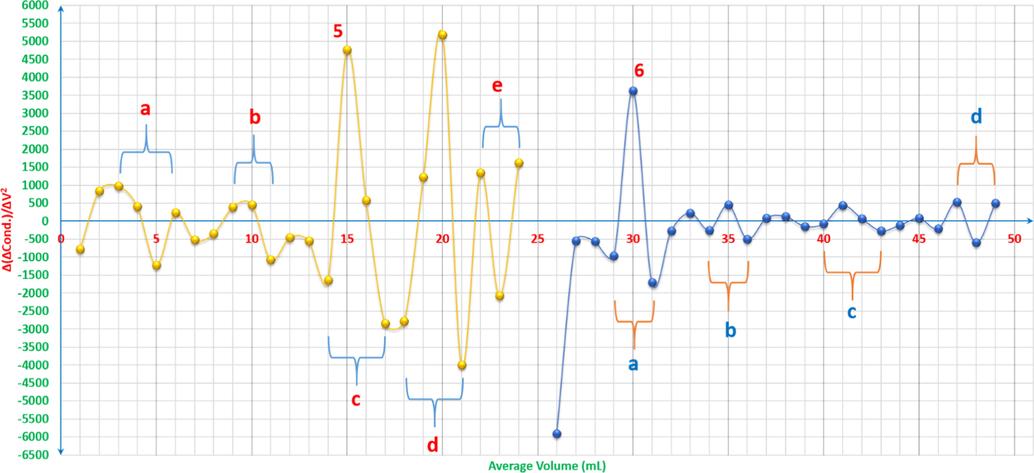
Volumetric-oscillographs (VOG) (fingerprint spectrum) of ARS, ZnCl2 and their mixtures vs. 0.01M NaOH: 5: 4x10⁻³M ZnCl2 12.5ml with 4x10⁻³M ARS 12.5ml. 6: 4x10⁻³M ZnCl2 15ml with 4x10⁻³M ARS 10ml. The curve 6 is extracted after adding 25 to each value of the horizontal axis (volume axis) consecutively.
Interpretation of volumetric-oscillograph (VOG) (fingerprint spectrum) of 4x10⁻³M ZnCl2 25ml vs. 0.01M NaOH.
It is assumed that the reaction with the increase of the hydroxide concentration has two formation paths according to reaction (17).
The final area d is for the complete titration of HCl resulted from dissolving ZnCl2 in DI water.
Curve 3 has four regions, where area a refers to the pKa of ARS in which the salt ARSZnOH is formed, whereas area b is where the initiation stage of Zn(OH)x and ARSZnOH complexes nearer to the neutral medium are preferable. Thereafter, area c is indicated to be the area of the complete titration of the mixture; both HCl and ARS. With increasing the concentration of the hydroxide, area d shows where [Zn(OH)4]2- complexes and the salt ARSZn are formed. Area a of curve 4 that has three regions indicates to the pKa of ARS in which the salt ARSZnOH is formed, beside the initiation stage of Zn(OH)x and ARSZnOH complexes nearer to the neutral medium, whilst area b is assumed to be the area of the complete titration of the mixture; both HCl and ARS, where also the salt ARSZn starts to be formed. Up to area c, [Zn(OH)4]2- complexes and the accumulation of NaOH access at the end of the titration are the major species. pKa of ARS, the formation of the salt ARSZnOH and the initiation stage of Zn(OH)x complexes are indicated to be at the area a in curve 4, whereas the complete titration of the mixture; both HCl and ARS, is assumed to be at the area b. [Zn(OH)4]2- complexes and the accumulation of NaOH access at the end of the titration are the major species where it is indicated as area c. In curve 7, area a is the region in which ARS is completely titrated, the initiation stage of Zn(OH)x complexes and the formation of the salt ARSZn, while area b is of the complete titration of HCl and the formation of [Zn(OH)4]2- complexes and the salt ARSZn. The accumulation of [Zn(OH)4]2- complexes and NaOH access are referred to be at are c.
As it is shown in Fig. 11b, curves 5 and 6 are divided to five and four areas respectively, where areas a refer to pKa of ARS and the formation of the salt ARSZnOH in higher concentrations than those of other curves and that is the reason behind Δ(ΔCond.)/ΔV2 > 300, and this applies on all areas in curves 5 and 6, whilst areas b are of the complete titration of ARS, and areas c are referred to be the complete titration of HCl. Clear formation of [Zn(OH)4]2- complexes with higher concentrations at area d in curve 5 is exhibited, whilst the accumulation of [Zn(OH)4]2- complexes and NaOH access are referred to be at areas e and d in curves 5 and 6 respectively.
As it can been seen from Fig. 13, the temperature titrimetric curves can interpret what happens in the solutions. These are some examples of the temperature-oscillotitrimetric curves. However, from method to another, the details and information provided differ in their amounts.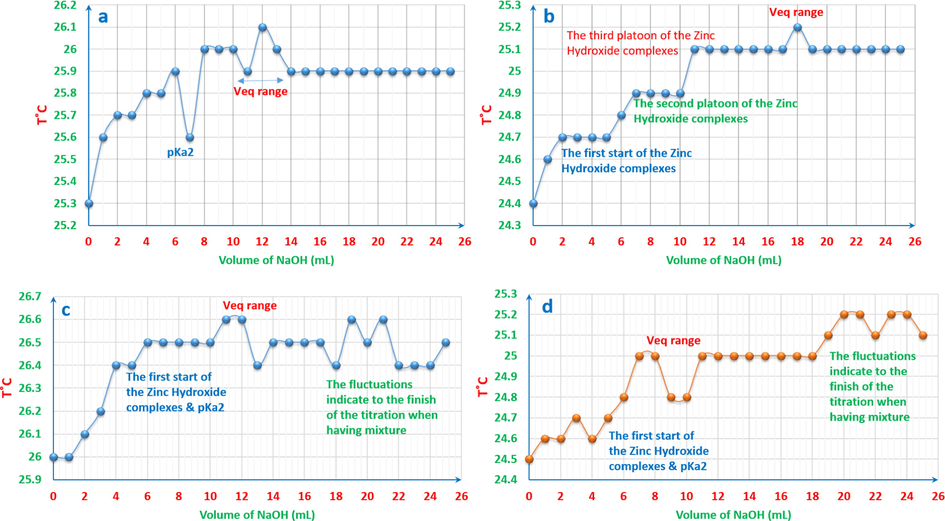
Temperature-oscillotitrimetric graphs of ARS, ZnCl2 and their mixtures vs. 0.01M NaOH: a: 4x10⁻³M ARS 25ml. b: 4x10⁻³M ZnCl2 25ml. c: 4x10⁻³M ZnCl2 5ml with 4x10⁻³M ARS 20ml. d: 4x10⁻³M ZnCl2 10ml with 4x10⁻³M ARS 15ml.
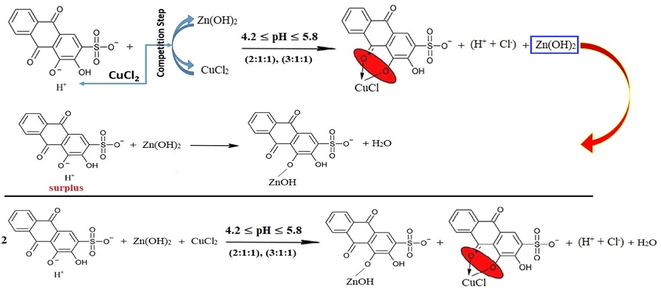
3.1.5 The indications of the pH values in studying the competition between copper and zinc ions to chelate with ARS simultaneously
For the first three mixtures (1:5:5), (1:4:4) and (1:3:3), the predominant reaction could be elicited as follows:
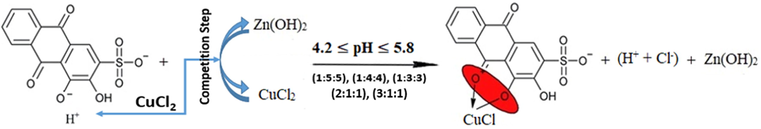
The range of the pH values of all the mixtures is [4.37-5.32] as it is shown in Fig. 14, and that is suitable for the first displacement of the first (-OH)-group of ARS where the range [4.2-5.8] of pH is the considered one for this reaction. Also, since the pH value debilitates for the first bunch of mixtures, it seems that copper chloride ions react with ARS- to form the complex rather than zinc chloride ions. The overall reaction is, therefore, as per reaction (18).
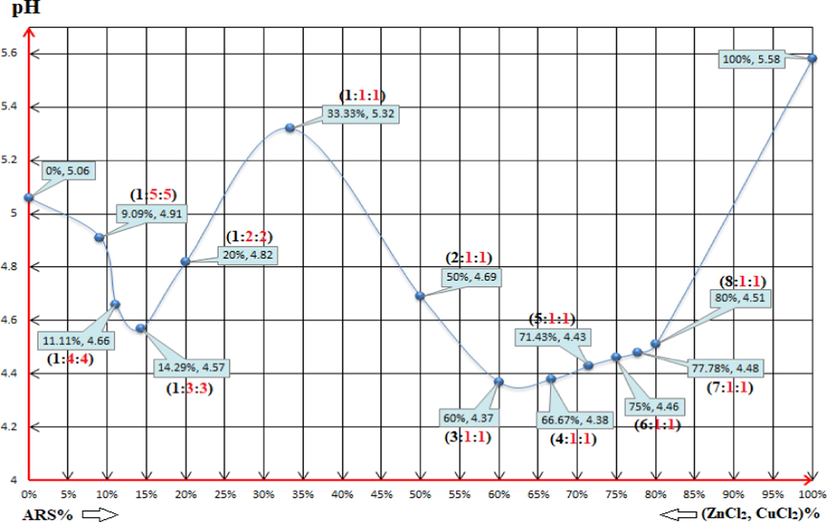
The pH values of the following solutions: (0%, 5.06): 4x10⁻³M ZnCl2 0.5ml + 4x10⁻³M CuCl2 0.5ml + 79ml DI water. (9.09%, 4.91) (1:5:5): 4x10⁻³M ARS 0.5ml + 4x10⁻³M ZnCl2 2.5ml + 4x10⁻³M CuCl2 2.5ml + 74.5ml DI water. (11.11%, 4.66) (1:4:4): 4x10⁻³M ARS 0.5ml + 4x10⁻³M ZnCl2 2ml + 4x10⁻³M CuCl2 2ml + 75.5ml DI water. (14.29%, 4.57) (1:3:3): 4x10⁻³M ARS 0.5ml + 4x10⁻³M ZnCl2 1.5ml + 4x10⁻³M CuCl2 1.5ml + 76.5ml DI water. (20%, 4.57) (1:2:2): 4x10⁻³M ARS 0.5ml + 4x10⁻³M ZnCl2 1ml + 4x10⁻³M CuCl2 1ml + 77.5ml DI water. (33.33%, 5.32) (1:1:1): 4x10⁻³M ARS 0.5ml + 4x10⁻³M ZnCl2 0.5ml + 4x10⁻³M CuCl2 0.5ml + 78.5ml DI water. (50%, 4.69) (2:1:1): 4x10⁻³M ARS 1ml + 4x10⁻³M ZnCl2 0.5ml + 4x10⁻³M CuCl2 0.5ml + 78ml DI water. (60%, 4.37) (3:1:1): 4x10⁻³M ARS 1.5ml + 4x10⁻³M ZnCl2 0.5ml + 4x10⁻³M CuCl2 0.5ml + 77.5ml DI water. (66.67%, 4.38) (4:1:1): 4x10⁻³M ARS 2ml + 4x10⁻³M ZnCl2 0.5ml + 4x10⁻³M CuCl2 0.5ml + 77ml DI water. (71.43%, 4.43) (5:1:1): 4x10⁻³M ARS 2.5ml + 4x10⁻³M ZnCl2 0.5ml + 4x10⁻³M CuCl2 0.5ml + 76.5ml DI water. (75%, 4.46) (6:1:1): 4x10⁻³M ARS 3ml + 4x10⁻³M ZnCl2 0.5ml + 4x10⁻³M CuCl2 0.5ml + 76ml DI water. (77.78%, 4.48) (7:1:1): 4x10⁻³M ARS 3.5ml + 4x10⁻³M ZnCl2 0.5ml + 4x10⁻³M CuCl2 0.5ml + 75.5ml DI water. (80%, 4.51) (8:1:1): 4x10⁻³M ARS 4ml + 4x10⁻³M ZnCl2 0.5ml + 4x10⁻³M CuCl2 0.5ml + 75ml DI water. (100%, 5.58): 4x10⁻³M ARS 0.5ml + 79.5ml DI water. Where (L:M:M) = (ARS:Zn:Cu).
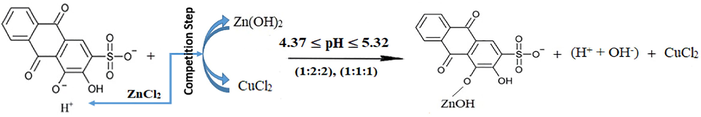
For the following two mixtures (1:2:2) and (1:1:1), the pH values are again suitable for the first displacement of the first (-OH)-group of ARS. However, since the pH value increases for these two mixtures and the pH values are not suitable for the formation of the complex between zinc and ARS, zinc chloride ions react with ARS- to form the salt and not the complex rather than having copper chloride ions reacting instead. The overall reaction is, therefore, as per reaction (19).
For the following two mixtures (2:1:1) and (3:1:1), the pH values are still suitable for the first displacement of the first (-OH)-group of ARS. However, since the pH value decreases for these two mixtures and the pH values are suitable for the complex formation between copper and ARS, copper ions again intervene the competition step to outdo zinc ions and react with ARS- to form the complex. The overall reaction is, thus, as per reaction (18).
On the other hand, the surplus ions of ARS can in this case have another overall suggested reaction. First, after the reaction of copper ions with ARS-, the competition step is stopped and it is the time for zinc ions to react with the surplus ions of ARS- to form the salt ARSZnOH. Hence, the process can be written as in reaction (20).
As the competition process supposes its own conditions, different than normal conditions that are required for chelation step, the suggestions of the stoichiometry can be also different. Therefore, beginning from the added stoichiometry (3:1:1) to form the mixture, the ultimate or secondary triumphant reactions might be different as well. To this point, in accordance with the decrease or increase of the pH value of a certain bunch of mixtures, it can be pointed out which one is the preponderant reaction that takes place at first. For further explication, the stoichiometry (3:1:1) has the overflowing ions of ARS. Therefore, there are many suggestions to this case. First, the surplus of ARS reacts with ARSCuCl as a complex with the stoichiometry of (2:1):(L:M). Hence, the suggested reaction can be written as in reaction (21).
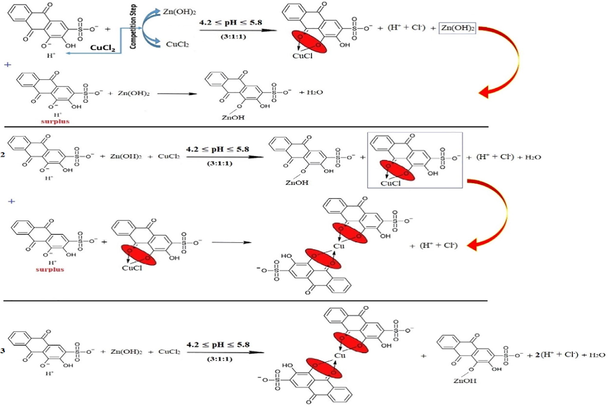
Second, the surplus of ARS reacts with ARSZnOH as a salt with the stoichiometry of (2:1):(L:M) since the pH value is not sufficient to form a complex. This can be expressed as in reaction (22).
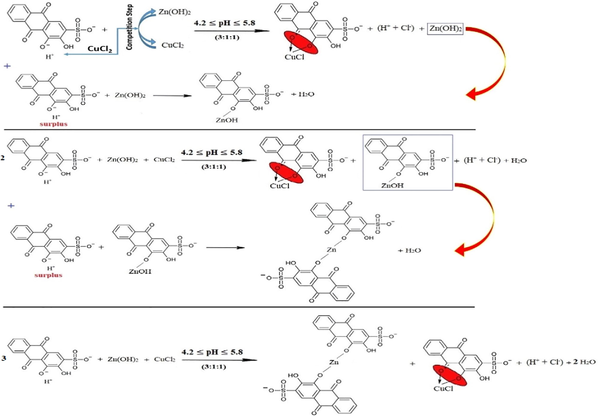
Third, the surplus of ARS reacts with both ARSCuCl and ARSZnOH equally with the stoichiometry of (2:1) for the half of ions of each kind of the metals as in reaction (23).
Fourth, the stoichiometry (1:1:1) is stable and fixed for each kind of metals, and the excess of ARS ions only displaces the first (-OH)-group as in reaction (24).
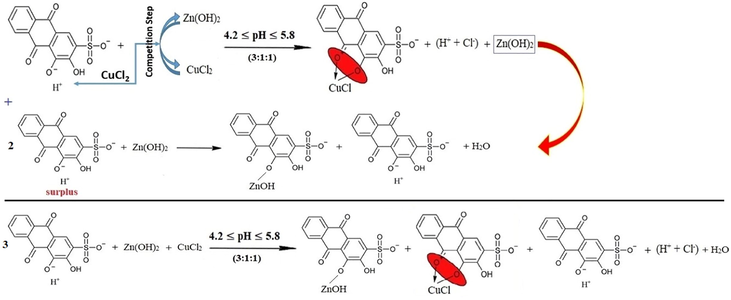
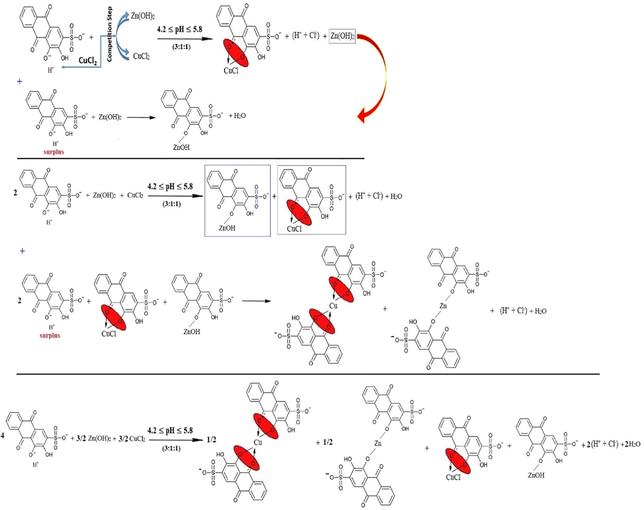
The mixtures (4:1:1), (5:1:1), (6:1:1), (7:1:1) and (8:1:1) confirm that the last suggestion is the correct one since the increase in the ARS volume tries to shift the pH value of these mixtures to the pH value that is sufficient for the first displacement of the first (-OH)-group. Hence, the pH shifts to a value that is related to the case when considerably having only ARS ions in the solution as their volume increases each time. Therefore, the reactions can be referred to as in reaction (25) with respect to the stoichiometry accordingly.

3.1.6 The indications of the electro-conductivity values in studying the competition between copper and zinc ions to bond with ARS simultaneously
As it is exhibited in Fig. 15, for the first five mixtures; (1:5:5) - (1:1:1), the amount of both CuCl2 and ZnCl2 decreases and causes the decrease in the electroconductivity value as the number of the electrolytic-active ions is reduced. As normally the fact has been justified as per the previous reasons, the indication of the electro-conductivity remains away from explaining the reactions apparently happening in the mixtures. The competition process starts to appear for the next mixtures. Beginning with looking at (2:1:1) and (3:1:1) mixtures, the electroconductivity increases, and this indicates that the competition process now takes place in which copper is bound with ARS since the products are HCl ions that are responsible for the increase of the electroconductivity. That is fully compatible with what has been found in pH-metery and showing the efficacious reaction to the value of the electroconductivity, and that is as in reaction (18). Although the suggested reactions as in pH-metery remain the same, the before mentioned reaction and the first displacement of ARS are the responsible reactions of the increase in the electroconductivity value. At the conclusion, the reaction is as per reaction (25).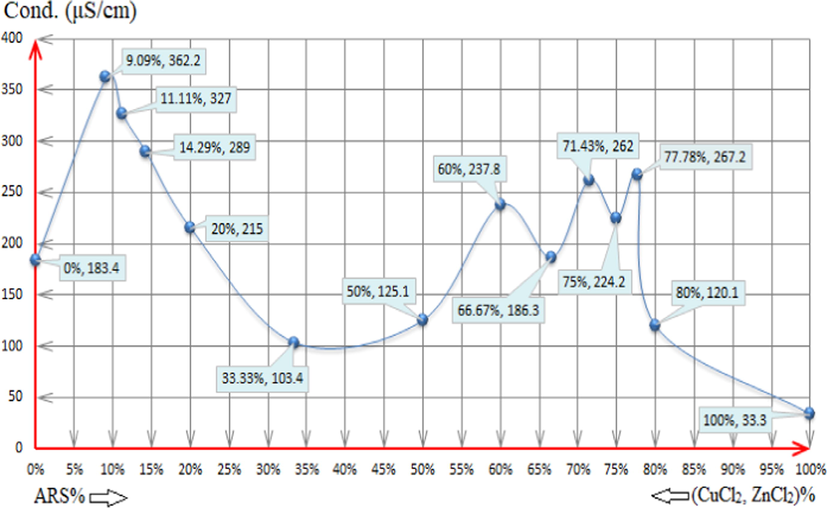
The electro-conductivity values of the following solutions: (0%, 183.4): 4x10⁻³M ZnCl2 0.5ml + 4x10⁻³M CuCl2 0.5ml + 79ml DI water. (9.09%, 362.2) (1:5:5): 4x10⁻³M ARS 0.5ml + 4x10⁻³M ZnCl2 2.5ml + 4x10⁻³M CuCl2 2.5ml + 74.5ml DI water. (11.11%, 327) (1:4:4): 4x10⁻³M ARS 0.5ml + 4x10⁻³M ZnCl2 2ml + 4x10⁻³M CuCl2 2ml + 75.5ml DI water. (14.29%, 289) (1:3:3): 4x10⁻³M ARS 0.5ml + 4x10⁻³M ZnCl2 1.5ml + 4x10⁻³M CuCl2 1.5ml + 76.5ml DI water. (20%, 215) (1:2:2): 4x10⁻³M ARS 0.5ml + 4x10⁻³M ZnCl2 1ml + 4x10⁻³M CuCl2 1ml + 77.5ml DI water. (33.33%, 103.4) (1:1:1): 4x10⁻³M ARS 0.5ml + 4x10⁻³M ZnCl2 0.5ml + 4x10⁻³M CuCl2 0.5ml + 78.5ml DI water. (50%, 125.1) (2:1:1): 4x10⁻³M ARS 1ml + 4x10⁻³M ZnCl2 0.5ml + 4x10⁻³M CuCl2 0.5ml + 78ml DI water. (60%, 237.8) (3:1:1): 4x10⁻³M ARS 1.5ml + 4x10⁻³M ZnCl2 0.5ml + 4x10⁻³M CuCl2 0.5ml + 77.5ml DI water. (66.67%, 186.3) (4:1:1): 4x10⁻³M ARS 2ml + 4x10⁻³M ZnCl2 0.5ml + 4x10⁻³M CuCl2 0.5ml + 77ml DI water. (71.43%, 262) (5:1:1): 4x10⁻³M ARS 2.5ml + 4x10⁻³M ZnCl2 0.5ml + 4x10⁻³M CuCl2 0.5ml + 76.5ml DI water. (75%, 224.2) (6:1:1): 4x10⁻³M ARS 3ml + 4x10⁻³M ZnCl2 0.5ml + 4x10⁻³M CuCl2 0.5ml + 76ml DI water. (77.78%, 267.2) (7:1:1): 4x10⁻³M ARS 3.5ml + 4x10⁻³M ZnCl2 0.5ml + 4x10⁻³M CuCl2 0.5ml + 75.5ml DI water. (80%, 120.1) (8:1:1): 4x10⁻³M ARS 4ml + 4x10⁻³M ZnCl2 0.5ml + 4x10⁻³M CuCl2 0.5ml + 75ml DI water. (100%, 33.3): 4x10⁻³M ARS 0.5ml + 79.5ml DI water. Where (L:M:M) = (ARS:Zn:Cu).
The next volumetric stoichiometries; (4:1:1), (5:1:1), (6:1:1), (7:1:1) and (8:1:1), show the competition again. In these mixtures, new phenomenon starts to take place in which copper and zinc compete each other differently according to whether there is odd volumetric stoichiometry of ARS or even. Given that, for even stoichiometries; (4:1:1), (6:1:1) and (8:1:1), zinc competes copper to bond with ARS, and the only suggestion that can interpret this case of having these values of the electroconductivity is as in reaction (22). Copper competes zinc for odd stoichiometries; (5:1:1) and (7:1:1), in which this case turns the scale to have the suggested reaction (21) due to having more (H+ + Cl-) in the solution which can explicate having higher electro-conductivity values.
Obviously, the insulations given in the electroconductivity method are different than those in pH-metric method, especially for the last five mixtures as presented lately. The reason beyond that is that the latter does not seem to sense the difference between having more (H+ + Cl-) besides (H+) and having (H+) only in terms of low concentrations, whilst the electroconductivity method sensed those nuances and to some extent suggested certain reactions for each later and particular mixtures.
3.1.7 The indications of the pH-titrimetric, pH-oscillotitrimetric (pHOT) and volumetric-oscillo graphs (VOG) in studying the competition between copper and zinc ions to chelate with ARS simultaneously
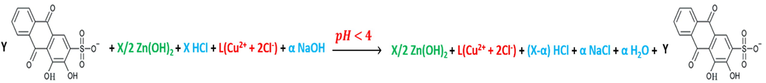
As it is shown in Fig. 16, the pH curve exhibits two leaps. To examine the reason behind these two leaps, reactions (26) and (27) are taken into consideration.
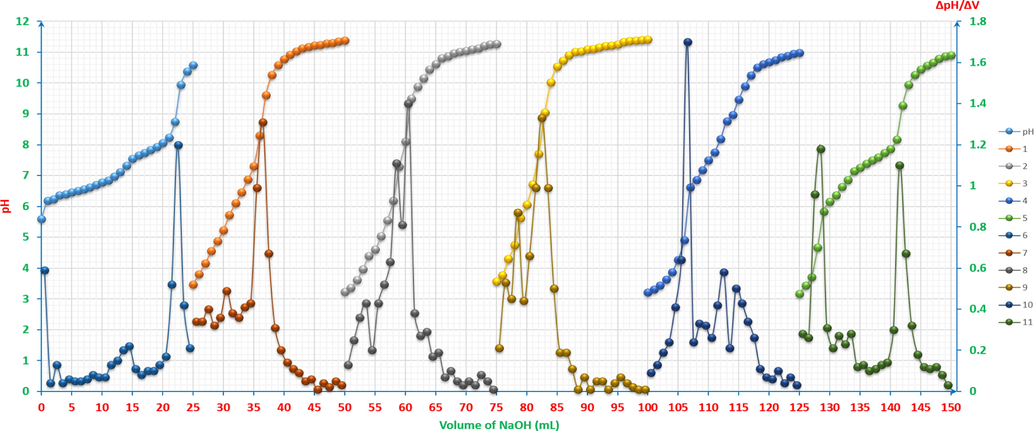
pH-titrimetric curves of ARS, ZnCl2, CuCl2 and their mixtures vs. 0.01M NaOH with the first derivatives: pH and 6: 4x10⁻³M ZnCl2 12.5ml with 4x10⁻³M CuCl2 12.5ml. 1 and 7: 4x10⁻³M ZnCl2 2.5ml and 4x10⁻³M CuCl2 2.5ml with 4x10⁻³M ARS 20ml. 2 and 8: 4x10⁻³M ZnCl2 5ml and 4x10⁻³M CuCl2 5ml with 4x10⁻³M ARS 15ml. 3 and 9: 4x10⁻³M ZnCl2 6.25ml and 4x10⁻³M CuCl2 6.25ml with 4x10⁻³M ARS 12.5ml. 4 and 10: 4x10⁻³M ZnCl2 7.5ml and 4x10⁻³M CuCl2 7.5ml with 4x10⁻³M ARS 10ml. 5 and 11: 4x10⁻³M ZnCl2 10ml and 4x10⁻³M CuCl2 10ml with 4x10⁻³M ARS 5ml. The curves (2-11) are extracted after adding 25 to each value of the horizontal axis (volume axis) consecutively.
Even in case when CuCl2 reacts with water as hydrolysis reaction as follows: (Cu2+ + 2Cl-) + H2O ↔ (Cu2+ + 2OH-) + HCl, and then the products react with NaOH as the following: HCl + NaOH → NaCl + H2O, the overall assumption would be having either the chloride salts with the products of neutralisation reactions resulting in from the reaction between hydrochloric acid and sodium hydroxide or only the products of neutralisation reactions. That most probably leads to that the neutralisation reaction of HCl is the prevalent one in this medium. Therefore, the expected leaps’ number of the titrimetric curve must be only one. From another angle, the Gran plot of the first heap cannot be accurate at any calculations as it is shown in Fig. 17, Gran plot 1-a, and having 1-2 points as a neck of leap is not sufficient to be considered as a valuable leap. From these perspectives, it has been discovered throughout this study that there could be Pseudo-leaps in such cases when having a mixture to be titrated. The second leap is the expected actual one, as it is shown in Fig. 17, Gran plot 1-b. According to the previous observations, and by taking into account the first derivative, the new rule for the leap to be considered is that the following condition has to be fulfilled: ΔpH ≥ 0.4, between the pervious point, that is the nearest to the peak climax, and the utmost point itself. Also, in case of any doubt about the peaks, that are adjacent, to be considered in any first derivative curve, the previous and sequence mixtures curves in the studied samples series have to be taken into account. Therefore, if the previous and next curves have peaks get to be separated in the latest one, these overlapped peaks has to be considered as two peaks, e. g. the peaks in curves 8 and 9 in Fig. 16, they are considered as one peak otherwise, e.g. the second overlapped peaks in curve 10 in Fig. 16.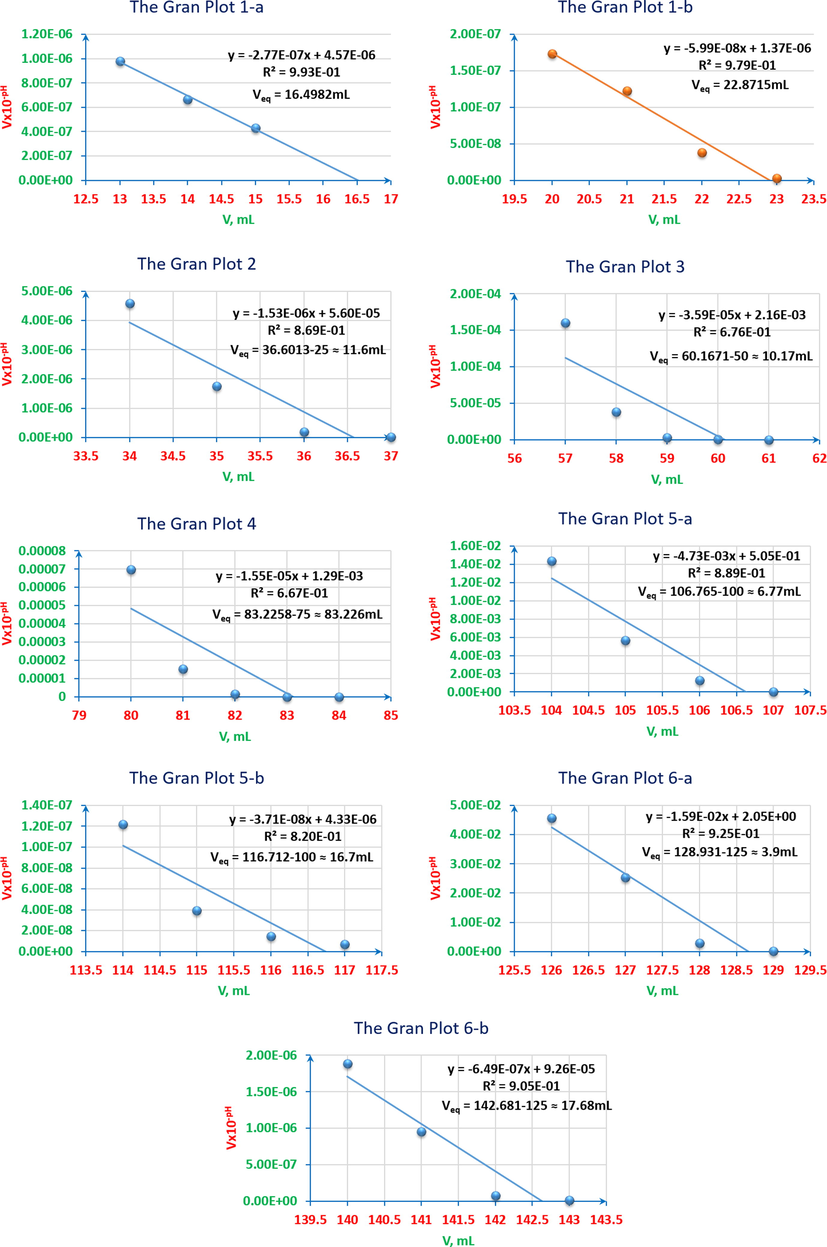
pH-titrimetric curves’ Gran plots of ARS, ZnCl2, CuCl2 and their mixtures vs. 0.01M NaOH. 1-a: the first equivalence point of 4x10⁻³M ZnCl2 12.5ml with 4x10⁻³M CuCl2 12.5ml (pseudo-leap). 1-b: the second equivalence point of 4x10⁻³M ZnCl2 12.5ml with 4x10⁻³M CuCl2 12.5ml. 2: 4x10⁻³M ZnCl2 2.5ml and 4x10⁻³M CuCl2 2.5ml with 4x10⁻³M ARS 20ml. 3: 4x10⁻³M ZnCl2 5ml and 4x10⁻³M CuCl2 5ml with 4x10⁻³M ARS 15ml. 4: 4x10⁻³M ZnCl2 6.25ml and 4x10⁻³M CuCl2 6.25ml with 4x10⁻³M ARS 12.5ml. 5-a: the first equivalent point of 4x10⁻³M ZnCl2 7.5ml and 4x10⁻³M CuCl2 7.5ml with 4x10⁻³M ARS 10ml. 5-b: the second equivalent point of 4x10⁻³M ZnCl2 7.5ml and 4x10⁻³M CuCl2 7.5ml with 4x10⁻³M ARS 10ml. 6-a: the first equivalent point of 4x10⁻³M ZnCl2 10ml and 4x10⁻³M CuCl2 10ml with 4x10⁻³M ARS 5ml. 6-b: the second equivalent point of 4x10⁻³M ZnCl2 10ml and 4x10⁻³M CuCl2 10ml with 4x10⁻³M ARS 5ml.
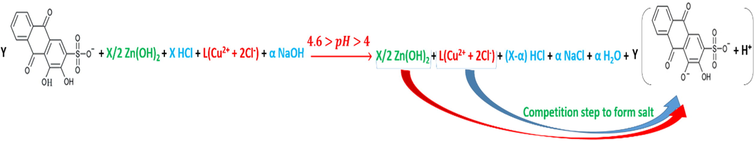
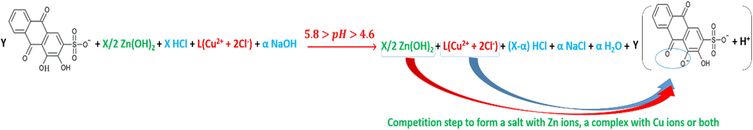
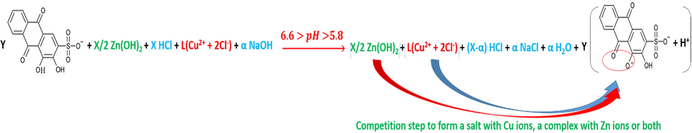
The reactions in accordance with the different pH mediums; pH < 4, 4.6 > pH > 4, 5.8 > pH > 4.6, 6.6 > pH > 5.8, 13 > pH > 7.5, are as per reactions (28), (29), (30), (31) and (32).

In order to understand the analysis of these graphs, Fig. 18 represents pHOT graphs that show more precision in the determination of the number of titration leaps. For graphs 1 and 2, there is only one leap for each (a and b respectively), whereas there are two leaps (a and b) for each graph of 3, 4, 5 and 6. Therefore, as a mixture solution of two metals and a dye, some distinguished rules have to be conceived, knowing that the anterior established rules are considered. First, the leap’s direction has to start from the positive section to the negative one; for example, the start of graph 3. Second, the graph cannot be read as a taken into account leap at its start; for instance, as in graph 4. Third, taking into account the subsequent graph and comparing the numbers of the concerned-graph’s leaps with those of the other; for example, the last leap of graph 5 seems to be as two leaps, it is rather one leap when compared with the posterior graph, which is graph 6.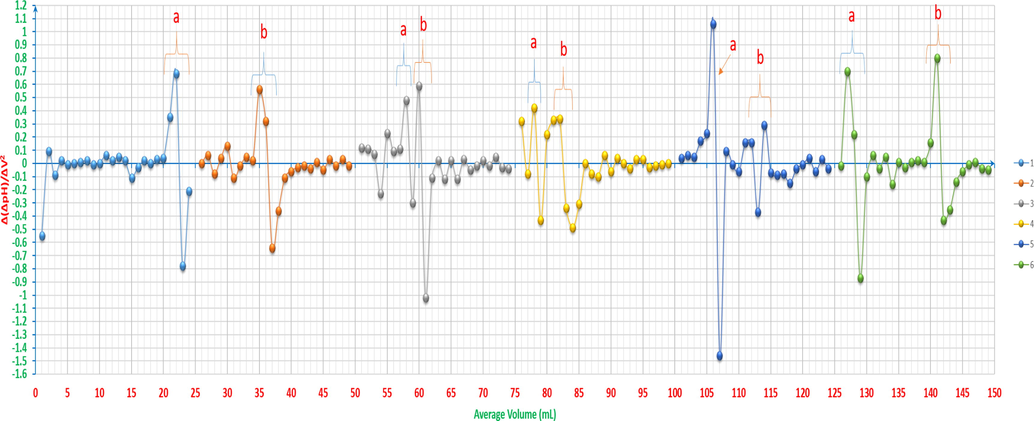
pH-oscillotitrimetric graphs of ARS, ZnCl2, CuCl2 and their mixtures vs. 0.01M NaOH: 1: 4x10⁻³M ZnCl2 12.5ml with 4x10⁻³M CuCl2 12.5ml. 2: 4x10⁻³M ZnCl2 2.5ml and 4x10⁻³M CuCl2 2.5ml with 4x10⁻³M ARS 20ml. 3: 4x10⁻³M ZnCl2 5ml and 4x10⁻³M CuCl2 5ml with 4x10⁻³M ARS 15ml. 4: 4x10⁻³M ZnCl2 6.25ml and 4x10⁻³M CuCl2 6.25ml with 4x10⁻³M ARS 12.5ml. 5: 4x10⁻³M ZnCl2 7.5ml and 4x10⁻³M CuCl2 7.5ml with 4x10⁻³M ARS 10ml. 6: 4x10⁻³M ZnCl2 10ml and 4x10⁻³M CuCl2 10ml with 4x10⁻³M ARS 5ml. The curves (2-6) are extracted after adding 25 to each value of the horizontal axis (volume axis) consecutively.
For more complicated solutions that contain a dye as an organic compound and more than one metal, when using VOGs, the graphs can be informative to know their fluctuation and strength diagrams (VOGFSD). As it can be seen from Fig. 19, the fluctuations give the possible ratios that can be focused on to know the exact and correct correlation ratio. As it is shown, VOGFSD tends to be in a medial status for the suitable ratio, and the reason is that the formation of the complexes; for both Zn+2 and Cu+2, with ARS increases when the ratio is suitable for higher concentrations of these two formed complexes, where these formations influence the conductivity of the solution and force it to fluctuate in comparison with the previous and later ratios (1:1:3 and 1.5:1.5:2). On the other hand, the first and last ratios (1:1:8 and 2:2:1) have more fluctuation strength due to either the higher concentration of ARS or metals in the solution. It is worth mentioning that the first 25ml from the volume axis have been deleted for the mixture of 4x10⁻³M ZnCl2 12.5ml with 4x10⁻³M CuCl2 12.5ml in order to indicate that the device couldn’t measure the high conductivity of it during the titration.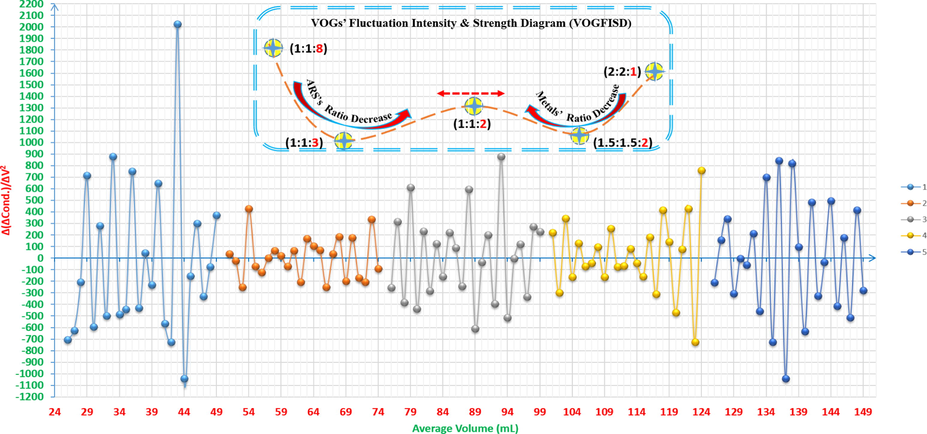
Volumetric-oscillographs (VOGs) of the mixtures of ARS, ZnCl2 and CuCl2 vs. 0.01M NaOH and their VOGs’ fluctuation intensity & strength diagram (VOGFISD): 1: 4x10⁻³M ZnCl2 2.5ml and 4x10⁻³M CuCl2 2.5ml with 4x10⁻³M ARS 20ml. 2: 4x10⁻³M ZnCl2 5ml and 4x10⁻³M CuCl2 5ml with 4x10⁻³M ARS 15ml. 3: 4x10⁻³M ZnCl2 6.25ml and 4x10⁻³M CuCl2 6.25ml with 4x10⁻³M ARS 12.5ml. 4: 4x10⁻³M ZnCl2 7.5ml and 4x10⁻³M CuCl2 7.5ml with 4x10⁻³M ARS 10ml. 5: 4x10⁻³M ZnCl2 10ml and 4x10⁻³M CuCl2 10ml with 4x10⁻³M ARS 5ml. The curves (1-5) are extracted after adding 25 to each value of the horizontal axis (volume axis) consecutively
4 Studying the correlation ratio using different methods
4.1 Studying the correlation ratio using pH/conductivity diagrams (pHCD) method
4.1.1 Studying the correlation ratio between Zn(II) and ARS using pH/conductivity diagrams (pHCD) method
Fig 20 shows the percentage of ZnCl2 and ARS in a series of samples as mixtures of 6x10⁻⁵M ARS and 6x10⁻⁵M Zn(II) and indicates to both graphs of pH and electroconductivity of the correct ratio in which Zn(II) and ARS are chelated. For the pH graph, the range is [5.58-5.97] and it is quite convenient for Zn+2 to bond with ARS forming the complex according to reaction (6). This means that Zn(II), when it is chelated at its most ratio, produces the largest amount of protons (H+) that can in its turn increase the acidity (lowers the pH value) of the solution to reach the lowest value (5.58) of the above mentioned pH range. Paradoxically, the electroconductivity seems to increase when the percentage reaches its correct ratio. That is justifiable as the protons increases to its utmost concentration resulted from the chelation process between ARS and Zn(II), where these protons are obviously electroactive species.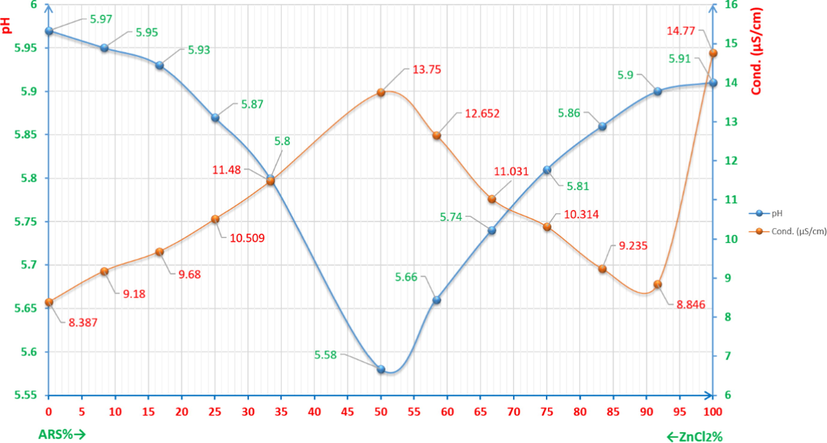
pH/conductivity diagrams (pHCD) for studying the correlation ratio between Zn(II) and ARS.
The interstitial obstruction (IO) has been presented in Fig. 21 when the concentration plays a major role for accurate readings of the conductivity. In addition, larger concentration than 6x10⁻⁵M would provide more acidity of the solution, which leads to the use of a buffer solution in order to maintain the pH value suitable for the chelation. However, IO cannot be eliminated even if a buffer solution is used.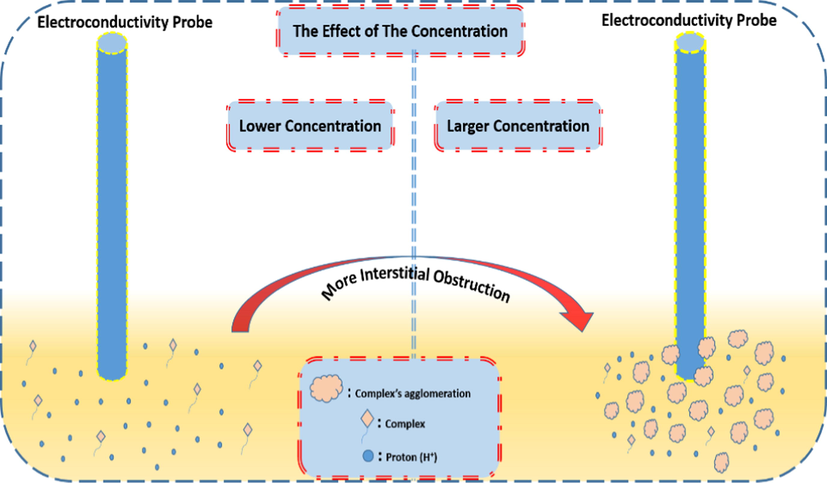
The effect of the concentration on the acidity and readings due to the formation of the agglomerations in case of higher concentrations than 6x10⁻⁵M.
4.1.2 Studying the correlation ratio between Zn(II) and ARS using electroconductivity diagrams (ECD) method
4.1.2.1 The effects of the additives’ order (EAO) on ECD
4.1.2.1.1 Adding 6x10⁻⁵M Zn(II) to 6x10⁻⁵M ARS
To determine the reaction stoichiometry, 6x10⁻⁵M ZnCl2 24ml has been consecutively added to 6x10⁻⁵M ARS 12ml dropwise, 1ml in each batch. The observed conductivities have been corrected using equation (33) (Ali et al., 2016) as it is shown in Fig. 22a.
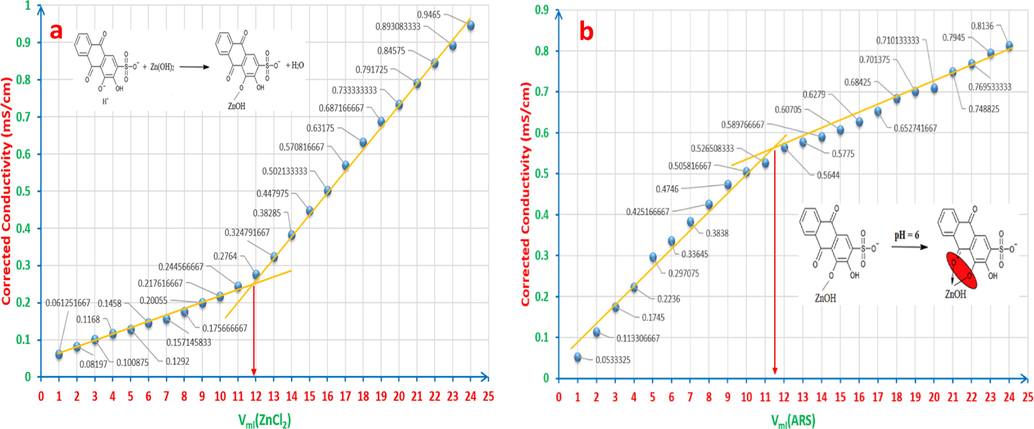
a: The correlation ratio when adding 6x10⁻⁵M ZnCl2 24ml to 6x10⁻⁵M ARS 12ml. b: The correlation ratio when adding 6x10⁻⁵M ARS 24ml to 6x10⁻⁵M ZnCl212ml.
For accurate observations and readings, pH values of ARS solution have been measured for every added ml of ZnCl2, where the range was [3.41-5.4]. This pH range confirms that the resulted reaction stoichiometry is not for the formation of the complex. It is rather for the formation of the salt as in reaction (5), which is (1:1).
4.1.2.1.2 Adding 6x10⁻⁵M ARS to 6x10⁻⁵M Zn(II)
In this experiment, the addition way has been reversed, where 6x10⁻⁵M ARS 24ml has been consecutively added to 6x10⁻⁵M ZnCl2 12ml, 1ml in each batch. Also, the observed conductivities have been corrected using equation (33) as it is exhibited in Fig. 22b. The pH range was [5.69-5.9] during carrying out this experiment, and this confirms the suitable medium for the complex to be formed as expressed in reaction (6), where the correlation ration is (1:1).
4.1.3 Studying the correlation ratio between Zn(II), Cu(II) and ARS using pH/conductivity diagrams (pHCD) method
Two series of solutions have been prepared in order to find out the correlation ration. The first one included ZnCl2 and CuCl2 with a concentration of 6x10⁻⁵M for each, whereas the second one included 6x10⁻⁵M ARS. Fig. 23 shows both pH and conductivity diagrams, which confirms the reaction stoichiometry of (1:1) for the formation of Cu and Zn salts because the medium is convenient for that kind of bonding. That means that the competition process between Cu(II) and Zn(II) to bond with ARS is in fact a sharing process as long as the solution has an amount of ARS that can be shared equally between these two metals. Therefore, this is very useful for different purposes. For example, the electrodeposition of brass that requires bonds between both metals with the dye at the same time. For obtaining the complexes instead of the salts, the solutions can be diluted more so that the pH value can be at 5.7 or 5.8. In this case, both Zn and Cu complexes can be formed for better organizing effect on the electrodeposition process.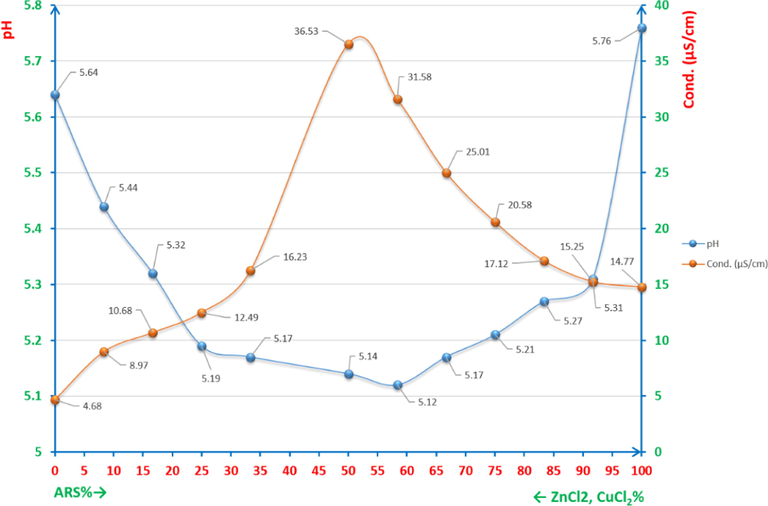
pH/conductivity diagrams (pHCD) for studying the correlation ratio between Zn(II), Cu(II) and ARS.
5 Conclusion
The chelation between Zn(II) and ARS to form a salt or complex besides the competition between Zn(II) and Cu(II) to bond with ARS have been intensively and extensively investigated using very rigorous and precise methods. The approach to these methods is completely profound and de rigueur, where some rules have been established in order to understand the dyes’ chelation processes. For example, in pHOT method, the half way to the leap is just pKa1, and pKa2 = 2pKa1 ± 1, where pKa1 = (pH at Veq,2/2), whilst Δ(ΔpH)/ΔV2 ≥ 0.35 condition between two consecutive positive and negative points has been confirmed to be considered as a change in the formations inside the solution. In VOG method, it has been also established that these graphs can be as fingerprint spectrums for solutions containing a metal and dye in order to track the changes that happen inside these solutions. For instance, the small fluctuations have to fulfil the condition of Δ(ΔCond.)/ΔV2 > 300 between the bottom and top values to be considered as either a new formation or as an equivalence point, otherwise it is indicated as pKa or a formation of new species, whereas when there is accumulated amount of the hydroxide above pH = 10, it is then the finish of the titration. Not to mention the thorough interpretations via the explaining reactions throughout all diagrams of various series of samples besides other informative graphs such as temperature-oscillotitrimetric graphs. In terms of having two metals and a dye as more sophisticated mixtures, VOGFISDs can be useful to conceive the general idea of the correct reaction stoichiometries. At last, the study has confirmed that Zn(II) and Cu(II) can form salts or complexes with ARS at the pertinent pH values, where pH = 5 is suitable for the complex formation of Cu(II), whereas pH = 6 is sufficient for Zn(II) complex to be formed with correlation ratio of (1:1) for both complexes studied via pHCD and ECD methods. The salts, on the other hand, can be formed near to strong acidic mediums and downwards, or in alkali mediums; however, with noting the differences in the salts’ structures when changing from acidic to alkali mediums.
Acknowledgements
Authors would like to thank Pandit Deendayal Energy University (PDEU) and Solar Research and Development Centre (SRDC) for providing the necessary facilities to carry out this investigation and their support is sincerely acknowledged.
Declaration of Competing Interest
The authors declare that they have no known competing financial interests or personal relationships that could have appeared to influence the work reported in this paper.
References
- –Afshar, E. A., Taher, M.A., Fazelirad, H., 2017. Nanosized ion-imprinted polymer doped with Alizarin Red S for separation and quantification of zinc(II) prior to its determination by electrothermal AAS. Microchim. Acta, https://doi.org/10.1007/s00604-017-2322-0.
- Determination of optimal conditions for electrodeposition of Tin(II) in the presence of Alizarin Red S. Heliyon. 2016;2
- [CrossRef] [Google Scholar]
- DC and DP Polarographic Studies to Explore the Intermediate Species Form and Operating Conditions Effects on Electrodeposition of Cu from Cu(II) in the Presence of Alizarin Red S. Chem. Papers. 2022;76:1745-1766.
- [CrossRef] [Google Scholar]
- Al-Salihi, K.J., Alfatlawi, W.R., 2021. Synthesis and Characterization of Low-Cost Adsorbent and used for Alizarin Yellow GG and Alizarin Red S Dyes Removal from Aqueous Solutions, IOP Conf. Series: Materials Science and Engineering 1094, 012175 1-11. doi:10.1088/1757-899X/1094/1/012175.
- Electrocatalytic determination of hydroxylamine with alizarin red S as a homogenous mediator on the glassy carbon electrode. Sens. Actuators B: Chem.. 2008;132:52-59.
- [CrossRef] [Google Scholar]
- Boronic acid dendrimer receptor modified nanofibrillar cellulose membranes. J. Mater. Chem.. 2010;20:588-594.
- [CrossRef] [Google Scholar]
- An automated technique for double staining of bone and cartilage in fetal mouse skeletal specimens using alizarin red S and Alcian blue. Biotechnic & Histochemistry. 2022;97:222-227.
- [CrossRef] [Google Scholar]
- Selective adenosine-5′-monophosphate uptake by water-compatible molecularly imprinted polymer. Anal. Chim. Acta. 2008;616:222-229.
- [CrossRef] [Google Scholar]
- Dunaliella salina-derived peptide protects from bone loss: Isolation, purification and identification. LWT - Food Sci. Technol. 2020
- [CrossRef] [Google Scholar]
- Signal amplification by electropolymerization of alizarin red S for improved diuron detection at organosmectite modified glassy carbon electrode. J. Chin. Chem. Soc. (JCCS). 2022;69:349-358.
- [CrossRef] [Google Scholar]
- Adsorption of Malachite Green and Alizarin Red S Dyes Using Fe-BTC Metal Organic Framework as Adsorbent. Int. J. Mol. Sci.. 2021;22:1-14.
- [CrossRef] [Google Scholar]
- Determination of trace copper by adsorptive voltammetry using a multiwalled carbon nanotube modified carbon paste electrode. Electroanalysis. 2008;20:1215-1219.
- [CrossRef] [Google Scholar]
- Reactivity of Poly(anilineboronic acid) with NAD+ and NADH. Chem. Mater.. 2005;17:2918-2923.
- [CrossRef] [Google Scholar]
- Synthesis of glucose-sensitive self-assembled films and their application in controlled drug delivery. Polymer. 2009;50:4205-4211.
- [CrossRef] [Google Scholar]
- Electrochemical degradation of anthraquinone dye Alizarin Red S by anodic oxidation on boron-doped diamond. Dyes and Pigments. 2007;73:86-89.
- [CrossRef] [Google Scholar]
- Solid-phase reactor with copper(II) phosphate for flow-injection spectrophotometric determination of aspartame in tabletop sweeteners. Anal. Chim. Acta. 1999;384:167-174.
- [CrossRef] [Google Scholar]
- A self-assembled nanoindicator from alizarin red s-borono-peptide for potential imaging of cellular copper(II) ions. ACS Biomater. Sci. Eng.. 2021;7:3361-3369.
- [CrossRef] [Google Scholar]
- Fouad1, H.K., Abu Elenein, S.A., Elrakaiby, R.M., Abdulmoteleb, Sh.S., 2015. A Developed Spectrophotometric Method for Thorium Determination using Alizarin Red S Dye in Different Types of its Bearing Rocks, Int. J. Sci. Res. 4 (2015) 1611-1615. https://doi.org/10.21275/v4i12.nov152062.
- NAD+/NADH-Sensitive Quantum Dots: Applications To Probe NAD+-Dependent Enzymes and To Sense the RDX Explosive. Nano Lett.. 2009;9:322-326.
- [CrossRef] [Google Scholar]
- Multiwalled Carbon Nanotubes as Adsorbents for the Kinetic and Equilibrium Study of the Removal of Alizarin Red S and Morin. J. Chem. Eng. Data. 2011;56:2511-2520.
- [CrossRef] [Google Scholar]
- Coal bottom ash derived zeolite (SSZ-13) for the sorption of synthetic anion Alizarin Red S (ARS) dye. J. Hazard. Mater.. 2021;416:1-13.
- [CrossRef] [Google Scholar]
- Highly sensitive square wave voltammetric determination of sunset yellow at a functionalized MWCNTs/poly(Alizarin Red-S) composite modified electrode. Electroanalysis 2022
- [CrossRef] [Google Scholar]
- Inorganic Chemistry. San Diego: Academic Press; 2001. ISBN 978-0-12-352651-9
- Assembly of N-hexadecyl-pyridinium-4-boronic acid hexafluorophosphate monolayer films with catechol sensing selectivity. J. Mater. Chem.. 2010;20:8305-8310.
- [CrossRef] [Google Scholar]
- Evaluation of adsorptive and photocatalytic degradation properties of FeWO4/polypyrrole nanocomposite for rose bengal and alizarin red S from liquid phase: Modeling of adsorption isotherms and kinetics data. Environ. Prog. Sustain. Energy (AlChE) 2022
- [CrossRef] [Google Scholar]
- Irish, D.E., McCarroll, B., Young, T.F., 1963. Raman Study of Zinc Chloride Solutions, J. Chem. Phys. 39 (12), 3436–3444. Bibcode:1963JChPh..39.3436I. https://doi.org/10.1063/1.1734212.
- James, T.D., Phillips, M.D., Shinkai, S., 2006. Boronic Acids in Saccharide Recognition, 1 ed., The Royal Soc. Chem., https://pubs.rsc.org/en/content/ebook/978-0-85404-537-2 https://doi.org/10.1039/9781847557612-FP001.
- Studies on the photofading of alizarin, the main component of madder. Dyes and Pigments. 2021;185:1-9.
- [CrossRef] [Google Scholar]
- Jurgelėnė, Ž., Montvydienė, D., Stakėnas, S., Poviliūnas, J., Račkauskas, S., Taraškevičius, R., -Arbačiauskienė, V.S., Kazlauskienė, N., 2022. Impact evaluation of marking Salmo trutta with Alizarin Red S produced by different manufacturers. Aquatic Tixocology 242, 106051. https://doi.org/10.1016/j.aquatox.2021.106051.
- Photocatalytic degradation of Alizarin Red S using simply synthesized ZnO nanoparticles. Mater. Lett.. 2013;106:385-389.
- [CrossRef] [Google Scholar]
- Intracellular pH-responsive iron–catechin nanoparticles with osteogenic/anti-adipogenic and immunomodulatory effects for efficient bone repair. Nano Res. 2021:1-9.
- [CrossRef] [Google Scholar]
- Adsorption of Alizarin Red S Dye by Carbon Nanotubes: An Experimental and Theoretical Investigation. J. Phys. Chem. C. 2016;120:18296-18306.
- [CrossRef] [Google Scholar]
- Surface complexation of copper(II) with Alizarin Red S adsorbed on a graphite electrode and its possible application in electroanalysis. Electroanalysis. 1999;11:1130-1136.
- [CrossRef] [Google Scholar]
- Nabieh, K.A., Mortada, W.I., Helmy, T.E., Kenawy, I.M.M., Abou El-Reash, Y.G., 2021. Chemically modified rice husk as an effective adsorbent for removal of palladium ions, Heliyon 7, 1-9. https://doi.org/10.1016/j.heliyon.2021.e06062
- Nodehi, R., Shayesteh, H., –Kelishami, A.R., 2021. Fe3O4@NiO core–shell magnetic nanoparticle for highly efficient removal of Alizarin red S anionic dye, Int. J. Environ. Sci. Technol., https://doi.org/10.1007/s13762-021-03399-8.
- Alizarin red s staining as a screening test to detect calcium compounds in synovial fluid. Arthritis and Rheumatism. 1983;26:191-200.
- [CrossRef] [Google Scholar]
- On the history and mechanism of alizarin and alizarin red s stains for calcium. J. Histochem. Cytochem.. 1969;17:110-124.
- [CrossRef] [Google Scholar]
- Pye, C.C., Corbeil, C.R., Rudolph, W.W., 2006. An ab initio Investigation of Zinc Chloro Complexes, Phys. Chem. Chem. Phys. 8 (46), 5428–5436. Bibcode: 2006PCCP....8.5428P. ISSN 1463-9076. PMID 17119651. S2CID 37521287. https://doi.org/10.1039/b610084h.
- Hierarchicalmesoporous ZIF-67@LDH for efficient adsorption of aqueous Methyl Orange and Alizarine Red S. Powder Technology. 2021;377:453-463.
- [CrossRef] [Google Scholar]
- Synthesis of a rGO/Fe3O4 nanoparticle composites and its use as a surface for Alizarin Red S (ARS) dye removal from polluted water. AIP Conference Proceedings. 2022;2386:030029
- [CrossRef] [Google Scholar]
- Nucleotide-responsive gel tips for atomic force microscopy. Colloids Surf. A: Physicochem. Eng. Aspects. 2000;169:131-136.
- [CrossRef] [Google Scholar]
- Schumacher, S., Katterle, M., Hettrich, C., Paulke, B.-R., Pal, A., Hall, D.G., Scheller, F.W., Gajovic-Eichelmann, N., 2011. Benzoboroxole-modified nanoparticles for the recognition of glucose at neutral pH, Chem. Sens. 1, 1-7. [https://www.researchgate.net/publication/257606066] [http://publica.fraunhofer.de/documents/N-164843.html] [https://scholar.google.com/scholar_lookup?journal = Chem+Sens&author = S+Schumacher&author = M+Katterle&author = C+Hettrich&author = BR+Paulke&author = A+Pal&volume = 1&publication_year = 2011&pages = 1/1-1/7&].
- Alizarin Red S as an electrochemical indicator for saccharide recognition. Electrochim. Acta. 2011;56:6607-6611.
- [CrossRef] [Google Scholar]
- No-Observed-Effect Level of Silver Phosphate in Carbonate Apatite Artificial Bone on Initial Bone Regeneration. ACS Infect. Dis.. 2022;8:159-169.
- [CrossRef] [Google Scholar]
- An electrochemical sensor for the determination of Luteolin using an alizarin red/carboxylic acid group functionalized carbon nanotube. Microchem. J.. 2022;174:106864
- [CrossRef] [Google Scholar]
- Fabrication of In(III)–alizarin red S complex trap for efficient detection of fluoride ion in aqueous environs. J. Anal. Sci. Technol.. 2021;12:1-10.
- [CrossRef] [Google Scholar]
- A detailed examination of boronic acid–diol complexation. Tetrahedron. 2002;58:5291-5300.
- [CrossRef] [Google Scholar]
- as a general optical reporter for studying the binding of boronic acids with carbohydrates. Chem. Commun. 2001:1608-1609.
- [CrossRef] [Google Scholar]
- Discrimination of Saccharides with a Fluorescent Molecular Imprinting Sensor Array Based on Phenylboronic Acid Functionalized Mesoporous Silica. Anal. Chem.. 2009;81:5273-5280.
- [CrossRef] [Google Scholar]
- Turcanu, A., Bechtold, T., 2011. pH Dependent redox behaviour of Alizarin Red S (1,2-dihydroxy-9,10-anthraquinone-3-sulfonate) - Cyclic voltammetry in presence of dispersed vat dye, Dyes and Pigments 91, 324-331. https://doi.org/10.1016/j.dyepig.2011.04.011.
- Spectrophotometric determination of toxic elements (cadmium) in aqueous media. J. Chem. Eng.. 2010;25:1-12.
- [CrossRef] [Google Scholar]
- Green separation of lanthanum, cerium and nickel from waste nickel metal hydride battery. Waste Manage.. 2021;125:154-162.
- [CrossRef] [Google Scholar]
- Glucose-responsive vesicular sensor based on boronic acid–glucose recognition in the ARS/PBA/DBBTAB covesicles. Sens. Actuators B: Chem.. 2006;119:695-700.
- [CrossRef] [Google Scholar]
- Electrochemical polymerization of polypyrrole on carbon cloth@ZIF67 using alizarin red S as redox dopant for flexible supercapacitors. Electrochim. Acta. 2022;407:139869
- [CrossRef] [Google Scholar]
- Facile synthesis of polypyrrole/graphene composite aerogel with Alizarin Red S as reactive dopant for high-performance flexible supercapacitor. J. Power Sour.. 2022;517:230737
- [CrossRef] [Google Scholar]
- Yamaguchi, T., Hayashi, S., Ohtaki, H., 1989. X-Ray Diffraction and Raman Studies of Zinc(II) Chloride Hydrate Melts, ZnCl2 · R H2O (R = 1.8, 2.5, 3.0, 4.0, and 6.2), J. Phys. Chem. 93 (6), 2620–2625. https://doi.org/10.1021/j100343a074.
- Solvothermal synthesis of nitrogen-doped MXene quantum dots for the detection of alizarin red based on inner filter effect. Dyes and Pigments. 2021;195:1-7.
- [CrossRef] [Google Scholar]


