

Translate this page into:
A facile and green synthetic approach toward fabrication of Alcea- and Thyme-stabilized TiO2 nanoparticles for photocatalytic applications
⁎Corresponding author. akianvash@tabrizu.ac.ir (Abbas Kianvash),
-
Received: ,
Accepted: ,
This article was originally published by Elsevier and was migrated to Scientific Scholar after the change of Publisher.
Peer review under responsibility of King Saud University.
Abstract
A facile and green synthetic approach was considered for the synthesis of stabilized titanium dioxide (TiO2) nanoparticles. Extracts of Alcea and Thyme plants were used to synthesis TiO2 nanoparticles for photocatalytic applications. Evaluation of the structural and phase formation via X-ray diffraction (XRD) indicated the formation of the anatase phase of TiO2 along with the rutile phase. A desired single phase of anatase was obtained upon heating the as-synthesized samples at 500 °C for 3 h. Using the information provided by the XRD analyzer and the Debye Scherer relationship, the average crystallite size was found to be around 6 and 10 nm for the samples synthesized using Alcea and Thyme plants, respectively. To determine the elemental analysis and chemical structure, the energy dispersive X-ray (EDX) analyzer and Fourier Transform Infrared (FTIR) spectroscopy were employed. Field emission scanning electron microscopy (FESEM) indicated batches of ultrafine agglomerated particles for both samples, which their sizes grew by the heating process. The UV–visible analysis of photocatalytic properties confirmed the priority of TiO2 nanoparticles prepared with Thyme extracts.
Keywords
TiO2nanoparticles
Green synthesis
Photocatalytic properties

1 Introduction
Titanium dioxide (TiO2) has three phases of routile, anatase and broukite, where rutile is the most stable and the other two phases may convert to routile phase through the heating process (Mattsson and Osterlund, 2010; Zhao et al., 2016; Li et al., 2004; Rangan et al., 2009; Hajalilou et al., 2014). The crystalline structures of anatase and routile are tetragonal and the structure of broukite is orthorhombic. While the anatase phase is used for sensitive light and optical catalysts, the routile phase is commonly used in dielectrics and high temperature oxygen sensors (Xiao et al., 2009).
Nowadays, the synthesis of various metal oxide nanoparticles has been seriously considered in different chemical, physical, pharmacial, optical and mechanical industries. Among all, the synthesis of TiO2 nanoparticles is of excessive interest due to the desired properties and diverse applications. Typically, such nanoparticles are used as a water-purifying agent due to their desired chemical properties as well as non-toxic nature and antimicrobial properties (Sundrarajan and Gowri, 2011). In addition, TiO2 nanoparticles have favorable optical and dielectric properties and widely considered as photocatalysts (Sundrarajan and Gowri, 2011). Semiconductor photocatalytics are always solid and can be formed in various size and distribution, surface area, surface structure and crystalline structure, which create an opportunity to use in high-performance optical energy (Hashimoto et al., 2005). Indeed, a semiconductor photocatalytic reaction is simple. The conductor has two bands of capacity (full of electrons) and conductivity (empty of electrons). There is a certain distance between these two bands once they are subjected to the light radiation with a specific wavelength. Specifically, the possibility of electron transport from the capacity band to the conduction band is established (Linsebigler et al., 1995). The relative potential of the material should be thermodynamically lower than that of the conductive semiconductor bandwidth. On the other hand, the potential surface should be higher (less negative) than that of the semiconductor capacity, which enables transformation of electrons to the empty space of the cavity.
In some cases semiconductors such as ZnO, ZnS, CdS and Fe2O3 are not suitable photocatalysts candidates due to their unstable nature, high cost and affordability of their preparation (Stamate and Lazar, 2007). To remedy, these materials are coupled with second phase to make a composite. For example, in the case of inclusion Co3O4 into ZnO, it was found that the photocatalytic activity of the prepared Co3O4/ZnOp-n heterostructure was higher than that of pure ZnO nanostructure and 7% Co3O4 loaded on ZnO exhibited the maximum photocatalytic activity. Under UV light, it was also found to be more than five times that of pure ZnO (Reda et al., 2017). In other study, Zhao et al. (2016) stated that polymeric carbon nitride as a low-cost and robust photocatalyst has been limited by the rapid recombination of photo-generated electronehole pairs and low visible light utilization efficiency. To enhance photocatalytic hydrogen, polymeric graphitic carbon nitride coupled with Bi4Ti3O12/Bi2Ti2O7 (BTO) heterostructure nanofibers. It was found that the optimal loading of BTO nanorods on g-C3N4 increases light absorption to generate more photoelectrons and simultaneously promotes separation and transfer of photoinduced electrons and holes, which arises from the intrinsic electric field formed between the (Bi2O2)2+ slabs and the (Bim−1TiO3m+1) units in Bi2Ti2O7 and Bi4Ti3O12. According to the examples mentioned, it seems that TiO2 to be ideally suited for various photocatalytic applications (Stamate and Lazar, 2007). When the surface of the sample is subjected to wavelengths shorter than 415 nm, the electrical current in the orbits is from the platinum electrode toward the titanium electrode. The current represents an oxidation reaction in the titanium electrode and a reduction reaction in the platinum electrode. This suggests that the titanium semiconductor can break up to oxygen and hydrogen by ultraviolet/visible wavelengths without the use of external voltages. The advantage of using this method for water electrolysis is the use of light and catalyst, which is a good source of hydrogen gas production as a fuel and alternative to crude oil (Hashimoto et al., 2005).
The electronic band structure of rutile has reported values of 3.3 ± 0.5 eV with photoemission spectroscopy (PES) and inverse photoemission spectroscopy (IPES), 3.6 ± 0.2 eV (PES and IPES for rutile (1 1 0) surface) (Rangan et al., 2009). The optical band gap is reported at ∼3.0 eV for rutile, ∼3.4 eV for anatase and ∼3.3 eV for brookite (Mattsson and Osterlund, 2010; Zhu and Gao, 2014). The indirect absorption edge has been measured to be 3.0 eV for rutile, 3.2 eV for anatase. The direct exaction is reported at 3.57 eV for rutile and 3.68–3.90 eV for anatase. It has been generally observed for semiconductors and insulators, the band gap is underestimated in the density functional theory (DFT) calculations with local density approximation (LDA) or generalized gradient approximation (GGA) for the exchange correlation functional (Zhu and Gao, 2014).
So far, several methods such as sol-gel (Sharma et al., 2014), radio-frequency thermal plasma (Sundrarajan and Gowri, 2011), and micro-mixing (Sundrarajan and Gowri, 2011) have been used for the synthesis of TiO2 nanoparticles. Hydrothermal method could be also used for the synthesis of such oxides with controlled morphology at a relatively low temperature of 100–350 °C (Dhage et al., 2004). Using of mechano-chemistry assisted synthesis was also reported for the synthesis of titanium nanoparticles from TiCl4 and (NH4)2CO3 (Billik and Plesch, 2007). In the microfibre method, the size of the titanium nanoparticles was controlled adjusting the amount of microfluidic effect of the microglass (Chen et al., 2004). Despite the usefulness of the traditional synthetic methods, the ability to recycle raw materials, the biocompatibility of the nanoparticles and the safety of products are other important criteria that need to be considered along with the economic justification of the process. In this aspect, the green technology has been widely considered for the synthesis of various nanoparticles (Alvarez et al., 2016; Hurtado et al., 2020; Hajalilou et al., 2017). In addition to avoiding the use of traditional corrosive and flammable reducing agents such as sodium borohydride, such methods would impart steric stabilization of nanoparticles against aggregation (Hajalilou et al., 2017). Several less hazardous and green methods have been developed for the synthesis of titanium dioxide. Typically, TiO2 was synthesized by green synthesis using a flower (Sundrarajan and Gowri, 2011) and soy bean extracts (Kashale et al., 2016). In other studies, Ag/TiO2 and Au/TiO2 were prepared using Padina Tetrastromatica (seaweed) (Jegadeeswaran et al., 2016) and cinnamon leaves extracts (Naik et al., 2013), respectively, and used in the photocatalytic waste treatment application.
Thyme has a variety of varieties, including Thymus vulgaris, Thymus serpylum, Thymus migricus, Thymus eriocalyx, Thymus deanensis, Thymus kotschyanus and Zataria multiflora. In that study, the Thymus migricus we used (Morales, 2002; Jamzad, 2009; Mozaffarian, 2013). On the other hand, the species of Alcea, which grows on the east coast of the Mediterranean, has white leaves and only one type. Thyme has properties like antispasmodic, wind turbine, antifungal anti-dandruff, anti-dermatology and dandruff. Thyme essential oil, including ten essential oils, has anti-bacterial and antifungal properties, antioxidant, natural food preservative and delayer mummies are old and has a special place in world trade (Austin, 2004). Furthermore, extract of plants used as surfactants reduce titanium ion and convert them into stable titanium dioxide nanoparticles (Oleszek et al., 2007; Simonet et al., 1999). Based on the aforementioned criteria, in this study, green-assisted route by the use of two extracts provided from Thyme and Alcea plants, were employed to synthesize titanium dioxide nanoparticles, which was followed by their photocatalytic behavior investigation.
2 Experimental
2.1 Reagents
Titanium tetra-isopropoxide with a chemical formula of C12H28O4Ti was used for the synthesis of TiO2. As a surfactant, the extracts of an Alcea plant derived from the Middle East and the Thyme plant, which is abundant in mountainous areas of northern Khorasan, Iran, were used.
2.2 Preparation of extracts
The plants were collected from the local areas and washed with water to remove contaminations, and then dried for a few days in a dust-free environment at room temperature. The dried samples were crushed to obtain soft and fine powders. 20 g of each sample was boiled in 100 mL of distilled water for 10 min. Then, the resultant mixture was filtered and the prepared extracts were finally kept at 4 °C for subsequent use Fig. 1).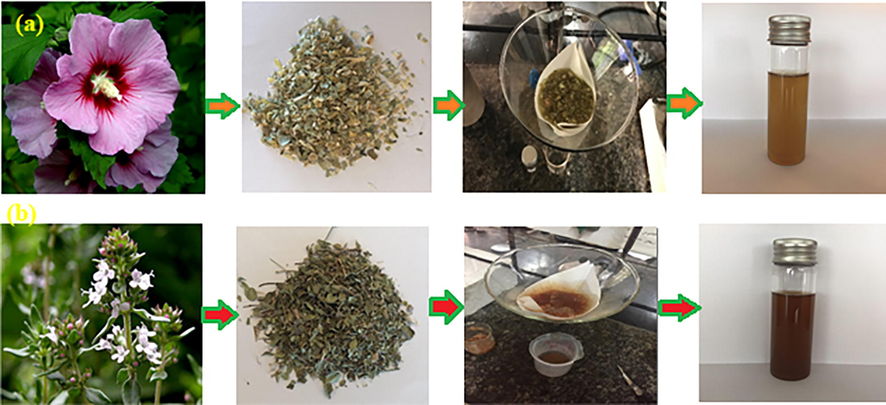
Alcea (a) and Thyme (b) plants and prepared aqueous extracts.
2.3 Synthesis of titanium oxide nanoparticles
12 mL of titanium tetra-isopropoxide was added to the mixture of 100 mL of distilled water and 10 mL of the aqueous extract. The solution was stirred in the reflux at 50 °C for 4 h. The prepared solution was centrifuged at 10000 rpm for 15 min and the pH of the solution was controlled at neutral. The samples were dried in oven at 60 °C. Finally, the prepared samples were calcinated at 500 °C for 3 h.
2.4 Photocatalytic activity
For photocatalytic testing of the prepared samples, 50 mg of the produced TiO2 with 1.5 mL of methylene blue were added to 100 mL distilled water. The resultant mixture was constantly stirred in a dark room. After 30 min, there was no change in the color intensity. In the second step, the resultant mixture was exposed to constant irradiation of UV lamp. After 30 min, the mixture was discolored due to radiation. It was observed that the solution got gradually pale and it almost became colorless. This indicates the photoactivity behavior of TiO2 nanoparticles.
2.5 Characterizations
Powder X-ray diffraction measurement was carried out using an EMPYREAN X-ray diffractometer equipped with Cu kα between 2θ of 15–80°. The average crystallite sizes (D) were calculated using the Debye Scherer relation as follows (Hajalilou et al., 2014):
3 Result and discussion
3.1 XRD analysis
The XRD patterns of the as-synthesized samples indicate the sharp peaks at 2Θ of ∼25.54, 37.39, 47.84, 53.69, 62.12, 68.28 and 74.55, which belong to (1 0 1), (0 0 4), (2 0 0), (1 0 5), (2 0 4), (2 2 0) and (2 1 5) planes of anatase phase (PDF:21-1272), respectively. In addition, the observed peaks at 2Θ of 30.48, 54.58 and 69.89 are related to the diffraction (1 1 0), (2 1 1) and (1 1 2) plates of the rutile phase according to PDF:21-1276 (Hajalilou et al., 2014). After the heating process, the TiO2 rutile phase transferred to anatase phase, as shown in Fig. 2c and d.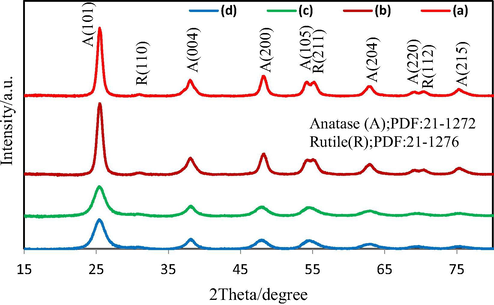
As-synthesized TiO2 using Thyme (a), Alcea (b), and Alcea heated at 500 °C (c) and Thyme heated at 500 °C (d).
The average crystallite size found to be about 6 and 10 nm, in the samples synthesized using Thyme and Alcea plants, respectively. Their sizes grew to 15 and 22 nm after heating at 500 °C, accordingly. This indicates the effects of heating process in grain growth.
3.2 FTIR analysis
Fig. 3 shows the FTIR spectra of the synthesized TiO2 samples in the range of 400–4000 cm−1. The results showed small and broader bands in the range of ∼2922–3428 cm−1; indicating Ti—OH bonds (Jegadeeswaran et al., 2016). The peaks appeared in the range of 1600–1700 cm−1 are ascribed to the —C⚌O—Ti bond (León et al., 2017). The spotted peak at around 1530 cm−1 is related to the CH, CH2 or CH3 bonds and small bands at 1000 cm−1 belong to C—O bond (León et al., 2017). The observed peaks at ∼673 cm−1 is attributed to the Ti—O—Ti bond (Pan et al., 2013). The analysis indicates almost same positions for the functional peaks in the as-synthesized and heated samples. However, the peaks become sharper upon heating. Other research suggests that the combination of Anatase and Rutile phases could be an ideal catalyst (Nalwa, 2001). The cause of increased photocatalytic activity is due to the fact that the electrons transmission accelerates between the crystalline phases, which lead to a reduction of the combination of an electron-hole in the donor electron phase. This results in diffusion of more cavities from the electron donor into the surface of crystals and participation in radical production process. The hydroxyl groups in the anatase phase have been linked to less rigidity in the rutile phase. This is due to the fact that the increase in the number of anatase-infiltrative cavities may increase the number of hydroxyl groups that become hydroxyl radical, which ultimately increases the rate of attack on organic compounds (Fig. 3a). On the other hand, there is almost no change in the detected peaks for both states of the as-synthesized and heated nanocatalyst prepared in Thyme (Fig. 3b), which is probably due to the lack of a proper phase formation.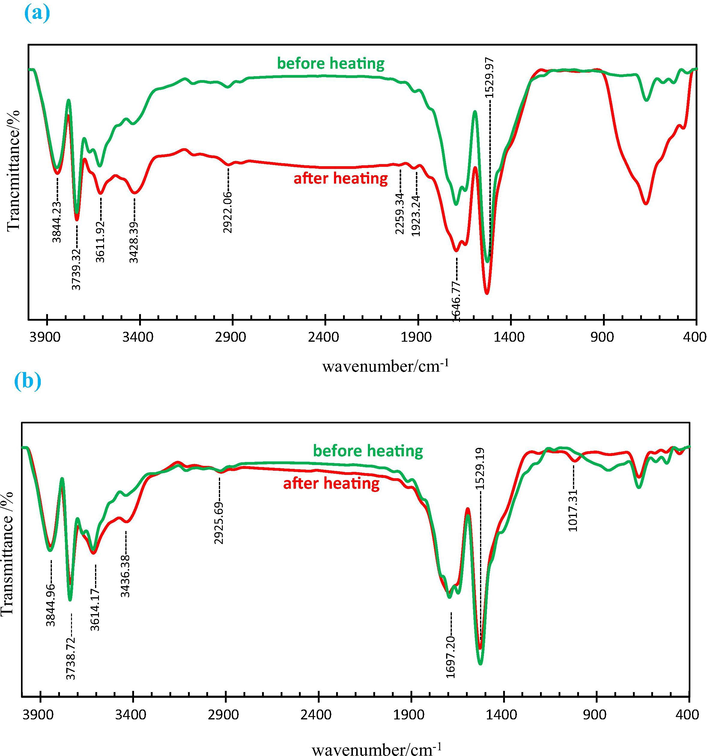
FTIR spectra of as-synthesized and calcinated TiO2 using Alcea (a) and Thyme (b) aqueous extracts as surfactants.
3.3 UV analysis
Photocatalytic decomposition of the paint using a titanium dioxide catalyst with ultraviolet radiation is one of the most advanced oxidation method that is expanding (Jafari, 2004). Titanium dioxide nanoparticles are used as a catalyst with either fixed-phase or solvent-phase methods. Both techniques have their own advantages; however, the solvent phase is more effective than the fixed-phase. Since the titanium dioxide remains in the wastewater treatment process, it should be separated from the solution (Poudyal et al., 2002). In the UV assisted application of titanium dioxide nanoparticles to remove methylene blue, it was found that by increasing the concentration of the catalyst to a specific amount, the efficiency improves. However, the excess concentration of the catalyst will have a negative effect on the radicals. This is because the catalyst particles prevent the penetration of the photons (Kuo and Ho, 2001).
To verify the optical band transition mode of the prepared TiO2, whether it is direct or indirect, the following Equation could be used (Tauc and Tauc, 1974):
Sample
Irradiation time in samples
a
b
c
d
e
TiO2 synthesized with Thyme
Band gap (eV)
1.85
1.86
1.9
2.07
2.09
TiO2 synthesized with Alcea
Band gap (eV)
1.83
1.85
1.9
2.07
2.1
Fig. 4 shows the effect of increasing UV radiation on the samples’ band gaps. As it is remarkable, the band gaps increased with increasing of radiation time. By increasing the energy band, electron transfer is more convenient. This is the reason for faster and more powerful degradation of the solution when the sample is synthesized with Alcea plant under UV radiation.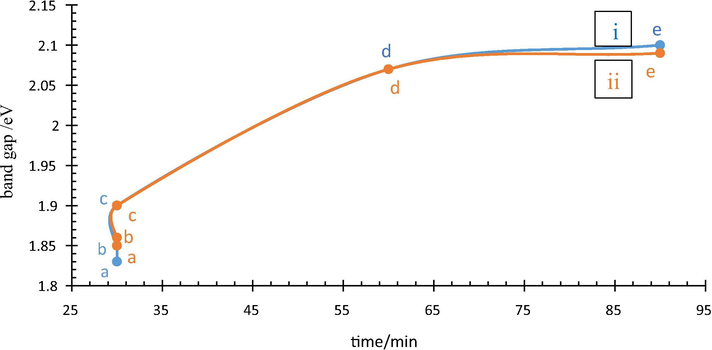
Band gap versus irradiation time for Alcea (i) and Thyme (ii) assisted synthesized nanoparticles.
Fig. 5 shows the absorption curves of the two used extracts in this study. According to the results, the only observed peak for both extracts is in the range of 350–400 nm and the peak is larger and more intense for the Thyme plant. This could be probably due to the presence of relatively high levels of protein in the Thyme which absorbs much of the UV rays. A broad peak was observed for both the as-synthesized samples at around 300 nm with a small shift to higher wavelength in the as-synthesized TiO2 through using the Alcea as surfactant.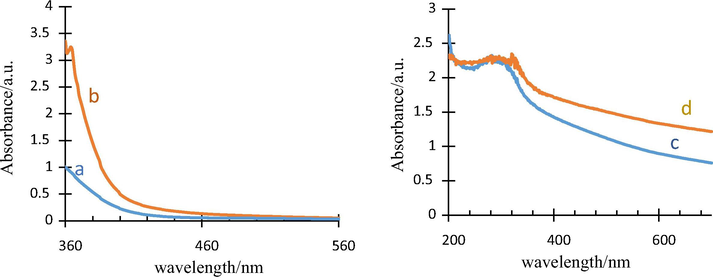
Absorbance curves of Alcea (a) and Thyme (b) surfactants and as-synthesized TiO2 with Thyme (c) and Alcea (d) aqueous extracts.
Fig. 6 shows the absorbance of the two synthesized samples under UV irradiation at different time intervals. As seen, by increasing UV irradiation time, the absorption rate decreases. In fact, methylene blue is completely removed from the solution. There was no considerable change in the first 30 min, however, the color change after 90 min. In addition, comparisons of graphs of the two samples have indicated that the sample (ii) could be chosen as a better photocatalyst; i.e. it has a better photocatalyst behavior. Inset in Fig. 6 shows the color of the specimen by UV radiation under different times.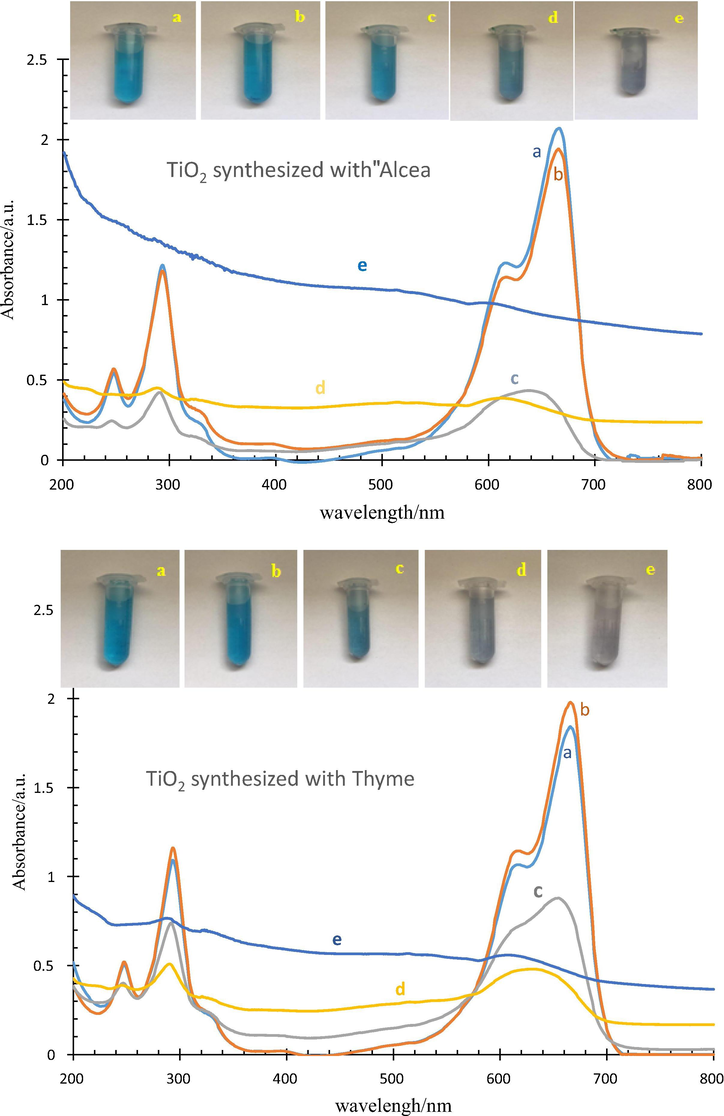
UV absorbance of (what??) before mixing (a), mixed for 30 min at dark room (b), mixed for 30 min under UV irradiation (c), mixed for 60 min under UV irradiation (d) and mixed for 90 min under UV irradiation (e).
3.4 Energy dispersive X-ray analysis (EDX)
Fig. 7 shows the EDX spectra for the samples. The presence of Ti and O peaks could be considered as a successful indication of the synthesis of TiO2 (Lakshmi et al., 1995). Main elements of S, C, K and O from surfactants could be also seen in the samples.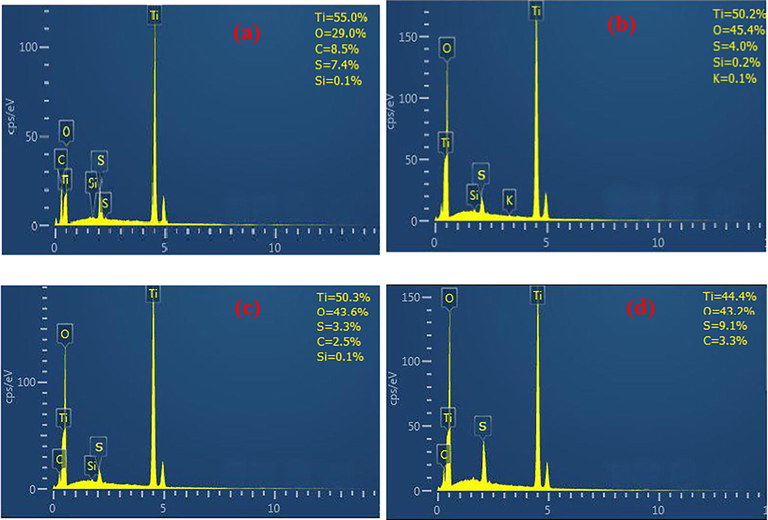
EDX spectra of as-synthesized TiO2 with Alcea (a) and corresponding sample heated at 500 °C (b) and as-synthesized TiO2 with Thyme (c) and heated sample at 500 °C (d).
3.5 FESEM analysis
Fig. 8 shows FESEM images of prepared TiO2 samples. The particles of the as-synthesized TiO2 are ultrafine. The particles stick together and become agglomerated due to high surface energy (Sabet et al., 2014). This means that green synthesis method can lead to creation of the product with tiny particles. Also, with regard to the particles shapes, irregular shapes have been observed. Comparing two synthesized samples, it could be seen that the size of the batches formed by the Thyme is smaller. The average particle size of each sample was obtained as follows: (a) 303 nm, (b) 353 nm, (c) 380 nm and (d) 500 nm. The results show that in each sample, the average size of the masses is increased after heating.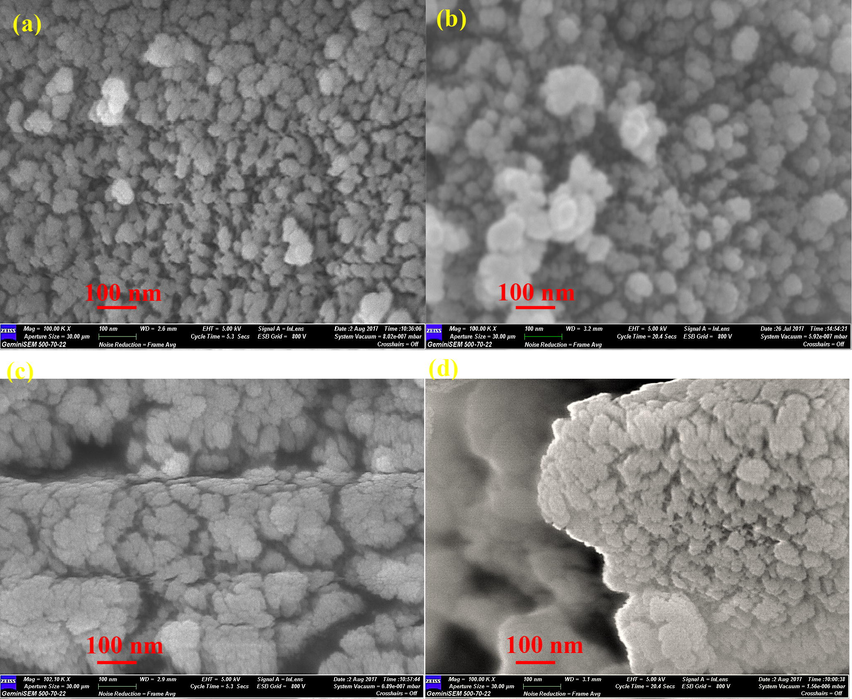
FESM images of as-synthesized TiO2 with Alcea (a) and after heating at 500 °C (b) and synthesized TiO2 with Thyme (c) and after heating at 500 °C.
3.6 TEM analysis
TEM results indicated the agglomerated state of particles for both of the samples (Fig. 9). This is more probably due to fine sized particles of the as-synthesized TiO2, which possess a high surface area to volume ratio. The high surface energy induced by small particles causes the particles stick together and become agglomerated. A TEM image of the as-synthesized TiO2 by using Thyme (sample a) reveals smaller particles with almost polyhedron shape. The particle distribution is almost homogenous in the range of 3–27 nm with the average size of ∼10 nm. This is while the particle distribution ranged in 3–33 nm with the average size of ∼13 nm in the case of using Alcea as surfactant for the synthesis of TiO2 nanoparticles. The shape of particles become more irregular compared to the state of (sample a) as well.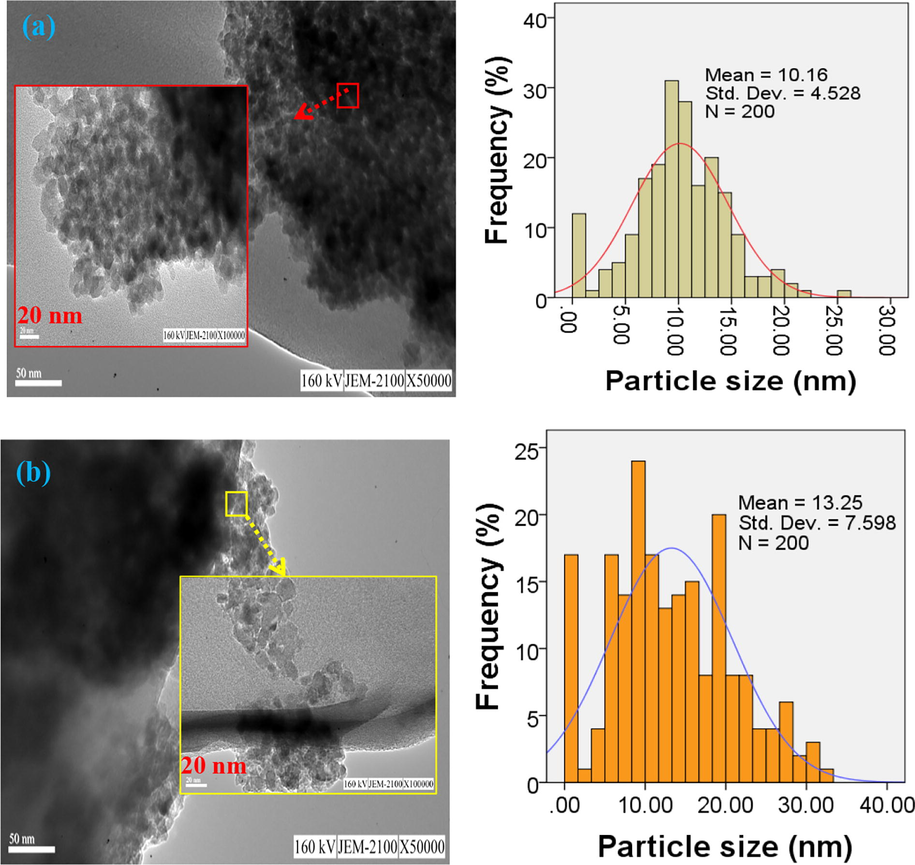
TEM images of the as-synthesized TiO2 samples; TiO2 synthesized with Thyme Alcea (a) Alcea (b), accompanied by their respective particle size distribution histograms.
4 Conclusions
Titanium dioxide nanoparticles were successfully synthesized using the green-assisted route using the extracts of Alcea and Thyme plants. The XRD patterns confirmed the formation of TiO2 of anatase and rutile phases, but with dominant types of anatase. The rutile phase was transformed to anatase type after heating the samples at 500 °C for 3 h. The average crystallite size found to be about 6 and 10 nm, in the samples synthesized using Thyme and Alcea plants, respectively. Their sizes grew to 15 and 22 nm after the heating process, accordingly. This indicates that both the sizes of crystal and nanoparticle produced using Thyme were smaller than that of the other sample. The EDX pattern defines the percentage of elements and the amount of impurities. FESEM images show that the morphology of the particles formed is clustered in the form of masses of very fine particles, measuring about a few tens of nanometers for the samples. The FTIR analysis confirmed the existing links, and after the calcination process, the width of the O-Ti-O bands was wider. Photocatalytic evaluation indicated that the activity of the prepared nanomaterials.
References
- Vibrational properties of gold nanoparticles obtained by green synthesis. Phys. E: Low-dimens. Syst. Nanostruct.. 2016;84:191-195.
- [Google Scholar]
- Austin, D.F., 2004. Medicinal plants of the world. An illustrated scientific guide to important medicinal plants and their uses.
- Mechanochemical synthesis of nanocrystalline TiO2 from liquid TiCl4. Scr. Mater.. 2007;56:979-982.
- [Google Scholar]
- Anatase-TiO2 nano-particle preparation with a micro-mixing technique and its photocatalytic performance. Mater. Sci. Eng. A. 2004;380:320-325.
- [Google Scholar]
- Synthesis and structural characterization of nano-sized nickel ferrite obtained by mechanochemical process. Ceram. Int.. 2014;40:5881-5887.
- [Google Scholar]
- Synthesis of titanium carbide and TiC–SiO2 nanocomposite powder using rutile and Si by mechanically activated sintering. Adv. Powder Technol.. 2014;25(3):1094-1102.
- [Google Scholar]
- Mechanochemical carboaluminothermic reduction of rutile to produce TiC–Al2O3 nanocomposite. Adv. Powder Technol.. 2014;25(1):423-429.
- [Google Scholar]
- Carbonyl iron based magnetorheological effects with silver nanoparticles via green-assisted coating. Appl. Phys. Lett.. 2017;110(26):261902.
- [Google Scholar]
- TiO2 photocatalysis: a historical overview and future prospects. Jpn. J. Appl. Phys.. 2005;44(12R):8269.
- [Google Scholar]
- One-step synthesis of reduced graphene oxide/gold nanoparticles under ambient conditions. Arab. J. Chem.. 2020;13(1):1633-1640.
- [Google Scholar]
- Simultaneous photo-oxidative degradation of EDTA and extra- oxidativerecovery of copper from industrial effluents. J. Iran. Chem. Chem. Eng.. 2004;23(2):65-71.
- [Google Scholar]
- Thymus and Satureja of Iran. Tehran: Research Institute of Forests and Rangelands Press; 2009. p. :171.
- A novel green technology: synthesis and characterization of Ag/TiO2 nanocomposites using Padina tetrastromatica (seaweed) extract. Mater. Lett.. 2016;166:137-139.
- [Google Scholar]
- Biomediated green synthesis of TiO2 nanoparticles for lithium ion battery application. Compos. Part B: Eng.. 2016;99:297-304.
- [Google Scholar]
- Solar, PHH, photocatalytic decolorization of methylene in water. Chemosphere. 2001;45(1):77-83.
- [Google Scholar]
- Study on TiO2-mediated photocatalytic degradation of methylene blue. J. Photochem. Photobiol. A: Chem.. 1995;88(2–3):163-167.
- [Google Scholar]
- FTIR and Raman characterization of TiO2 nanoparticles coated with polyethylene glycol as carrier for 2-methoxyestradiol. Appl Sci.. 2017;7(1):49.
- [Google Scholar]
- Low temperature synthesis and microstructural control of titania nano-particles. J. Solid State Chem.. 2004;177:1372-1381.
- [Google Scholar]
- Photocatalysis on TiO2 surfaces: principles, mechanisms, and selected results. Chem. Rev.. 1995;95(3):735-758.
- [Google Scholar]
- Adsorption and photoinduced decomposition of acetone and acetic acid on anatase, brookite, and rutile TiO2 nanoparticles. J. Phys. Chem. C. 2010;114(33):14121-14132.
- [Google Scholar]
- The history, botany and taxonomy of the genus Thymus. Thyme: the genus. Thymus 2002:1-43.
- [Google Scholar]
- Indentification of Medicinal and Aromatic Plants of Iran. Tehran: Farhang moaser; 2013. p. :579-589.
- Green synthesis of Au/TiO2 for effective dye degradation in aqueous system. Chem. Eng. J.. 2013;229:492-497.
- [Google Scholar]
- Handbook of Advanced Electronic and Photonic Materials and Devices. USA: Academic Press; 2001.
- Concentration of isoflavones and other phenolics in the aerial parts of Trifolium species. J. Agric. Food Chem.. 2007;55(20):8095-8100.
- [Google Scholar]
- Preparation and characterization of TiO2 nanoparticles surface-modified by octadecyltrimethoxysilane. Indian J. Eng. Mater. Sci.. 2013;20:561-567.
- [Google Scholar]
- Titanium dioxide photocatalysis of metals. Enve Bull.: Hazard. Waste Manage.. 2002;436(01):1-4.
- [Google Scholar]
- Energy level alignment of a Zinc (II) tetraphenylporphyrin dye adsorbed onto TiO2 (110) and ZnO (1120) surfaces. J. Phys. Chem. C. 2009;114(2):1139-1147.
- [Google Scholar]
- Room-temperature solid state synthesis of Co3O4/ZnO p–n heterostructure and its photocatalytic activity. Advanced Powder Technology.. 2017;28(3):953-963.
- [Google Scholar]
- Using different chemical methods for deposition of CdS on TiO2 surface and investigation of their influences on the dye-sensitized solar cell performance. Electrochim. Acta.. 2014;117:504-520.
- [Google Scholar]
- Synthesis of TiO2 nanoparticles by sol-gel method and their characterization. J. Basic Appl. Eng. Res.. 2014;1:1-5.
- [Google Scholar]
- Saponins and polar compounds from Trifolium resupinatum. Phytochemistry. 1999;51(8):1065-1067.
- [Google Scholar]
- Application of titanium dioxide photocatalysis to create self-cleaning materials. Roman. Tech. Sci. Acad. MOCM. 2007;13(3):280-285.
- [Google Scholar]
- Green synthesis of titanium dioxide nanoparticles by Nyctanthes arbor-tristis leaves extract. Chalcogenide Lett.. 2011;8(8):447-451.
- [Google Scholar]
- Amorphous and Liquid Semiconductors. London and New York: Plenum Press; 1974.
- Anatase type titania nanotube arrays direct fabricated by anodization without annealing. Appl. Surf. Sci.. 2009;255(6):3659-3663.
- [Google Scholar]
- Intrinsic electric field assisted polymeric graphitic carbon nitride coupled with Bi4Ti3O12/Bi2Ti2O7 heterostructure nanofibers toward enhanced photocatalytic hydrogen evolution. Int. J. Hydrogen Energy. 2016;41(38):16913-16926.
- [Google Scholar]
- The stability, electronic structure, and optical property of TiO2 polymorphs. J. Phys. Chem. C.. 2014;118(21):11385-11396.
- [Google Scholar]


