

Translate this page into:
A green approach: Eco-friendly synthesis of Gd2Ti2O7/N-GQD nanocomposite and photo-degradation and electrochemical measurement of hydroxychloroquine as a perdurable drug
⁎Corresponding author. salavati@kashanu.ac.ir (Masoud Salavati-Niasari)
-
Received: ,
Accepted: ,
This article was originally published by Elsevier and was migrated to Scientific Scholar after the change of Publisher.
Peer review under responsibility of King Saud University.
Abstract
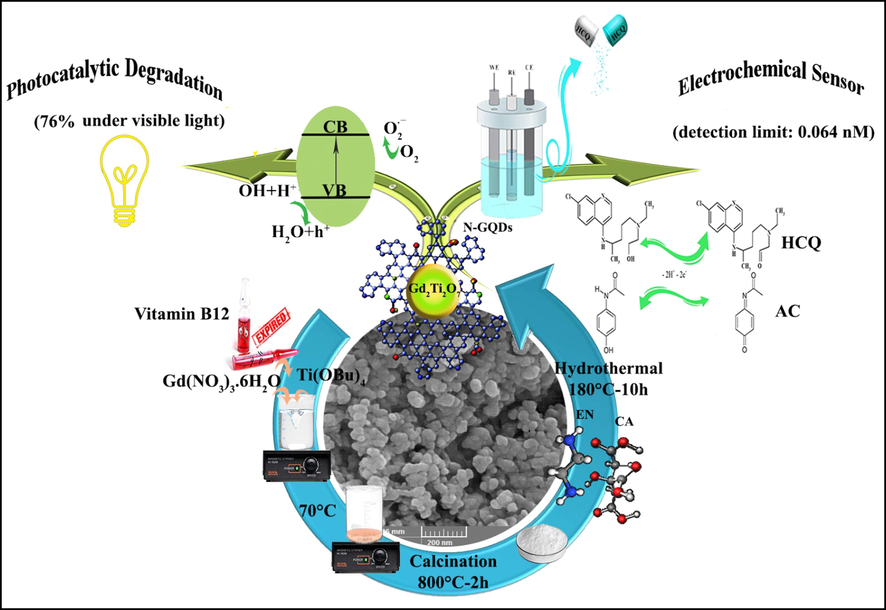
In this work, gadolinium titanate (GT = Gd2Ti2O7) nanoparticles were synthesized using expired vials of B12 vitamins (reusing the waste) as a capping agent and reductant by a sol–gel technique. Then, GT/N-GQD (nitrogen-doped graphene quantum dots) nanocomposite was prepared by synthesis of N-GQDs in presence of the GT nanoparticles. Next, this nanocomposite was used for photodegradation of hydroxychloroquine sulfate (HCQ) as a multi-function drug with a long half-life during the photocatalytic reactions under visible light. Because of the necessity of measuring the concentration of this drug in human blood serum, tablets, and wastewater, this nanocomposite was utilized as an electrochemical sensor for its detection. Finally, photocatalytic activity of this nanocomposite was approved by 76 % degradation percent of HCQ and the limit of detection (LOD) equals 0.064 nM confirmed that this sensor is the most sensitive sensor prepared for measurement of HCQ, up to now. Since acetaminophen (AC) is one of the most commonly used drugs which is usually consumed along with HCQ, the performance of this sensor was examined in presence of it. The results showed that the presence of AC couldn’t affect the performance of the sensor. The obtained results were supported by a variety of analyses.
Keywords
Gd2Ti2O7/N-GQD nanocomposite
Hydroxychloquine
Electrochemical sensor
B12 vitamin
Photocatalyst

1 Introduction
Sensors are devices that can respond to various stimuli such as sound, heat, magnetism, light, pressure and etc. In addition, the change in material properties can be measured by transmitting a resulting electrical impulse (Amoli et al., 2019). There are different types of sensors; one of the most important sensors is electrochemical sensors which utilizes an electrode as a transformer element in presence of an analyte (Qian et al., 2021). Today, these sensors have developed because of their ability to detect the various biological, physical, and chemical parameters (Zhu et al., 2021).
The unique properties of nanomaterials, induced by the quantum effects and high ratio of surface to volume, have developed their applications in various fields (Wu et al., 2020). Despite the different methods used for synthesis of nanomaterials, sol–gel is known as one of the best techniques that has diverse advantages such as: production of products with high purity and homogeneity, no need for expensive equipment, and using the simple and available precursors. Hence the various compounds were prepared by this technique (Mahdi, et al., 2022, 2020, 2021). The Conflation of sensors and nanotechnology has opened a new window for researchers. So, presenting the new manufacturing techniques and strategies for improvement of selectivity and detection limits of sensors can be considered as a new potential arose in this field (Mustafa et al., 2017).
Detection and measurement of drugs are so important in the pharmaceutical industry, also providing a selective and sensitive approach can play an important role in the development of this industry. However, different techniques have been performed for this aim, but the voltammetry carbon paste sensors (a mixture of graphite and pasting liquid) have attracted a lot of attention because they have many advantages such as surface recovery, inertness, stability and it has no need to the internal solution (Arguelho et al., 2003; Khalil et al., 2018). Upgrading the sensor performance can be done by modifying the electrode surface using carbon materials (Ganjali et al., 2010; Li et al., 2017; Tang et al., 2022), ionic liquid (Negahban et al., 2017), zeolites (Fekrya et al., 2020), metal–organic framework (Xin et al., 2020), metal oxide nanoparticles (Santhosh et al., 2020), composites (Chen et al., 2020; Kumar et al., 2020), and etc. Graphene quantum dots (GQD) with fascinating properties such as biocompatibility, good electrical conductivity, strong and adjustable luminescence light, and high specific surface area are one of the nanomaterials that are used for this purpose. The electronic performance and active sites of GQD can be increased by entering the heteroatoms such as nitrogen in the structure of it (N-GQD) (Li et al., 2009; Liu et al., 2011). Simultaneous utilization of the unique properties of GQD and nanoparticles is provided by the preparation of nanocomposites. There are many reports about using nanomaterials as sensors for detection of the specific objects.
Gd2Ti2O7 is one member of titanate pyrochlore family, with the general formula A2Ti2O7 (A = trivalent rare-earth ions) and the diverse applications (Mori et al., 2003; Sobhani-Nasab et al., 2019), has been synthesized by various methods including sol–gel (Zhang et al., 2018), auto-combustion (Jeyasingh et al., 2017), microwave (Tang et al., 2016), and ultrasonic techniques (Valdés-Ibarra et al., 2019). According to the previous studies, the electrochemical capacity of this compound can be impressed by carbon species (Ashrafi et al., 2019; Ganganboina et al., 2018; Muthusankar et al., 2020). So, this property can be useful for using this compound as a sensor.
As said above, combination of compounds as a nanocomposite can improve the properties of materials, so Gd2Ti2O7/N-GQD nanocomposites were prepared in this work. On the other sides, its application as a sensor for detection and measurement of HCQ was studied. HCQ as an anti-malaria drug is one of the derivatives of 4-aminoquinolone compounds what is used as a candidate to treat the some diseases such as polymorphic light eruptions, inflammatory, porphyria cutanea retardant (Ben-Zvi et al., 2012; Miβner and Kellner, 2012; Nimgampalle et al., 2020). However, the hydroxyl group on the side chain reduces its toxicity to chloroquine but overuse of it can have dangerous side effects on the outer retina and heart (Bansal et al., 2021). So, a proper sensor with high sensitivity and selectivity can decrease the side effects induced by drug association in body (terminal elimination half-life of HCQ is more than 40 days). On the other sides, long half-time of this drug can be dangerous for environment, so elimination of this drug from waste-water should be considered as a notable phenomenon for environmental purging. Therefore, potential of the as-prepared nanocomposite as a visible-active photocatalyst for removing this drug was investigated. High degradation percent of HCQ existed in an aqueous solution confirmed the performance of this nanocomposite as an effective photocatalyst for elimination of this drug. Since HCQ remains in diverse environments for a long time, detection and elimination of HCQ should be valuable. So, the as-prepared nanocomposite, with dual applications as the sensor for detection of HCQ and the photocatalyst for elimination of this drug, can be considered as an eco-friendly product. Synthesis of GT nanostructures with expired-date vials of B12 vitamin was another case for this claim. Although, the expired-date vials of B12 vitamin are useless but can be used for synthesis of nanomaterials. It should be noted that, the performance of the as-prepared sensor was without change in presence of AC that is usually consumed along with HCQ, simultaneously. The products were characterized by various analyses including XRD, SEM, TEM, EDS, and BET. Electrochemical sensing studies were done by unmodified CPE and modified GT/CPE by cyclic voltammetry.
2 Experimental
2.1 Materials and characterization
All materials were prepared of analytical grade without further purification. Ti(OBu)4, Gd(NO3)3·6H2O, ethanol, vitamin B12 (cyanocobalamin, VB12), ethylene diamine (EN), Hydroxy chloroquine (HCQ), Acetaminophen (AC), graphite powder, paraffin, K3Fe(CN)6, K4Fe(CN)6, H3PO3 and NaOH were purchased from Sigma-Aldrich, Merck or Pharmaceutical Company of Iran. Britton-Robinson buffers 0.2 M (in the pH range of 4.0–11.0) were prepared from 0.2 M of phosphoric acid, acetic acid, boric acid, and NaOH.
XRD (X-ray diffraction) patterns were collected from a diffractometer of the Philips Company with X’PertPro monochromatized Cu Kα radiation (λ = 1.54 Å). Microscopic morphology of the products was studied by FESEM (field emission scanning electron microscopy) (Mira3 tescan) and TEM (transmission electron microscopy) (HT-7700). EDS (energy dispersive spectrometry) analysis was studied by XL30, Philips microscope. Room temperature magnetic properties were investigated using a vibrating sample magnetometer (VSM, made by Meghnatis Daghigh Kavir Company) in an applied magnetic field sweeping between ± 10000 Oe. The UV–vis diffuse reflectance spectrum has been recorded with the aid of a UV–vis spectrophotometer (Shimadzu, UV-2550, Japan) in a range between 200 and 700 nm.
2.2 Fabrication of Gd2Ti2O7 nanostructures
Gd2Ti2O7 nanostructures (GT) were synthesized through a synthetic procedure as shown in Scheme 1. Mechanism of synthesis is similar to that reported in Ref. (Valian et al., 2022b). Initially, 0.3 g of gadolinium nitrate hexahydrate, and 0.226 ml (226 μL) of tetra-n-butyl orthotitanate (Ti (OBu)4) (molar ratio of Ti: Gd = 1:1) were dissolved separately in some ethanol, then were added together. Then the expired-date vial of B12 vitamin (1000 mcg/mL) was added as a capping agent to the above solution while it was slowly stirred and heated at about 90 °C. Finally, the uniform gel was formed and dried at 70 °C for 24 h in a vacuum oven. Next, the resulted powder was calcined at 800 °C for 2 h. The preparation conditions of Gd2Ti2O7 nanostructures (GT) and GT/N-GQD nanocomposite are described in Table 1.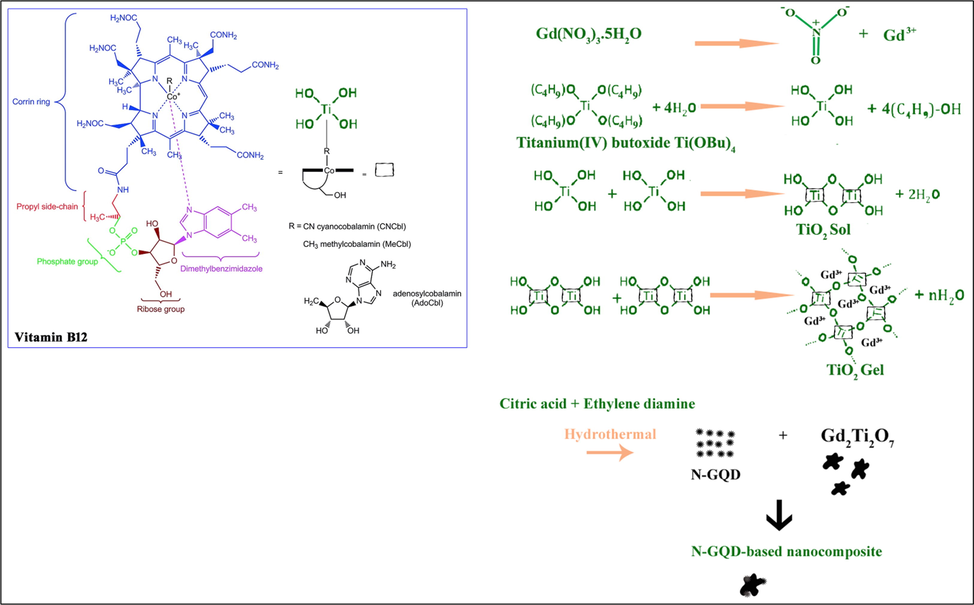
The proposed mechanism for synthesis of GT nanostructure using vitamin B12 by auto-combustion sol–gel technique.
Sample No.
Calcination Temperature (oC)
Capping agent
The product (based on XRD)
1
800
B12 Vitamin
GT
2
800
–
GT/TiO2
3
800
B12 Vitamin
GT/N-GQDs
2.3 Fabrication of GT/N-GQD nanocomposites
GT/N-GQD nanocomposite was prepared by a simple one-step hydrothermal process using citric acid (CA), ethylene diamine (EN), and GT nanostructures. In summary, 100 mg of CA and 0.4 ml of EN were dissolved in 15 ml of distilled water to form a transparent solution. Afterward, 20 mg of the prepared GT nanostructures (that prepared in section 2.2) was added to the solution and put in a 25 ml autoclave of Teflon-lined stainless steel and kept at 180 °C for 10 h. Then, the dark brown solution was filtered through a 0.22 μm filter membrane, and the GT/N-GQD nanocomposite was washed several times with ethanol and distilled water to remove impurities. Finally, the product was dried in an oven at 60 °C for 3 h.
2.4 Fabrication of bare electrode and GT/N-GQD based electrochemical sensor
Electrochemical characteristics of the modified electrodes were measured using the voltammetry technique in a conventional three-electrode cell including a carbon paste electrode modified with GT/N-GQD nanocomposite (GT/N-GQD/CPE) as the working electrode, Ag/AgCl electrode saturated with KCl (3.0 M) as the reference electrode, and a platinum wire (Metrohm, Switzerland) was evaluated as the contour electrode.. In this system, the working electrode had contained a carbon paste electrode (CPE) modified with GT/N-GQD nanocomposite. GT/N-GQD/CPE was ready using 0.06 g of GT/N-GQD nanocomposites and 10.0 ml deionized water. For better homogenization, the mentioned suspension was dispersed in an ultrasound bath for 30 min, and then it well mixed with 0.44 g of graphite powder. Following the vaporizing water, the carbon paste was ready by hand-mixing of about 0.2 ml of paraffin oil with the above mixture. Finally, the mixture was mixed for 70 min until a uniformly wet paste was resulted. All electrochemical measurements were performed in Briton-Robinson buffer (BR-buffer, 0.2 M) in a mixture of H3BO3, H3PO4 and CH3COOH with a volume ratio of 1:1:1. The formed carbon paste was manually packed into a Teflon syringe (U = 2.0 mm). The external electrical connection was established by embedding a copper wire in the tube (Valian et al., 2022a). Unmodified carbon paste electrode was prepared by hand-mixing of 0.5 g of graphite powder plus paraffin. For comparison, GT/CPE, and N-GQD/CPE were prepared by a similar process.
2.5 Real samples preparation
Human serums were received from a healthful proffer and patients’ ones that consumed the HCQ at Shahid Beheshti hospital (Kashan, Iran). The serum was centrifuged at 3000 rpm (10 min) and was kept at 4 °C for phase separation. This serum was diluted 500 times with 0.2 M Briton Robinson buffer at pH 9.0.
Five tablets of HCQ (Amin Pharmaceutical 200 mg) were finely powdered; the value of HCQ powder (for 1.0 mmol/L HCQ) was dissolved in deionized water and ethanol. To complete the dissolution of the solution, it was carefully sonicated for 10 min. Ultimately, the solution was filtered through a 0.45 μm membrane filter. The pharmaceutical samples were appropriately diluted by Briton-Robinson buffer (pH = 9.0) to fit the linear range.
Various effluents of the pharmaceutical manufactory (Kashan, Iran) were used to study the real samples. The samples were filtered through a 0.45 μm membrane and were centrifuged to remove suspended particles. Then, the wastewater samples were suitably diluted by Briton–Robinson buffer solution of pH 9.0 to fit the linear range.
2.6 Photocatalytic experiments
The photocatalytic process under visible light was performed to prove the ability of GT/N-GQD nanocomposite for the elimination of HCQ. The photocatalytic tests were carried out under a 300 W xenon lamp as a visible light source with a 420 nm cut-off filter (λ > 400 nm). The quartz vessel including the photocatalyst sample (0.05 g) and drug solution (10 ppm) was 40 cm away from the lamp inside a dark box. At the first, the mixture was aerated for 30 min to reach adsorption equilibrium. The effective parameters on the photocatalytic degradation of HCQ were changed, so that the maximum percent was obtained when pH of the solution was adjusted in 3, and the concentration of drug solution and the amount of the as-prepared nanocomposite were 10 ppm and 0.1 g, respectively. Then, the tests were conducted at 25 °C and the admixtures were subjected to the lamp source. Then, the absorption of solutions was recorded during the certain time range from 10 to 90 min by a UV–vis spectrometer.
3 Results and discussion
3.1 Characterization of GT nanostructures
3.1.1 FESEM images
The development of industries causes to increase the environmental pollutions, so the researchers tried to present different ways for decreasing them. Substituting the natural materials with lower risk rather than chemical reactants, and reusing the materials that are considered as waste can help to decrease pollutants. Recently, using expired-date vitamin drugs for the synthesis of nanomaterials has developed (Jha and Prasad, 2010; Nadagouda and Varma, 2006; Prasad et al., 2010). Although vitamins are antioxidant agents and can be used as reductants in chemical reactions (Devaki and Raveendran, 2017; Nadagouda and Varma, 2008; Tang et al., 2017), but their massive structures shouldn’t be ignored because they can play as capping agents for the synthesis of nanomaterials. Choosing the vitamins should be based on their role, for example: vitamin C, vitamin E, and beta-carotene are three major antioxidant vitamins and B-group vitamins such as Thiamine (VB1), Pyridoxine (VB6), and Cobalamins (VB12) that are water-soluble, can be used as capping agents.
Fig. 1a illustrates FESEM images of GT nanostructure synthesized in the presence of VB12. To study the role of VB12 as capping agent, a sample was synthesized without any vitamins and this sample was considered as a blank sample. According to FESEM images of the blank sample (Fig. 1b), micro-sized irregular structures with an average diameter of about 300 nm were produced without using any capping agent. So, the role of VB12 with a massive structure was confirmed as a capping agent.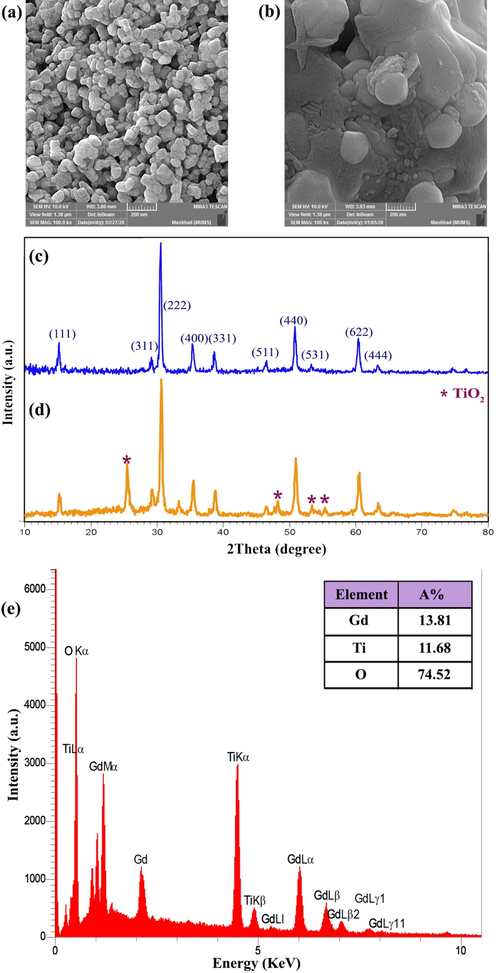
(a), (b) FESEM images (c), (d) XRD patterns of samples 1 and 2, respectively and (e) EDS spectrum of sample 1.
3.1.2 XRD and EDS studies
XRD pattern can be used to identify the purity and crystal structure of materials. According to Fig. 1c, Gd2Ti2O7 nanostructures were successfully synthesized. All the diffraction lines are in accordance with the reference pattern with the JCPDS card No. 01-073-1698, space group: Fd3m, a = b = c: 10.18 Å, and cubic phase. The crystallite size of this sample was estimated about 25 nm using Scherer’s equation (Eq. (1)) as follows:
According to this equation, K is the claimed shape parameter, which generally catches an amount of about 0.9, λ is the wavelength of the X-ray source, and β is defined as the width of the diffraction line at its half- severity maximum.
Continuously, the role of vitamin B12 on the purity of the product was investigated and the pattern related to the blank sample was given in Fig. 1d. The formation of the TiO2 phase as a by-product with the tetragonal phase (JCPDS 00-004-0477), which was confirmed through the peak growth at 2θ = 25.354°, along with the main product is a proof for importance of the presence of B12 in this work.
By considering these results, it should be noted that vitamin B12 could play two roles including: capping agent for controlling the growth of structures and reducing agent for progressing the synthesis process through the auto-combustion sol–gel technique. In auto-combustion technique, the reaction can be carried at a low temperature (Birajdar et al., 2018) and produced products with higher purity and smaller size. So, TiO2 as an impurity phase was undetectable.
So, vitamins can affect the products of chemical reactions, in addition to morphology of them.
Chemical purity and detection of elements of gadolinium titanate nanostructures were studied by EDS analysis. As shown in Fig. 1e, the EDS spectrum confirmed the purity of sample 1 without any impurities.
3.2 Vitamin B12 action mechanism
In order to understand the effect of B12 on the synthesis process, it should be study the structure of B12 (Scheme 1). As seen, there are different sites in this molecule that can be modified, including the cyano group bound to the cobalt center, the phosphate moiety, the propyl side-chain, (in principle) the amide groups in the corrin ring, and the hydroxy groups on the ribose component. So, interaction of the Ti precursor (tetra-n-butyl orthotitanate as a precursor) and B12 can be justified as the same as the other organometallic compounds (Pettenuzzo et al., 2017). Also, B12 could be attached to Ti precursor as the second ligand and formed the massive complex. This complex contributed to the reaction with gadolinium nitrate to synthesize Gd2Ti2O7 nanoparticles by the auto-combustion sol–gel technique (according to that shows in Scheme 1).
3.3 Analyses of GT/N-GQD nanocomposites
3.3.1 Electron microscope images
FESEM images of the GT/N-GQD nanocomposites are shown in Fig. 2a and b, that confirm the synthesis of mono-disperse nanostructures with an average diameter less than 25 nm.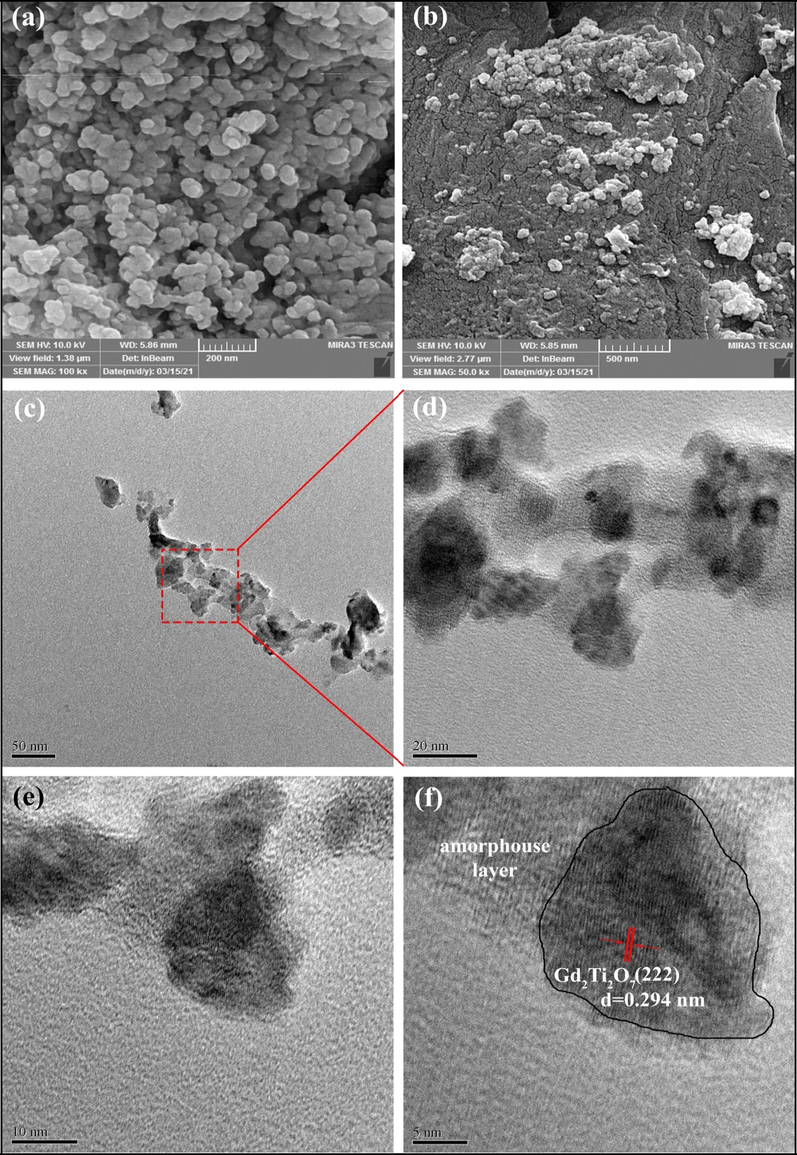
(a, b) FESEM micrographs and (c-f) HRTEM images of sample 3.
Fig. 2 illustrate the HRTEM of the nanocomposite, the presence of Gd2Ti2O7 nanoparticles with an average size of about 20 nm, along with the fine particles of GQD are detectable. The high-resolution images demonstrate high crystallinity of the nanostructures with no irregularities. The distance between the two crystalline planes of this sample was 0.294 nm, which represents the crystal planes (2 2 2) of cubic Gd2Ti2O7 crystals.
3.3.2 XRD and EDS studies
To study the purity of the synthesized N-GQD, the XRD pattern of nanocomposite and components of it were given in Fig. 3. As expected, the pattern of nanocomposite should be encompassed both of GT nanostructures (Fig. 3a) and N-GQD (Fig. 3b). The semi-crystalline phase of this product (Fig. 3c) was in accordance with that reported previously (Jasim et al., 2022; Ganduh et al., 2021). So, the successful preparation of GT/N-GQD nanocomposite was confirmed.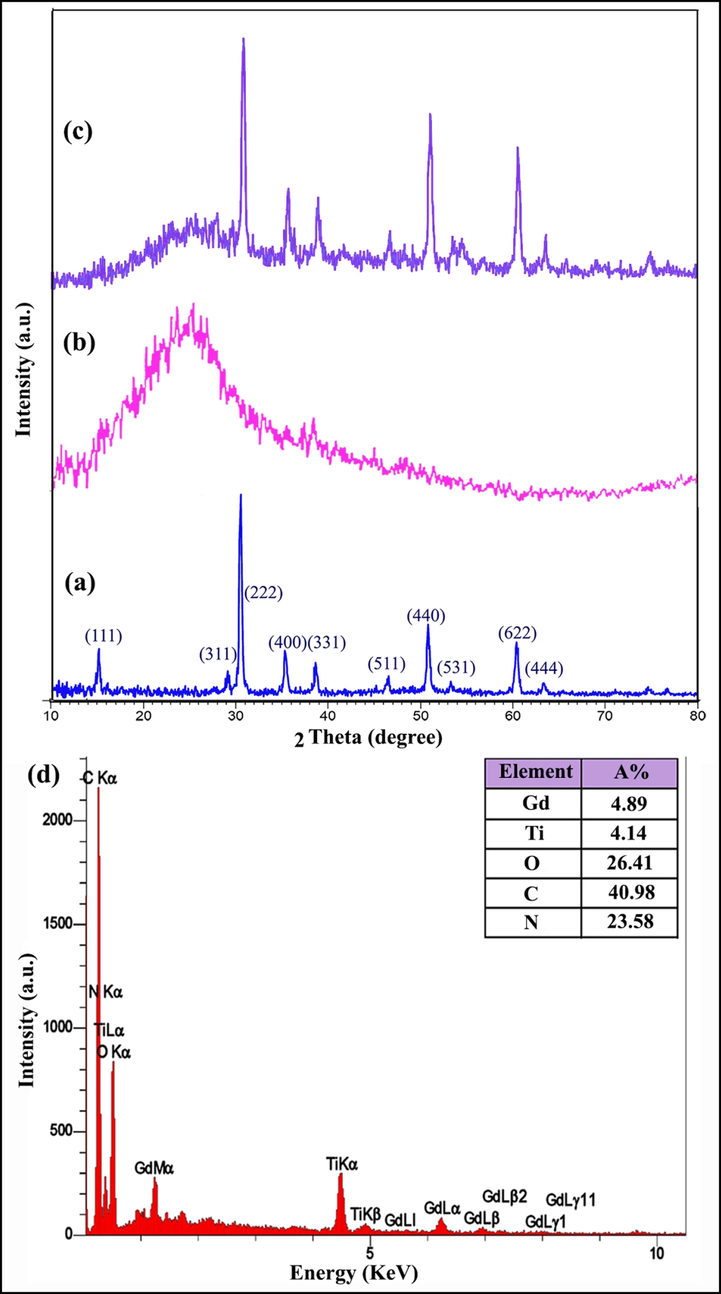
XRD patterns of samples:(a) 1, (b) nitrogen-doped graphene quantum dots (N-GQDs), (c) 3 and (d) EDS spectrum of sample 3.
Fig. 3d shows the EDS spectrum of the nanocomposite, C and N elements induced by the presence of N-GQDs in the nanocomposite are detectable.
3.3.3 FT-IR spectrum
Fourier transform infrared (FT-IR) is a suitable instrument, which can be used to understand most of the polar bonds and functional groups. FT-IR spectrum of sample 1 (S1) shows a wide absorption at 3440 cm−1 and a weak band of about 1600 cm−1 that can be related to the stretching vibrations of the hydroxyl groups due to adsorbed water molecules. The mild band that appeared at 2922 cm−1 can be corresponded to the C—H stretching of CH3 and CH2 groups of ethyl alcohol and Ti(OBu)4 (Velasco et al., 1999). According to this spectrum, the bands located at the range of 400–580 cm−1 are ascribed to M—O stretching vibrations, and the band at about 454 cm−1 related to Gd–O a stretching vibration that confirms the structure of titanate pyrochlore (Gokul Raja et al., 2020). FT-IR spectrum of sample 3 (GT/N-GQD nanocomposite) shows in Fig. 4. In addition, the peaks mentioned with slight red-shifted of the absorption location, the characteristic bands for stretching vibration of ⚌C—H at 782 cm−1, C—O at 1052 cm−1, C—N at 1386 cm−1, C⚌C at 1553 cm−1 and C⚌O at 1658 cm−1 are ascertained (Li et al., 2017). The results clearly indicate that the resulting nanocomposite contains N-containing functional groups and COOH.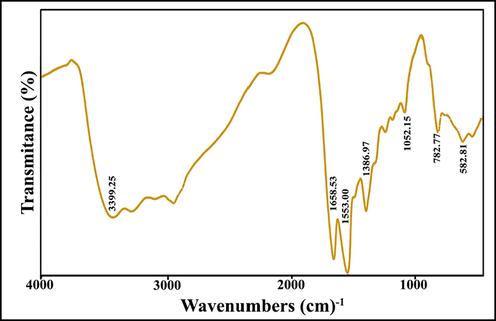
FT-IR spectrum of sample 3.
3.3.4 BET analysis for GT/N-GQDs nanocomposites
N2 adsorption/desorption isotherm and BJH plot of GT/N-GQD nanocomposites are shown in Fig. 5a and b. This technique is employed to identify the specific surface area, pore diameter, and specific pore volume of porous and nano-scale materials. The isotherm related to sample 3, could be considered as type III isotherm with an H3 hysteresis loop. The total pore volume, surface areas, and average pore diameter for this sample were estimated at about 0.1094 cm3/g, 50.046 m2 g−1, and 8.7419 nm, respectively.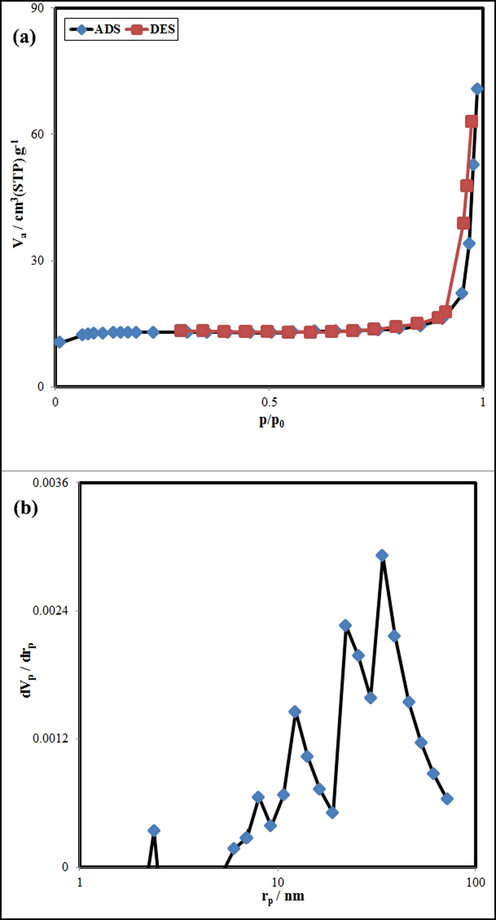
(a) N2 adsorption/desorption isotherm and (b) BJH plot of sample 3.
3.3.5 Optical properties
By considering the related works, it was confirmed that Gd2Ti2O7 is a p-type semiconductor and N-GQD is a n-type semiconductor. So, it can be said that the as-prepared nanocomposite is a n-p heterojunction that increases the photocatalytic efficiency by increasing the absorption (the role of N-GQD as photosensitizer) and decreasing the recombination of photogenerated charge carriers (the role of N-GQD as an electron acceptor). The performance of GQD as electron acceptor and photosensitizer were demonstrated in ref. (Min et al., 2017). It should be noted that the presence of N as dopant in GQD improves the absorption in visible range so that it is a promising material for preparation of visible-active photocatalysts (Xie et al., 2017).
As shown in refs. (Adel et al., 2021; Sun et al., 2019), N-GQD represents two absorption bands at about 235 and 340 nm which could be attributed to the π-π* transition of aromatic C⚌C domains and the n-π* transition of C⚌O or C⚌N, respectively . In addition, DRS spectrum of Gd2Ti2O7 as a semiconductor represents an absorption band at 327 nm and band gap calculated for it was reported 3.2 eV by Tauc equation:
In order to find the effect of N-GQD on the optical properties of Gd2Ti2O7, DRS spectrum of this nanocomposite was given in Fig. 6a. The presence of two absorption bands at about 242 and 337 nm proved the presence of both of compounds. The broad peak at 330–340 nm consists the absorption bands of N-GQD and Gd2Ti2O7, together. As is shown clearly, the absorption bands of nanocomposite in comparison with the pristine constituents shifted to lower wavelength (Red-shift) that is induced by incorporation of N-GQD and interaction between Gd2Ti2O7 and N-GQD (Xu et al., 2017). Band gap of this nanocomposite was calculated by Tauc equation. As shown in Fig. 6b, the band gap of the as-prepared nanocomposite (2.88 eV) is lower than pristine Gd2Ti2O7 (3.2 eV). It can be justified by indirect optical transitions that is induced by presence of N-GQD which increases absorption intensity and decreases band gap through the p-n heterojunction configuration.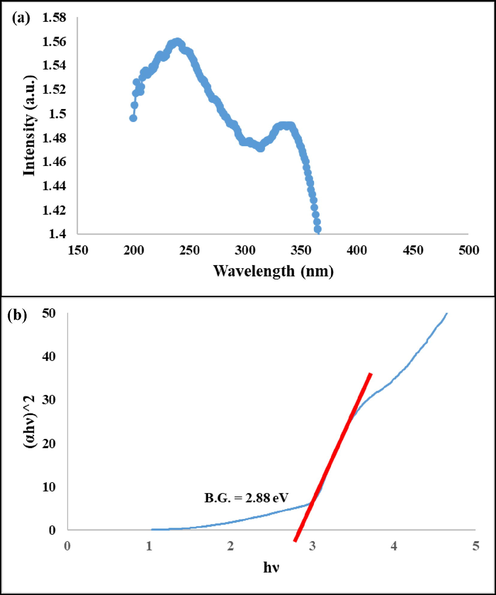
(a) DRS spectrum and (b) (Ahυ)n versus hυ curve of the as-prepared nanocomposite.
3.4 How to interact GT nanoparticles with N-GQDs
It seems that, the functional groups at edges of N-GQDs (COOH and N-containing functional groups) can be agent attaching to GT nanoparticles that have dangling bonds (Calestani, 2019). Consequently, N-GQDs are attached to GT nanoparticles and they couldn’t remove during the process by washing and filtration. In fact, GT nanostructures as the first phase are substrates that GQDs as the second phase were put on them.
3.5 Electrochemical sensing studies
The electrochemical behavior of GT/N-GQD/CPE, GT/CPE, N-GQD/CPE, and unmodified CPE were investigated by cyclic voltammetry (CV) in the electrolyte of 0.1 M phosphate buffer containing a redox probe (5.0 mM K4Fe(CN)6 and K3Fe(CN)6) at a scan rate of 100.0 mVs−1. Fig. 7a-c demonstrates the anodic peak current (Ipa) of the unmodified electrode (a-curve) should be improved by modifying the electrode as GT/CPE electrode (b-curve), and N-GQD/CPE electrode (c-curve), this modification can multiply this current. Also, ΔEp for the GT/CPE electrode (311 mV) was lower than which resulted from the bare CPE (417 mV). When the GT/CPE electrode was implied, the Ipa increased and the ΔEp decreased in the oxidation peak potential, so the acceptable conductivity and the larger electroactive surface area of Gd2Ti2O7 nanostructures was proved. This is induced by improving the electron transfer rate constant of Fe(CN)63−/4− redox reaction (Shahamirifard et al., 2018). According to the d-curve, the GT/N-GQD/CPE electrode presents an impressive upgrade in Ipa compared to the others. This phenomenon can be explained by increasing the attraction of Fe(CN)6 3-/4-on the surface of the electrode by adding the N-GQD as GT/N-GQD nanocomposite.![Cyclic voltammograms of 5.0 mM [Fe(CN)6]3-/4- in Britton–Robinson buffer (pH = 7.0) at the surface of: (a) CPE, (b) N-GQDs/CPE, (c) GT/CPE, and (d) GT/N-GQDs/CPE, scan rate 100.0 mVs−1.](/content/184/2023/16/1/img/10.1016_j.arabjc.2022.104401-fig8.png)
Cyclic voltammograms of 5.0 mM [Fe(CN)6]3-/4- in Britton–Robinson buffer (pH = 7.0) at the surface of: (a) CPE, (b) N-GQDs/CPE, (c) GT/CPE, and (d) GT/N-GQDs/CPE, scan rate 100.0 mVs−1.
The electroactive surface area that is termed the real surface area can be calculated using the Randles-Sevcik equation (Bard, 1980). This parameter for bare CPE, GT/CPE, and GT/N-GQDs/CPE were obtained at 0.021, 0.055, and 0.068 cm2, respectively. These results clearly reveal that GT/N-GQDs/CPE can provide an effective sensing performance as compared to the other electrodes.
3.5.1 Electrocatalytic properties of the GT nanostructures and GT/N-GQD/CPE
Fig. 8a-c illustrate the cyclic voltammogram responses of the modified and unmodified electrodes in the absence and presence of HCQ at a concentration of 70.0 μM in Britton-Robinson buffer (pH 9.0). The oxidation reaction of HCQ is dependent to pH, so pKa amounts of the functional groups of this drug can present the different oxidation peaks (de Oliveira S. Silva et al., 2021). The second anodic peak did not show sufficient sensitivity, so the first anodic peak was used in in this study. The GT/N-GQD/CPE modified electrode showed better electrocatalytic oxidation behavior towards HCQ. According to cyclic voltammograms in this figure, an electrochemically irrevocable process due to the absence of cathodic peak on the reverse scan within the considered potential range (0–1.0 V) is detectable. As evidenced, the oxidation peak current at the bare CPE (0.17 μA) is weak (a-curve) with an oxidation potential of 0.590 V. By contrast, at the modified electrodes surface N-GQD/CPE (1.82 μA) (c-curve) and GT/CPE (2.51 μA) (d-curve), the peak current enhances by improving the electron transfer rate for HCQ, and the anodic peak potential of HCQ decreased to 0.570 V. These results showed that the presence of Gd2Ti2O7 nanostructures along with the nitrogen-doped graphene quantum dots affects the anodic peak current (4.26 μA, e-curve) of the electrode, gradually. Excellent electrocatalysis characteristics, good biocompatibility, fine electrical conductivity, high surface area, and more electroactive interaction sites are advantages of it. Thus, it is clear that the suggested modified electrode can provide a particular way for sensitive electrochemical determination of analytes.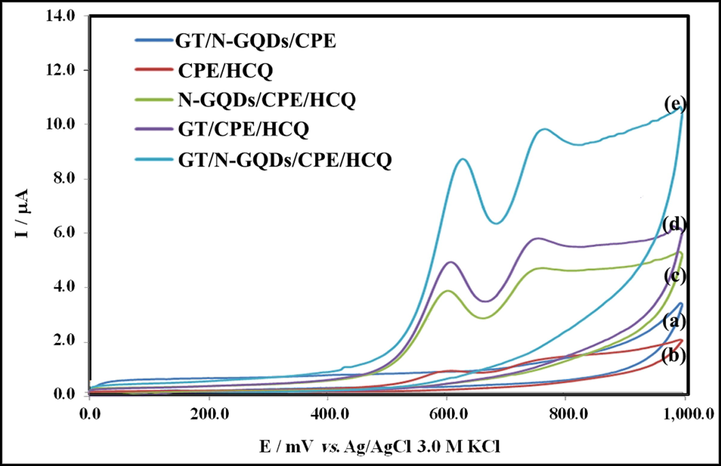
Cyclic voltammograms of (a) GT/N-GQDs/CPE in Britton–Robinson buffer (pH = 9.0), and CV responses to 70.0 μM HCQ at the surface of different platforms (b) CPE, (c) N-GQDs/CPE, (d) GT/CPE and (e) GT/N-GQDs/CPE, scan rate 100.0 mVs−1.
3.5.2 Scan rate dependence study
The influence of scan rate on the electro-oxidation of HCQ using the GT/N-GQD/CPE was investigated by CV (Fig. 9a) to receive feedback about the electrochemical mechanism from the affiliation between anodic peak oxidation current Ipa (μA) and potential scan rate, υ (mV s−1). Following Fig. 9b, the change in the anodic current was a linear function of the square root of the scan rate, ranging from 20.0 to 120.0 mV s−1, and it can be expressed as:
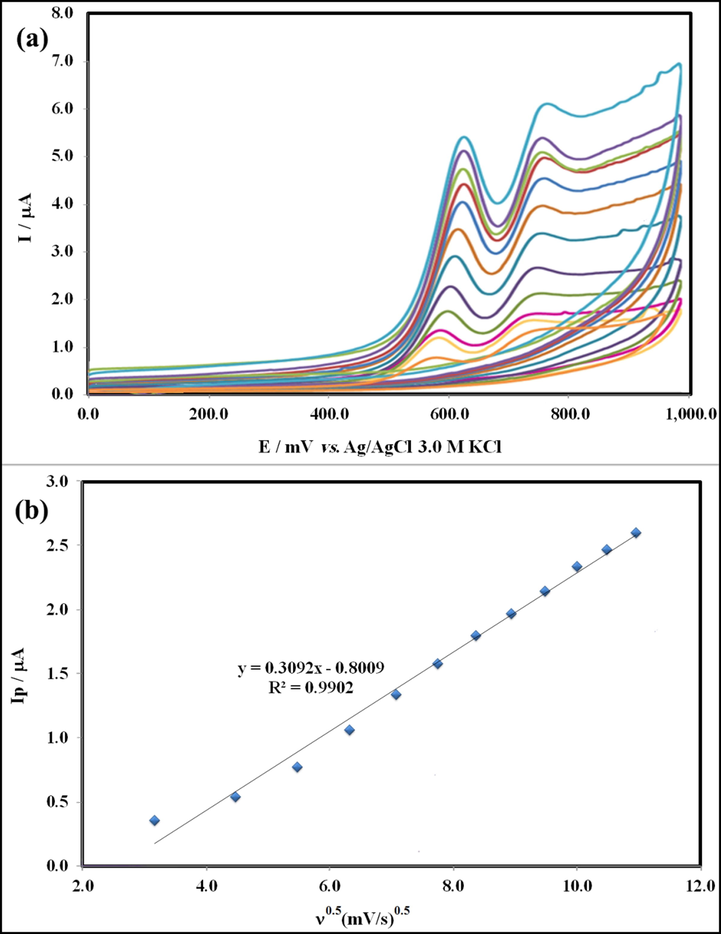
(a) Cyclic voltammograms of HCQ in Britton–Robinson buffer (pH = 9.0) at the surface of GT/N-GQDs/CPE, using various scan rates: 20–120 mV s−1 (from inner to outer) and (b) peak current, Ip (μA) vs υ1/2.
These results propose that the electrode process of HCQ was diffusion controlled (Deroco et al., 2014).
3.5.3 Optimization of experimental conditions
3.5.3.1 Effect of the nanostructures amount
Since the anodic peak current depends on the conductivity of the electrode, the amount of modifier can be considered as an effective parameter. So, the effect of the loading amount of modifier on the electrochemical behavior was investigated by differential pulse voltammetry (DPV). Fig. 10a A-E shows DPV of different amounts of Gd2Ti2O7/nitrogen-doped graphene quantum dots (GT/N-GQD) (4, 8, 12, 16, and 20 %, w/w of GT/N-GQD to graphite powder) in Britton-Robinson buffer (pH 9.0) containing 40.0 μM of HCQ. Fig. 10a C shows that the anodic peak current of HCQ reaches the highest value at 12 % of the modifier and decreases the peak current in the higher concentrations (Fig. 10a D, E). The diagram of I (μA) versus % w/w of GT/N-GQD to graphite powder at the surface of GT/N-GQDs/CPE was drawn in Fig. 10 b. This figure shows that the effect of the modifier (nanocomposite) amount on current induced by anodic peak was remarkable. By considering the maximum current, the nanostructure amount for all subsequent experiments was considered as 12 %. It can be assumed that higher loading reduces the concentration of graphite powder and the conductivity of the electrode. Furthermore, the adsorption sites in the paste reduce.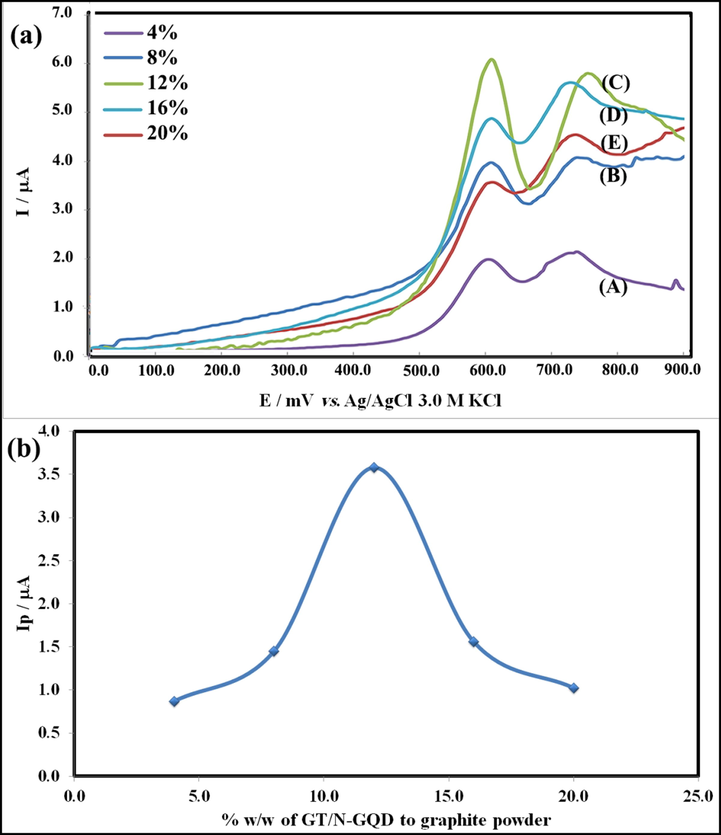
(a) Differential pulse voltammograms of HCQ at various percent of GT/N-GQDs modifier at the surface of GT/N-GQDs/CPE, and (b) DPV Intensity of HCQ, I (μA) vs % w/w of GT/N-GQD to graphite powder at the surface of GT/N-GQDs/CPE.
3.5.3.2 pH dependence study
The pH of supporting electrolytes has a significant role in optimizing the experimental conditions. Therefore, the dependence of the sensor response on pH in a 0.2 M Britton-Robinson buffer containing 40.0 μM HCQ with pH values from 4.0 to 10.0 was studied by DPV (Fig. 11a). As set out in Fig. 11b, by increasing the pH ranging from 4.0 to 9.0, a shift toward negative values happened for oxidation peak potential and the current signal of HCQ progressively increased with raising the pH value. So it is expected that deprotonation directly occurs in the oxidation of HCQ (Fig. 11c). Also, the regression equation was as follows:
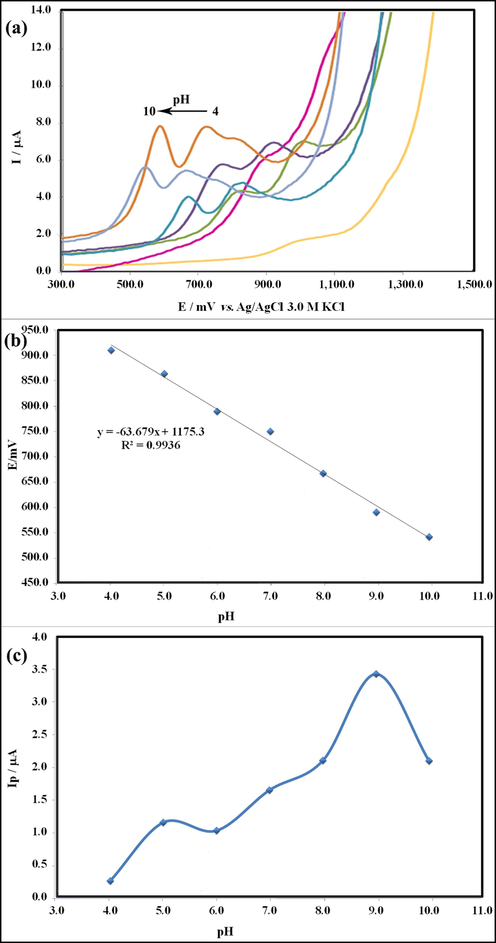
(a) DPV of HCQ at various pH values at the surface of GT/N-GQDs/CPE, (b) Electrochemical potential of HCQ, Epa (mV) vs pH at the surface of GT/N-GQDs/CPE and (c) DPV Intensity of HCQ, I (μA) vs pH at the surface of GT/N-GQDs/CPE.
In agreement with the Nernst equation (Eq. (2)), the slope (−0.0636 V/pH) for HCQ, indicates that the oxidation of HCQ consistent with an equal number of protons and electrons involved in the electro-sensing mechanism (Deroco et al., 2014) and the maximum of the Ipa for achieving the highest sensitivity of HCQ was attained in the pH = 9.0 (inset c). The redox reaction mechanism of HCQ was suggested as shown in Scheme 2.
Schematic illustration of preparation of GT/N-GQDs nanocomposite and performances of electrochemical sensor for detection of HCQ in the presence of Acetaminophen (AC).
3.5.4 Determination of HCQ at the surface of the sensor modified by nanostructures
The aim of this work was the introduction of a sensitive electrochemical sensor for detection and measurement of HCQ by a proper technique that resulted using GT/N-GQD/CPE and DPV technique. Under the optimized conditions, the DPV technique was utilized to evaluate the concentration and detection limit of HCQ at the GT/N-GQD/CPE. Following Fig. 12a, the differential pulse voltammograms show different concentrations of HCQ from 0.0001 μM to 170.0 μM with two clearly detached anodic peaks, consistent with the oxidation of HCQ. Furthermore, the analytical curve in Fig. 12b, shows two linear ranges between peak currents of HCQ oxidation (Ipa) and the concentration of HCQ (C (μM)) from 0.0001 to 0.60 μM and 0.60–170.0 μM with the linear regression equations of the Ipa (μA) = 2.0613C (μM) + 0.3588 (R2 = 0.9905) and Ipa (μA) = 0.0334C (μM) + 1.8912 (R2 = 0.9902), respectively. The detection limit (LOD) of HCQ on the surface of the proposed modified electrode was found to be 0.064 nM by studying the first linear dynamic range. This value demonstrates the very susceptibility of the suggested method.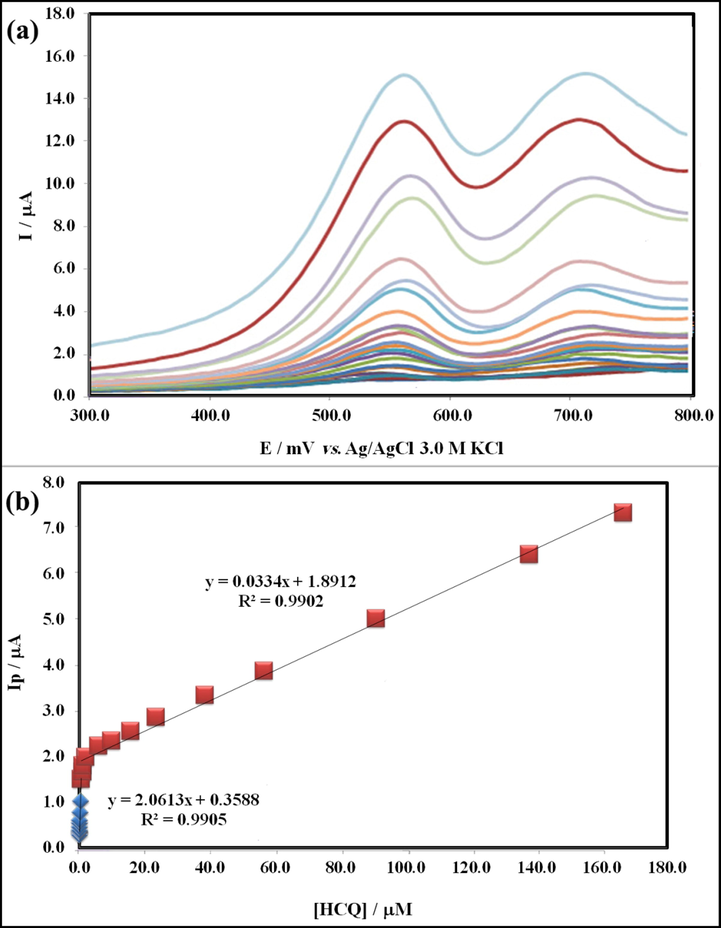
(a) Differential pulse voltammograms recorded in 0.2 M Britton-Robinson buffer at pH = 9.0 after addition of HCQ for obtaining final concentrations in the range of 0.0001–170.0 μM and (b) plots of peak current as a function of HCQ concentration.
3.5.5 Stability, repeatability, and selectivity examination
The repeatability and stability of the analytical signal were studied using DPV data under the optimized conditions. To investigate the reproducibility, the GT/N-GQD/CPE was employed five times, separately for measuring the 40.0 μM of HCQ solution where no apparent decrease in the recovery of DPV response was noted. The relative standard deviation (RSD) values of HCQ at concentrations of 40.0 μM were calculated to be 2.92 %, indicating the excellent reusability of the sensor GT/N-GQD/CPE for the HCQ analysis. The stability of the designed electrochemical sensor was also reviewed. The electrodes were evaluated by comparing the oxidation peak currents for HCQ from a solution containing 40.0 µM over a period of 1 month (Fig. 13). The results did not indicate any significant fluctuations in peak current (3.15 % for HCQ), indicating the good stability of the GT/N-GQD/CPE electrode in optimized conditions. The exceptional selectivity, reusability, and stability factors of GT/N-GQD/CPE can be attributed to the increase of surface area, stability, inertia, and biocompatibility of the synthesized nanostructures with zero or minimal reactive functionalities, which increased the oxidation of HCQ and reduced the likelihood of adsorbed impurities on the surface.
Long-term stability of GT/N-GQDs/CPE for the determination HCQ.
The effects of metal ions and organic compounds on the determination of HCQ were considered under the optimal experimental conditions with 40.0 μM of HCQ at pH = 9.0 by DPV. In this study, the potentially interfering substances from common interferential cations and anions such as Na+, K+, Mg2+, Ca2+, NH4+, CO32−, and SO42− and some biological fluids including glucose, fructose, lactose, l-alanine, urea, and glycine were used. The results were submitted in Table 2. These results signify the good anti-interference capability of the GT/N-GQD/CPE in the presence of the most usual interfering species for the determination of HCQ.
Foreign substance
Tolerance level (µM)
RSD (%)
K+, Na+, Ca2+, NH4+, Cl-
6000
1.89
g2+, CO32–, SO42–
2000
1.75
l-alanine, Urea
1300
1.52
Glycine
1200
1.92
Glucose
2000
1.45
Fructose, lactose
1500
1.68
3.5.6 Determination of HCQ in the presence of AC
To the best of our knowledge, HCQ and AC have been examined in multiple clinical trials for the management of infection and reduction of the fever symptoms (Davoodi et al., 2020). Hence, the primary purpose of this study was the selective determination of HCQ in presence of AC at GT/N-GQD/CPE. To attain this objective, voltammograms of a mixture of HCQ and AC on the bare electrode and the electrodes modified by GT/N-GQD/CPE were reported. Fig. 14a depicts the CVs of the mixture solution containing 40.0 μM HCQ and 50.0 μM AC at the bare CPE and GT/N-GQD in 0.2 M B-R buffer solutions (pH 9.0). It seems, the voltammetric peaks of HCQ and AC have appeared at 570.0 mV and 297.0 mV using the GT/N-GQD/CPE, respectively. In addition, the ratio of the anodic current response of the modified electrode to the bare electrode in the presence of HCQ was about 2.4. These diagrams confirmed that the three well-defined anode peaks at the surface of the electrode modified by GT/N-GQD/CPE are related to the oxidation of HCQ and AC. According to the results, the catalytic effect of GT/N-GQD has helped to sensitively designate the HCQ in the presence of AC on the surface of the modified electrode. Fig. 14b presents the differential pulse voltammograms by alternately changing the concentration (0.002–0.15 μM) of HCQ in the presence of 50.0 μM AC at GT/N-GQD/CPE. Fig. 14c also shows the HCQ calibration plot in the presence of acetaminophen and at GT/N-GQD/CPE under optimal conditions. As expected, increasing the HCQ concentration increases the response of the biosensor to HCQ, linearly, while the anodic peak current of AC has no change. The similarity of the slopes of the linear graphs in the calibration plots in the presence and absence of AC showed that the interference of AC was negligible and it has had no effect on the sensitivity of designation of HCQ in low concentrations.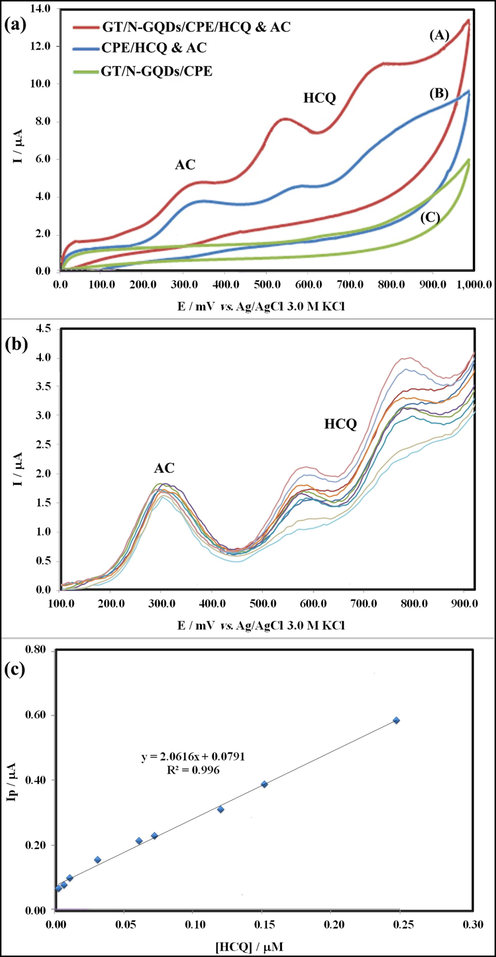
(a) Cyclic voltammograms of (A) GT/N-GQDs/CPE in Britton–Robinson buffer (pH = 9.0), (B) CPE in the presence of HCQ & AC, and (C) as (A) in the presence of HCQ & AC. (b) Differential pulse voltammograms recorded in 0.2 M Britton–Robinson buffer at pH = 9.0 containing 50.0 μM AC and after addition of HCQ for obtaining final concentrations in the range of 0.002 – 0.15 μM, and (c) plots of peak current as a function of HCQ concentration.
3.5.7 Analysis of real complicated samples
HCQ has a high chemical potential to persist, bioaccumulation, and transfer to living organisms, especially in water contamination. HCQ is aggregated in organs like the spleen, intestine, lungs, and kidneys that can be converted to active metabolites in the liver. It is deposited in organs that have melanin; so can alter in the iris, choroid, and retinal pigment epithelium. By considering the advantages and risks of HCQ, we tried to investigate the reliability of the prepared sensor. So, it was used to analyze the HCQ in human blood serum, tablet samples, and pharmaceutical wastewaters. The results were given in Table 3. As seems, the recovery values that were calculated for these samples were in the range of 98.0 %-105.0 % with an RSD of 0.98–3.17. The retrieval results clearly demonstrated the imminent application of the proposed electrode to the detection of HCQ in real biological samples. Acceptable results, reproducibility, high sensitivity, and selectivity of this sensor confirmed that GT/N-GQD can be used to determine HCQ and compounds with similar structures. Benign nature, economic efficiency, and enhancement of the electrochemical performance are the other advantages of this work. the performance of the as-prepared sensor was compared to the other sensors used to measure the HCQ, until now, the results were listed in Table 4.
Sample
Added (µM)
Found (µM)
RSD (%)
Recovery (%)
Human blood serum
1
0.0
No detectable
–
–
2
10.0
9.8
0.98
98.0
3
15.0
15.1
1.55
100.7
Tablet
1
0.0
0.72
–
–
2
4.0
4.80
1.70
102.0
3
5.0
5.71
2.38
99.8
Wastewater
1
4.0
4.2
1.10
105.0
2
8.0
7.9
3.17
98.7
3
16
15.9
2.90
99.4
Electrode
Technique
Linear dynamic range (μM)
LOD (μM)
Ref.
CNNS/CPEa
DPV
0.01–6.92
0.00016
(de Oliveira S. Silva et al., 2021
VS2 QDs/N, S@ GNA/cCNTs/GCEb
DPV
0.0084–0.22
0.00277
(Mahnashi et al., 2021)
GCEc
DPV
20–500
34
(Arguelho et al., 2003)
ZnSNPs/RGO/GCEd
DPV
0.005–0.065
0.00045
(Alkahtani et al., 2021)
BDDEe
SWVf
0.1–1.9
0.06
(Deroco et al., 2014)
RGO–TiO2/GCE
SWV
0.25–500
0.00012
(Zhang et al., 2021)
GT/N-GQDs
DPV
0.0001–170.0
0.00006
This work
3.6 The photocatalytic studies
Elimination of pollutants induced by the diverse sources is transferred to a global challenge. Development of population and industries have increased the environmental damages, so degradation of waste and pollutants can decrease the dangers that threaten the lives of living things. The entrance of drugs and their remains into waste-water and natural cycles can affect the health of creatures. HCQ as an immunomodulatory drug with a long half-time, has been used for 60 years to treat malaria and autoimmune diseases, so, degradation of its remains is so valuable. In this work, it tried to focus on detecting and eliminating this drug using the as-prepared nanocomposite under dual applications as sensor and photocatalyst.
To prove the ability of this product for elimination of HCQ under photocatalytic process, the experiments under visible light were carried out in 90 min. optimizing the effective parameters such as pH of solution, drug concentration and photocatalyst amount were done to obtain the highest efficiency.
3.6.1 The optimization of the photocatalyst amount
The as-prepared nanocomposite amount as a variable was changed and the photocatalytic experiments were carried out in presence of 0.1, 0.07 and 0.05 g of the photocatalyst. As expected, the maximum degradation percent was resulted when the photocatalyst amount was maximum. The related graphs show the role of the photocatalyst amount on degradation percent of HCQ (Fig. 15a).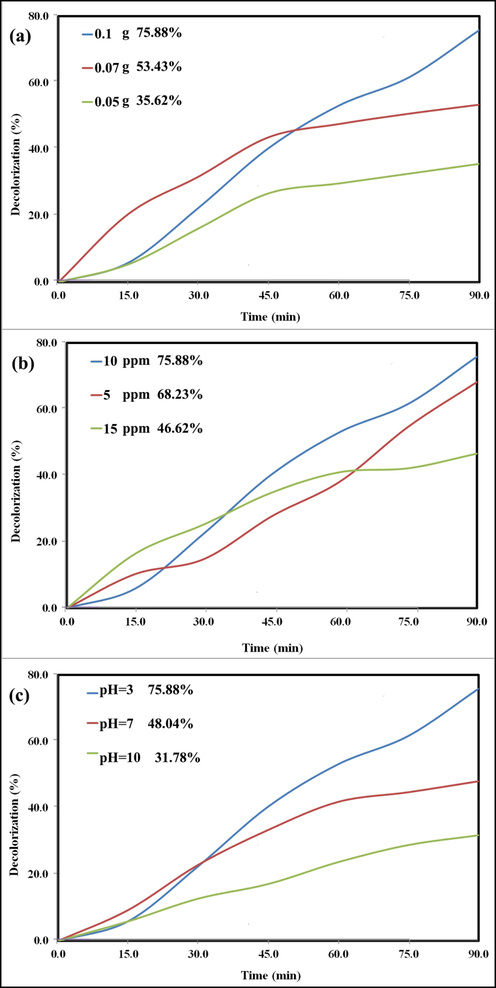
The results of photocatalytic experiments for degradation of HCQ in presence of GT/N-GQDs nanocomposite under visible light in 90 min. optimization of the effective parameters on the photocatalytic efficiency (a) photocatalyst amount, (b) the concentration of HCQ solution, and (c) pH of solution.
3.6.2 The optimization of the concentration of HCQ solution
To achieve the best photocatalytic performance, the three drug solutions with different concentrations were put under the photocatalytic process in presence of the optimized amount of photocatalyst (0.1 g). As shown in Fig. 15b, the highest degradation is related to the HCQ solution with a concentration of 10 ppm.
3.6.3 The optimization of the concentration of HCQ solution
In the photocatalytic process, when semiconductor absorbs the light with the certain energy (depending on band gap), electron-hole pairs are formed which are known as charge carriers. In continue, charge carriers are transferred to initial agents for producing the active-photocatalytic species that degrade the pollutants.
Depending the photocatalytic reactions to pH, as well the other chemical reactions, is undeniable. So, this parameter was optimized to obtain the best efficiency. According to the results illustrated in Fig. 15c, acidic environment along with the other optimized parameters provides the ideal condition for the highest degradation percent of HCQ.
4 Conclusions
In this work, Gd2Ti2O7/N-GQD nanocomposite was prepared by a facile method. By considering the changes of Gd2Ti2O7 properties in presence of graphene derivatives and the importance of detection and measurement of drugs in different samples, the performance of this product as an electrochemical sensor was investigated. HCQ is usually known as a multi-performance drug that is used to treat some diseases. Long half-life of this drug can cause its agglomeration in human’s body which leads to irreparable problems, so preparation of a sensitive sensor with a lower limit of detection can be so valuable. The electrochemical studies proved the ability of this product for using as a sensor for the measurement of HCQ in different samples. The current peak obtained from DPV was proportional to the HCQ concentration in the range of 0.0001–170.0 μM with the detection limit of 0.064 nM. Moreover, the GT/N-GQD/CPE revealed long-term stability and suitable reproducibility. It should be acknowledged that the as-prepared sensor with this detection limit is the most sensitive sensor for detection of HCQ, up to now. Sensitivity of this sensor was examined in presence of AC as a useful painkiller that is usually used along with HCQ, simultaneously. According to the results, AC couldn’t affect the sensitivity and selectivity of this sensor, which is a notable property. Since, the half-life of HCQ is more than 40 days, its residues in the environment can be problematic, and so degradation of it is necessary. Hence, the capability of Gd2Ti2O7/N-GQD nanocomposite for degradation of HCQ during a photocatalytic process under visible light was investigated. After optimization of the effective parameters on the photocatalytic efficiency, the photocatalytic ability of this product was confirmed by the degradation percent of HCQ about 76 % in 90 min. Using the expired-date vials of B12 vitamin for synthesis of Gd2Ti2O7 was another eco-friendly aspect of this work. Finally, it should be noted that this nanocomposite can be used in diverse fields that this work just investigated two applications of it.
CRediT authorship contribution statement
Movlud Valian: Formal analysis, Writing – original draft, Methodology, Investigation, Data curation, Software. Faezeh Soofivand: Software, Investigation, Writing – review & editing. Asma Khoobi: Software, Methodology. Qahtan A. Yousif: Writing – review & editing, Data curation, Funding acquisition. Masoud Salavati-Niasari: Formal analysis, Methodology, Writing – review & editing, Writing – original draft, Conceptualization, Supervision, Project administration, Investigation, Data curation, Validation, Resources, Visualization, Funding acquisition.
Acknowledgments
Authors are grateful to the council of Iran National Science Foundation (INSF, 97017837) and the University of Kashan for supporting this work by Grant No (159271/MV5).
Declaration of Competing Interest
The authors declare that they have no known competing financial interests or personal relationships that could have appeared to influence the work reported in this paper.
References
- Nanocomposite of CuInS/ZnS and nitrogen-doped graphene quantum dots for cholesterol sensing. ACS Omega. 2021;6(3):2167-2176.
- [Google Scholar]
- Facile one pot sonochemical synthesis of layered nanostructure of ZnS NPs/rGO nanosheets for simultaneous analysis of daclatasvir and hydroxychloroquine. Microchem. J.. 2021;164:105972.
- [Google Scholar]
- Biomimetics for high-performance flexible tactile sensors and advanced artificial sensory systems. J. Mater. Chem. C. 2019;7(47):14816-14844.
- [Google Scholar]
- Electrochemical study of hydroxychloroquine and its determination in plaquenil by differential pulse voltammetry. J. Pharm. Biomed. Anal.. 2003;32(2):269-275.
- [Google Scholar]
- Sensitive detection and determination of benzodiazepines using silver nanoparticles-N-GQDs ink modified electrode: A new platform for modern pharmaceutical analysis. Microchem. J.. 2019;145:1050-1057.
- [Google Scholar]
- Hydroxychloroquine: A comprehensive review and its controversial role in coronavirus disease 2019. Ann. Med.. 2021;53(1):117-134.
- [Google Scholar]
- LR Faulkner Electrochemical Methods. Fundamentais and Applications John Wiley and Sons; 1980.
- Hydroxychloroquine: from malaria to autoimmunity. Clin. Rev. Allergy Immunol.. 2012;42(2):145-153.
- [Google Scholar]
- Sol-gel auto combustion synthesis, structural and magnetic properties of Mn doped ZnO nanoparticles. Procedia Manuf.. 2018;20:174-180.
- [Google Scholar]
- Characterization of the physical and chemical properties of engineered nanomaterials, Exposure to Engineered Nanomaterials in the Environment. Elsevier; 2019. p. :31-57.
- Preparation and formaldehyde sensitive properties of N-GQDs/SnO2 nanocomposite. Chin. Chem. Lett.. 2020;31(8):2063-2066.
- [Google Scholar]
- Hydroxychloroquine-induced Stevens-Johnson syndrome in COVID-19: a rare case report. Oxford Medical Case Reports. 2020;2020(6):omaa042.
- [Google Scholar]
- A Novel Carbon Nitride Nanosheets-based Electrochemical Sensor for Determination of Hydroxychloroquine in Pharmaceutical Formulation and Synthetic Urine Samples. Electroanalysis. 2021;33(10):2152-2160.
- [Google Scholar]
- Square-wave voltammetric determination of hydroxychloroquine in pharmaceutical and synthetic urine samples using a cathodically pretreated boron-doped diamond electrode. J. Electroanal. Chem.. 2014;719:19-23.
- [Google Scholar]
- Vitamin C: sources, functions, sensing and analysis, Vitamin C. IntechOpen; 2017.
- A sensitive electrochemical sensor for Moxifloxacin Hydrochloride based on Nafion/graphene oxide/zeolite modified carbon paste electrode. Electroanalysis 2020
- [Google Scholar]
- Selective spectrophotometric determination of 4-amino antipyrine antibiotics in pure forms and their pharmaceutical formulations. Int. J. Drug Delivery Technol.. 2021;11(2):371-375.
- [CrossRef] [Google Scholar]
- N-doped graphene quantum dots-decorated V2O5 nanosheet for fluorescence turn off–on detection of cysteine. ACS Appl. Mater. Interfaces. 2018;10(1):614-624.
- [Google Scholar]
- Determination of Pb2+ ions by a modified carbon paste electrode based on multi-walled carbon nanotubes (MWCNTs) and nanosilica. J. Hazard. Mater.. 2010;173(1–3):415-419.
- [Google Scholar]
- Enhanced band gap, optical and near-infra-red reflecting properties of environmentally benign synthesized nanocrystalline Gd2Ti2O7 pyrochlore materials. J. Nanosci. Nanotechnol.. 2020;20(4):2277-2285.
- [Google Scholar]
- Effective adsorptive removal of riboflavin (RF) over activated carbon. AIP Conf. Proc.. 2022;2386:030030.
- [CrossRef] [Google Scholar]
- Jeyasingh, T., Saji, S., Wariar, P., 2017. Synthesis of nanocrystalline Gd2Ti2O7 by combustion process and its structural, optical and dielectric properties, AIP Conference Proceedings. AIP Publishing LLC, p. 020016.
- Structural and magnetic properties of combustion synthesized $$\hbox A _ {2}\mathrm Ti _ {2}\mathrm O _ 7 $$ A 2 Ti 2 O 7 ($$\hbox {A}=\hbox Gd $$ A= Gd, Dy and Y) pyrochlore oxides. Bull. Mater. Sci.. 2019;42(5):1-7.
- [Google Scholar]
- Biosynthesis of metal and oxide nanoparticles using Lactobacilli from yoghurt and probiotic spore tablets. Biotechnol. J.. 2010;5(3):285-291.
- [Google Scholar]
- Potentiometric sensors based on hydroxychloroquine-phosphotungstate ion-pair and β-cyclodextrin ionophore for improved determination of hydroxychloroquine sulfate. J. Iran. Chem. Soc.. 2018;15(10):2411-2421.
- [Google Scholar]
- Poly (alanine)/NaOH/MoS2/MWCNTs modified carbon paste electrode for simultaneous detection of dopamine, ascorbic acid, serotonin and guanine. Colloids Surf., B. 2020;196:111299.
- [Google Scholar]
- Quantitative detection of nitrite with N-doped graphene quantum dots decorated N-doped carbon nanofibers composite-based electrochemical sensor. Sens. Actuators, B. 2017;252:17-23.
- [Google Scholar]
- Spin gapless semiconductor− metal− half-metal properties in nitrogen-doped zigzag graphene nanoribbons. ACS Nano. 2009;3(7):1952-1958.
- [Google Scholar]
- Synthesis and anticancer activity evaluation of novel ligand 2- [2 - (5-Chloro carboxy phenyl) Azo] 1-Methyl Imidazole (1-Mecpai) with Some Metal Complexes. Systematic Rev. Pharmacy. 2020;11(12):1979-1987.
- [CrossRef] [Google Scholar]
- Synthesis, characterization and adsorption studies of a graphene oxide/polyacrylic acid nanocomposite hydrogel. NeuroQuantology. 2021;19(9):46-54.
- [CrossRef] [Google Scholar]
- Improved pechini sol-gel fabrication of Li2B4O7/NiO/Ni3(BO3)2 nanocomposites to advanced photocatalytic performance. Arabian J. Chem.. 2022;15(5):103768.
- [CrossRef] [Google Scholar]
- Simultaneous electrochemical detection of azithromycin and hydroxychloroquine based on VS2 QDs embedded N, S@ graphene aerogel/cCNTs 3D nanostructure. Microchem. J.. 2021;163:105925.
- [Google Scholar]
- Facile one-step hydrothermal synthesis toward strongly coupled TiO2/graphene quantum dots photocatalysts for efficient hydrogen evolution. Appl. Surf. Sci.. 2017;396:1375-1382.
- [Google Scholar]
- Comparison of different screening methods for chloroquine/hydroxychloroquine retinopathy: multifocal electroretinography, color vision, perimetry, ophthalmoscopy, and fluorescein angiography. Graefe's Archive Clin. Exp. Ophthalmol.. 2012;250(3):319-325.
- [Google Scholar]
- Compatibility of GdxTi2O7 pyrochlores (1.72≤ x≤ 2.0) as electrolytes in high-temperature solid oxide fuel cells. Solid State Ionics. 2003;158(1–2):79-90.
- [Google Scholar]
- Multifunctional nanotechnology-enabled sensors for rapid capture and detection of pathogens. Sensors. 2017;17(9):2121.
- [Google Scholar]
- Nitrogen-doped carbon quantum dots embedded Co3O4 with multiwall carbon nanotubes: An efficient probe for the simultaneous determination of anticancer and antibiotic drugs. Biosens. Bioelectron.. 2020;150:111947.
- [Google Scholar]
- Green synthesis of Ag and Pd nanospheres, nanowires, and nanorods using vitamin: catalytic polymerisation of aniline and pyrrole. J. Nanomater.. 2008;2008
- [Google Scholar]
- Green and controlled synthesis of gold and platinum nanomaterials using vitamin B2: density-assisted self-assembly of nanospheres, wires and rods. Green Chem.. 2006;8(6):516-518.
- [Google Scholar]
- Improve the performance of carbon paste electrodes for determination of dobutamine using MnZnFe2O4 nanoparticles and ionic liquid. J. Taiwan Inst. Chem. Eng.. 2017;78:51-55.
- [Google Scholar]
- Screening of Chloroquine, Hydroxychloroquine and its derivatives for their binding affinity to multiple SARS-CoV-2 protein drug targets. J. Biomol. Struct. Dyn. 2020:1-13.
- [Google Scholar]
- Visible-light driven Gd 2 Ti 2 O 7/GdCrO 3 composite for hydrogen evolution. Dalton Trans.. 2011;40(48):12839-12845.
- [Google Scholar]
- Vitamin B12–metal conjugates for targeted chemotherapy and diagnosis: Current status and future prospects. Eur. J. Inorg. Chem.. 2017;2017(12):1625-1638.
- [Google Scholar]
- Probiotic Lactobacillus adds WO3 in its nanomenu! J. Bionanosci.. 2010;4(1–2):99-103.
- [Google Scholar]
- Nanomaterial-based electrochemical sensors and biosensors for the detection of pharmaceutical compounds. Biosens. Bioelectron.. 2021;175:112836.
- [Google Scholar]
- Electrochemical investigation of caffeine by cerium oxide nanoparticle modified carbon paste electrode. J. Electrochem. Soc.. 2020;167(4):047503.
- [Google Scholar]
- A simple ultrasensitive electrochemical sensor for simultaneous determination of gallic acid and uric acid in human urine and fruit juices based on zirconia-choline chloride-gold nanoparticles-modified carbon paste electrode. Biosens. Bioelectron.. 2018;114:30-36.
- [Google Scholar]
- Preparation, characterization and investigation of sonophotocatalytic activity of thulium titanate/polyaniline nanocomposites in degradation of dyes. Ultrason. Sonochem.. 2019;50:46-58.
- [Google Scholar]
- Visible-light driven TiO2 photocatalyst coated with graphene quantum dots of tunable nitrogen doping. Molecules. 2019;24(2):344.
- [Google Scholar]
- Green synthesis of silver nanoparticles embedded in polyaniline nanofibers via vitamin C for supercapacitor applications. J. Mater. Sci.: Mater. Electron.. 2017;28(11):7769-7777.
- [Google Scholar]
- A sensitive acetaminophen sensor based on Co metal–organic framework (ZIF-67) and macroporous carbon composite. Rare Met.. 2022;41(1):189-198.
- [Google Scholar]
- Preparation and characterization of Gd2Ti2O7 by microwave method. Integr. Ferroelectr.. 2016;171(1):87-92.
- [Google Scholar]
- Oxygen ion conducting pyrochlore oxides prepared by an ultrasound-assisted wet chemistry route: Ca-doped Gd2Ti2O7 nanocrystals. Int. J. Hydrogen Energy. 2019;44(24):12515-12524.
- [Google Scholar]
- Synthesis, characterization and electrochemical sensors application of Tb2Ti2O7 nanoparticle modified carbon paste electrode for the sensing of mefenamic acid drug in biological samples and pharmaceutical industry wastewater. Talanta 2022:123593.
- [Google Scholar]
- Sol-gel auto-combustion synthesis of a novel chitosan/Ho2Ti2O7 nanocomposite and its characterization for photocatalytic degradation of organic pollutant in wastewater under visible illumination. Int. J. Hydrogen Energy 2022
- [Google Scholar]
- DSC and FT-IR analysis of the drying process of titanium alkoxide derived precipitates. Thermochim. Acta. 1999;326(1–2):91-97.
- [Google Scholar]
- Mechanical properties of nanomaterials: A review. Nanotechnol. Rev.. 2020;9(1):259-273.
- [Google Scholar]
- S, N co-doped graphene quantum dot/TiO2 composites for efficient photocatalytic hydrogen generation. Nanoscale Res. Lett.. 2017;12(1):1-8.
- [Google Scholar]
- Electrochemical detection of hydroquinone and catechol with covalent organic framework modified carbon paste electrode. J. Electroanal. Chem.. 2020;877:114530.
- [Google Scholar]
- Preparation of silver/silver bromide/titanium dioxide/graphene oxide nanocomposite for photocatalytic degradation of 4-chlorophenol. Nanomater. Nanotechnol.. 2017;7 1847980417724046
- [Google Scholar]
- A Novel Electrochemical Sensor Based on Reduced Graphene Oxide–TiO2 Nanocomposites with High Selectivity for the Determination of Hydroxychloroquine. Russ. J. Electrochem.. 2021;57(8):872-884.
- [Google Scholar]
- Sol-gel synthesis of Gd2Ti2O7/HZSM-5 composite photocatalyst for ofloxacin degradation. J. Photochem. Photobiol., A. 2018;364:787-793.
- [Google Scholar]
- Novel nanofluidic cells based on nanowires and nanotubes for advanced chemical and bio-sensing applications. Nanomaterials. 2021;11(1):90.
- [Google Scholar]
Appendix A
Supplementary material
FT-IR spectrum of sample 1 (GT nanoparticles) was given in S1. To investigate the magnetic properties of GT nanoparticles at room temperature, a vibrating sample magnetometer (VSM) was used. The linear hysteresis loop shown in S2 indicates a paramagnetic behavior for Gd2Ti2O7 NPs. According to this figure, saturation magnetization (Ms) was about 1.91 emu/g that is more than which reported in previous literature (about 1.50 emu/g) (Jeyasingh et al., 2019). So, these paramagnetic nanostructures can be used as controllable sensors with external magnetic tracking in biological applications. Supplementary data to this article can be found online at https://doi.org/10.1016/j.arabjc.2022.104401.
Appendix A
Supplementary material
The following are the Supplementary data to this article:Supplementary Data 1
Supplementary Data 1


