

Translate this page into:
A novel approach to simultaneously enhance the Seebeck coefficient and electrical conductivity in rutile phase of TiO2 nanostructures
⁎Corresponding author. khalidmahmood@gcuf.edu.pk (K. Mahmood)
-
Received: ,
Accepted: ,
This article was originally published by Elsevier and was migrated to Scientific Scholar after the change of Publisher.
Peer review under responsibility of King Saud University.
Abstract
In the present study, we have used a novel technique to simultaneously enhance the Seebeck coefficient and electrical conductivity of Titanium Dioxide (TiO2) nanostructured by grown by a simple sol-gel method. X-Ray Diffraction (XRD) data has demonstrated the pure rutile phase of TiO2 with the planes (1 1 0), (1 0 1), (2 0 0), (1 1 1), (2 1 0), (2 1 1) and (2 0 0). It was observed that the best crystallinity for samples was achieved at annealing temperature 800 °C. We argue that titanium (Ti+4) and oxygen (O−2) atoms get thermal energy due to the high temperature annealing process and move to their designated places in the crystal structure. Raman spectroscopy measurements have further confirmed the formation of the rutile phase of TiO2 and its atomic vibrations in the lattice crystal structure. We have observed Raman peaks at 446.98 and 698.8 cm−1 with Eg and A1g modes of TiO2 rutile structure respectively while Scanning Electron Microscope (SEM) images are also supported the XRD and Raman results as well. Seebeck coefficient and electrical conductivity have obeyed the increasing trend simultaneously (−286.6 μV/°C and 110 S/cm) and maximum values were obtained for the sample annealed at 800 °C. The enhancement in the Seebeck coefficient and electrical conductivity was related to energy filtering effect and demonstrated in the manuscript with supporting results.
Keywords
TiO2
XRD
SEM
Seebeck coefficient
Power factor

1 Introduction
Due to ever-increasing global warming, the novel electrical energy conversion approaches are urgently essential to reduce our dependence on fossil fuels. The thermoelectric (TE) materials can directly convert the waste heat into electrical energy. Thermoelectricity is a renewable and non-polluting technique that is the most efficient candidate for clean energy production because an electrical current is produced by only maintaining the temperature gradient (Beretta et al., 2019; Liu et al., 2013). The high electrical and low thermal conductivity are necessary for the best thermoelectric conversion efficiency. Therefore, these two parameters are guiding principles for obtaining a high figure of merit, but are difficult to control individually because they are proportional to each other. Hence, different approaches have been employed such as supper lattice structure, nanowire and nanostructure in the literature so far (Zhou et al., 2019; Mahmood et al., 2019). Due to its crystal structure, TiO2 could be a good candidate for thermoelectric power generation applications. The titanium dioxide (TiO2) material is already being used widely in several applications such as gas sensors, optical, membranes and photo-catalysts due to its non-toxicity, excellent cost performance, controllable properties and chemically high stability (Huang et al., 2009; Chen and Mao, 2007; Cao et al., 2020; Wang et al., 2020; Ashraf et al., 2020; Yan et al., 2020). It is accepted fact that oxygen vacancy and some doping impurity in titanium dioxide are modulated easily resulted in the enhancement of thermoelectric power factor (Kitagawa et al., 2010). Furthermore, the porosity in the TiO structure can be increased by increasing the annealing temperature (900 °C) because the mesoporous structure facilitates the enhancement of the Seebeck coefficient and reduced the thermal conductivity (Hong et al., 2013). The stability of titanium oxide was improved with different isotopes of oxygen atoms and analyzed the phase’s anatase and rutile (Frank et al., 2012). For the last few years, several groups were reported and made to improve the thermoelectric properties of TiO2 with the different phases. The TiO2 was reported the highest ZT value of 1.64 (Okinaka and Akiyama, 2006). The titanium dioxide is mostly used in three common phases such as rutile, anatase and brookite, in which anatase and brookite phases are metastable while the rutile phase is stable under ambient condition (Matsui and Akaogi, 1991). The large crystal structure of TiO2 has been created the oxygen vacancy which caused the phonon scattering and also reduced the lattice thermal conductivity. In a nano-sized grains, the phonon scattering at the nano-grain boundaries which another cause to reduce the thermal conductivity (Rehman et al., 2019; Mahmood et al., 2019; Liu et al., 2020). Therefore, the Rutile phase of TiO2 is presumed to acquire high ZT value due to excellent thermoelectric performance. The Seebeck coefficient and electrical conductivity of different thermoelectric materials are shown in Table 1. (Okinaka and Akiyama, 2006; Liu et al., 2017; Kitagawa et al., 2010; Ding et al., 2020; Li et al., 2019).
Material
Seebeck coefficient
Electrical conductivity
TiO2 (Okinaka and Akiyama, 2006) Highest reported
1010 μV/K
90 Scm−1
TiO2 (Liu et al., 2017)
255 μV/K
100 Scm−1
TiO2 Rutile type (Kitagawa et al., 2010)
540 μV/K
31.2 Scm−1
MoS2 (Ding et al., 2020)
140 μV/K
40 Scm−1
MoS2 (Li et al., 2019)
159.4 μV/K
35.7 Scm−1
In this work, the pure Rutile phase of TiO2 nanostructure was synthesized using a sol-gel combustion method and annealed at different temperatures (600–900) to improve the crystalline structure. The thermoelectric properties including the Seebeck coefficient, electrical conductivity and power factor were also improved with increasing the crystallinity.
2 Experimental section
Ethanol (99%), titanium (IV) butaoxide (97%), nitric acid (70%) were purchased from Sigma-Aldrich and were used as starting materials. First of all, we have prepared two solutions. In 1st solution, we took ethanol, titanium (IV) butaoxide and distilled water in equal volume ratio (1:1:1) % in glass beaker, then solution stirred for 30 min, we got highly viscous milky solution. Then the 2nd solution was prepared using a separate beaker and the composition of the solution was as; nitric acid and distilled water with volume ratio (3:1) %. Both solutions were mixed and stirred at room temperature until the solution converted into a transparent one. The pH of this solution was maintained at 5.0–7.0. After stirring at 77 °C for 24 h, we obtained a white precipitate at the base of the beaker. The impurities and solvents in the solution were removed by placing it in the oven for 18 h at 100 °C. The fine powder of TiO2 was achieved by grinding with aged morter for 60 min and finally fine pallets were prepared using a hydraulic press under the weight of 12 tones. The pellets were annealed at different temperatures (600 °C-900 °C). The characterization of synthesized nanoparticles was performed using XRD, Raman spectroscopy, SEM and Seebeck system. The manufacturers and model numbers of all machines were already reported in our previous papers (Rehman et al., 2019; Mahmood et al., 2019). The porosity of all samples were measured using ellipsometer (Gatan L117C, 632.8 nm He–Ne laser).
3 Result and discussion
The X-Ray Diffraction (XRD) pattern in Fig. 1 showed the high-quality single Rutile phase formation of TiO2 at different annealing temperatures, which, is a more thermodynamically favorable phase. We have observed seven diffraction peaks at 2θ(°) = 27.45°, 36.01°, 39.24°, 41.19°, 44.08°, 54.30° and 56.59° with the planes (1 1 0), (1 0 1), (2 0 0), (1 1 1), (2 1 0), (2 1 1) and (2 0 0) (Liu et al., 2017). The intensity of XRD diffraction peaks of Rutile phase was found to be increased as the annealing temperature increased up to 800 °C. The insert in Fig. 1 demonstrated the shifting of a diffraction peak towards higher angles by annealing temperatures. Unit cell calculated from XRD data was found to be increased because the oxygen atoms are diffused into the crystal structure causing an increase in the unit cell volume (Da Silva et al., 2019). As the samples were annealed in an open oxygen environment, the Titanium (Ti) atoms have great ability to capture the oxygen (O) atoms at the higher annealing temperature. The crystallite size and peak intensity were increased up to annealing temperature 800 °C and again decreased at annealing temperature 900 °C because more O atoms occupy the interstitial sites causing degradation in peak intensity and crystallinity of bulk Rutile phase of TiO 2 (Fig. 2). The crystalline size of all prepared sample was calculated using Scherrer formula,
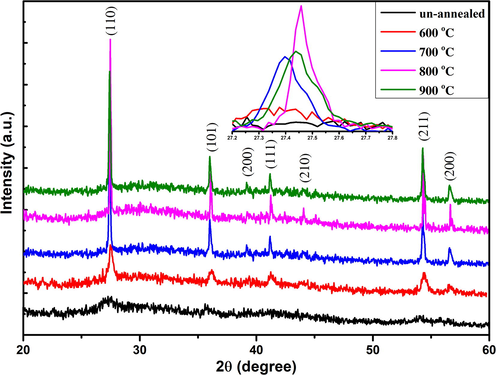
X-Ray Diffraction pattern of rutile phase of as synthesized and annealed TiO2 nanostructures grown by sol-gel method.
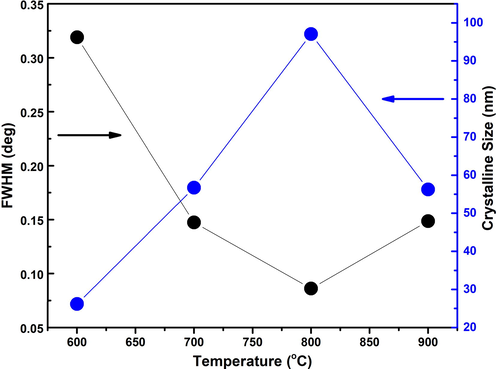
Response of crystalline size and full width half maxima with respect to different annealing temperature ranging from 600 to 900 °C.
Calculated structural parameters such as FWHM, crystalline size, dislocation density and micro-strain are shown in Table 2.
Sample (I.D)
Porosity (%)
2θ (o)
Intensity (a.u.)
FWHM (o)
Crystalline Size (nm)
Disl°Cation Density (δ)
Micro-Strain (ε)
Un-annealed
12.8 ± 0.1
27.25 ± 0.2
108 ± 1
1.1294 ± 0.01
7.3954 ± 0.1
0.018284
0.004789
600 °C
14.2 ± 0.1
27.37 ± 0.2
144 ± 1
0.3189 ± 0.01
26.1932 ± 0.1
0.001458
0.001352
700 °C
18.6 ± 0.1
27.39 ± 0.2
331 ± 1
0.1473 ± 0.01
56.6992 ± 0.1
0.000311
0.000625
800 °C
20.1 ± 0.1
27.45 ± 0.2
519 ± 1
0.0861 ± 0.01
97.0531 ± 0.1
0.000106
0.000365
900 °C
17.5 ± 0.1
27.43 ± 0.2
352 ± 1
0.1485 ± 0.01
56.2574 ± 0.1
0.000316
0.00063
Further analysis of Rutile phase of TiO2 was done using Raman Spectroscopy. The Rutile phase of TiO2 was observed at 446.98 cm−1 and 698.8 cm−1 with Eg and A1g modes respectively as shown in Fig. 3. The Raman intensity of Eg and A1g modes of Rutile TiO2 was first increased and then decreased when annealing temperature increased from 600 to 900 0C. It is reported in the literature that these Eg and A1g modes of pure Rutile phases apparently resulted from the 2nd order phonon action in the Raman spectrum (Swamy, 2008). The active vibrational modes were contained the motion of oxygen (O2–) anions for the stable central titanium (Ti+4) cations, either along the c-axis for Eg mode and perpendicular to the c-axis for A1g mode. In the Eg mode, the bending of O-Ti-O bonds was lie in the (0 0 1) plane and caused the opposite movement of oxygen atom across the bonds. In the A1g mode, the stretching of O-Ti-O bonds was lie in the (1 1 0) plane and caused the opposite movement of oxygen atom in the adjusting bonds (Zhang et al., 2013). (see Table 3).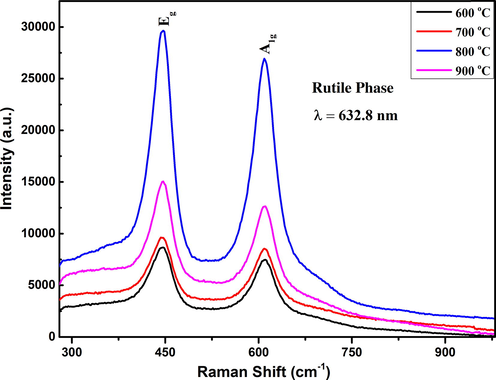
Raman spectrum of pure rutile phase of TiO2 nanostructured measured at different annealing temperatures.
Sample
25 °C
50 °C
75 °C
100 °C
μV/°C
S/cm
Wm−1 K−2
μV/°C
S/cm
Wm−1 K−2
μV/°C
S/cm
Wm−1 K−2
μV/°C
S/cm
Wm−1 K−2
600 °C
−67.8
9
4.13E−6
−135.8
28
5.16E−5
−168.7
47
1.33E−4
−198.7
65
2.56E−4
700 °C
−88.01
17
1.31E−5
−145.9
37
7.87E−5
−176.9
53
1.65E−4
−216.6
78
3.66E−4
800 °C
−108.3
26
3.05E−5
−167.6
45
1.26E−4
−206.9
72
3.08E−4
−286.6
99
8.13E−4
900 °C
−78.24
27
1.65E−5
−142.8
47
9.55E−5
−164.9
78
2.12E−4
−189.8
110
3.96E−4
The Rutile phase composition and surface morphology of TiO2 at different annealing temperatures were analyzed using SEM. Fig. 4 (a)-(d) depicts the surface images of TiO2 which was annealed at 600 °C-900 °C in open oxygen environment. It can be seen that the density and grain size of titanium oxide increased with increasing the annealing temperature. It is further noted that the grain growth was incomplete at oxidation temperature 600−700 °C while the best surface morphology was observed for the sample annealed at 800 °C which has mesoporous structure. As we further increased the annealing temperature, more oxygen atoms were diffused and cause surface more compact and non-uniform.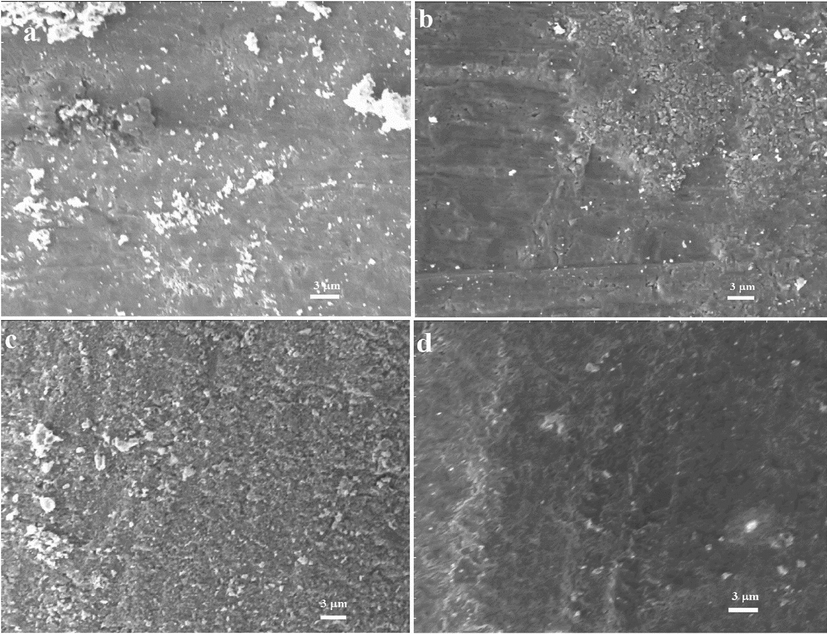
(a, b, c and d): SEM micrographs of TiO2 samples annealed 600, 700, 800 and 900 °C respectively.
Fig. 5 exhibits the effect of annealing temperature on the Seebeck coefficient of TiO2 rutile phase nanostructures measured at different annealing temperatures. The calculated values of the Seebeck coefficient for the TiO2 rutile phase are negative, which demonstrating their n-type electrical conductivity (Rehman et al., 2019). The value of the Seebeck coefficient was increased from −67.8 μV/°C to −286.6 μV/°C with increasing the annealing temperature 600–800 °C. The observation of our results can be explained as: the increasing annealing temperature was created the porosity in structure. It was found that the highest porosity was achieved for the sample annealed at 800 °C. This mesoporous structure may act secondary which causes an energy filtering effect. The energy filtering effect stops the low energy carriers at the interface of secondary phases and causes an enhancement both in Seebeck coefficient and electrical conductivity simultaneously (Jung and Park, 2006; Li et al., 2013). Therefore, the highest observed value of the Seebeck coefficient and electrical conductivity for sample annealed at 800 °C is understandable because this sample associated the highest porosity.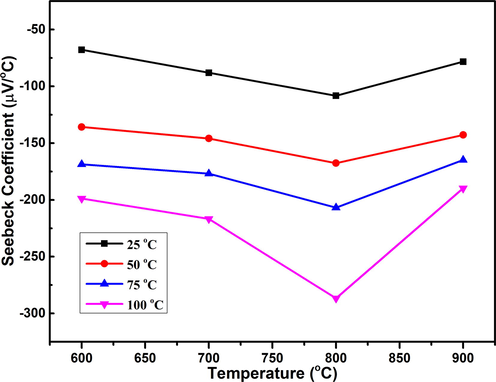
Effect of annealing temperature on the Seebeck coefficient of TiO2 calculated at different measurement temperatures.
In Fig. 6, exhibits the temperature effect on the electrical conductivity of nanostructured titanium dioxide grown by a sol–gel method. The electrical conductivity was enhanced from 9 S/cm to 110 S/cm with increasing the temperature from 600 °C to 900 °C due to the higher mobility of carriers. As explained in the previous section that annealing temperature increases the porosity of TiO2 which allows the high mobile carriers to pass through only and contributed to the enhancement of electrical conductivity (AminorroayaYamini et al., 2014). Furthermore, the electrical conductivity trend with increasing the post-growth annealing can also be explained as: more oxygen defects acquired additional electronic state in the energy bandgap of the TiO2 rutile phase resulted in higher resistivity (AminorroayaYamini et al., 2014; Mikami and Ozaki, 2012; Harada et al., 2010). The power factor (PF) was calculated using equation,
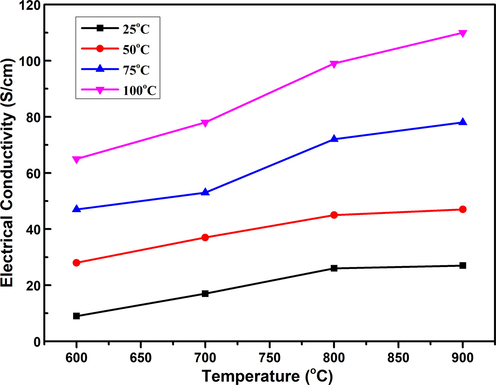
The graph of annealing temperature versus electrical conductivity of TiO2 nanostructures.
The power factor of TiO2 was calculated using the Seebeck coefficient and electrical conductivity values and demonstrated in Fig. 7. Again, the highest value of power factor (8.13 × 10⁻⁴ Wm−1 K−2) was achieved for the sample annealed at 800 °C. The quantum confinement is improved the density function, this function mostly predicted to enhance the power factor (Ali et al., 2019).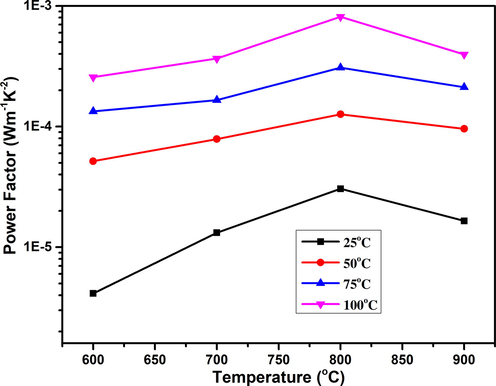
The graph demonstrated the effect of annealing temperature on the power factor of TiO2.
4 Conclusion
We have reported the growth of TiO2 nanostructures using simple and cost-effective sol–gel technique. The effect of post-growth annealing on the structural, electrical and thermoelectric properties has been demonstrated as well. XRD and Raman spectroscopy measurements confirmed the rutile phase of as-synthesized TiO2 nanostructure and this phase improved with annealing temperature. Seebeck data suggested that TiO2 sample annealed at 800 °C, has the best thermoelectric properties as compared to other samples.
Acknowledgement
This work was supported by the Deanship of Scientific Research (DSR), King Abdulaziz University, Jeddah, under grant No. (G: 112-135-1440). The authors, therefore, gratefully acknowledge the DSR for technical and financial support.
Declaration of Competing Interest
The authors declare that they have no known competing financial interests or personal relationships that could have appeared to influence the work reported in this paper.
References
- Effect of tin concentration on the structural, optical and thermoelectric properties of CZTS thin films gown by chemical solution method. Ceram. Int.. 2019;45:22513-22516.
- [Google Scholar]
- Thermoelectric performance of n-type (PbTe) 0.75 (PbS) 0.15 (PbSe) 0.1 composites. ACS Appl. Mater & Interface.. 2014;6:11476-11483.
- [Google Scholar]
- Combination of sonochemical and freeze-drying methods for synthesis of graphene/Ag-doped TiO2 nanocomposite: A strategy to boost the photocatalytic performance via well distribution of nanoparticles between graphene sheets. Ceram. Int.. 2020;46:7446-7452.
- [Google Scholar]
- Beretta, D., Neophytou, N., Hodges, J.M., Kanatzidis, M.G., Narducci, D., Martin-Gonzalez, M., , M., , B., , G., , W., , A., , A.I., , C., , B., , M., , M., 2019. Thermoelectrics: From history, a window to the future. Mater. Sci. Engin: R: Reports., vol. 138, 100501.
- Synergic effect of oxygen vacancy defect and shape on the photocatalytic performance of nanostructured TiO2 coating. Polyhedron. 2020;175:114214
- [Google Scholar]
- Titanium dioxide nanomaterials: synthesis, properties, modifications, and applications. Chem. Rev.. 2007;107:2891-2959.
- [Google Scholar]
- Da Silva, E.P., Winkler, M.E., Giufrida, W.M., Cardozo-Filho, L., Alonso, C.G., Lopes, J.B., , A.F., Silva, R., 2019. Effect of phase composition on the photocatalytic activity of titanium dioxide obtained from supercritical antisolvent. J. Colloid Interf. Sci., vol. 535, pp. 245–254.
- Defect modification engineering on a laminar MoS2 film for optimizing thermoelectric properties. J. Mater. Chem. C. 2020;8:1909-1914.
- [Google Scholar]
- Raman spectra of titanium dioxide (anatase, rutile) with identified oxygen isotopes (16, 17, 18) Phys. Chem. Chem. Phys.. 2012;14:14567-14572.
- [Google Scholar]
- Thermoelectric properties and crystallographic shear structures in titanium oxides of the Magneli phases. J. Appl. Phys.. 2010;108:083703
- [Google Scholar]
- Thermoelectric properties of mesoporous TiO2 thin films through annealing temperature and ratio of surfactant. Surf. Coat. Tech.. 2013;231:370-373.
- [Google Scholar]
- Development of a titanium dioxide-supported platinum catalyst with ultrahigh stability for polymer electrolyte membrane fuel cell applications. J. Am. Chem. Soc.. 2009;131:13898-13899.
- [Google Scholar]
- Concentration-dependent mesostructure of surfactant-templated mesoporous silica thin film. Thin Solid Films. 2006;494:320-324.
- [Google Scholar]
- Effect of boron-doping on thermoelectric properties of rutile-type titanium dioxide sintered materials. J. Alloys and Comp.. 2010;508:582-586.
- [Google Scholar]
- BiSbTe-based nanocomposites with high ZT: the effect of SiC nanodispersion on thermoelectric properties. Adv. Function. Mater.. 2013;23:4317-4323.
- [Google Scholar]
- Optimizing thermoelectric performance of MoS2 films by spontaneous noble metal nanoparticles decoration. J. Alloy. Compd.. 2019;781:744-750.
- [Google Scholar]
- Surface termination modification on high-conductivity MXene film for energy conversion. J. Alloy. Compd.. 2020;829:154634
- [Google Scholar]
- Liu, H., Ma, H., Su, T., Zhang, Y., Sun, B., Liu, B., Kong, L., Liu, B., Jia, X., 2017. High-thermoelectric performance of TiO2-x fabricated under high pressure at high temperatures, J. Mater., vol. 3, pp. 286–292.
- Chemical tuning of TiO2 nanoparticles and sintered compacts for enhanced thermoelectric properties. J. Phys. Chem. C.. 2013;117:11487-11497.
- [Google Scholar]
- Mahmood, K., Jacob, J., Zahra, R., Ali, A., Rehaman, U., Ashfaq, A., Ahmed, W., Amin, N., Arshad, M.I., Javaid, K., Ikram, S., Ajaz un Nabi, M., Hussain, S., Feng, Y., 2019. Thermoelectric properties of Zn2GeO4 nano-crystals grown on ITO and Au coated Si substrates by thermal evaporation. Ceram. Int., vol. 45, pp. 18333–18337.
- Modulation of thermoelectric properties of Mg2GeO4 thin films by controlling the growth process. Ceram. Int.. 2019;45:18701-18703.
- [Google Scholar]
- Molecular dynamics simulation of the structural and physical properties of the four polymorphs of TiO2. Mol. Simulat.. 1991;6:239-244.
- [Google Scholar]
- Thermoelectric properties of nitrogen-doped TiO2-x compounds. J. Phys.: Conf. Ser.. 2012;379:012006
- [Google Scholar]
- Latent property of defect-controlled metal oxide: nonstoichiometric titanium oxides as prospective material for high-temperature thermoelectric conversion. Japan. J. Appl. Phys.. 2006;45:7009.
- [Google Scholar]
- Direct growth of ZnSnO nano-wires by thermal evaporation technique for thermoelectric applications. Physica B. 2019;570(2019):232-235.
- [Google Scholar]
- Growth of Mg2GeO4 nano-crystals on Si substrate and modulation of Seebeck coefficient by post growth annealing technique. Ceram. Int.. 2019;45:16275-16278.
- [Google Scholar]
- Size-dependent modifications of the first-order Raman spectra of nanostructured rutile TiO2. Phys. Rev. B.. 2008;77:195414
- [Google Scholar]
- Innovative synthesis of graphene/Pd-doped TiO 2 nanocomposite by combination of sonochemical and freeze-drying methods with enhanced visible-light photocatalytic activity. Appl. Nanosci. 2020:1-9.
- [Google Scholar]
- Performance and profit analysis of thermoelectric power generators mounted on channels with different cross-sectional shapes. Appl. Therm. Eng.. 2020;176:115455
- [Google Scholar]
- Asymmetric lattice vibrational characteristics of rutile TiO2 as revealed by laser power dependent Raman spectroscopy. J. Phys. Chem. C.. 2013;117:24015-24022.
- [Google Scholar]
- Zhou, B., Sun, C., Wang, X., Bu, Z., Li, W., Ang, R., Pei, Y., 2019. Transport Properties of CdSb Alloys with a Promising Thermoelectric Performance. ACS Appl. Mater. Interfaces, vol. 11, pp. 27098–27103.


