

Translate this page into:
A novel electrochemical sensor based on magnetic core@shell molecularly imprinted nanocomposite (Fe3O4@graphene oxide@MIP) for sensitive and selective determination of anticancer drug capecitabine
⁎Corresponding author. amostafavi@uk.ac.ir (Ali Mostafavi)
-
Received: ,
Accepted: ,
This article was originally published by Elsevier and was migrated to Scientific Scholar after the change of Publisher.
Peer review under responsibility of King Saud University.
Abstract
Capecitabine, known as an anti-cancer drug, despite clinical evidence in the general society of patients, the absence of specific data from the perception of increased toxic effects in older people and randomized trials, can be harmful to the body. So, its measurement is essential. A novel electrochemical sensor was fabricated based on glassy carbon electrode (GCE) decorated by molecularly imprinted polymer (MIP)-coated magnetic nanocomposite of iron (II, III) oxide @graphene oxide (Fe3O4@GO) for the detection of capecitabine. The MIP was deposited on the surface of core@shell nanocomposite by non-covalent imprinting process. Fe3O4@GO@MIP composite was characterized by transmission electron microscopy (TEM), scanning electron microscopy (SEM), X-ray diffraction (XRD), and Fourier transform infrared spectroscopy (FT-IR) techniques. The electrochemical performance of proposed sensor was investigated by cyclic and square wave voltammetry techniques. Several parameters such as the electrochemical behavior of the modified electrodes, the type and pH value of supporting electrolyte and scan rates were studied. Under the optimized conditions, the linear range and detection limit were obtained 1.0–100.0 nM and 0.324 nM, respectively. The proposed electrode was successfully applied to the quantification of capecitabine in health human plasma and pharmaceutical samples.
Keywords
Capecitabine
Fe3O4@GO nanocomposite
Molecular imprinting polymer
Glassy carbon electrode
Square wave voltammetry

1 Introduction
Capecitabine (N4-pentyloxycarbonyl-50-deoxy-5-fluorocytidine), known as a chemotherapy medicine or an anti-cancer drug (Scheme1), used to treat numerous cancers including prostate, ovarian, renal cell, and pancreatic, with the most enormous amount of evidence in colorectal cancer and metastatic breast (Bogaert et al., 2018; Di Desidero et al., 2018; Charalampakis et al., 2018). Capecitabine is an oral prodrug that, by thymidine phosphorylase, is converted to its only active metabolite, fluorouracil (FU). (Sakai et al., 2020). FU, known as an antimetabolite, is a commonly used chemotherapeutic agent (Sharma et al., 2019). Higher levels of FU are found in several the liver and tumors, compared with normal healthy tissue (Anand et al., 2017). FU illustrates saturable pharmacokinetics with activity in types of solid tumors (Arshad et al., 2020) including those of the head and neck, breast, prostate, pancreas, liver, and genitourinary and gastrointestinal tracts (Hong et al., 2020; Parikh and Magge, 2020). FU depends on capecitabine dosage, as well as the rate of administration in plasma concentrations (Yoshida et al., 2020; Sekido et al., 2019). Despite clinical evidence in the general population of patients with metastatic colorectal cancer (Kienle et al., 2019), the absence of specific data from randomized trials (Ahmadzadeh et al., 2020) and the perception of increased toxic effects in elderly patients with comorbidities have caused to reservations about treating older people with bevacizumab plus chemotherapy (Zhang et al., 2020). So, its measurement is essential. Various analytical strategies, including high performance liquid chromatography (HPLC) (Dhananjeyan et al., 2007; Zufıa et al., 2004) and HPLC-mass spectroscopy (Deng et al., 2015) have been reported for the determination of capecitabine, so far. These mentioned methods have some disadvantages, such as expensive, labor wasting; require complicated extraction and purification steps. In recent years, electrochemical techniques have been developed due to their high sensitivity, short analysis time, and low cost (Darband et al., 2019; Afzali et al., 2019; Maizia et al., 2018; Afzali et al., 2019).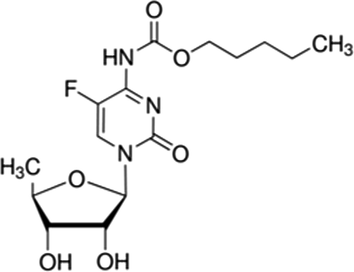
Chemical structure of capecitabine.
Nowadays, molecularly imprinted polymers (MIPs)-based sensors have attracted increasing attention because they exhibit particular sites for specific molecules to selectively recognize a target molecule (Tan et al., 2018; Pan et al., 2018; Ying et al., 2019; Parisi et al., 2020). These materials offer many advantages such as excellent selectivity (Xiong et al., 2018), mechanical, chemical and thermal stability (Sarafraz-Yazdi and Razavi, 2015), ease of preparation (Zhou et al., 2019), favorable engineering properties (Lowdon et al., 2018), and cost-effectiveness (Ahmad et al., 2019). The MIPs with mentioned properties are the most effective in the preparation of synthetic recognition elements (Kıran et al., 2019), and widely used in agriculture, pharmaceuticals, food, and environmental science (Özkan et al., 2019; Kıran et al., 2019). Currently, modifiers including MIPs, nanomaterials and nanocomposites have powerful applications for modifying electrodes due to their catalytic effect, high sensitivity, and low toxicity (Yola and Atar, 2019, 2018; Li et al., 2019; Yılmaz et al., 2019). Also, the previous study demonstrated that the selectivity of the electrochemical MIP sensor is better in comparison with the other systems (Yola and Atar, 2018). Poly(acrylic acid) (PAA) is one of the fascinating polymers because, in the PAA backbone chains, there are a large number of polar carboxylic acid (COOH) groups that can form strong complexes or coordinate covalent bonds with metal ions in solution (Mutharani et al., 2019). In electrochemical measurements, using MIPs due to long response times, low electrocatalytic activity, and poor sensitivity are limited (Amatatongchai et al., 2019). To improve their sensitivity, researchers have reported new materials including gold nanoparticles (Au NPs) (Wang et al., 2019), carbon nanotube (CNT) (Duan et al., 2019), graphene (Dehghani et al., 2019), graphene-chitosan composite (Liu et al., 2012), Au NPs-graphene oxide (Afzali et al., 2019) and gold-coated-magnetite iron (II, III) oxide (Fe3O4@Au) core–shell nanoparticles that can increase electron transfer efficiency (Amatatongchai et al., 2019). Graphene oxide are excellent candidate in analyses applications over other carbon-based nanostructures due to its high catalytic ability, excellent conductivity, and high mechanical strength (Afzali et al., 2020; Demirkan et al., 2019). In recent years, GO is widely used for the MIP-based electrochemical sensor because of excellent characteristics and the capability of surface functionalization (Bagheri et al., 2019; Liu et al., 2019; Nair and Sooraj, 2020). Magnetic nanoparticles have been extensively utilized as appropriate options in many applications, due to their unique magnetic and electrochemical properties, which allow them to be obtained in an effortless way and a quick separation (Yáñez-Sedeño et al., 2017), as well as applied in catalysis, heat transfer applications in drug delivery systems, magnetic resonance imaging, cancer therapy, and magnetic storage devices (Tajyani and Babaei, 2018). Magnetic molecularly imprinted electrochemical sensors provide effective and flexible methods for sample immobilization or treatment and renewal of MIPs on a solid electrode surface (Yang et al., 2020). The topic of magnetic molecularly imprinted electrochemical sensors is rapidly developing and of great significance. Researchers discussed recent advances in electrochemical sensors based on MIPs and magnetic nanomaterials (Yáñez-Sedeño et al., 2017; Yang et al., 2020; Jiang et al., 2016). Fe3O4; as a magnetic nanoparticle is a good candidate to be used in electrochemical sensors due to having Biocompatibility properties, non-toxicity, catalytic activity, and high surface area (Bagheri et al., 2017). Many nanostructured materials containing carbons, metals, and conducting polymers have been developed to hybridize with Fe3O4 nanoparticle (He et al., 2020; Zhang et al., 2013; Fan et al., 2015). Previously, a study reported that Fe3O4 and GO are good choice in electrochemical measurements due to the large surface area of Fe3O4@GO (Gong et al., 2019). Therefore, we reported a novel electrochemical sensor based on magnetic core@shell molecularly imprinted nanocomposite (Fe3O4@GO@MIP) modified GCE to detect and determine capecitabine in 0.1 M PBS (pH 7.0) using square wave voltammetry (SWV) technique. The proposed electrode was successfully applied for the quantification of capecitabine in plasma and pharmaceutical samples.
2 Materials and methods
2.1 Apparatus
Electrochemical measurements were performed using a PalmSens electrochemical analyzer driven by PSTrace 4.6 software (Palm Instruments, Houten, The Netherlands). A traditional three-electrode system: Fe3O4@GO@MIP/GCE as a working electrode, Ag/AgCl (saturated KCl) as a reference electrode and a platinum wire as an auxiliary electrode was used. X-ray diffraction (XRD) patterns were recorded with Xpert MPD diffractometer, Philips, Netherlands. A scanning electron microscopy (SEM, MIRA3, Tescan, Czech Republic) and Transmission electron microscopy (TEM, EM-900, Zeiss, Germany) were used to investigate the nanostructures morphology. A Bruker Tensor 270 FTIR apparatus (Poland) was applied to prepare FT-IR spectra. All the pH values were measured with a Metrohm 827 pH meter (Herisau, Switzerland). All the voltammetry experiments were performed under a pure nitrogen atmosphere, at room temperature. The HPLC instrument (Model waters 600 E, U.S.A) was utilized to compare the results of two real samples (capecitabine tablet and plasma sample) with the proposed technique (SWV). The mobile phase was a mixture of acetonitrile/water 45:55 (%v/v) with 1.0 mL/min flow rate. This system is interfaced to a UV–vis detector (2487 waters), Rheodyne 7125i sampling valve with a 10 µL loop and a µBondapak C18 column (Waters, Ireland) [5.0 μm particle size, 3.9 mm × 300 mm].
2.2 Reagents
Capecitabine (98% minimum purity) was purchased from Merk (Darmstadt, Germany). 1-Methylimidazole (>99%), 2,2′-azobisisobutyronitrile (AIBN), methacrylic acid (MAA), and ethylene glycol dimethacrylate (EGDMA) were supplied from Aldrich (Steinheim, Germany). The standard solution of 5 mM capecitabine was prepared by dissolving an appropriate amount of compound in methanol. Sodium dihydrogen phosphate (NaH2PO4), disodium hydrogen phosphate (Na2HPO4), phosphoric acid (H3PO4) (89%), sodium nitrate (NaNO3), sulfuric acid (H2SO4, 98%), hydrochloric acid (HCl), iron (III) chloride (FeCl3), iron (II) chloride (FeCl2) and potassium permanganate (KMnO4) were purchased from Merck (Darmstadt, Germany). 5% w/w Nafion was from Alfa Aesar (Ward Hill, MA, USA). Distilled water was used for chemical solution preparation. 150 mg capecitabine tablet was supplied from the medical laboratory (Iran, Kerman).
2.3 Synthesis of Fe3O4@GO nanocomposites
GO nanosheets were obtained by the modified Hummer’s method, according to our previous work (Afzali et al., 2019). The magnetic Fe3O4 NPs were prepared by combining FeCl2·4H2O (2.0 mmol) and FeCl3·6H2O (4.0 mmol) in 100 mL of distilled water. This was followed by the dropwise addition of 20 mL of NH3 solution (25 wt%) to the mixture to reach the pH of 11, the mixture was continuously stirred at 60 °C for 1 h. The reaction was exposed to an external magnet to separate a black precipitate (Fe3O4 NPs) form solution, and the rinsed repeatedly with distilled water and ethanol, and finally dried at 60 °C for 12 h. To introduce GO on the surface of prepared NPs, 0.5 g Fe3O4 NPs were dispersed in a solution containing 50 mL ethanol and 5 mL NH3 (25%). Then, 20 mg of GO was added to the solution and the mixture was sonicated for 2 h. Next, Fe3O4@ GO was magnetically separated, washed three times with ethanol and dried at 80 °C for 10 h.
2.4 Preparation of the Fe3O4@GO@MIP
In the following procedures, Fe3O4@GO was coated with the MIP shell via a non-covalent imprinting process.
First, 0.15 mmol capecitabine as the template molecule and 0.60 mmol MAA as the functional monomer were added to 10 mL methanol and distilled water (4:1 v/v) and ultrasonicated at 304.2 K for 30 min. 3.0 mmol EGDMA as the cross-linker agent and 30 mg AIBN as the initiator and 40 mg of the synthesized Fe3O4@GO were subsequently added to the solution. The obtained pre-polymerization solution was sonicated for 30 min, then purged with nitrogen for 15 min to remove oxygen and allowed to polymerize at 60 °C for 24 h. Finally, Fe3O4@GO@MIP composite was magnetically separated, and completed by repeatedly leaching the capecitabine from the polymer using acetic acid/methanol (9:1, v/v) through centrifugation (4000 rpm) until no template are detected by HPLC in the extraction media. After washing by methanol, the Fe3O4@GO@MIP composite was dried in vacuum at 60 °C for 10 h. The schematic illustration of synthesis steps is shown in Scheme 2. A polymeric film was formed on the surface of a Fe3O4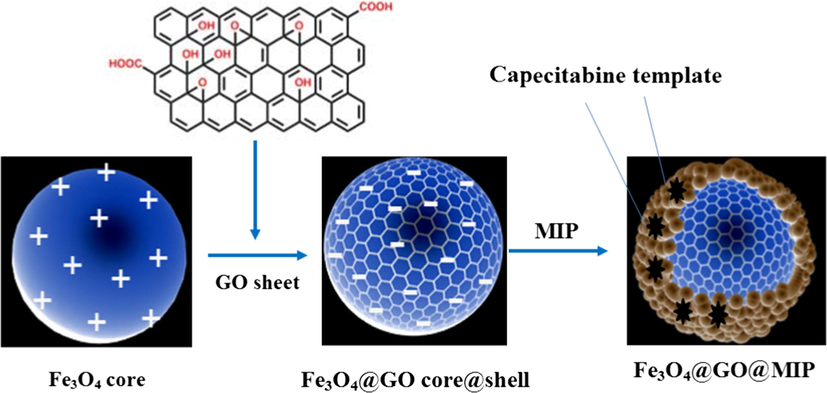
Synthesis steps of the core–shell structure of Fe3O4@GO@MIP.
@GO/GCE by electrodepositing Fe3O4@GO in the presence of capecitabine template by cyclic voltammetry. Electrodeposition was completed in 30 cycles in 0.1 M PBS (pH 7.0). Cyclic voltammograms for electrodeposition of Fe3O4@GO with capecitabine is shown in Fig. 1. In the same conditions, non-imprinted polymer (Fe3O4@GO@NIP) was synthesized just in the absence of template molecule (capecitabine) in the polymerization process.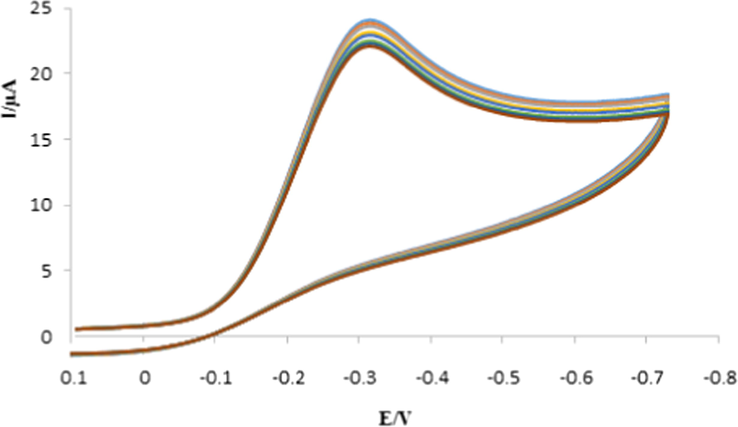
Cyclic voltammograms of the MIP film on the Fe3O4@GO/GCE in 0.1 M PBS (pH 7.0) solution at a scan rate of 50 mV for 30 cycles with capecitabine.
2.5 Fabrication of the modified electrodes
First, GCE was polished with 3 µm alumina on a smooth polishing cloth and washed with distilled water and ethanol before each electrochemical measurement. The electrode cleaning procedure requires 3 min. Then, 5 mg of Fe3O4@GO@MIP nanocomposite, as the optimized value was ultrasonically dispersed in 1 mL methanol. After that, 5 μL of the dispersion was mixed with 5 µL nafion (5% w/w), as the binder. 2 µL of the prepared suspension was cast on the surface of GCE. The modified electrode is prepared and named Fe3O4@GO@MIP/GCE. The proposed sensor was utilized for capecitabine determination with cyclic and square wave voltammetry techniques according to the general procedure.
2.6 General procedure
10 mL of 0.1 M phosphate buffer solution (PBS, pH 7.0) containing capecitabine in the range of 1.0–100.0 nM was prepared. The solution was stirred at 400 rpm for 10 min and then kept quiet for 20 s. The modified electrode was put in the cell. Cyclic and square wave voltammetry techniques were performed at a scan rate of 50 mV s−1. The buffer solution was deoxygenated before each measurement, by bubbling pure nitrogen for 15 min, and all analyses were performed at room temperature. The SW voltammograms of capecitabine were recorded in the potential range of 0.00
V to −0.55 V.
3 Results and discussion
3.1 Characterization
Fe3O4 NPs were synthesized through the co-precipitation method. These particles tend to agglomerate, because of their high surface energy and magnetism. But, the GO layer on the surface of NPs should be acts as a cover to prevent the aggregation. On the other hand, the —OH and —COOH groups on the GO surface allow surface modification (Tang et al., 2015).
The morphology of GCE, magnetic Fe3O4 NPs, Fe3O4@GO, and Fe3O4@GO@MIP was characterized by SEM and TEM (Fig. 2). The SEM image of GCE (Fig. 1a) displays a relatively smooth surface. According to SEM and TEM images in Fig. 2(b–g), all prepared materials have a spherical shape with a rough surface. The core–shell structure of Fe3O4@GO and Fe3O4@GO@MIP composites is shown in TEM image (Fig. 2e and f). Also, TEM images show that the Fe3O4 NPs have an average diameter on 286 nm, it is clearly viewed that a layer of GO shell with thickness of about 5 nm is covered on the Fe3O4 core. A slightly rough layer of MIP with the thickness of about 60 nm can be seen in Fig. 2f.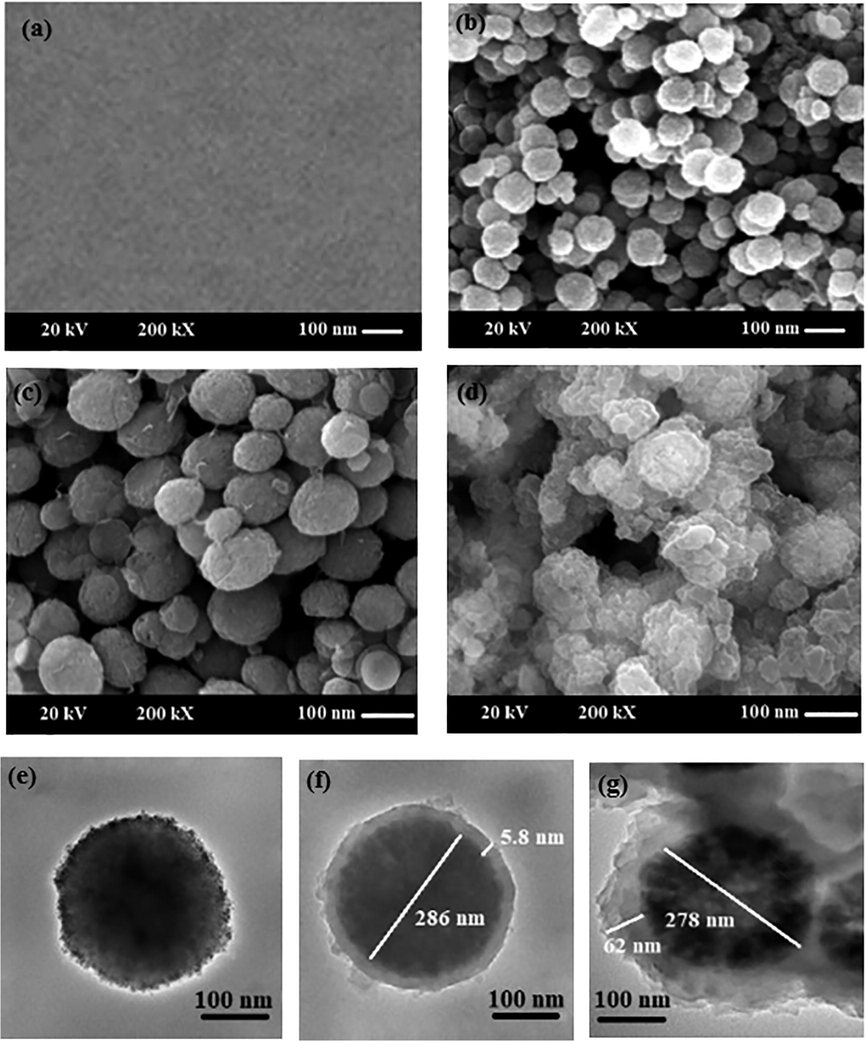
SEM image of bare GCE (a); SEM and TEM images of Fe3O4(b, e), Fe3O4@GO (c, f), Fe3O4@GO@MIP (d, g).
The obtained results demonstrated that the surface morphology did not change after polymerization and confirmed the successful formation of the core–shell structure of Fe3O4@GO@MIP microspheres.
XRD also investigated the crystalline structure of the prepared nanocomposite. Fig. 3 presents the XRD patterns of magnetic Fe3O4, GO, Fe3O4@GO, and Fe3O4@GO@MIP in the range of 5–80°. The diffraction peaks of Fe3O4 appeared at 18°, 30°, 35°, 43.2°, 53°, 57.1° and 63° can be indexed to (1 1 1), (2 2 0), (3 1 1), (4 0 0), (4 2 2), (5 1 1) and (4 4 0) planes. These results are corresponded with the standard XRD data for inverse spinel cubic crystal structure of magnetic Fe3O4 (JCPDS card, file No. 76-1849) (Jaiswal et al., 2018). The sharpness and intensity of the peaks indicated that the Fe3O4 microspheres had been successfully synthesized. The XRD pattern of Fe3O4@GO core–shell is very similar to that of the pristine Fe3O4 (Yang et al., 2015), and the diffraction peak of GO is observed at 2θ = 12.7° attributed to (0 0 2) plane.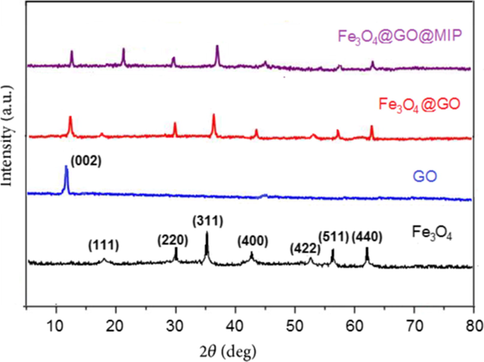
The XRD patterns of Fe3O4, GO, Fe3O4@GO, Fe3O4@GO@MIP.
Also, the chemical structure of GO, Fe3O4@GO and Fe3O4@GO@MIP were evaluated by FT-IR. The results are shown in Fig. 4. The characteristic peaks at 3437, 1730, 1635, 1242 and 950 cm−1 attributed to the O—H bond, carbonyl (C⚌O) stretching, the vibration of C⚌C, C—OH and C—O groups, respectively confirm the formation of GO. The observed peak at 580 cm−1 in the FT-IR spectrum of Fe3O4@GO and Fe3O4@GO@MIP is attributed to Fe—O stretching vibration. So, the obtained results indicated that the magnetic Fe3O4 nanoparticles were successfully connected to the GO sheets. After MIP coating, the Fe—O stretching band was significantly decreased, demonstrates that the MIP preparation was successful. The peak at 1730 cm−1 (C⚌O) significantly increased when magnetic Fe3O4@GO was coated by MIP having a large number of C⚌O groups. Also, the absorption bands approximately at 1155 and 1255 cm−1 corresponded to the C—O—C symmetric and asymmetric stretching vibrations. The broad peaks at around 1392 and 1463 cm−1 attributed to the stretching mode of —CH3 deformation vibration and —CH2 bending vibration, respectively. The vibration bonds approximately at 850 cm−1 and 1710 cm−1 attributed to the C—F and N—H vibrations, respectively. The results demonstrated the satisfactorily formation of MIP on the surface of Fe3O4@GO.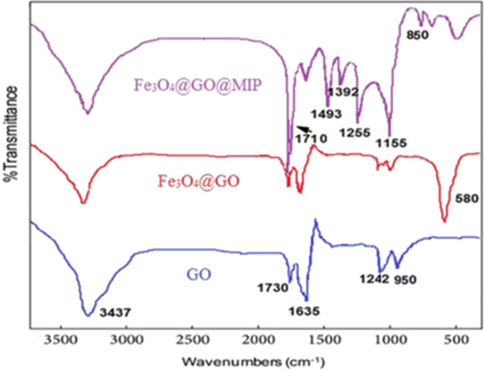
The FT-IR spectra of Fe3O4, Fe3O4@GO and Fe3O4@GO@MIP.
3.2 The electrochemical behavior of the proposed electrode for the determination of capecitabine
The SWVs of 100 nM capecitabine was investigated in the presence of the bare GCE, GO/GCE, Fe3O4@GO/GCE, Fe3O4@GO@MIP/GCE and Fe3O4@GO@NIP/GCE in 0.1 M PBS (pH = 7.0) at the scan rate of 50 mV s−1. The results are shown in Fig. 5. The bare GCE illustrated low cathodic peak current of capecitabine (a), while by using GO modifier, the sensitivity was significantly increased (b) (Wei et al., 2017). At the Fe3O4@GO/GCE (c), due to the electrocatalytic and conductivity activity of Fe3O4 NPs, the rate of electron transfer and the reduction peak current were increased, respectively (Liang et al., 2010; Teymourian et al., 2013). Fe3O4@GO@MIP/GCE (d) indicated that the sensitivity was slightly decreased. The high signal of the MIP was related to its cavities because capecitabine could pass through these cavities and reach to the electrode surface more easily (Xing et al., 2012). In the same conditions, by applying the Fe3O4@GO@NIP/GCE (e) just a slight increase was observed in the sensitivity of capecitabine, in comparison with the bare GCE. It can be attributed to polymer matrix formation on the surface of the Fe3O4@GO and block electron transfer of capecitabine.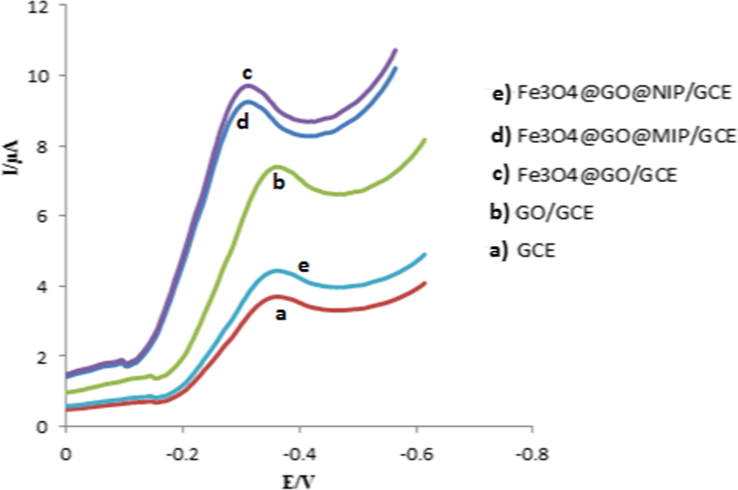
The SWV of 100 nM capecitabine in 0.1 M PBS (pH = 7.0) at the bare GCE and modified electrodes at the scan rate of 50 mVs−1.
3.3 Effect of scan rate
The effect of the scan rate on the reduction peak potential and current was investigated. The proposed method was performed in phosphate buffer solution at pH 7.0. Cyclic voltammograms were recorded between 10 and 100 mV s−1 at the surface of the Fe3O4@GO@MIP/GCE. The results in Fig. 6 showed that by increasing scan rate, the cathodic peak currents of 100.0 nM capecitabine were increased, while no considerable shift toward more negative value was observed. Inset of Fig. 6 shows the reduction peak current versus scan rate (ν) and the square root of scan rate (ν1/2). The linear relationship between the cathodic peak currents and scan rate (ν) indicated that the electrode process was controlled by adsorption, not diffusion mechanism.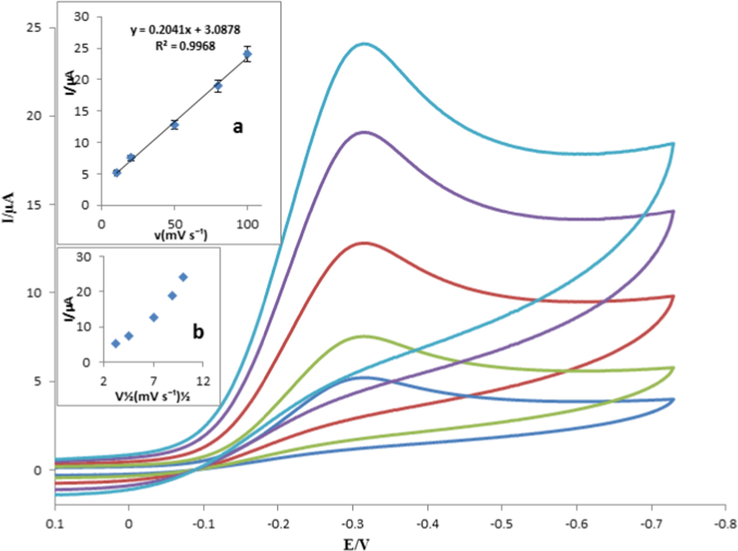
Cyclic voltammograms of 10.0 nM capecitabine at different scan rates of 10, 20, 50, 80 and 100 mV s−1. Inset: The dependence of the reduction peak current versus scan rate (a) and square root of scan rate (b).
3.4 Type and pH of supporting electrolyte
Several 0.1 M buffer solutions including phosphate, acetate, Robinson and borate were tested as supporting electrolytes for capecitabine determination using Fe3O4@GO@MIP/GCE. According to the obtained results in Fig. 7, the phosphate buffer solution having the highest reduction peak current, was selected for further experiments.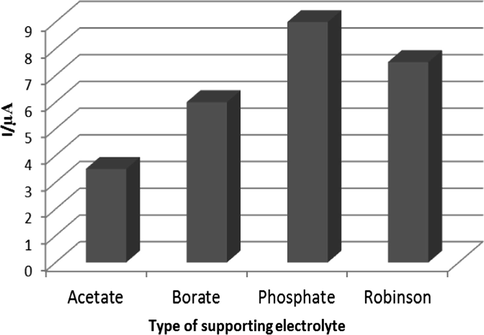
The effect of 0.1 M buffer solutions on the reduction current of capecitabine.
The effect of pH values of PBS on the electrochemical current of capecitabine was investigated in the range of 3.0–9.0. The highest cathodic current of capecitabine was observed at pH 7.0 (Fig. 8). We found that by increasing pH values, the reduction peak potential shifted to lower values. Fig. 8 inset shows the linear relationship between peak potential (Ep) and pH values with the determination coefficient (R2) of 0.9972. The curve slope from Epc = −0.0521pH + 0.06 equation was obtained −0.0521 V/pH. According to the theoretical equation (Ep = (−0.0592 m/n) pH + b), where m and n are the numbers of protons and electrons, the obtained slop was closed to the theoretical value, because the number of involved electrons and protons were the same in an electrochemical process, as depicted in Scheme 3 (Baymak et al., 2015). For every analytical method, it is of importance to understand the nature of chemical and physical processes involved in the procedure. In Scheme 3, this heterocyclic ring of capecitabine bears a reducible carbonyl group. The carbonyl in 5-FU is isolated, having only two amine nitrogens in the neighborhood. The latter have an electron-donating effects, which shifts the reduction potential to more negative values. Therefore, the mentioned discussions implying the reduced group on capecitabine to be the carbonyl group on the six-membered heterocyclic ring (Baymak et al., 2015).
SW voltammograms of capecitabine at various pH values (from left to right: 3.0, 4.0, 5.0, 6.0, 7.0, 8.0, 9.0). Inset: The linear dependence of the peak potential versus pH values.
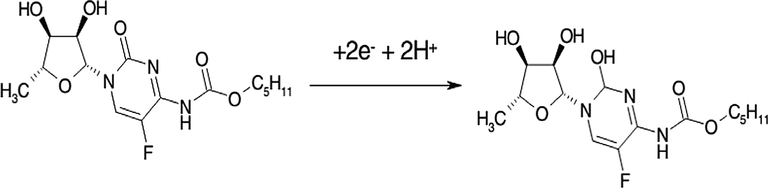
The reduction mechanism of capecitabine.
3.5 The analytical performance of the method
Under the optimized conditions, analytical performance of the proposed method, such as linearity, the limit of quantification (LOQ), limit of detection (LOD), repeatability, and selectivity were investigated. Fig. 9 indicates the SWV of different concentrations of capecitabine (1.0–100.0 nM) in 0.1 M PBS (pH 7.0) using Fe3O4@GO@MIP/GCE. As can be seen, by increasing the concentration from 1.00 to 100.0 nM, the cathodic peak current of capecitabine was gradually increased. Fig. 9 inset shows the linear relationship between the various concentrations and reduction peak currents with the determination coefficients (R2) of 0.9932. The limit of quantification was obtained 1.0 nM from 10Sb/m equation (Sb is the standard deviation (SD) of the blank and m is the slope of the calibration curve). The limit of detection (LOD) was calculated 0.324 nM from 3Sb/m equation. Relative standard deviations (RSDs) for six replicate capecitabine determinations at the concentration of 8.0 and 15.0 nM were obtained to be ±3.15 and ±1.08%, respectively.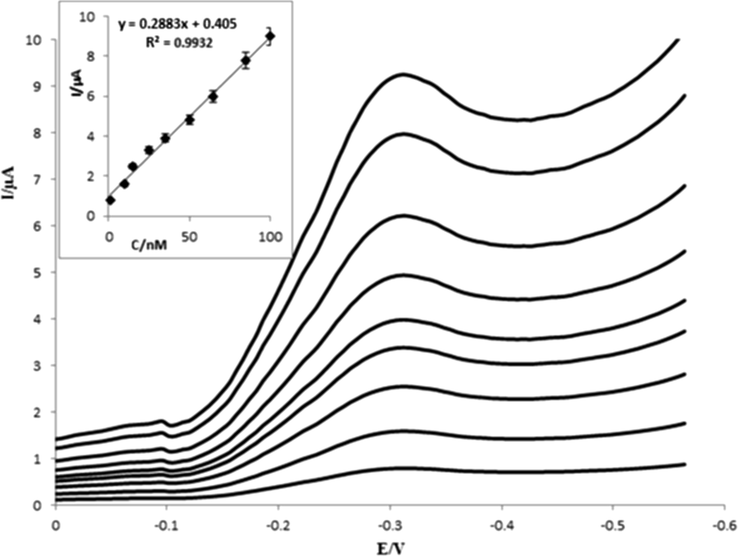
SWVs of various concentrations of capecitabine (from down to up: 1.0, 10.0, 15.0, 20.0, 40.0, 50.0, 60.0, 80.0 and 100.0 nM). Inset: linear relationship between reduction peak current and capecitabine concentrations. Instrumental parameters: scan rate 50 mV s−1, pulse amplitude 25 mV, step potential 4 mV and frequency 12 Hz.
Moreover, the reproducibility of the proposed sensor was investigated for the determination of 15.0 nM capecitabine. For this purpose, six independently Fe3O4@GO@MIP/GCEs were fabricated at the same preparation conditions. The RSD value was obtained 1.25%. Also, the reproducibility of GO/GCE and Fe3O4@GO/GCE were evaluated for the quantification of 15.0 nM capecitabine, so the RSD values for these electrodes were obtained 2.83% and 1.65%, respectively. The better result of RSD was seen at Fe3O4@GO@MIP/GCE than that of the others in the preparation and determination procedures, demonstrating ideal reproducibility of the proposed sensor toward detection of capecitabine.
The stability of the proposed sensor was evaluated for the determination of 100.0 nM capecitabine two times: (i) immediately after the fabrication of electrode and (ii) after 30 days. During the period, the Fe3O4@GO@MIP/GCE was kept and stored in the refrigerator (4 °C). The results demonstrated that the capecitabine reduction peak current after 30 days was still retained 98.5% of the initial response, confirming good long-term stability of the proposed sensor.
The selectivity of the present method was studied. Under optimum conditions, Table 1 lists the various possible interfering species in determination of capecitabine. The results indicated that organic compounds such as glucose, cytidine, flutamide, riboflavin, nitrophenol, ascorbic acid, adenine, 5-fluorouracil, citric acid, cysteine and uric acid, no significant change in the reduction peak potential and current of capecitabine. So, the obtained recoveries were from 100.0% to 102.6%. The results illustrated that the proposed method is reliable for the quantification of capecitabine in real samples.
Interferents
Molar ratio of the interferents to capecitabine
Recovery (%)
Glucose
1000
101.0
Cytidine
550
102.6
Flutamide
600
100.9
Riboflavin
700
101.5
Nitrophenol
850
102.2
Ascorbic acid
750
101.3
Adenine
650
102.1
Citric acid
600
99.5
5-Fluorouracil
800
98.9
Cysteine
700
100.1
Uric acid
850
102.0
3.6 The determination of capecitabine in real samples
The analytical application of the proposed method was tested using a health human plasma sample and capecitabine tablet. To prepare the plasma sample, healthy blood was transferred to a tube containing ethylene diamine tetraacetic acid (EDTA) and centrifuged at 4000 rpm for 5 min. The plasma sample (a yellow liquid) was separated from blood cells and diluted 25 times with distilled water, due to the high concentration and low value of the obtained plasma sample. Then, the plasma sample were analyzed using the standard addition by the proposed method.
One capecitabine tablet was pulverized, and a definite weight of it was dissolved in distilled water by ultrasonication. After filtration on an ordinary filter paper, undissolved contents were removed, and the residual solution was collected in a 100 mL volumetric flask. After that, 1.0 mL of the residual solution was added to 9.0 mL of 0.1 M PBS (pH 7.0). SWV technique was used for the quantification of capecitabine. The results for the analysis of capecitabine in real samples were summarized in Table 2. As can be seen, good accuracy with satisfactory results of recovery was obtained. The precision of the proposed method was investigated by intra-day and inter-day determination of capecitabine at two different concentrations of capecitabine solution three times using SWV technique. For intra-assay precision, three successive measurements (n = 3) were performed and calculated during one day; inter-assay precision was conducted between three consecutive days during one week. The results obtained for intra-day and inter-day precision indicate high precision of the proposed method (Table 2).
Sample
Certified amount
Added amount
Found amounta
%RSD
Intra-day%RSD
Inter-dayRecovery (%)
Found HPLC method (nM)
Ftab
(0.05;95%)
Fexp
ttab
(98%)
texp
Capecitabine tablet
150 (mg per-tablet)
–
155 ± 2.0(mg per-tablet)
1.30
1.91
101.2
153.2 ± 6.0 mg
19.0
9.0
3.8
1.52
Healthy plasma
–
–
10.0 nM
20.0 nM0
10.1 ± 0.2 nM
20.3 ± 0.1 nM–
1.7
0.5–
2.1
1.2–
101.0
101.50
10.05 ± 0.5
20.2 ± 0.3–
19.0
19.0–
6.25
9.0–
3.8
3.8–
1.67
2.73
Also, the F-test (precision) and t-test (accuracy) were used for comparing the obtained results of the proposed method with that of the HPLC-UV method in the two real samples. This comparison illustrated no significant difference between the observed results of two methods. So, the present method confirmed that it is applicable for the accurate and precise determination of capecitabine.
3.7 Comparison with some of the electrochemical methods
As shown in Table 3, the proposed electrode was compared with previously reported sensors for the determination of capecitabine (Zhang et al., 2017; Madrakian et al., 2016; Es'haghi and Moeinpour, 2019). The observation confirmed that the present sensor provided a lower detection limit, and a comparable width of linear range compared with other reported electrochemical methods.
Modified electrode
Linear range
LOD
Ref
ZnO/MWCNT/CPE1
0.1–100 µM
0.03 µM
Madrakian et al. (2016)
AuNPs/SGNF/GCE2
0.05–80 µM
0.017 µM
Zhang et al. (2017)
HF-PGE3
7.70–142 µM
0.11 µM
Es' haghi and Moeinpour (2019)
Fe3O4@GO@MIP/GCE
1.0–100 nM
0.324 nM
This work
4 Conclusion
In summary, a simple method was employed to prepare Fe3O4@GO@MIP nanocomposite and applied to modify GCE. Thus, a novel sensor was introduced for the quantification of capecitabine using SWV technique. The obtained peak currents were linearly dependent on the capecitabine concentration within the linear range of 1.00–100.0 nM. The lowest detection limit was obtained to be 0.324 nM. The proposed sensor exhibited satisfactory results such as good sensitivity, selectivity, repeatability, reproducibility and stability. The Fe3O4@GO@MIP/GCE sensor has been successfully applied for the determination of capecitabine in pharmaceutical and plasma sample.
Acknowledgment
The authors would like to express their sincere appreciation to the founders of Shahid Bahonar university of Kerman, Mr. Alireza Afzalipour and his wife, Mrs. Fakhereh Saba, for their foresight and generosity in training future generations of doctors, engineers and scientists. Also, the authors would like to acknowledge their thanks to Dr. Parviz Dabiri for his generous support for the research activities of the chemistry and nano laboratories in Shahid Bahonar University of Kerman.
Declaration of Competing Interest
The authors declare that they have no known competing financial interests or personal relationships that could have appeared to influence the work reported in this paper.
References
- A novel voltammetric sensor based on palladium nanoparticles/carbon nanofibers/ionic liquid modified carbon paste electrode for sensitive determination of anti-cancer drug pemetrexed. J. Mol. Liq.. 2019;282:456-465.
- [Google Scholar]
- Designing an Au/reduced graphene oxide modified carbon paste electrode for the electrochemical quantification of agnuside. Sens. Actuators, B. 2019;290:188-194.
- [Google Scholar]
- Decoration of graphene oxide with NiO@ polypyrrole core-shell nanoparticles for the sensitive and selective electrochemical determination of piceatannol in grape skin and urine samples. Talanta. 2019;196:92-99.
- [Google Scholar]
- Developing a novel sensor based on ionic liquid molecularly imprinted polymer/gold nanoparticles/graphene oxide for the selective determination of an anti-cancer drug imiquimod. Biosens. Bioelectron.. 2019;143:111620.
- [Google Scholar]
- Square wave voltammetric determination of anticancer drug flutamide using carbon paste electrode modified by CuO/GO/PANI nanocomposite. Arabian J. Chem.. 2020;13(1):3255-3265.
- [Google Scholar]
- Molecularly imprinted polymers in electrochemical and optical sensors. Trends Biotechnol.. 2019;37(3):294-309.
- [Google Scholar]
- The efficacy and safety of modified docetaxel, cisplatin, and 5-fluorouracil vs epirubicin, oxaliplatin, and capecitabine regimen in the advanced gastric cancer: a randomized controlled clinical trial. Asian Pac. J. Cancer Prevent.. 2020;21(3):727-732.
- [Google Scholar]
- Novel three-Dimensional molecularly imprinted polymer-coated carbon nanotubes (3D-CNTs@ MIP) for selective detection of profenofos in food. Anal. Chim. Acta. 2019;1076:64-72.
- [Google Scholar]
- Highly sensitive and selective electrochemical paper-based device using a graphite screen-printed electrode modified with molecularly imprinted polymers coated Fe3O4@ Au@ SiO2 for serotonin determination. Anal. Chim. Acta. 2019;1077:255-265.
- [Google Scholar]
- Fluorouracil enhances photodynamic therapy of squamous cell carcinoma via a p53-independent mechanism that increases protoporphyrin IX levels and tumor cell death. Mol. Cancer Ther.. 2017;16(6):1092-1101.
- [Google Scholar]
- Prediction of exposure-driven myelotoxicity of continuous infusion 5-fluorouracil by a semi-physiological pharmacokinetic–pharmacodynamic model in gastrointestinal cancer patients. Cancer Chemother. Pharmacol. 2020:1-12.
- [Google Scholar]
- Application of surface molecular imprinted magnetic graphene oxide and high performance mimetic behavior of bi-metal ZnCo MOF for determination of atropine in human serum. Talanta. 2019;201:286-294.
- [Google Scholar]
- A novel electrochemical platform for sensitive and simultaneous determination of dopamine, uric acid and ascorbic acid based on Fe3O4SnO2Gr ternary nanocomposite. Microchem. J.. 2017;131:120-129.
- [Google Scholar]
- The application of differential pulse polarography to the analysis of capecitabine and investigation of its electroreduction mechanism. J. Electrochem. Soc.. 2015;162(6):G29-G35.
- [Google Scholar]
- Gastrointestinal cancer: Selection of clinically relevant drug-induced toxicities encountered in gastrointestinal cancer treatment. In: Side Effects of Medical Cancer Therapy. Springer; 2018. p. :105-119.
- [Google Scholar]
- Medical management of gastric cancer: a 2017 update. Cancer Med.. 2018;7(1):123-133.
- [Google Scholar]
- Electrodeposition of Ni–Co–Fe mixed sulfide ultrathin nanosheets on Ni nanocones: a low-cost, durable and high performance catalyst for electrochemical water splitting. Nanoscale. 2019;11(35):16621-16634.
- [Google Scholar]
- Determination of cefixime using a novel electrochemical sensor produced with gold nanowires/graphene oxide/electropolymerized molecular imprinted polymer. Mater. Sci. Eng., C. 2019;96:654-660.
- [Google Scholar]
- Electrochemical Detection of Dopamine in the Presence of Uric Acid Using Graphene Oxide Modified Electrode as Highly Sensitive and Selective Sensors, Graphene Functionalization Strategies. Springer; 2019. p. :179-192.
- Simultaneous determination of capecitabine and its three nucleoside metabolites in human plasma by high performance liquid chromatography–tandem mass spectrometry. J. Chromatogr. B. 2015;989:71-79.
- [Google Scholar]
- Rapid and simultaneous determination of capecitabine and its metabolites in mouse plasma, mouse serum, and in rabbit bile by high-performance liquid chromatography. J. Chromatogr. A. 2007;1138(1–2):101-108.
- [Google Scholar]
- Pharmacokinetic analysis of metronomic capecitabine in refractory metastatic colorectal cancer patients. Invest. New Drugs. 2018;36(4):709-714.
- [Google Scholar]
- A three-dimensional conductive molecularly imprinted electrochemical sensor based on MOF derived porous carbon/carbon nanotubes composites and prussian blue nanocubes mediated amplification for chiral analysis of cysteine enantiomers. Electrochim. Acta. 2019;302:137-144.
- [Google Scholar]
- Carbon nanotube/polyurethane modified hollow fiber-pencil graphite electrode for in situ concentration and electrochemical quantification of anticancer drugs Capecitabine and Erlotinib. Eng. Life Sci.. 2019;19(4):302-314.
- [Google Scholar]
- Preparation and characterization of molecular imprinted polymer functionalized with core/shell magnetic particles (Fe3O4@ SiO2@ MIP) for the simultaneous recognition and enrichment of four taxoids in Taxus× media. Chem. Eng. J.. 2015;279:567-577.
- [Google Scholar]
- Core-shell structured Fe3O4@ GO@ MIL-100 (Fe) magnetic nanoparticles as heterogeneous photo-Fenton catalyst for 2, 4-dichlorophenol degradation under visible light. J. Hazard. Mater.. 2019;371:677-686.
- [Google Scholar]
- Preparation of magnetic molecularly imprinted polymer Fe3O4@ SiO2@ Ag-MIPs and its identification and SERS detection of ofloxacin. Chem. Lett.. 2020;49(X)
- [Google Scholar]
- Inhibition of TGF-β signalling in combination with nal-IRI plus 5-Fluorouracil/Leucovorin suppresses invasion and prolongs survival in pancreatic tumour mouse models. Sci. Rep.. 2020;10(1):1-12.
- [Google Scholar]
- Microwave-assisted rapid synthesis of Fe3O4/poly (styrene-divinylbenzene-acrylic acid) polymeric magnetic composites and investigation of their structural and magnetic properties. Eur. Polym. J.. 2018;98:177-190.
- [Google Scholar]
- Magnetic molecularly imprinted polymer nanoparticles based electrochemical sensor for the measurement of Gram-negative bacterial quorum signaling molecules (N-acyl-homoserine-lactones) Biosens. Bioelectron.. 2016;75:411-419.
- [Google Scholar]
- Cetuximab monotherapy and cetuximab plus capecitabine as first-line treatment in older patients with RAS-and BRAF wild-type metastatic colorectal cancer. Results of the multicenter phase II trial SAKK 41/10. J. Geriatric Oncol.. 2019;10(2):304-310.
- [Google Scholar]
- A methyl parathion recognition method based on carbon nitride incorporated hexagonal boron nitride nanosheets composite including molecularly imprinted polymer. J. Electrochem. Soc.. 2019;166(12):H495.
- [Google Scholar]
- Electrochemical sensor based on au@ nitrogen-doped carbon quantum dots@ Ag core-shell composite including molecular imprinted polymer for metobromuron recognition. J. Electrochem. Soc.. 2019;166(14):H691-H697.
- [Google Scholar]
- Preparation of molecularly imprinted polymer sensor on electrochemically reduced graphene oxide modified electrode for selective probing of thiabendazole. J. Electrochem. Soc.. 2019;166(2):B84.
- [Google Scholar]
- Flexible, magnetic, and electrically conductive graphene/Fe3O4 paper and its application for magnetic-controlled switches. J. Phys. Chem. C. 2010;114(41):17465-17471.
- [Google Scholar]
- Dopamine molecularly imprinted electrochemical sensor based on graphene–chitosan composite. Electrochim. Acta. 2012;75:108-114.
- [Google Scholar]
- A highly sensitive and selective electrochemical sensor based on polydopamine functionalized graphene and molecularly imprinted polymer for the 2,4-dichlorophenol recognition and detection. Talanta. 2019;195:691-698.
- [Google Scholar]
- Engineering molecularly imprinted polymers (MIPs) for the selective extraction and quantification of the novel psychoactive substance (NPS) methoxphenidine and its regioisomers. Analyst. 2018;143(9):2002-2007.
- [Google Scholar]
- Preparation of a ZnO nanoparticles/multiwalled carbon nanotubes/carbon paste electrode as a sensitive tool for capecitabine determination in real samples. RSC Adv.. 2016;6(40):33851-33856.
- [Google Scholar]
- Statistical short-time analysis of electrochemical noise generated within a proton exchange membrane fuel cell. J. Solid State Electrochem.. 2018;22(6):1649-1660.
- [Google Scholar]
- Simultaneous voltammetric determination of acetaminophen, naproxen, and theophylline using an in-situ polymerized poly (acrylic acid) nanogel covalently grafted onto a carbon black/La 2 O 3 composite. Microchim. Acta. 2019;186(9):651.
- [Google Scholar]
- Molecular imprinted polymer-wrapped AgNPs-decorated acid-functionalized graphene oxide as a potent electrochemical sensor for ibuprofen. J. Mater. Sci.. 2020;55(8):3700-3711.
- [Google Scholar]
- Enhanced surface plasmon resonance (SPR) signals based on immobilization of core-shell nanoparticles incorporated boron nitride nanosheets: Development of molecularly imprinted SPR nanosensor for anticancer drug, etoposide. Biosens. Bioelectron.. 2019;130:293-298.
- [Google Scholar]
- Molecularly imprinted polymers as receptor mimics for selective cell recognition. Chem. Soc. Rev.. 2018;47(15):5574-5587.
- [Google Scholar]
- Systemic Therapy for Brain Metastases in Other Primary Cancers (Genitourinary, Gastrointestinal, Gynecology, Head/Neck), Central Nervous System Metastases. Springer; 2020. p. :245-257.
- Molecularly imprinted polymers for selective recognition in regenerative medicine. In: Nanostructured Biomaterials for Regenerative Medicine. Elsevier; 2020. p. :141-163.
- [Google Scholar]
- Assessment of pharmacokinetic variations of capecitabine after multiple administration in rats: a physiologically based pharmacokinetic model. Cancer Chemother. Pharmacol.. 2020;85(5):869-880.
- [Google Scholar]
- Application of molecularly-imprinted polymers in solid-phase microextraction techniques. TrAC, Trends Anal. Chem.. 2015;73:81-90.
- [Google Scholar]
- Rabeprazole intake does not affect systemic exposure to capecitabine and its metabolites, 5′-deoxy-5-fluorocytidine, 5′-deoxy-5-fluorouridine, and 5-fluorouracil. Cancer Chemother. Pharmacol.. 2019;83(6):1127-1135.
- [Google Scholar]
- Dihydropyrimidine dehydrogenase in the metabolism of the anticancer drugs. Cancer Chemother. Pharmacol. 2019:1-10.
- [Google Scholar]
- A new sensing platform based on magnetic Fe3O4@ NiO core/shell nanoparticles modified carbon paste electrode for simultaneous voltammetric determination of Quercetin and Tryptophan. J. Electroanal. Chem.. 2018;808:50-58.
- [Google Scholar]
- Highly efficient fluorescent QDs sensor for specific detection of protein through double recognition of hybrid aptamer-molecular imprinted polymers. Sens. Actuators, B. 2018;274:627-635.
- [Google Scholar]
- An electrochemical sensor based on iron (II, III)@ graphene oxide@ molecularly imprinted polymer nanoparticles for interleukin-8 detection in saliva. Anal. Methods. 2015;7(18):7784-7791.
- [Google Scholar]
- Fe3O4 magnetic nanoparticles/reduced graphene oxide nanosheets as a novel electrochemical and bioeletrochemical sensing platform. Biosens. Bioelectron.. 2013;49:1-8.
- [Google Scholar]
- Novel electrochemical sensing platform based on integration of molecularly imprinted polymer with Au@ Ag hollow nanoshell for determination of resveratrol. Talanta. 2019;196:479-485.
- [Google Scholar]
- Molecularly imprinted polymer/graphene oxide modified glassy carbon electrode for selective detection of sulfanilamide. Progr. Natural Sci.: Mater. Int.. 2017;27(3):374-379.
- [Google Scholar]
- Electrochemical sensor based on molecularly imprinted film at polypyrrole-sulfonated graphene/hyaluronic acid-multiwalled carbon nanotubes modified electrode for determination of tryptamine. Biosens. Bioelectron.. 2012;31(1):277-283.
- [Google Scholar]
- Switchable zipper-like thermoresponsive molecularly imprinted polymers for selective recognition and extraction of estradiol. Talanta. 2018;176:187-194.
- [Google Scholar]
- Electrochemical sensors based on magnetic molecularly imprinted polymers: A review. Anal. Chim. Acta. 2017;960:1-17.
- [Google Scholar]
- Rapid degradation of methylene blue in a novel heterogeneous Fe 3 O 4@ rGO@ TiO 2-catalyzed photo-Fenton system. Sci. Rep.. 2015;5:10632.
- [Google Scholar]
- Magnetic molecularly imprinted electrochemical sensors: A review. Anal. Chim. Acta. 2020;1106:1-21.
- [Google Scholar]
- An epoxysilane modified indium tin oxide electrode for the determination of PAK 2: Application in human serum samples. Anal. Chim. Acta. 2019;1062:68-77.
- [Google Scholar]
- Molecular imprinted electrospun chromogenic membrane for l-tyrosine specific recognition and visualized detection. Talanta. 2019;204:647-654.
- [Google Scholar]
- Gold nanoparticles/two-dimensional (2D) hexagonal boron nitride nanosheets including diethylstilbestrol imprinted polymer: electrochemical detection in urine samples and validation. J. Electrochem. Soc.. 2018;165(14):H897.
- [Google Scholar]
- Development of molecular imprinted sensor including graphitic carbon nitride/N-doped carbon dots composite for novel recognition of epinephrine. Compos. B Eng.. 2019;175:107113.
- [Google Scholar]
- 5-Nitrouracil stabilizes the plasma concentration values of 5-FU in colorectal cancer patients receiving capecitabine. Sci. Rep.. 2020;10(1):1-7.
- [Google Scholar]
- Electrochemical determination of the anticancer drug capecitabine based on a graphene-gold nanocomposite-modified glassy carbon electrode. Int. J. Electrochem. Sci. 2017;12:10773-10782.
- [Google Scholar]
- Cost-effectiveness analysis of capecitabine plus bevacizumab versus capecitabine alone in elderly patients with previously untreated metastatic colorectal cancer from Chinese societal perspective. Clin. Transl. Oncol.. 2020;22(1):103-110.
- [Google Scholar]
- Sorption of carbamazepine from water by magnetic molecularly imprinted polymers based on chitosan-Fe3O4. Carbohydr. Polym.. 2013;97(2):809-816.
- [Google Scholar]
- Recent advances and trends of molecularly imprinted polymers for specific recognition in aqueous matrix: preparation and application in sample pretreatment. TrAC, Trends Anal. Chem. 2019
- [Google Scholar]
- Simple determination of capecitabine and its metabolites by liquid chromatography with ultraviolet detection in a single injection. J. Chromatogr. B. 2004;809(1):51-58.
- [Google Scholar]


