Translate this page into:
A novel quinoxaline-based multifunctional probe: Sensitive and selective naked-eye detection of Fe3+ and fluorescent sensing of Cu2+ and its application
⁎Corresponding author. zadeh20@gmail.com (Mohammad Ali Ebrahimzadeh) MA.Ebrahimzadeh@mazums.ac.ir (Mohammad Ali Ebrahimzadeh)
-
Received: ,
Accepted: ,
This article was originally published by Elsevier and was migrated to Scientific Scholar after the change of Publisher.
Peer review under responsibility of King Saud University.
Abstract
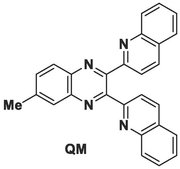
6-Methyl-2,3-di(quinoline-2-yl)quinoxaline (QM) was designed and characterized using different techniques. QM displayed both colorimetric recognition for Fe3+ and fluorescence response for Cu2+. QM showed suitable sensitivity and selectivity towards Fe3+ and Cu2+. QM can be used in real environmental samples for detecting Fe3+ and Cu2+.
Abstract
A new quinoxaline derivative (QM: 6-methyl-2,3-di(quinoline-2-yl)quinoxaline) was synthesized as a colorimetric and fluorescent chemosensor for detecting Fe3+ and Cu2+ ions. QM can selectively detect Fe3+ among a number of essential cations and showed an obvious colorimetric response (colorless to yellow) in the presence of Fe3+ ions and considerable fluorescence quenching response towards Cu2+ ions. The molar ratio and Job plot showed a 1:1 stoichiometric ratio for the QM-Fe3+ and QM-Cu2+ complexes. The binding constants for QM-Fe3+ and QM-Cu2+ were found to be 3.335 × 10⁵ and 2.230 × 10³ M−1, respectively, using the Benesi-Hildebrand method. The quenching rate constant (Ksv) for QM-Cu2+ was 18.8 × 10³ M−1 using the Stern-Volmer plot. The limits of detection and quantification for QM-Fe3+ were calculated as 0.236 and 0.787 µM, respectively, and those for QM-Cu2+ were 0.39 and 1.31 µM, respectively. Therefore, sensor QM can be used to quantify Fe3+ and Cu2+ ions in real samples with good recovery.
Keywords
Quinoxaline derivatives
Naked-eye
Iron ion (III)
Copper ion (II)
Dual detection
1 Introduction
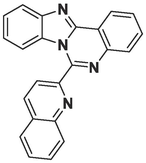
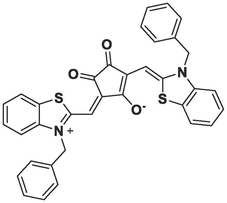
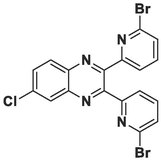
The detection of transition and heavy metal ions has garnered worldwide interest due to the importance of environmental preservation and the well-being of humanity for numerous individuals (Baghayeri et al., 2019a; Baghayeri et al., 2019b; Devaraj et al., 2012; Guo et al., 2019; Liu et al., 2023; Liu et al., 2022; Maleki et al., 2019; Shen and Qian, 2018; Ye, S. et al., 2017). Hence, developing selective and sensitive chemosensors for detecting different metal ions has been a problem over the last decade. Sensors for heavy and transition metal ions are particularly important because of their ecological and biological importance (Chen et al., 2017). Iron, an important metal in cells, is found in numerous enzymes and protein structures, and thus, it is essential for cellular metabolism (Knutson, 2017; Samanta et al., 2016; Zhang, S. et al., 2018). In fact, Iron plays critical roles in “respiration, oxygen transportation, electron transfer, and enzymatic reactions” (Andreini et al., 2018; Beard, 2001; Coffey and Ganz, 2017; Narayanaswamy and Govindaraju, 2012). Iron deficiency is one of the most common mineral deficiencies that can cause anemia. Acceptably high amounts of Iron in the body can be related to the expansion of “hemochromatosis, liver problems, diabetes, and heart failure” (Narayanaswamy and Govindaraju, 2012). World Health Organization (WHO) proposed a standard value of 0.3 mg/l for Iron in drinking water (Bibi et al., 2016; Haldar et al., 2020). The use of iron chelators (Deferasirox, Deferoxamine, and Deferiprone) as a treatment option has garnered the attention of numerous researchers (Zhou et al., 2012). Although Deferasirox has demonstrated efficacy when administered orally, its high cost renders it less accessible to certain populations, while Deferiprone exhibits a lower iron affinity when compared to Deferoxamine or Deferasirox (Dou et al., 2019; Olivieri et al., 2019). The development of affordable and efficient iron-chelating agents that can be easily recognized through visual colorimetry is crucial. In recent years, much research has been performed to design selective and sensitive approaches for determining Fe3+ (Nizar et al., 2020). Nizar et al. synthesized “poly(1-aminonaphthalene)” for sensing Fe3+ using the naked-eye and a fluorometric method (Nizar et al., 2020). In another study, Ye and coworkers prepared “2,5-bis[3-benzyl-2-methylbenzothiazole]-croconaine” as a naked-eye ligand for the recognition of Fe3+ (Ye, S. et al., 2017). Shirzadi et al. prepared a new colorimetric sensor (2– (Quinoline–2–yl)–[1,3]benzimidazole–[1,2–d]quinazoline) for detecting Fe3+ with naked-eye (Shirzadi-Ahodashti et al., 2022). In addition, Hashemi et al. synthesized a novel naked-eye chemosensor 2,3-bis(6-bromopyridine-2-yl)-6-chloroquinoxaline for chelating Fe3+ (Hashemi et al., 2022). Although many divalent metal ion chemical sensors have been found, trivalent metal ion detectors have been reported approximately few (Chen et al., 2017; Nizar et al., 2020).
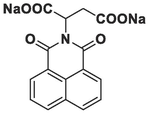
So far, various fluorescent chemosensors have been discovered for detecting Cu2+ (Mohammadi and Ghasemi, 2020; Sam-Ang et al., 2019; Sun et al., 2021; Ye, F. et al., 2017; Zhang et al., 2021). Upon detection of the analyte by the receptor, the fluorescence signal manifests in the form of quenching, enhancement, or a shift in the fluorescence maxima, which can be attributed to “electron transfer, charge transfer, or energy transfer processes” (Sahoo et al., 2012; Zhu et al., 2015). Copper detectors commonly exhibited fluorescence quenching mechanisms because of the paramagnetic properties of Cu2+. Though Cu2+ ions play an important role in different biological actions, excessive amounts of Cu2+ can generate high toxicity (Fang et al., 2018). Cu2+ ions possess the ability to decelerate multiple enzymatic reactions using the displacement of other metal ions and acting as a cofactor (Ahmed et al., 2023). Cu2+ deficiencies can cause Menkes disease, but its excess levels may lead to “Alzheimer or Wilson disease, gastrointestinal disorders, and kidney damage” (Chebrolu et al., 2014; Hou et al., 2017; Pattaweepaiboon et al., 2022). The U.S. Environmental Protection Agency (EPA) proposed a maximum allowable level of 1.3 mg/l (20 µM) for copper in drinking water (Liu and Lu, 2007; Qiu et al., 2019). The WHO has also declared the maximum acceptable concentration of 2.0 mg/l (31.47 µM) for copper in drinking water (Qiu et al., 2019; You et al., 2015). Consequently, it is very important to develop molecular probes with remarkable selectivity and sensitivity for the detection of the mentioned metal ions using the naked-eye method (Chebrolu et al., 2014). A new turn-on Cu2+ fluorescent probe, N-n-butyl-4-(3 pyridin)ylmethylidenehydrazine-1,8-naphthalimide was suggested in a study by 2021 (Sun et al., 2021).
A wide variety of Quinoxaline derivatives have been found to exhibit various biological activities, including “antimicrobial, anti-mycobacterial, antifungal, antiviral, antiprotozoal, antimalarial, anti-inflammatory, anticonvulsant, antidepressant, and anticancer activities” (González and Cerecetto, 2012; Lin et al., 2020; Pereira et al., 2015). Moreover, quinoxalines hold great significance as nitrogenated ligands in coordination chemistry (Dhanaraj et al., 2013; Hashemi et al., 2022).
Genarally, the investigation of novel chemical sensors is of utmost importance for several reasons. First and foremost, it enables the enhancement of sensitivity and selectivity of sensors, thereby facilitating more precise identification of particular substances. This proves crucial in diverse sectors such as environmental monitoring, healthcare, and industrial processes. Secondly, the emergence of new technologies and advancements in materials science frequently give rise to the creation of unique sensor designs, which may provide improved performance, lower detection limits, or other desirable attributes in comparison to existing sensors. Lastly, as new challenges and demands arise in different industries, the development of innovative chemical sensors becomes essential for addressing specific detection needs, staying ahead of emerging threats, and advancing scientific understanding of complex systems (Jalal et al., 2018; McGrath and Scanaill, 2013; Zhuang et al., 2023). Due to the importance of discovering new chemical sensors for different applications, we designed and synthesized a new specific colorimetric sensor (6-methyl-2,3-di(quinoline-2-yl)quinoxaline (QM)) for the determination of Fe3+ ions and a fluorescent turn-off chemosensor for Cu2+ ions. Ligand QM rapidly, selectively, sensitively, and effectively detected and responded to the presence of these specific metal ions (Fe3+ and Cu2+) over other tested cations, especially for Fe3+ with naked-eye. Furthermore, sensor QM can be effectively utilized to recognize Fe3+ and Cu2+ in real samples, which can be helpful in various applications, including environmental monitoring and biomedical diagnostics (Scheme 1).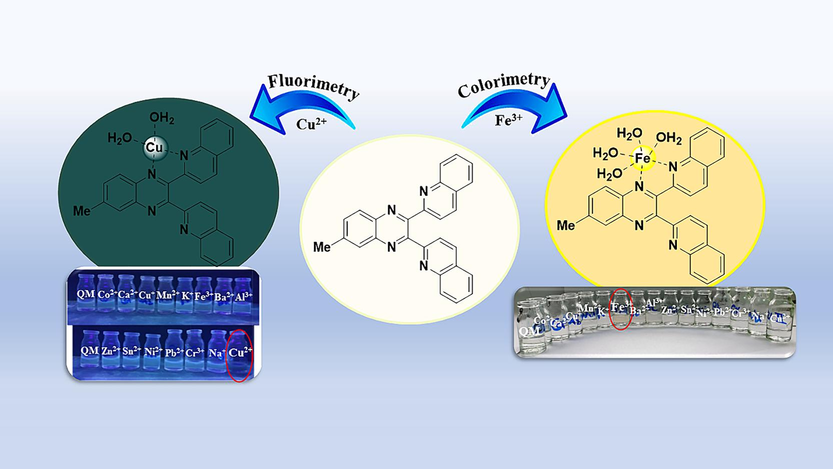
The action mechanism of QM as a colorimetric and fluorescent chemosensor for detecting Fe3+ and Cu2+ ions.
2 Experimental
2.1 Materials and methods
All inorganic salts and other reagents used to synthesize ligand QM (6-methyl-2,3-di(quinoline-2-yl)quinoxaline) were provided by “Sigma Aldrich Chemical Co. (St. Louis, MO, USA)”. Sodium cyanide, Quinoline-2-carbaldehyde, 4-methylbenzene-1,2-diamine, and all solvents, including ethanol, acetonitrile, and methanol, were of analytical grade. The metal salts NaCl, BaCl2·2H2O, AlCl3·6H2O, CrCl3·6H2O, SnCl2, CaCl2, KCl, CuCl, CuCl2·2H2O, NiCl2·6H2O, CoCl2·6H2O, Pb(AcOH)2, MnCl2·H2O, FeCl3·6H2O, and Zn(NO3)2·6H2O were used in water solution state to prepare metal ion solutions. The QM ligand was dissolved in methanol at room temperature to prepare a stock solution (2 mM).
Fourier transform infrared spectroscopy (FT-IR) was conducted using the KBr pellet technique on Perkin Elmer Spectrum One, USA, within the 4000–400 cm−1 region. 1H NMR and 13C NMR spectra were determined using an “NMR, Bruker, Avance III 300 MHz, (Amherst, Massachusetts, USA)”, with DMSOd6 as the solvent and TMS as the internal standard.
Mass spectra (MS) were obtained from Agilent 5975, USA. UV–Vis absorption spectra were obtained using “T80+, UV/Vis, PG Instruments, Leicestershire, UK, Spectrophotometer” at room temperature. Fluorescence analyses were performed by JASCO FP-6200 spectrofluorometer, Japan, with a scan rate of 30000 nm/min at room temperature.
2.2 General procedures for spectral determination
Stock solutions containing different salts (Na+, Ba2+, Al3+, Cr3+, Sn2+, Ca2+, K+, Cu+, Cu2+, Ni2+, Co2+, Pb2+, Mn2+, Fe3+, and Zn2+) were prepared at 500 µM. In addition, the stock solution (2.0 mM) of ligand QM was prepared by dissolving it in methanol, which was subsequently diluted to generate the analytical solutions. The pH range of the solutions was provided using HCl (2 mM) or NaOH (2 mM), and the titration process was performed at ambient temperature. Fluorescence experiments were conducted with excitation and emission slit widths of 10 nm with an excitation wavelength of 400 nm.
2.3 Synthesis of 6-methyl-2,3-di(quinoline-2-yl)quinoxaline (QM)
Benzoin condensation is considered to be a prevalent reaction of aromatic aldehydes. Firstly, one mmol of Quinoline-2-carbaldehyde dissolved in ethanol was reacted with 0.25 mmol of sodium cyanide as a catalyst to synthesize α-hydroxyl ketone (Q1). For the oxidation process, 2.2 mmol KOAc was added to 1 mmol α-hydroxy ketone (Q1) and stirred for 2 hr; then, one mmol iodine was mixed with the mixture and stirred for 24 hr to produce the related diketone (1,2-di(quinoline-2-yl)ethane-1,2-dione) (Q2). After finishing the reaction, 5 % sodium thiosulfate aqueous solution was added to the mixture and filtered. The precipitate was washed with water. Then, to produce 6-methyl-2,3-di(quinoline-2-yl)quinoxaline (QM), 1 mmol 1,2-di(quinoline-2-yl)ethane-1,2-dione (Q2) and 1.1 mmol 4-methylbenzene-1,2-diamine were mixed with 0.2 mmol iodine in the acetonitrile solvent. The process was monitored by TLC (Scheme 2). Finally, the reaction mixture was stirred with 5 % sodium thiosulfate aqueous solution for 10–15 min. After that, the separated solid was filtered and washed with water (Hashemi et al., 2022). The ligand (QM) synthesis was carried out by a process described in Scheme 2 and was carefully characterized by 1H NMR, 13C NMR, IR, and Mass spectroscopy. The observed data matched the predicted chemical structure.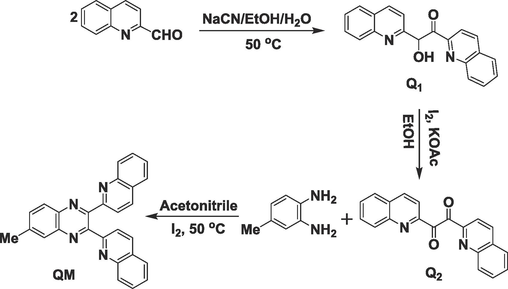
The synthesis of probe 1 (QM).
Q1: 2-Hydroxy-1,2-di(quinoline-2-yl)ethan-1-one
[C20H14N2O2], Yield: 80 %, Mp: 235–237 °C, IR, cm−1: 1597 (C = N), 3062 (C–H, quinoline cycle) (Fig. 1a) (Hashemi et al., 2022).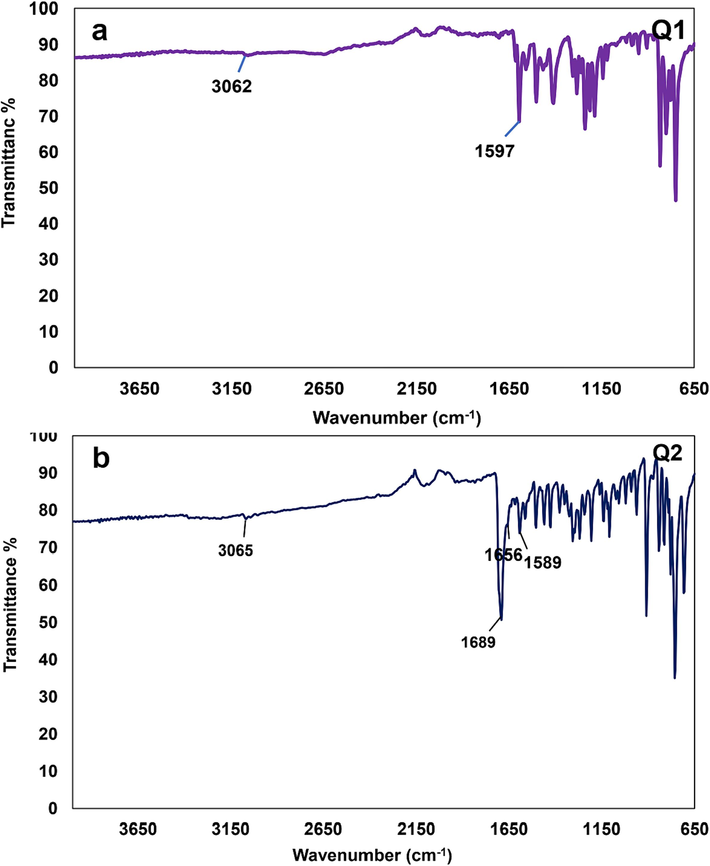
The IR spectra of a) compound Q1 and b) compound Q2.
Q2: 1,2-Di(quinoline-2-yl)ethane-1,2-dione
[C20H12N2O2], Yield: 96 %, Mp: 269–273 °C, IR, cm−1: 1589 (C = N), 1656–1689 (C = O), 3065 (C–H, quinoline cycle) (Fig. 1b) (Hashemi et al., 2022). [M]+: 312; found: 312 (Fig. 2a).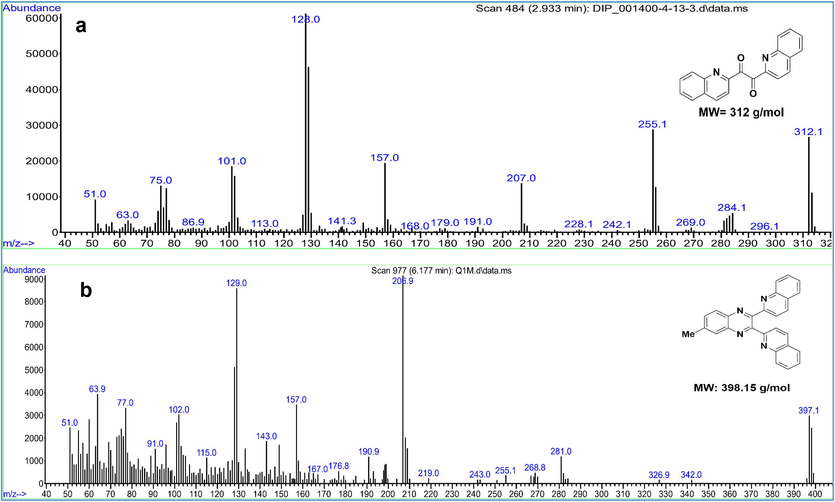
The MS spectra of a) compound Q2 and b) compound QM.
QM: 6-methyl-2,3-di(quinoline-2-yl)quinoxaline
[C27H18N4], Yield: 76 %, Mp: 189–192 °C; [M]+: 398.15, found: 398.1 (Fig. 2b); IR, cm−1: 1504 (C = N), 1575 (C = N), 3049 (C–H, quinoline cycle), (Fig. 3).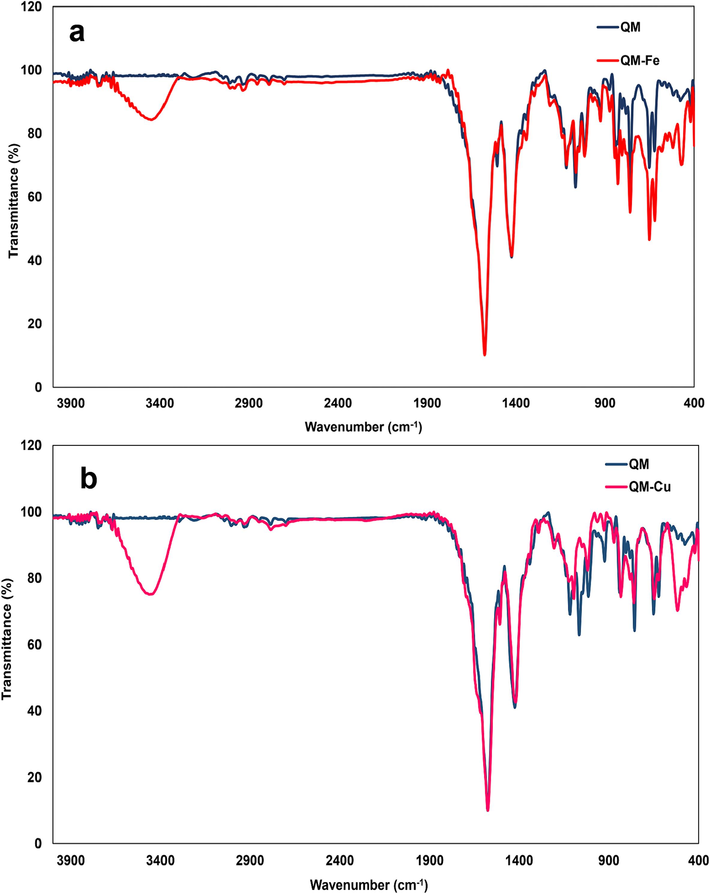
The IR spectra of a) ligand QM and complex QM-Fe3+, b) ligand QM and complex QM-Cu2+.
1H NMR (DMSO, 300 MHz), ppm: 8.529–8.501 (2H, J = 8.4, d), 8.217–8.189 (2H, J = 8.4, d), 8.097 (1H, S), 8.014–7.986 (2H, m), 7.872–7.843 (1H, J = 8.7, d), 7.594–7.542 (5H, m), 7.362–7.343 (2H, m), 2.661 (3H, S) (Fig. 4a); 13C NMR (DMSO, 300 MHz), ppm: 21.933, 120.859, 122.052, 127.361, 127.390, 127.427, 127.454, 128.298, 128.888, 128.900, 129.118, 130.165, 134.012, 136.899, 139.307, 140.895, 142.228, 146.798, 151.963, 152.725, 157.415, 157.455 (Fig. 4b).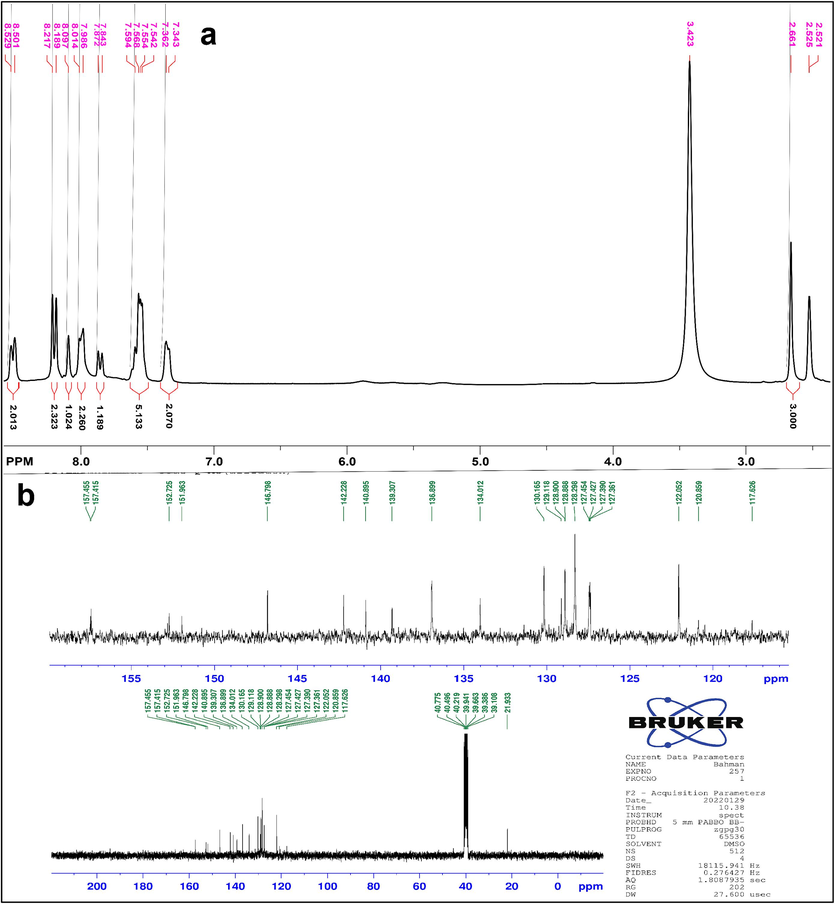
a) The 1HNMR and b) 13CNMR for compound QM.
3 Results and discussions
3.1 Synthesis and characterization
The new sensor QM was prepared using the steps described in Scheme 2, and the results obtained from IR, 1H NMR, 13C NMR, and MS were successfully consistent with the predicted chemical structure.
3.2 UV–vis spectroscopic studies of QM
3.2.1 Selectivity studies
Metal ion detection tests were performed by the addition of 1 ml (500 µM) solution of cations (Na+, Ba2+, Al3+, Cr3+, Sn2+, Ca2+, K+, Cu+, Cu2+, Ni2+, Co2+, Pb2+, Mn2+, Fe3+, and Zn2+) to 1 ml of the newly synthesized QM solution (20 µM) in 1.0 cm path length quartz cuvettes. The fabricated solutions were shaken for about 5 min to ensure complete coordination of QM with the metal ions. The UV–Vis absorption spectral changes of ligand (QM) were investigated towards the selected cations. Fig. 5 showed that free sensor QM (20 μM) in methanol displayed three absorption peaks at 230, 260, and 345 nm. The detection of Fe3+ ion was conducted at the original pH of the solution (about 6) after introducing Fe3+ ions, and the absorption peaks were enhanced with an apparent color alteration from colorless to yellow with the naked-eye, showing the complex formation (QM-Fe3+) in the solution. No noticeable variations in QM absorption were detected upon encountering other metal ions under examination. Therefore, QM can be successfully used for the colorimetric recognition of Fe3+ with a higher selectivity than other cations. The charge transfer between QM and Fe3+ ions after binding Fe3+ ions to QM could be the cause of the yellow color. The presence of nitrogen atom (donor) within QM can lead to great selectivity and sensitivity towards Fe3+ cation, which makes it tightly bound to iron. This can be seen in the porphyrin ring of proteins that contain heme. It was discovered that the size, charge, and electron configuration of ligands and metal ions are crucial to their binding capacity; therefore, these parameters in QM and Fe3+ are appropriate for complex production. Moreover, QM indicated a stronger binding affinity to Fe3+ ions compared with other tested metal ions. As a result, ligand QM can be considered a selective sensor for Fe3+ ions with the naked-eye (Hashemi et al., 2022).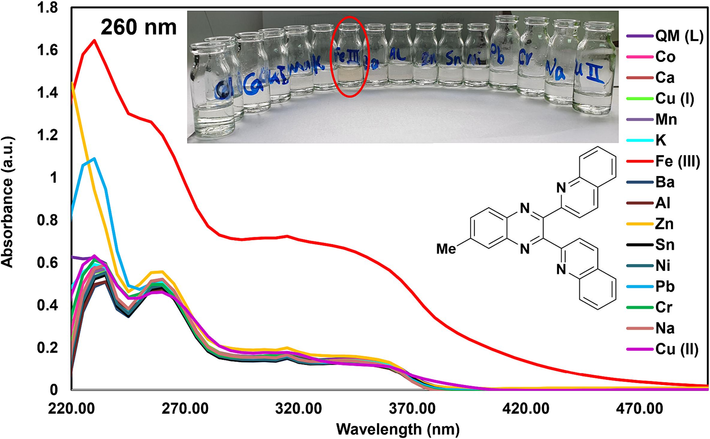
UV–Vis absorption spectra of QM after adding various cations (Selectivity test) and color change of QM solution after adding the cations (naked-eye).
3.2.2 Stoichiometric ratio of complex QM-Fe3+
Spectral absorption variations with concentration were examined by titrating 2 ml of 5 µM QM with 15–285 µl of Fe3+ solution (50 µM). Changes in absorbance at 260 nm were recorded from the titration of QM solution with Fe3+ at their natural pH, and a plot of the cation (Fe3+) to ligand QM versus absorbance exhibited (Fig. 6a) that the reaction of ligand QM with Fe3+ was performed by a 1:1 stoichiometry (Fig. 6b). It was proved by Job plot of the absorption spectra (Fig. 6c). Creating an isosbestic point at 220 nm proved the formation of a stable complex from interacting QM with Fe3+ ions. The absorption increased with the addition of Fe3+ to the QM solution. At the maximum absorption (about 285 μl of Fe3+), a saturated form was obtained, indicating that the reaction was complete.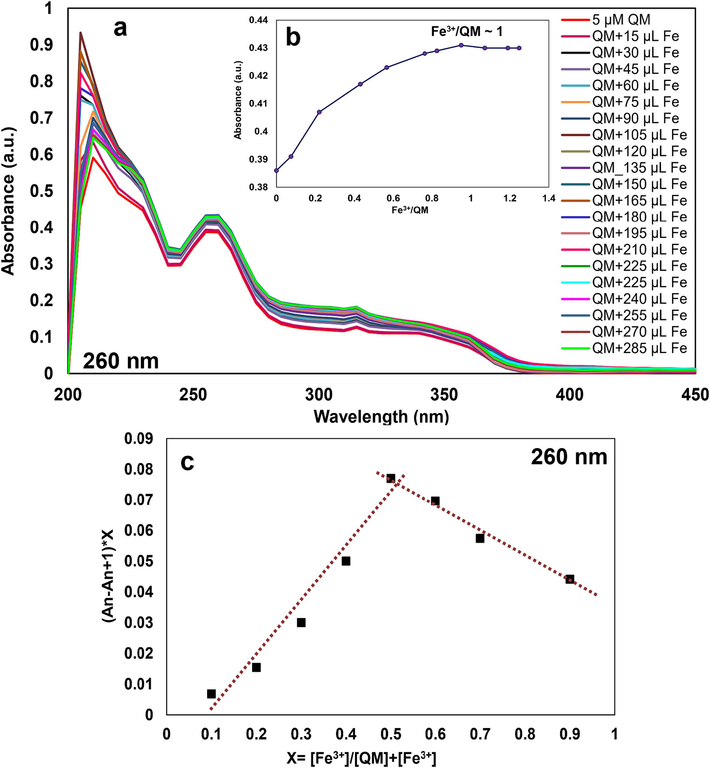
a) UV–Vis spectra of QM upon adding Fe3+ (15–285 µl, 50 µM), b) Molar ratio plot, and c) Job plot for QM-Fe3+, for determination of the stoichiometric ratio of the complex.
In addition, Job plot analyses were connected to investigate the stoichiometric ratio between ligand QM and Fe3+. Job design studies were performed for QM-Fe3+ (25 µM) by keeping the constant total volume of 2 ml and varying the mole fraction of reactants from 0 to 0.9. The maximum absorption at 260 nm was observed at the attained mole fraction of 0.5 for Fe3+ ions; consequently, the Job plot showed a 1:1 stoichiometric ratio of QM-Fe3+ complex, as depicted in Fig. 6c. In addition, a good linear response (0.9967) was obtained for Fe3+ concentrations in the range of 1–10 µM with a detection limit and quantification limit of 0.236 and 0.787 µM, respectively.
The binding constant (Ka) of QM-Fe3+ complex was estimated using the Benesi-Hildebrand plot, which was carried out by measuring the absorbance variations of consequent titration (1/A-A0) against 1/[Fe3+]. The value of Ka was determined by analyzing the slope and intercept of a linear equation, resulting in an estimated value of 3.335 × 10⁵ M−1 QM-Fe3+ (Fig. 7) (Hashemi et al., 2022).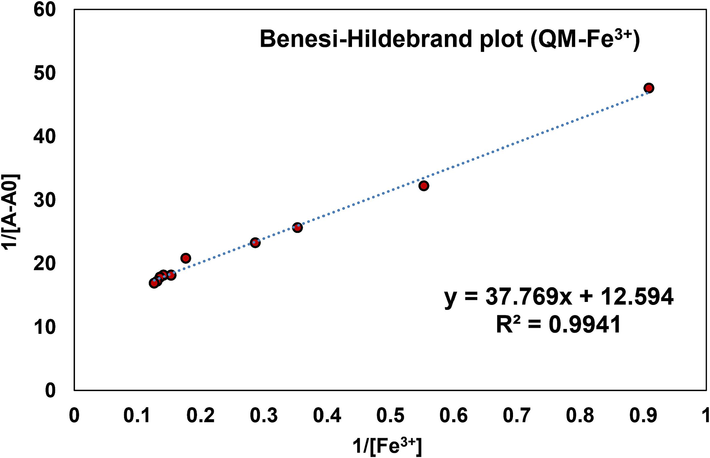
Benesi-Hildebrand plot for the determination of binding constant of QM-Fe3+.
The suggested structure of QM-Fe3+ complex is shown in Fig. 8; Fe3+ is coordinated to the nitrogen atoms of quinoline or quinoxaline in ligand QM. FT-IR analyses of QM and QM-Fe3+ complex were conducted to investigate more about the binding between QM and Fe3+. A noticeable rise at 467 cm−1 in the FT-IR spectrum of Fe3+-QM is related to the N-Fe stretching vibration, proving the formation of Fe3+-QM complex. In addition, a broad band appeared in the QM/Fe3+ complex at 3444 cm−1, which represents the formation of Fe3+–H2O complex (Fig. 3a).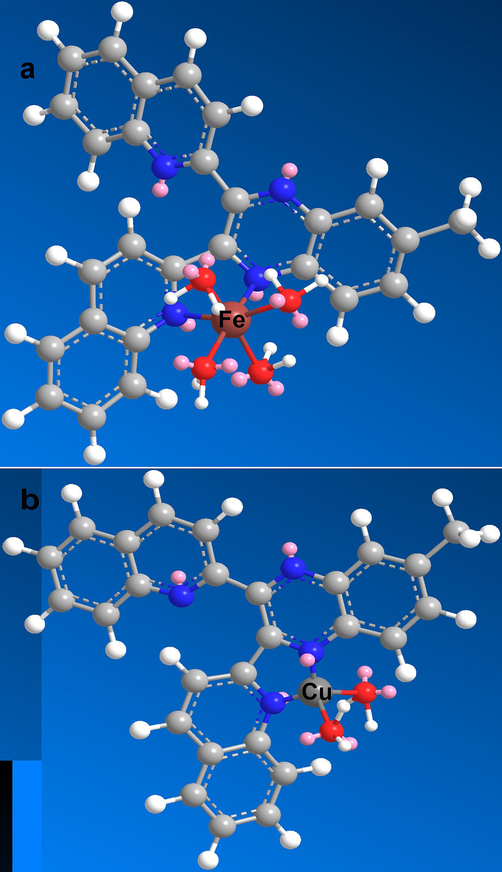
The suggested structures of a) complex QM-Fe3+, b) complex QM-Cu2+.
3.2.3 Competitive studies of QM for sensing Fe3+
The effect of interfering ions on QM-Fe3+ complex solution (1 ml of 10 µM QM and 1 ml of 10 µM Fe3+) was investigated by adding a 10-fold higher concentration (1 ml of 100 µM) of selected interfering ions (Na+, Ba2+, Al3+, Cr3+, Sn2+, Ca2+, K+, Cu+, Cu2+, Ni2+, Co2+, Pb2+, Mn2+, and Zn2+) into the QM-Fe3+ complex solution. Considering the similar adsorption patterns of the complex in the presence of interfering metal ions (Fig. 9a), introducing these cations into the complex solution could not interfere with the interaction of Fe3+ with QM.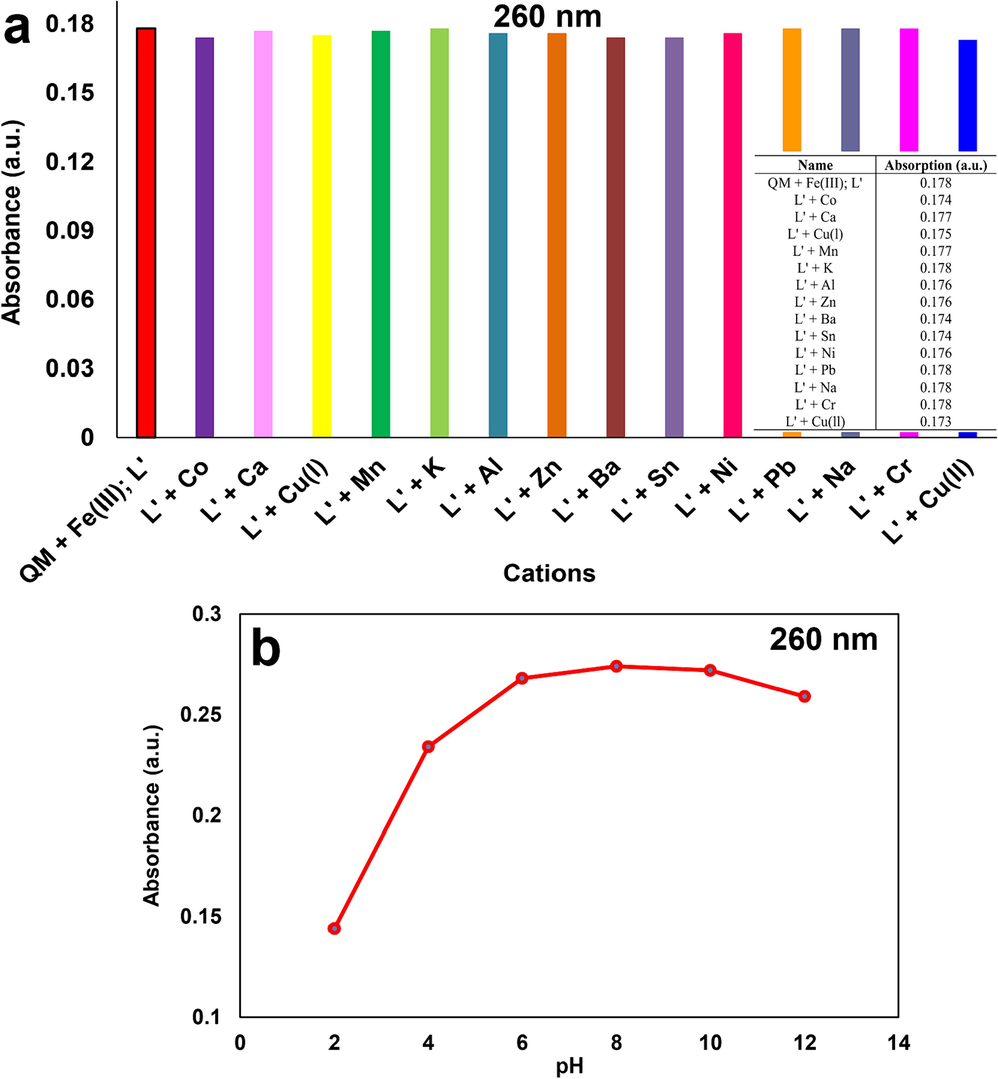
a) The effect of adding different interfering cations on UV–Vis absorption of QM-Fe3+ (Competitive test) and b) the effect of pH on UV–Vis absorption of QM-Fe3+.
3.2.4 Effect of pH on complex QM-Fe3+
The impact of pH changes on the sensing ability of QM was investigated by preparing ranges of pH (2 up to 12) by adding an appropriate amount of NaOH and HCl solutions to ferric chloride (FeCl3) solution. This way, 1 ml of QM (10 µM) was mixed with 1 ml of FeCl3 solution (10 µM) at various adjusted pHs to evaluate the effect of pH variation on binding efficiency. As shown in Fig. 9b, the maximum sensitivity of QM towards Fe3+ was found at pH 6 to 10, and the absorption decreased dramatically before pH = 6, which was under acidic pH conditions. As mentioned, the absorption band of the chemosensor (QM) was reduced at some pH values, which can be related to the protonation of the free electron pairs of quinoline or quinoxaline in the QM structure under acidic conditions, and the production of Fe(OH)3 under highly basic conditions. The pH studies revealed that QM could be suitable for biological applications due to its stability at physiological pH (7.4).
3.2.5 Determination of Fe3+ in real water samples using QM
To further assess the possible use of QM in detecting Fe3+, actual water samples (tap water) were gathered for testing purposes, then a known Fe3+ concentration was added to tap water. Subsequently, the sample was passed through a 0.22 μm membrane and examined through a UV–Vis spectrophotometer. Table 1 presented the recovery percentages of Fe3+ using the probe QM in tap water; they were in the range of 99.07–103.63 %. The relative errors were less than 4.33 %, which indicated the detection of Fe3+ in practical water samples can be met. The requirements were satisfied. Therefore, QM could be a sensitive sensor for monitoring Fe3+ ions in environmental samples.
Sample
Added Fe3+ (µM)
Found Fe3+ (µM)
Recovery %
Tape water
3
2.97 ± 0.16
99.07 ± 4.33
9
9.32 ± 0.32
103.63 ± 2.89
3.3 Fluorescence spectroscopic studies of QM
3.3.1 Selectivity test
Fluorescence spectroscopy was also used for the sensing phenomena of ligand QM in λex: 400 nm, λem: 500 nm. Fluorescence emission spectra of the ligand QM were captured in the presence of different cations at room temperature. No detectable changes were indicated by the fluorescence intensity when 1 ml of each cation (500 µM) was added to 1 ml of QM (200 µM), except for Cu2+ ions that appeared a significantly quench in the intensity of QM (Fig. 10). It can be predicted that the paramagnetic properties of Cu2+ ions can turn off the excited state emission of ligand QM.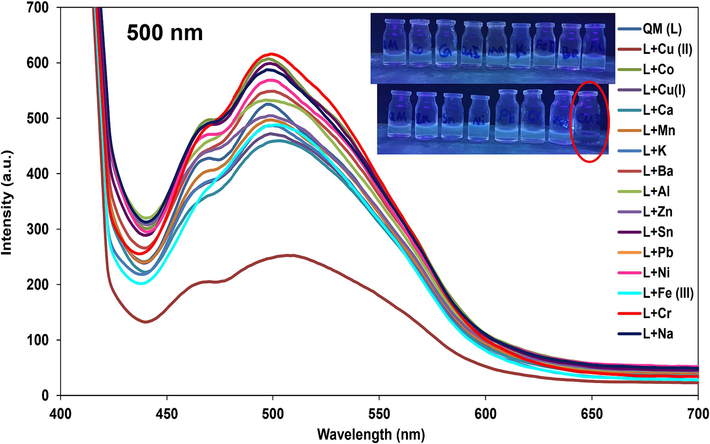
Fluorescence spectra of QM in the addition of different cations (Selectivity test) and color alteration of QM-Cu2+ in 500 nm fluorescence emission.
3.3.2 Stoichiometric ratio of the complex QM-Cu2+
To determine the stoichiometric ratio of QM-Cu2+ (molar ratio), 2 ml of 100 µM QM was titrated with 15–1100 µl of Cu(II) (500 µM) at pH 6 with fluorescence at λex: 400 nm, λem: 500 nm. Fig. 11a displayed that QM fluorescence intensity progressively decreased upon the addition of Cu2+ at 500 nm. The correlation between Cu2+ concentration and QM intensity at 500 nm was depicted in Fig. 11b. In addition, 2 ml of 5 µM QM was titrated with 15–330 µl of Cu2+ (50 µM) at pH 6 at 370 nm using UV–Vis spectroscopy to prove the obtained stoichiometric ratio (Fig. 11c). The absorbance of QM at 370 nm gradually increased with increasing the amount of Cu2+. Therefore, a 1:1 chelating mode formed between QM and Cu2+.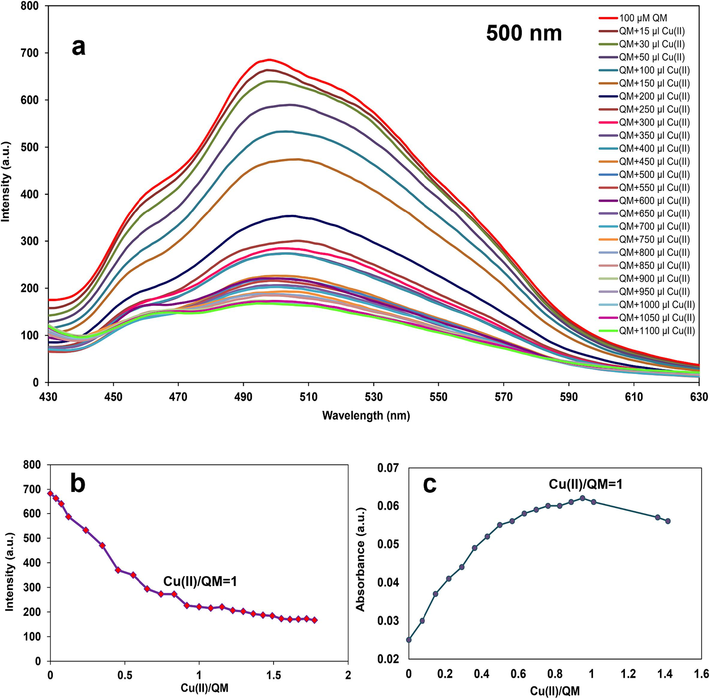
a) Fluorescence spectra of QM upon adding Cu2+ (15–1100 µl, 500 µM), b) Molar ratio plot as in fluorescence, and c) Molar ratio plot in UV–Vis for determination of stoichiometric ratio of the complex.
Besides, Job plot analysis was conducted using 100 µM of reactants to assess the binding stereochemistry of QM and Cu2+ ions. The maximum intensity was gained at 500 nm for QM-Cu2+ when the mole fraction of Cu2+ ion accomplished about 0.5, which exhibited a 1:1 stoichiometric ratio between ligand QM and Cu2+ (Fig. 12a). As a result, ligand QM can be employed as a dual colorimetric and fluorescence sensor for the recognition of Fe3+ and Cu2+, respectively.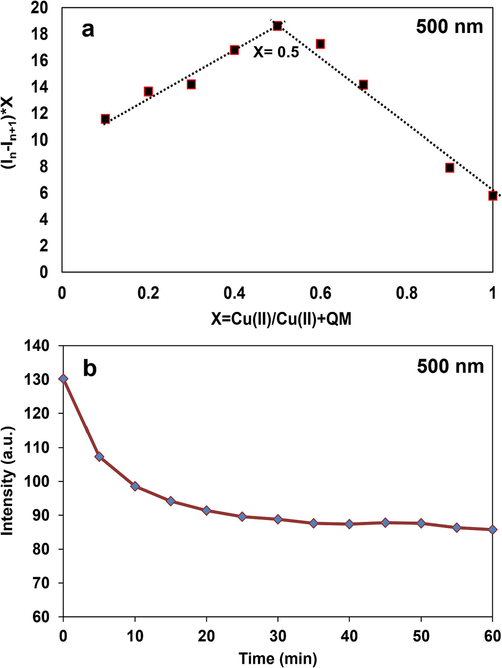
a) Job plot for the determination of stoichiometric ratio and b) the effect of time on fluorescence intensity of QM-Cu2+.
The coordination of Cu2+ with ligand QM was performed through the nitrogen atoms within quinoline or quinoxaline from QM; Fig. 8 showed the proposed structure of QM-Cu2+. The FT-IR spectrum of QM and QM-Cu2+ complex proved the formation of Cu2+-QM complex using a noticeable growth in the peak at 517 cm−1 in FT-IR of Cu2+-QM that corresponded to the N-Cu stretching vibration (Fig. 3b).
3.3.3 Study on the response time of sensor QM to Cu2+
Considering the importance of detecting the response time of the analyte, the fluorescence intensity of complex QM-Cu2+ reached equilibrium after the addition of Cu2+ in about 20 min (Fig. 12b). In fact, the maximum amount of the complex was produced after 20 min of mixing QM and Cu2+ ions and no change in the amount of the complex was observed after that.
Based on the fluorescence titration results, a calibration curve with an appropriate correlation coefficient of 0.9995 was obtained by graphing QM intensity at 500 nm versus Cu2+ concentration (up to 65.2 µM); the limit of detection (LOD) and limit of quantification (LOQ) for Cu2+ were determined to be 0.395 and 1.316 µM, respectively. Hence, the ligand QM can be considered as a quantitative sensor for detecting Cu2+ ions in actual specimens with diminished concentrations.
A Stern-Volmer graph was plotted using the equation, I0/I = Ksv [Quencher] + 1 to estimate the quenching rate constant for QM-Cu2+, Ksv, (Fig. 13). I0 and I are considered as the fluorescence intensities of QM in the absence or presence of Cu2+ at 500 nm, respectively (Nizar et al., 2020). The Ksv value for QM-Cu2+ was calculated to be 1.88 × 10⁴ M−1.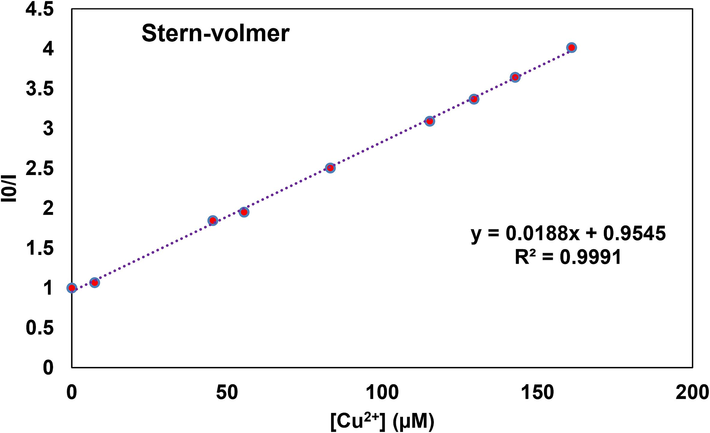
Stern Volmer plot for the determination of quenching rate constant of QM-Cu2+.
In addition, a Benesi-Hildebrand plot was used to estimate the binding constant (Ka) of QM-Cu2+, which was performed by intensity changes of the consequent titration (1/I0-I) against 1/[Cu2+]. The Ka value was calculated to be 2.230 × 10³ M−1 for QM-Cu2+ (Fig. 14).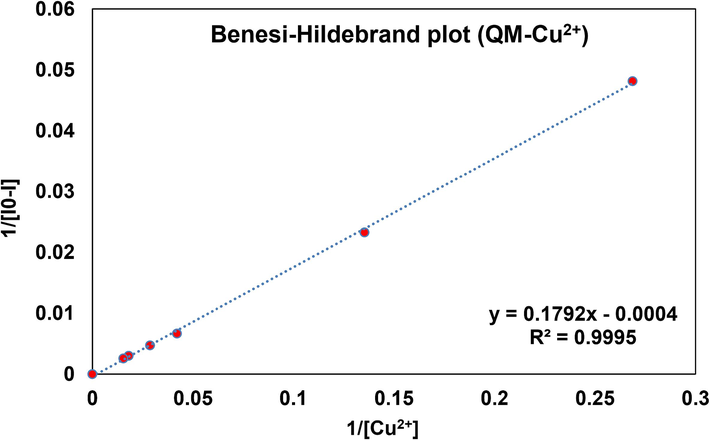
Benesi-Hildebrand plot for the determination of binding constant of QM-Cu2+.
3.3.4 Comparative studies of QM for sensing Cu2+
To evaluate the utility of QM for detecting Cu2+ ions in fluorescence spectroscopy, some experiments were performed with 1 ml of 100 µM QM, 1 ml of 100 µM Cu(II), 1 ml of 500 µM other cations. Fig. 15a showed the fluorescence response of QM-Cu2+ when other interfering metal ions were present in the mixture. Almost similar fluorescence variations were observed for the complex QM-Cu2+ in the presence of other tested metal ions.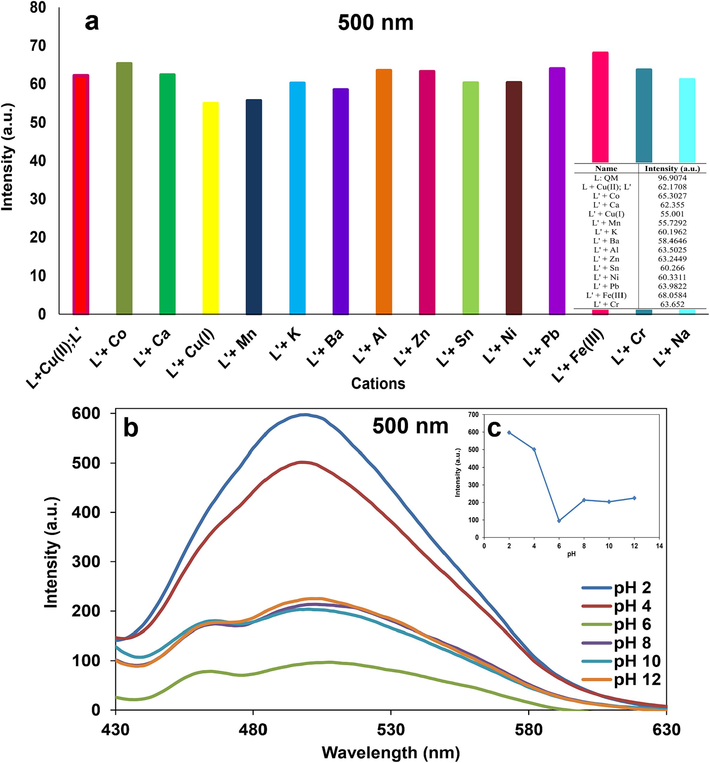
a) The effect of adding different interfering cations on fluorescence intensity of QM-Cu2+ (Competitive test) and b) the effect of pH on fluorescence intensity of QM-Cu2+.
3.3.5 Effect of pH on sensor QM-Cu2+
The effect of pH value was also evaluated in the fluorescence response of QM-Cu2+, 1 ml of 100 µM QM was added to 1 ml of 100 µM CuCl2 at various pH values. The fluorescence intensity of QM at 500 nm increased as the pH value altered from 6 to 2 and 4 (under acidic conditions, Fig. 15b). Besides, along with raising the pH value from 6 to 8, 10, and 12 (under basic conditions), the intensity increased at 500 nm. The peak intensity increased much more under acidic conditions than in basic conditions, and the copper complex showed the highest stability at pH = 6. The increase in the fluorescence intensity indicates a decrease in the formation of QM-Cu2+ complex because the electron pair of nitrogen (quinoline or quinoxaline) is protonated under acidic conditions and prevents the formation of the complex. Under basic conditions, the formation of Cu(OH)2 prevents the formation of the copper complex. Therefore, QM exhibited a significant pH-dependent feature in the fluorescence spectra.
3.3.6 Determination of Cu2+ in real water samples using QM
The fluorescence response of the known added Cu2+ in actual water samples (tap water) was recorded after 15 min for subsequent calculations, and the results are shown in Table 2. The recovery percentages of Cu2+ using QM were in the range of 98.67–101.43 % for tap water, with a relative standard deviation lower than 3.67 %. The results attained from the authentic specimens were deemed satisfactory, exhibiting a significant recovery percentage. Hence, the suggested approach is deemed to be highly responsive and suitable for identifying Cu2+ in authentic specimens.
Sample
Added Cu2+ (µM)
Found Cu2+ (µM)
Recovery %
Tape water
3
2.96 ± 0.13
98.67 ± 3.67
9
9.13 ± 0.26
101.43 ± 2.35
4 Comparing QM with previous literature
In this research, a new quinoxaline-based derivative was designed and synthesized, which can be utilized as a colorimetric and fluorescent chemosensor for recognizing Fe3+ and Cu2+ ions. The comparative study of the dual sensor QM with previously reported sensors is presented in Table 3. Comparing the results of the studies showed that there are various sensors for detecting Fe3+ or Cu2+ that acted as colorimetric, fluorescent ‘off-on’, or both colorimetric and fluorescent; most reported sensors exhibited colorimetric or fluorescence ‘off-on’ behavior against Fe3+ or Cu2+ ions, and a few dual sensors have been reported both colorimetric sensors for Fe3+ and ‘off-on’ fluorescence sensors for Cu2+, this proved the higher performance of the sensor QM compared to recently reported sensors.
Sensors
Target Ion
Stoichiometry
Tested ions
Operation style
Application
References
Fe3+
2L:1Fe3+
Ca2+, K+, Ba2+, Na+, Cu+, Co2+, Pb2+, Fe3+, Cd2+, Cr3+, Mn2+, Al3+, Zn2+, Ni2+, Cu2+, Fe2+, Sn2+
Colorimetric
Urine samples
(Shirzadi-Ahodashti et al., 2022)

Fe+3
1L:1Fe3+
Al3+, Zn2+, Cu2+, Ni2+, Mn2+, Ba2+, Fe3+, Fe2+, Pb2+, K+, Na+, Co2+, Hg2+, Mg2+
Colorimetric
Real environmental samples
(Alorabi, 2022)
Fe3+
1L:1Fe3+
Hg2+, Ag+, Ca2+, Cu2+, Co2+, Ni2+, Cd2+, Pb2+, Zn2+, Cr3+, Mg2+
Fluorescence (turn-off)
NR
(Zhang, Y.-M. et al., 2018)
Fe3+
1L:1Fe3+
Ni2+, Mg2+, Cu2+, Ca2+, Na+, K+, Cr3+, Ag+, Ba2+, Zn2+, Pb2+, Al3+, Fe3+, Cd2+, Co2+
Colorimetric, Fluorescence (turn-off)
NR
(Ye, S. et al., 2017)
Fe3+
1L:1Fe3+
Zn2+, Sr2+, Ni2+, Na+, Mn2+, Fe3+, Fe2+, Cu+, Cu2+, Cr3+, Co2+, Cd2+, Ca2+, Al3+, Ag+
Colorimetric
In vivo Iron chelating activity
(Hashemi et al., 2022)

Fe+3
1L:1Fe3+
Al3+, Co2+, Cr3+, Cu2+, Ni2+, Pb2+, Sn4+, Zn2+
Colorimetric, Fluorescence (turn-off)
Water samples
(Nizar et al., 2020)
Fe+3
2L:1Fe3+
Mg2+, Ca2+, Mn2+, Fe2+, Fe3+, Co2+, Ni2+, Cu2+, Zn2+, Cd2+, Hg2+
Colorimetric
NR
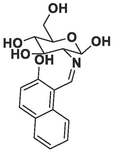
(Mitra et al., 2009)
Fe+3
1L:1Fe3+
Na+, K+, Ca2+, Co2+, Ni2+, Cu2+, Zn2+, Fe3+, Pb2+, Ag+, Cd2+, Hg2+, Al3+, Cr3+, Fe2+
Colorimetric, Fluorescence (turn-on)
Water samples
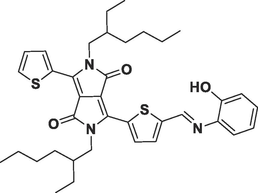
(Zhang, S. et al., 2018)

Fe+3
2L:1Fe3+
Na+, K+, Ba2+, Mg2+, Al3+, Cr3+, Co2+, Ni2+, Cu2+, Zn2+, Cd2+, Pb2+, Ag+
Fluorescence (turn-on)
NR
(Faizi et al., 2016)

Fe+3
1L:1Fe3+
Al3+, Co2+, Ni2+, Hg2+, Pb2+, Zn2+, Mg2+, Ca2+, Li+, Na+, Fe2+, Fe3+
Fluorescence (turn-off)
Water and pharmaceutical samples
(Sayed et al., 2021)
Fe+3
1L:2Fe3+
Ag+, Al3+, Ca2+, Cd2+, Co2+, Cr3+, Fe2+, K+, Na+, Ni2+, Pb2+, Hg2+, Mg2+, Ba2+, Sr2+, Zn2+, Cu2+
Colorimetric, Fluorescence (turn-on)
Real water and food samples
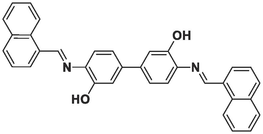
(Zuo et al., 2019)
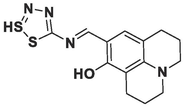
Cu+2
2L:1Cu+2
Na+, K+, Mg2+, Ca2+, Al3+, Ga3+, In3+, Cr3+, Mn2+, Fe2+, Fe3+, Co2+, Ni2+, Zn2+, Cd2+, Pb2+
Colorimetric
Water samples
(You et al., 2015)
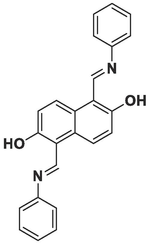
Cu+2
1L:2Cu+2
Cd2+, Cu2+, K+, Pb2+, Li+, Fe3+, Mg2+, Co2+, Cr3+, Al3+, Ba2+, Ni2+, Zn2+, Ag+, Na+, Hg+
Fluorescence “turn-off”
Water samples
(Zhang et al., 2021)
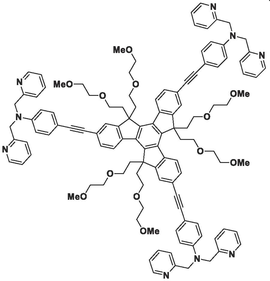
Cu+2
1L:1Cu+2
K+, Na+, Li+, Ba2+, Mg2+, Ca2+, Cu2+, Ni2+, Zn2+, Al3+, Hg2+, Fe3+, Fe2+, Co2+, Cr3+, Cd2+, Pb2+
Fluorescence “turn-off”
NR
(Sam-Ang et al., 2019)

Cu+2
2L:1Cu+2
Na+, K+, Cu+, Ag+, Cu2+, Mg2+, Ni2+, Zn2+, Sn2+, Mn2+, Ca2+, Hg2+, Pb2+, Ba2+, Co2+, Pb2+, Fe2+, Al3+, Cr3+
Fluorescence “turn-off”
Water samples
(Sun et al., 2021)
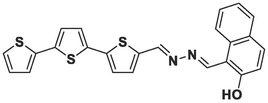
Cu+2
1L:1Cu+2
Ag+, Al3+, Ca2+, Cd2+, Co2+, Cr3+, Fe2+, K+, Na+, Ni2+, Pb2+, Fe3+, Hg2+, Mg2+, Ba2+, Sr2+, Zn2+, Cu2+
Colorimetric, Fluorescence (turn-off)
Real water and food samples
(Guo et al., 2019)
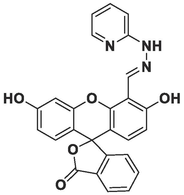
Cu+2, Al3+
1L:2Cu+2, 1L:1Al3+
K+, Na+, Ag+, Pb2+, Cd2+, Mg2+, Cu2+, Co2+, Zn2+, Ni2+, Hg2+, Ca2+, Ba2+, Mn2+, Fe2+, Fe3+, Cr3+, Al3+, In3+
Colorimetric, Fluorescence
Bioimaging
(Hou et al., 2017)
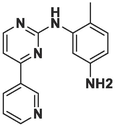
Cu+2
1L:1Cu+2
Ag+, Al3+, Ba2+, Ca2+, Cd2+, Co2+, Cr3+, Fe2+, Hg2+, Li+, Mg2+, Mn2+, Ni2+, Fe3+, Pb2+, Zn2+, Cu2+, Zr2+
Colorimetric
NR
(Patil et al., 2014)
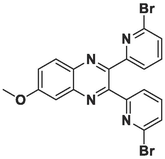
Fe+3, Cu2+
1L:1Fe+3, 1L:1Cu2+
Ca2+, Na+, Co2+, Ag+, Fe3+, Cd2+, Cr3+, Mn2+, Fe2+, Al3+, Zn2+, Ni2+, Cu2+, Sr2+,
Colorimetric, Fluorescence (turn-off)
Water samples
(Ebrahimzadeh et al., 2023)
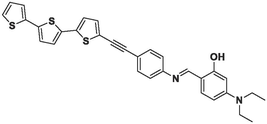
Fe+3, Cu2+
1L:1Fe3+
Na+, K+, Ca2+, Co2+, Ni2+, Zn2+, Pb2+, Ag+, Cd2+, Hg2+, Ba2+, Sr2+, Mg2+, Al3+, Cr3+, Fe2+
Colorimetric, Fluorescence
Filter paper-based test strips
(Wang et al., 2019)
Rhodamine-based Schiff base
Fe+3, Cu2+
1L:1Fe+3, 1L:1Cu2+
Ca2+, Cr2+, Fe3+, Co2+, Ni2+, Cu2+, Cd2+, Sr2+, Hg2+, Pb2+
Colorimetric
NR
(Mulimani et al., 2024)
Fe+3, Cu2+
1L:1Fe+3, 1L:1Cu2+
Na+, Ba2+, Al3+, Cr3+, Sn2+, Ca2+, K+, Cu+, Cu2+, Ni2+, Co2+, Pb2+, Mn2+, Fe3+, Zn2+
Colorimetric, Fluorescence (turn-off)
Water samples
Present work
5 Conclusion
This study designed a quinoxaline-based colorimetric sensor with great selectivity and sensitivity for recognizing Fe3+ and a fluorescent sensor for detecting Cu2+. The sensing characteristics of QM towards essential metal ions were confirmed using UV–Vis and fluorescence spectroscopy. The absorbance of ligand QM increased meaningfully with the addition of Fe3+ ions, which resulted in a color alteration from colorless to yellow. In addition, considerable fluorescence quenching response was observed towards Cu2+ ions among different tested ions. Job plot and molar ratio analyses exhibited a 1:1 stoichiometry ratio in the interaction of QM with the Fe3+ and Cu2+. The binding constants for QM-Fe3+ and QM-Cu2+ complexes using Benesi-Hildebrand were determined 3.335 × 10⁵ and 2.230 × 10³ M−1, respectively. In addition, the quenching rate constant (Ksv) was calculated to be 18.8 × 10³ M−1 using the Stern-Volmer plot for QM-Cu2+. The LOD and LOQ for QM-Fe3+ were calculated as 0.236 and 0.787 µM, respectively; they were 0.39 and 1.31 µM for QM-Cu2+, respectively. Moreover, the sensor QM can be utilized to quantify Fe3+ and Cu2+ ions in real tap water samples with reliable recovery. As a result, ligand QM can act as an effective sensor for the selective recognition of Fe3+ and Cu2+ in a wide range of applications.
Future advances in chemosensor design for iron and copper detection may focus on increasing sensitivity, selectivity, and real-time monitoring capabilities. Integration with emerging technologies and exploring environmentally friendly and cost-effective synthesis methods can be a key direction. Continued research may discover new chemical sensors with applications in various fields, such as environmental science, health care, and industrial processes, contributing to more efficient and stable analytical methods for metal ion detection.
CRediT authorship contribution statement
Seyedeh Roya Alizadeh: Conceptualization, Formal analysis, Methodology, Investigation, Writing – original draft. Pourya Biparva: Formal analysis, Methodology, Writing – original draft. Mohammad Ali Ebrahimzadeh: Resources, Funding acquisition, Supervision, Writing – review & editing.
Declaration of competing interest
The authors declare that they have no known competing financial interests or personal relationships that could have appeared to influence the work reported in this paper.
References
- Development in fluorescent off–on probes based on Cu2+ promoted hydrolysis reaction of the picolinate moiety. J. Fluoresc.. 2023;33(2):401-411.
- [CrossRef] [Google Scholar]
- A new colorimetric chemosensor based on 1, 3, 4-oxadiazole derivative for the high selectivity and sensitivity of Fe3+ ion detection. J. Mol. Struct.. 2022;1251:132019
- [CrossRef] [Google Scholar]
- A novel electrochemical sensor based on a glassy carbon electrode modified with dendrimer functionalized magnetic graphene oxide for simultaneous determination of trace Pb (II) and Cd (II) Electrochim. Acta. 2019;312:80-88.
- [CrossRef] [Google Scholar]
- A non-enzymatic hydrogen peroxide sensor based on dendrimer functionalized magnetic graphene oxide decorated with palladium nanoparticles. Appl. Surf. Sci.. 2019;478:87-93.
- [CrossRef] [Google Scholar]
- Iron biology in immune function, muscle metabolism and neuronal functioning. J. Nutr.. 2001;131(2):568S-S580.
- [CrossRef] [Google Scholar]
- Heavy metals analysis in drinking water of Lakki Marwat District. World Appl. Sci. J.. 2016;34(3):15-19.
- [CrossRef] [Google Scholar]
- Selective and dual naked-eye detection of Cu2+ and Hg2+ ions using a simple quinoline–carbaldehyde chemosensor. Sens. Actuators B Chem.. 2014;204:480-488.
- [CrossRef] [Google Scholar]
- A colorimetric Fe3+ sensor based on an anionic poly (3, 4-propylenedioxythiophene) derivative. Sens. Actuators B Chem.. 2017;244:891-896.
- [CrossRef] [Google Scholar]
- Iron homeostasis: An anthropocentric perspective. J. Biol. Chem.. 2017;292(31):12727-12734.
- [CrossRef] [Google Scholar]
- A new dual functional sensor: Highly selective colorimetric chemosensor for Fe3+ and fluorescent sensor for Mg2+. Spectrochim. Acta A Mol. Biomol. Spectrosc.. 2012;96:594-599.
- [CrossRef] [Google Scholar]
- Quinoxaline-based Schiff base transition metal complexes. J Coord Chem.. 2013;66(8):1416-1450.
- [CrossRef] [Google Scholar]
- Effectiveness and safety of deferasirox in thalassemia with iron overload: a meta-analysis. Acta Haematol.. 2019;141(1):32-42.
- [CrossRef] [Google Scholar]
- A multifunctional quinoxaline-based chemosensor for colorimetric detection of Fe3+ and highly selective fluorescence turn-off response of Cu+2 and their practical application. Spectrochim Acta A Mol. Biomol. Spectrosc.. 2023;302:123092
- [CrossRef] [Google Scholar]
- Highly selective visual detection of Fe3+ at ppm level. Sens. Actuators B Chem.. 2016;222:15-20.
- [CrossRef] [Google Scholar]
- A novel jointly colorimetric and fluorescent sensor for Cu2+ recognition and its complex for sensing S2− by a Cu2+ displacement approach in aqueous media. Spectrochim. Acta A Mol. Biomol. Spectrosc.. 2018;204:568-575.
- [CrossRef] [Google Scholar]
- Quinoxaline derivatives: A patent review (2006–present) Expert Opin. Ther. Pat.. 2012;22(11):1289-1302.
- [CrossRef] [Google Scholar]
- A fast, highly selective and sensitive colorimetric and fluorescent sensor for Cu2+ and its application in real water and food samples. Spectrochim. Acta A Mol. Biomol. Spectrosc.. 2019;213:97-103.
- [CrossRef] [Google Scholar]
- MOFs for the treatment of arsenic, fluoride and iron contaminated drinking water: A review. Chemosphere. 2020;251:126388
- [CrossRef] [Google Scholar]
- Naked-eye chemosensor and in vivo chelating activity of iron (III) by bromopyridine quinoxaline (BPQ) J. Fluoresc.. 2022;32(5):1669-1678.
- [CrossRef] [Google Scholar]
- Single fluorescein-based probe for selective colorimetric and fluorometric dual sensing of Al3+ and Cu2+. Sens. Actuators B Chem.. 2017;247:451-460.
- [CrossRef] [Google Scholar]
- Prospects and challenges of volatile organic compound sensors in human healthcare. ACS Sens.. 2018;3(7):1246-1263.
- [CrossRef] [Google Scholar]
- Iron transport proteins: Gateways of cellular and systemic iron homeostasis. J. Biol. Chem.. 2017;292(31):12735-12743.
- [CrossRef] [Google Scholar]
- Facile synthesis and anti-proliferative activity evaluation of quinoxaline derivatives. Synth. Commun.. 2020;50(6):823-830.
- [CrossRef] [Google Scholar]
- A strategy for As (III) determination based on ultrafine gold nanoparticles decorated on magnetic graphene oxide. Environ. Res.. 2023;231:116177
- [CrossRef] [Google Scholar]
- A paper-based fluorescent and colorimetric portable device with smartphone application for Fe3+ sensing. J. Environ. Chem. Eng.. 2022;10(3):107650
- [CrossRef] [Google Scholar]
- A DNAzyme catalytic beacon sensor for paramagnetic Cu2+ ions in aqueous solution with high sensitivity and selectivity. J. Am. Chem. Soc.. 2007;129(32):9838-9839.
- [CrossRef] [Google Scholar]
- Polyamidoamine dendrimer functionalized iron oxide nanoparticles for simultaneous electrochemical detection of Pb2+ and Cd2+ ions in environmental waters. Measurement. 2019;140:81-88.
- [CrossRef] [Google Scholar]
- Sensor technologies: Healthcare, wellness, and environmental applications. Springer Nature; 2013.
- 1-(d-Glucopyranosyl-2′-deoxy-2′-iminomethyl)-2-hydroxynaphthalene as chemo-sensor for Fe3+ in aqueous HEPES buffer based on colour changes observable with the naked-eye. Tetrahedron Lett.. 2009;50(7):776-780.
- [CrossRef] [Google Scholar]
- A simple pyrimidine based colorimetric and fluorescent chemosensor for sequential detection of copper (II) and cyanide ions and its application in real samples. Spectrochim. Acta A Mol. Biomol. Spectrosc.. 2020;228:117730
- [CrossRef] [Google Scholar]
- Colorimetric devices for naked-eye detection of Fe3+ and Cu2+: Optical properties, DFT calculations, and molecular docking studies. J. Water Proc. Eng.. 2024;59:105030
- [CrossRef] [Google Scholar]
- Aldazine-based colorimetric sensors for Cu2+ and Fe3+. Sens. Actuators B Chem.. 2012;161(1):304-310.
- [CrossRef] [Google Scholar]
- An aminonaphthalene-based colorimetric and fluorescent sensor for selective recognition of Fe3+ in water. Luminescence. 2020;35(8):1286-1295.
- [CrossRef] [Google Scholar]
- Single-center retrospective study of the effectiveness and toxicity of the oral iron chelating drugs deferiprone and deferasirox. PLoS One. 2019;14(2):e0211942.
- [CrossRef] [Google Scholar]
- Imatinib intermediate as a two in one dual channel sensor for the recognition of Cu2+ and I− ions in aqueous media and its practical applications. Dalton Trans.. 2014;43(35):13299-13306.
- [CrossRef] [Google Scholar]
- Spirooxazine-based dual-sensing probe for colorimetric detection of Cu2+ and Fe3+ and its application in drinking water and rice quality monitoring. ACS Omega. 2022;7(22):18671-18680.
- [CrossRef] [Google Scholar]
- Quinoxaline, its derivatives and applications: A state of the art review. Eur. J. Med. Chem.. 2015;97:664-672.
- [CrossRef] [Google Scholar]
- A bifunctional sensor based on diarylethene for the colorimetric recognition of Cu2+ and fluorescence detection of Cd2+. RSC Adv.. 2019;9(50):29141-29148.
- [CrossRef] [Google Scholar]
- Iron (III) selective molecular and supramolecular fluorescent probes. Chem. Soc. Rev.. 2012;41(21):7195-7227.
- [CrossRef] [Google Scholar]
- Hydrophilic truxene derivative as a fluorescent off-on sensor for copper (II) ion and phosphate species. J. Fluoresc.. 2019;29(2):417-424.
- [CrossRef] [Google Scholar]
- A turn-on Rhodamine B-indole based fluorogenic probe for selective sensing of trivalent ions. J. Lumin.. 2016;171:13-18.
- [CrossRef] [Google Scholar]
- A novel fluorescent sensor for fast and highly selective turn-off detection of Fe3+ in water and pharmaceutical samples using synthesized azopyrazole-benzenesulfonamide derivative. J. Mol. Struct.. 2021;1225:129175
- [CrossRef] [Google Scholar]
- Building Rhodamine-BODIPY fluorescent platform using click reaction: Naked-eye visible and multi-channel chemodosimeter for detection of Fe3+ and Hg2+. Sens. Actuators B Chem.. 2018;260:666-675.
- [CrossRef] [Google Scholar]
- A highly sensitive and selective quinazoline-based colorimetric probe for naked-eye detection of Fe3+ ions. J. Fluoresc.. 2022;32(6):2309-2318.
- [CrossRef] [Google Scholar]
- NPA-Cu2+ complex as a fluorescent sensing platform for the selective and sensitive detection of glyphosate. Int. J. Mol. Sci.. 2021;22(18):9816.
- [CrossRef] [Google Scholar]
- A novel fluorescent and colorimetric dual-channel sensor for the fast, reversible and simultaneous detection of Fe3+ and Cu2+ based on terthiophene derivative with high sensitivity and selectivity. J. Photochem. Photobiol. A: Chem.. 2019;383:111982
- [CrossRef] [Google Scholar]
- A highly selective and sensitive fluorescent turn-off probe for Cu2+ based on a guanidine derivative. Molecules. 2017;22(10):1741.
- [CrossRef] [Google Scholar]
- A highly sensitive and selective naked-eye probe for detection of Fe3+ based on a 2, 5-bis [3-benzyl-2-methylbenzothiazole]-croconaine. Tetrahedron. 2017;73(10):1350-1357.
- [CrossRef] [Google Scholar]
- A colorimetric sensor for the sequential detection of Cu 2+ and CN− in fully aqueous media: practical performance of Cu2+. Dalton Trans.. 2015;44(19):9120-9129.
- [CrossRef] [Google Scholar]
- A water-soluble fluorescent chemosensor based on Asp functionalized naphthalimide for successive detection Fe3+ and H2PO4−. Can. J. Chem.. 2018;96(4):363-370.
- [CrossRef] [Google Scholar]
- A simple turn-off Schiff base fluorescent sensor for copper (II) ion and its application in water analysis. Molecules. 2021;26(5):1233.
- [CrossRef] [Google Scholar]
- A dual-responsive colorimetric and fluorescent chemosensor based on diketopyrrolopyrrole derivative for naked-eye detection of Fe3+ and its practical application. Spectrochim. Acta A Mol. Biomol. Spectrosc.. 2018;189:594-600.
- [CrossRef] [Google Scholar]
- Design of iron chelators with therapeutic application. Dalton Trans.. 2012;41(21):6371-6389.
- [CrossRef] [Google Scholar]
- Fluorescent, MRI, and colorimetric chemical sensors for the first-row d-block metal ions. Chem. Soc. Rev.. 2015;44(13):4337-4366.
- [CrossRef] [Google Scholar]
- The application of intelligent sensors in medical research: a review. BioMed. Eng. Commun.. 2023;2(17):10.53388.
- [CrossRef] [Google Scholar]
- A dual responsive colorimetric/fluorescent turn-on sensor for highly selective, sensitive and fast detection of Fe3+ ions and its applications. J. Photochem. Photobiol. A: Chem.. 2019;382:111876
- [CrossRef] [Google Scholar]


