

Translate this page into:
A novel voltammetric sensing platform based on carbon nanotubes-niobium nanoparticles for the determination of chlorogenic acid
⁎Corresponding author. maslanoglu@harran.edu.tr (Mehmet Aslanoglu)
-
Received: ,
Accepted: ,
This article was originally published by Elsevier and was migrated to Scientific Scholar after the change of Publisher.
Peer review under responsibility of King Saud University.
Abstract
A novel voltammetric method was developed for the sensitive determination of chlorogenic acid (CGA) using a glassy carbon electrode (GCE) modified with niobium nanoparticles (NbNPs) and multiwalled carbon nanotubes (CNTs). The analytical techniques such as energy dispersive X-ray analysis (EDX), scanning electron microscopy (SEM) and X-ray diffraction spectroscopy were used for characterizing electrode material. The proposed voltammetric platform exhibited a highly improved redox couple for CGA. The peak separations (ΔEp) for CGA were 27 mV, 10 mV and 0 mV on the surface of unmodified GCE, CNTs/GCE and NbNPs/CNTs/GCE, respectively. Such a remarkable decrease in the value of ΔEp at NbNPs/CNTs/GCE showed that the electrode process of CGA has been accelerated at the proposed platform. In addition, a potential difference (ΔEp) of 0 V observed at the surface of proposed electrochemical platform was a clear indication of the occurrence of a symmetric voltammogram which could be attributed to a fully surface behavior of CGA. In addition, the current responses of CGA versus concentrations were linear in the range of 2.0 × 10⁻⁹ ∼ 2.0 × 10⁻⁶ M with a detection limit of 8.2 × 10⁻¹⁰ M. Sensitive detection of CGA in samples is of importance for both scientific and therapeutic reasons due to its potential use for the treatment in many diseases. Therefore, the proposed voltammetric method at NbNPs/CNTs/GCE was applied to food samples.
Keywords
Chlorogenic acid
Niobium nanoparticles
Carbon nanotubes
Sensorss
Analysis

1 Introduction
Chlorogenic acid (CGA), a naturally occurring phenolic compound, is available in various plants, fruits and vegetables including coffee beans (Hao et al., 2016). It was reported that CGA could be used as anti-inflammatory, anti-carcinogenic, anti-hypertension and blood glucose regulating agent (Feng et al., 2018). Therefore, sensitive measurement of CGA is of great interest for scientific reasons. Various methods were reported for determining CGA such as high performance liquid chromatography with mass spectroscopy (Feng et al., 2018), high performance liquid chromatography with ultraviolet spectroscopy (Craig et al., 2016), liquid chromatography (Kremr et al., 2017), infrared spectroscopy (Shan et al., 2017), electrochemiluminesce (Zheng et al., 2017) and electrochemical methods (Alpar et al., (2018); Koiralaa et al., 2016; Natale et al., 2015; Oliveira-Neto et al., 2016; Tomac and Šeruga, 2016; Tomac et al., 2017; Yardim, 2012). However, time-consuming steps and complexity in some of the above of techniques make them unsuitable for the accurate determination of CGA. In contrast, electrochemical methods have shown sensitivity and simplicity for the determination of CGA (Ma et al., 2016; Newair et al., 2017; Yardim et al., 2013). In addition, voltammetric techniques at utilizing modified electrodes presented excellent performances in terms of decreased overpotential, increased sensitivity and low detection limit (Chao and Ma, 2014; Ribeiro et al., 2016; Vasilescu et al., 2015; Zare et al., 2011; Zhao et al., 2018). Recently, a simple and sensitive electrochemical sensor based on Au nanoparticles, polyoxometalates, macroporous carbon (Zhang et al., 2017), chitosan and carbon nanotubes modified glassy carbon electrode (Cheng et al., 2017) and metal–organic framework and titanium dioxide nanocomposite based electrode (Wang et al., 2016) were appeared for the determination of CGA in various samples. Carbon nanaotubes based hybrid nanosensors also exhibited excellent conductivity and good chemical stability with high surface area and utilized for the electroanalysis of various species (Yola and Atar, 2014; Laurial et al., 2017; Reddy et al., 2017; Ertan et al., 2016). Furthermore, electrochemical platforms based on composites of carbon nanotubes and metallic nanoparticles exhibited good selectivity and high sensitivity for the determination of various analytes (Arvand and Hassannezhad, 2014; Messaoud et al., 2017). In addition, the authors have reported that niobium nanoparticles based materials exhibited great catalytic activity, good selectivity and high sensitivity in various types of analytical applications (Govindasamy et al., 2018; Naz et al., 2018). In this study, a novel voltammetric method was developed for the determination of CGA using a GCE modified with multiwalled carbon nanotubes (CNTs) and niobium nanoparticles (NbNPs). The proposed nanostructured electrode was also successfully applied to coffee bean samples for the determination of CGA.
2 Experimental
2.1 Chemicals
Chlorogenic acid (CGA), ascorbic acid (AA) and acetaminophen (ACT) were purchased from Sigma Chem. Company. Potassium dihydrogen phosphate, disodium hydrogen phosphate and chloroform were obtained from Merck Chem. Company. Multiwalled carbon nanotubes and niobium nanopowder were purchased from US-Nano Chem. Company. Food samples were kindly supplied by a local store. All other chemicals were of analytical grade and obtained from Merck or Fluka and used without any further purifications. All aqueous solutions were prepared with ultra-pure water. The analyte containing cell was deoxygenated by purging nitrogen before running each measurement.
2.2 Instrumentation
Voltammetry was performed on an Autolab potentiostat/galvanostat (PGSTAT-12) with a three-electrode system (EcoChemie, The Netherlands). A glassy carbon electrode with a 3 mm in diameter in size purchased from Bioanalytical Systems was used as the working electrode. A Pt rod and a Ag/AgCl obtained from Metrohm were served as counter and reference electrode, respectively.
2.3 Procedure for the preparation of modified electrode
Glassy carbon electrodes (GCEs) were polished with 0.05 µm alumina slurry on a polishing pad prior to modifying their surfaces. Then, the electrodes were sonicated with 1:1 HNO3-acetone after rinsing with water. Afterwards, the electrodes were electrochemically activated over a potential range from −0.4 to +0.8 V in PBS. CNTs were subjected to the sonication in a mixture containing concentrated nitric acid and perchloric acid. The mixture was filtered and washed with ultra-pure water. The solid was left to dry at ambient temperature. Afterwards, 5 mg of CNTs and 0.5 mg of niobium nanopowder were weighed and dispersed in 25 mL of chloroform. The mixture was then sonicated for 30 min. 5 µL of suspension was placed on GCE by means of a micropipette. The platform was abbreviated as NbNPs/CNTs/GCE. The voltammetric platform was placed in an electrochemical cell containing 0.1 M PBS for activation in a potential range from − 0.4 to 0.8 V. Scheme 1 shows a simple illustration for the preparation of the platform and its use in the voltammetric analysis of samples.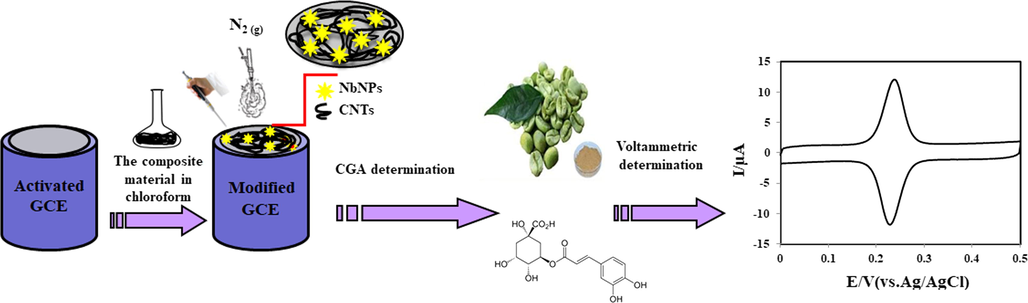
A simple illustration for the preparation of the platform and its application in electroanalysis.
2.4 Optimization of platform
Voltammetric results showed that an optimal ratio of 10:1 for a mixture of CNTs and NbNPs was appropriate for the high sensitivity in the electroanalysis of CGA. In addition, it was concluded that a volume of 5 µL of suspension of the mixture of NbNPs-CNTs should be placed on electrode to improve the response for CGA. It should be noted that remarkable decreases of reproducibility were observed with greater volume of suspension.
2.5 Sample preparation for analysis
0.25 g of ground coffee bean sample was accurately weighed and added to a flask. Then, 50 mL of methanol and 50 mL of 0.1 M PBS at pH 7 were added to the sample followed by boiling for 5 min while stirring. Then, the brewed coffee bean sample was cooled to room temperature, filtered and diluted with 0.1 M PBS at pH 7. It was then subjected to the voltammetric analysis for the quantification of chlorogenic acid. Tomato juice and fizzy drink samples were directly diluted with 0.1 M PBS at pH 7, then subjected to the voltammetric analysis.
3 Results and discussion
3.1 Characterization of the proposed platform
The characterization of the proposed material (NbNPs-CNTs) was examined by scanning electron microscopy (SEM), energy dispersive X-ray spectroscopy (EDX) and X-ray diffraction method (XRD). SEM images of composite material are given in Fig. 1A,B,C and D. Data reveals that Nb nanoparticles are distributed on CNTs and the particle size ranges from 68.3 nm to 87.3 nm (Fig. 1D). As seen in Fig. 1E, the EDX spectrum shows elements of Nb, Au, C, Pd and O. However, the appearance of Pd and Au was due to the palladium-gold coating of platform prior to SEM measurements. An XRD spectrum of electrode material is also shown in Fig. 1F. The diffraction peaks at 2θ = 38.5°, 57.7° and 70.0° correspond to Nb, and the weak diffraction peak exhibited at 2θ = 25° corresponds to the facet of CNTs.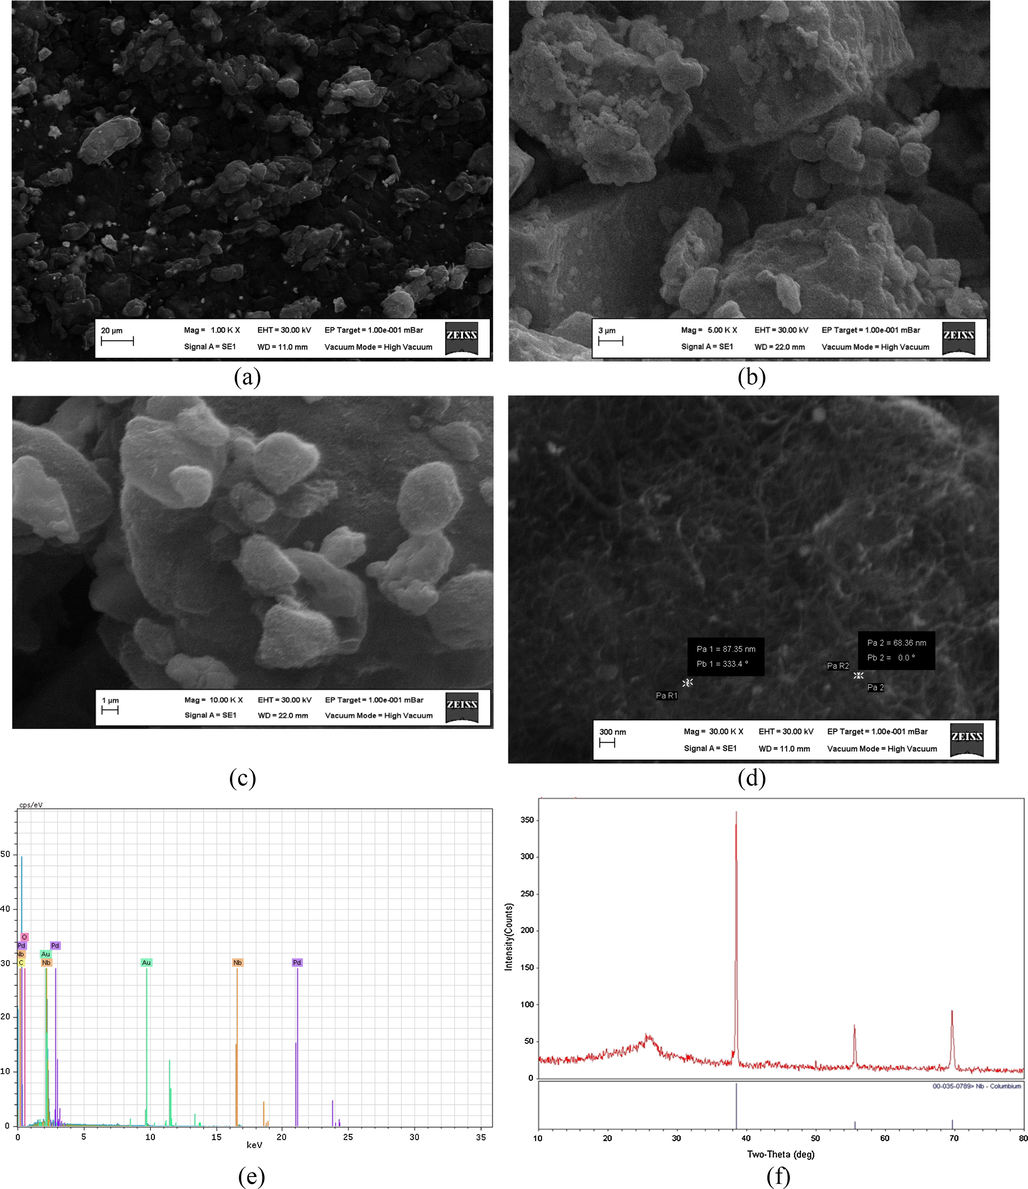
SEM images of NbNPs/CNTs (A, B, C, D), EDX spectrum of NbNPs/CNTs (E) and XRD pattern of NbNPs/CNTs (F).
3.2 Voltammetric behaviour of chlorogenic acid
Fig. 2 shows voltammograms of 4.0 × 10⁻⁷ M CGA at bare GCE (a – inset), CNTs/GCE (b) and NbNPs/CNTs/GCE (c). As shown, the GCE exhibited broad and poor peaks at Epa = 0.273 V and Epc = 0.246 V for the oxidation and reduction of CGA, respectively. The peak separation (ΔEp) was 27 mV. However, a cyclic voltammogram of CGA at a GCE modified with CNTs was given in voltammogram b of Fig. 2. The CNTs/GCE system exhibited an oxidation peak at 0.237 V and a reduction peak at 0.227 V. ΔEp was about 10 mV for CGA at CNTs/GCE. As seen that an electrode modified with CNTs possessed high electrocatalytic effect and exhibited high current response for the redox couple of CGA. The voltammetry of CGA was improved at CNTs/GCE owing to the resistance to surface fouling of the proposed voltammetric platform and the decrease in the value of overpotential. The proposed platform based on a GCE coated with NbNPs/CNTs exhibited a sharp, improved and a well-defined oxidation peak at 0.234 V with a reduction peak at 0.234 V with a separation of peak potentials of 0 mV for the redox couple of CGA (Fig. 2, voltammogram c). The observation of the decrease in ΔEp at the proposed platform was an evidence of the acceleration of the redox process of CGA. In addition, a potential difference (ΔEp) of 0 V observed at the surface of proposed electrochemical platform was a clear indication of the occurrence of a symmetric voltammogram which could be attributed to a fully surface behavior of CGA. The proposed voltammetric platform (NbNPs/CNTs/GCE) has also enhanced peak current when compared to the current response occurred at GCE and CNTs/GCE. It is clear that the proposed voltammetric platform based exhibits a potential separation (ΔEp) of 0 mV. Data showed that the proposed electrochemical platform was more appropriate for the study of CGA as it exhibited improved voltammetric behavior such as decreased overpotential, high catalytic effect, enhancement of mass transport and the decrease of separation in the peak potentials.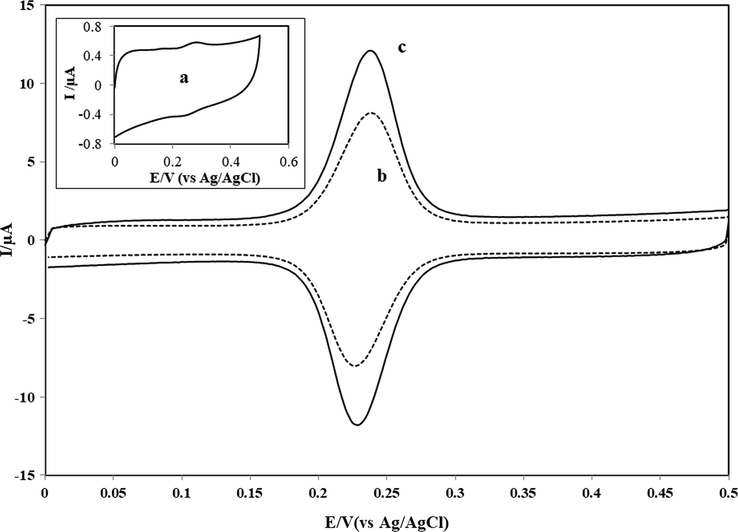
CVs of 4.0 × 10⁻⁷ M CGA at GCE (a - inset), CNTs/GCE (b) and NbNPs/CNTs/GCE (c) in 0.1 M PBS at pH 7.0. Scan rate: 50 mV/s.
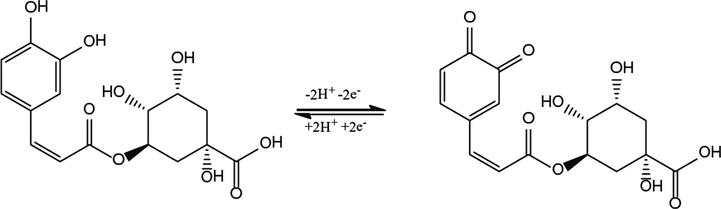
Cyclic voltammetry of CGA was carried out at different sweep rates to acquire the possible electrode mechanism (Fig. 3A). The anodic current response of CGA was linear with sweep rates over a range from 50 to 250 mV/s. This behaviour indicates that the electrode process of CGA at the proposed platform is surface-controlled (Fig. 3B). The proposed platform was also used for the investigation of the influence of solution pH on Ep of CGA. The voltammograms of CGA at various pH values are given in Fig. 3C. The occurrence of shifts in peak potential of CGA with the change in solution pH was an indication of proton transfer accompanying electrons. A linear plot of Ep vs. pH is shown in Fig. 3D. A slope of 66.1 mV/pH indicates that the number of protons involved in the process of CGA is equal to the number of electrons transferred. It is reported that CGA undergoes a two-electron transfer process (Yardim et al., 2013; Zhang et al., 2017). The experimental results reveal that the electrode reaction of CGA involves two protons as two electrons are transferred. The possible reaction mechanism of CGA is given in Scheme 2 (Cheng et al., 2017; Yardim et al., 2013; Zhang et al., 2017).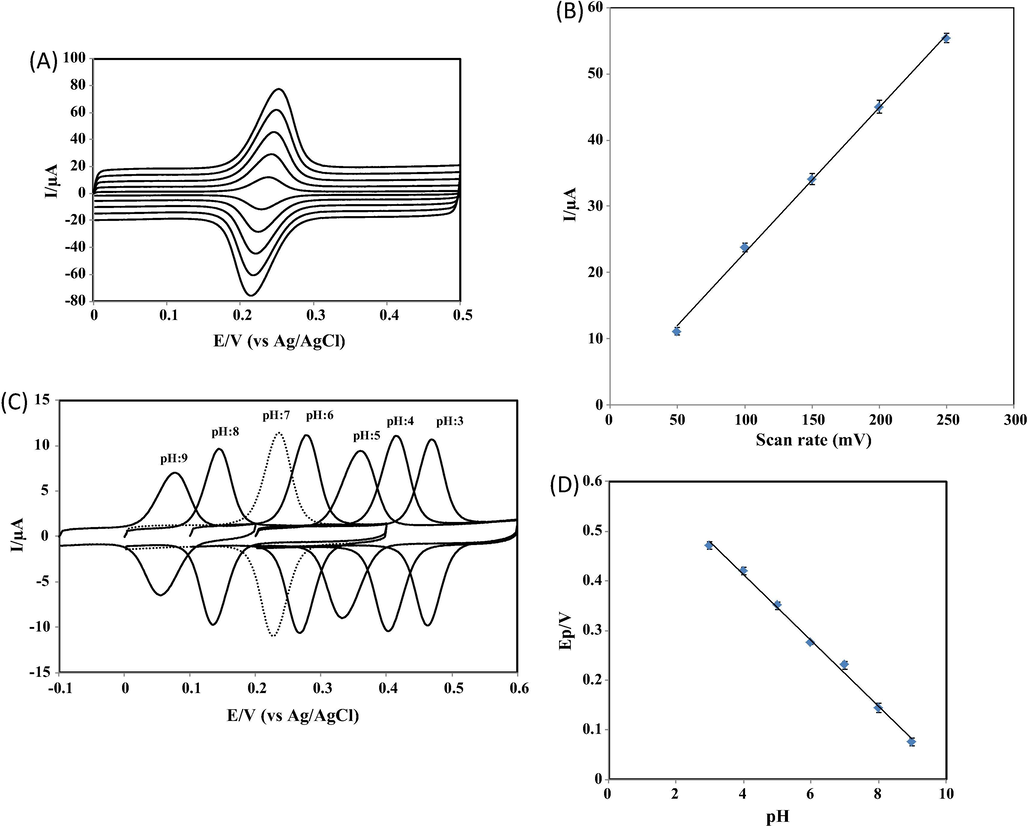
(A) CVs of 1.0 × 10⁻⁷ M CGA at NbNPs/CNTs/GCE in 0.1 M PBS at pH 7.0. Scan rate: 50 mV/s, 100 mV/s, 150 mV/s, 200 mV/s, 250 mV/s (bottom to top). (B) A plot of anodic peak currents of CGA versus scan rate. (C) CVs of 1.0 × 10⁻⁷ M CGA at NbNPs/CNTs/GCE in 0.1 M PBS at various pH values. Scan rate: 50 mV/s. (D) A plot of anodic peak potentials of CGA versus solution pH.
Possible electrode reaction of CGA.
3.3 Determination of linear range and detection limit
Square wave voltammetry (SWV) was applied for the determination of linear range and detection limit (LOD) for CGA at NbNPs/CNTs/GCE in 0.1 M PBS at pH 7.0. Square wave voltammograms of various concentrations of CGA at NbNPs/CNTs/GCE are shown in Fig. 4A. A plot of peak currents vs concentrations is given in Fig. 4B. The peak currents were linear with concentrations of CGA over the range from 2.0 × 10⁻⁹ to 2.0 × 10⁻⁶ M with a LOD of 8.2 × 10⁻¹⁰ M (based on 3sb/m). The linear equation was Ip (µA) = 100.6161C (µM) + 2.1605 (R2 = 0.9967). In addition, Table 1 shows electrodes, modifiers, techniques, linear ranges, sensitivities and detection limits (LOD) for the various studies of the determination of CGA. The LOD acquired in the present study indicated that the proposed voltammetric procedure at NbNPs/CNTs/GCE was highly sensitive for the determination of CGA as a lower LOD was obtained when compared to several other electrodes (Zhang et al., 2017; Chao and Ma, 2014; Cheng et al., 2017; Zheng et al., 2017). Au-POMs-MPC: Au nanoparticles/polyoxometalates/3D macroporous carbon. PASA: Poly(aminosulfonic acid). CHIT-CNT: Chitosan carbon nanotubes. CdS: CdS nanorod.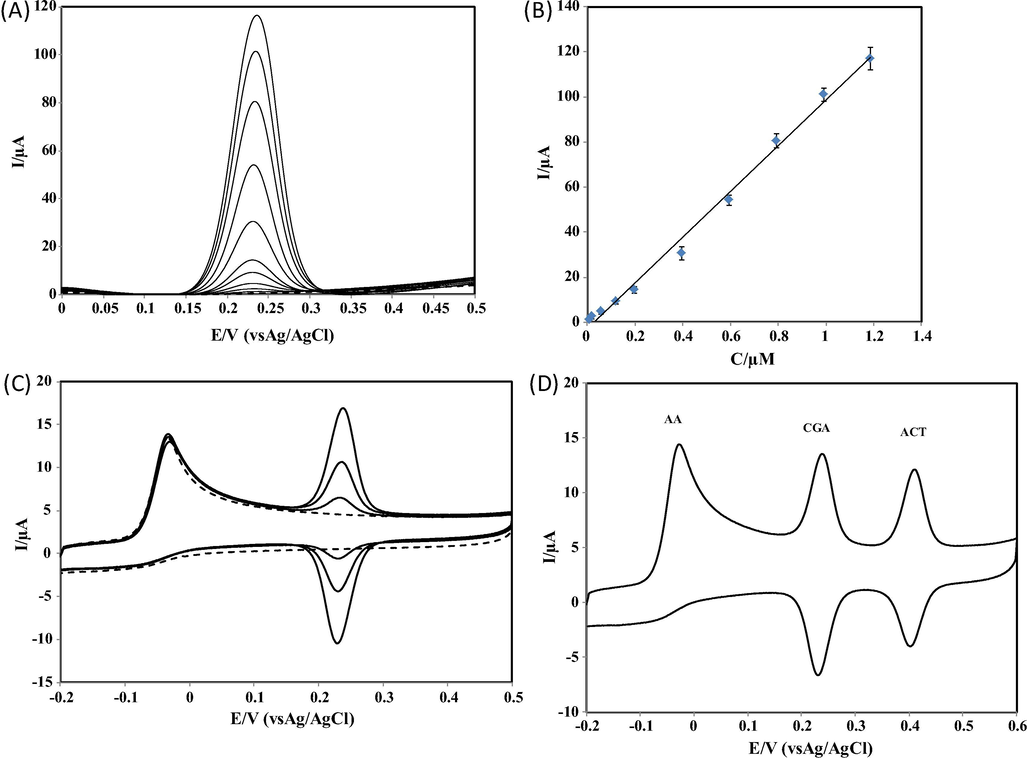
(A) Square wave voltammograms of increasing concentrations of CGA at NbNPs/CNTs/GCE in 0.1 M PBS at pH 7.0. CGA concentrations: a) 0.00 M; b) 2.0 × 10⁻⁹ M; c) 2.0 × 10⁻⁸ M; d) 6.0 × 10⁻⁸ M; e) 1.0 × 10⁻⁷ M; f) 2.0 × 10⁻⁷ M; g) 4.0 × 10⁻⁷ M; h) 6.0 × 10⁻⁷ M; i) 8.0 × 10⁻⁷ M; j) 1.0 × 10⁻⁶ M; k) 2.0 × 10⁻⁶ M. Frequency: 10 Hz. Step potential: 100 mV/s. Amplitude: 50 mV/s. (B) A plot of peak current versus the concentration of CGA. (C) CVs of increasing concentrations of CGA in the presence of 2.0 × 10⁻⁵ M AA at NbNPs/CNTs/GCE in 0.1 M PBS at pH 7.0. CGA concentrations: 0.0 M; 1.0 × 10⁻⁷ M; 2.0 × 10⁻⁷ M; 4.0 × 10⁻⁷ M; Scan rate: 50 mV/s. (D) A CV of the mixture of 1.0 × 10⁻⁵ M AA, 4.0 × 10⁻⁷ M CGA and 4.0 × 10⁻⁷ M ACT at NbNPs/CNTs/GCE in 0.1 M PBS at pH 7.0. Scan rate: 50 mV/s,
Electrode
Modifier
Technique
Linear range (M)
LOD (M)
Sensitivity (µA/µM)
Sample
Reference
GCE
Au-POMs-MPC
DPV
2.28 × 10⁻⁹ ∼ 3.24 × 10⁻⁶
2.15 × 10⁻⁹
0.030554
Drug
(Zhang et al., 2017)
GCE
PASA
CV
4.0 × 10⁻⁷ ∼ 1.2 × 10⁻⁵
4.0 × 10⁻⁸
2.27
Drug
(Chao and Ma, 2014)
CPE
CHIT-CNT
SWV
2.0 × 10⁻⁸ ∼ 2.24 × 10⁻⁴
1.16 × 10⁻⁸
0.4460
Serum
(Cheng et al., 2017)
PGE
CdS
ECL
2.0 × 10⁻⁹ ∼ 8.0 × 10⁻⁷
1.0 × 10⁻⁹
N.A.
Honeysuckle
(Zheng et al., 2017)
GCE
NbNPs/CNTs
SWV
2.0 × 10⁻⁹ ∼ 2.0 × 10⁻⁶
8.2 × 10⁻¹⁰
100.6161
Coffee, Tomato, Drinks
This work
3.4 Studies of repeatability, reproducibility, selectivity and stability
The repeatability of the proposed electrochemical platform was excellent for the electrode process of CGA as an RSD of 1.3% for 8.0 × 10⁻⁷ M CGA was obtained for 10 consecutive scans. The RSD values of 10 consecutive scans of multiple electrodes were 1.1%, 1.0% and 1.3% indicating that the reproducibility was also excellent. Fig. 4C shows CVs of the various concentrations of CGA in a solution containing AA. The selectivity of the novel method was tested for the determination of CGA versus the major interfering compound (AA). The current response and peak potential of CGA was not influenced in the presence of AA. In addition, a voltammogram of a mixture of AA, CGA and ACT is given in Fig. 4D. Three sharp oxidation peaks at −0.03 V, 0.234 V and 0.405 V were appeared for AA, CGA and ACT, respectively. Experimental measurements indicated that the proposed sensing platform provided good selectivity for the determination of CGA. The stability of the proposed sensing platform was also checked by measuring the peak responses of CGA for a period of time. The decrease in the value of peak response was 5% of its initial response during 15 days indicating that the proposed platform was excellent and enabled good stability In addition, a decrease of 7% was observed after 30 days. The results indicate that the proposed voltammetric procedure at NbNPs/CNTs/GCE exhibits excellent reproducibility, good selectivity and stability.
3.5 Analysis of samples
Determination of CGA at NbNPs/CNTs/GCE in food samples such as green coffee bean, tomato and fizzy drinks was referred to the linear equation. Experimental data are given in Table 2. The amounts of CGA were 19.1 mg/g, 11.4 mg/100 mL and 1.84 mg/100 mL in green coffee bean, tomato juice and fizzy drink, respectively. The measurements were obtained with reasonable values of RSDs as shown in Table 2. Also, mean recoveries of 99.0% (RSD of 2.2%) and 101.2% (RSD of 3.0%) were obtained on the standard addition of two individual concentrations of CGA from the analysis of green coffee bean. However, no trace of CGA was observed in the analysis of samples of coke, soda and energy drink. The reasonable values of recoveries and RSDs calculated at the proposed electrode demonstrated that the niobium nanoparticles and carbon nanotubes based method of analysis was accurate and precise for determining CGA.
4 Conclusions
A glassy carbon electrode (GCE) modified with multiwalled carbon nanotubes (CNTs) and niobium nanoparticles (NbNPs) was used for the sensitive determination of chlorogenic acid (CGA). The voltammetric platform exhibited a highly improved redox couple for CGA with a peak separation of (ΔEp) 0 mV. The value of ΔEp at NbNPs/CNTs/GCE indicated an excellent acceleration of the electrode process of CGA. Meanwhile, a potential difference (ΔEp) of 0 V observed at the surface of proposed voltammetric platform was a clear indication of the occurrence of a symmetric voltammogram which could be attributed to a fully surface behavior of CGA. A linear plot was obtained for the response of current against the concentration in a range from 2.0 × 10⁻⁹ to 2.0 × 10⁻⁶ M. The detection limit calculated at the proposed voltammetric platform was about 8.2 × 10⁻¹⁰ M for CGA. The sensitive determination of CGA made the proposed voltammetric method of high interest for the detection of CGA for a number of reasons. It can be concluded that the proposed method is accurate and precise for the determination of CGA in samples.
Declaration of Competing Interest
The authors declare that they have no known competing financial interests or personal relationships that could have appeared to influence the work reported in this paper.
References
- Selective and simultaneous determination of total chlorogenic acids, vanillin and caffeine in foods and beverages by adsorptive stripping voltammetry using a cathodically pretreated boron-doped diamond electrode. Sens. Actuat. B: Chem.. 2018;257:398-408.
- [Google Scholar]
- Magnetic core-shell Fe(3)O(4)@SiO(2)/MWCNT nanocomposite modified carbon paste electrode for amplified electrochemical sensing of uric acid. Mater. Sci. Eng.. C Mater. Biol. Appl.. 2014;36:160-167.
- [Google Scholar]
- Voltammetric determination of chlorogenic acid in pharmaceutical products using poly(aminosulfonic acid) modified glassy carbon electrode. J. Food Drug. Anal.. 2014;22(4):512-519.
- [Google Scholar]
- Cheng, W., Huang, J., Cheng Liu, a. Q. Z., Tong, Y., Wang, L., Cheng, F., (2017). High sensitivity chlorogenic acid detection based on multiple layer-by-layer self-assembly films of chitosan and multi-walled carbon nanotubes on a glassy carbon electrode. RSC Adv., 7, 6950-6956.
- Performance review of a fast HPLC-UV method for the quantification of chlorogenic acids in green coffee bean extracts. Talanta. 2016;154:481-485.
- [Google Scholar]
- Sensitive analysis of simazine based on platinum nanoparticles on polyoxometalate/multi-walled carbon nanotubes. J. Colloid Interf. Sci.. 2016;470:14-21.
- [Google Scholar]
- A sensitive HPLC-MS method for simultaneous determination of thirteen components in rat plasma and its application to pharmacokinetic study of Tanreqing injection. J. Pharm. Biomed. Anal.. 2018;148:205-213.
- [Google Scholar]
- Detection of pesticide residues (fenitrothion) in fruit samples based on niobium carbide@molybdenum nanocomposite: an electrocatalytic approach. Anal Chim Acta. 2018;1030:52-60.
- [Google Scholar]
- Selective extraction and determination of chlorogenic acid in fruit juices using hydrophilic magnetic imprinted nanoparticles. Food Chem. 2016;200:215-222.
- [Google Scholar]
- Koiralaa, K., III, F. B. S., Santos, J. H., (2016). Biomimetic potentiometric sensor for chlorogenic acid based on electrosynthesized polypyrrole. Sens. Actuat. B: Chem., 222 391-396.
- On-line monitoring of in-vitro oral bioaccessibility tests as front-end to liquid chromatography for determination of chlorogenic acid isomers in dietary supplements. Talanta. 2017;166:391-398.
- [Google Scholar]
- Hybrid carbon based nanomaterials for electrochemical detection of biomolecules. Progr. Mater. Sci.. 2017;88:499-594.
- [Google Scholar]
- Electrochemical behavior and determination of chlorogenic acid based on multi-walled carbon nanotubes modified screen-printed electrode. Sensors (Basel). 2016;16(11):1797-1806.
- [Google Scholar]
- Electrochemical sensor based on multiwalled carbon nanotube and gold nanoparticle modified electrode for the sensitive detection of bisphenol A. Sens. Act. B: Chem.. 2017;253:115-123.
- [Google Scholar]
- Development of an analytical method for the determination of polyphenolic compounds in vegetable origin samples by liquid chromatography and pulsed amperometric detection at a glassy carbon electrode. J. Chromatogr. A. 2015;1420:66-73.
- [Google Scholar]
- Niobium doped zinc oxide nanorods as an electron transport layer for high-performance inverted polymer solar cells. J. Colloid Interface Sci.. 2018;512:548-554.
- [Google Scholar]
- Electrochemical Determination of the Antioxidant Activity in Echinacea Purpurea Roots Using SquareWave Voltammetry. Electroanalysis. 2017;29:1131-1140.
- [Google Scholar]
- Electrochemical behavior and determination of major phenolic antioxidants in selected coffee samples. Food Chem.. 2016;190:506-512.
- [Google Scholar]
- Reddy K. K:, Satyanarayana M., Goud K. Y., K. Gobi V., Kim H:, (2017). Carbon nanotube ensembled hybrid nanocomposite electrode for direct electrochemical detection of epinephrine in pharmaceutical tablets and urine Materials Science and Engineering C 79, 93–9.
- Application of a nanostructured platform and imprinted sol-gel film for determination of chlorogenic acid in food samples. Talanta. 2016;156–157:119-125.
- [Google Scholar]
- Application of Curve Fitting and Wavelength Selection Methods for Determination of Chlorogenic Acid Concentration in Coffee Aqueous Solution by Vis/NIR Spectroscopy. Food Anal. Methods. 2017;10:999-1006.
- [Google Scholar]
- Electrochemical Properties of Chlorogenic Acids and Determination of Their Content in Coffee Using Differential Pulse Voltammetry. Int. J. Electrochem. Sci.. 2016;11:2854-2876.
- [Google Scholar]
- Characterization of Chlorogenic Acids in Coffee by Flow-Through Chronopotentiometry. Food Anal. Methods. 2017;10:3924-3933.
- [Google Scholar]
- Vasilescu, I., Eremia, S. A. V., Ramona Penu, a. C. A., Radoi, A., Litescu, S. C., Radua, G.-L., (2015). Disposable dual sensor array for simultaneous determination of chlorogenic acid and caffeine from coffee. RSC Advances, 5, 261-268.
- Highly stable and ultrasensitive chlorogenic acid sensor based on metal-organic frameworks/titanium dioxide nanocomposites. Analyst. 2016;141(15):4647-4653.
- [Google Scholar]
- Electrochemical behavior of chlorogenic acid at a boron-doped diamond electrode and estimation of the antioxidant capacity in the coffee samples based on its oxidation peak. J. Food Sci.. 2012;77(4):C408-C413.
- [Google Scholar]
- Voltammetric determination of mixtures of caffeine and chlorogenic acid in beverage samples using a boron-doped diamond electrode. Talanta. 2013;116:1010-1017.
- [Google Scholar]
- A novel voltammetric sensor based on gold nanoparticles involved in p-aminothiophenol functionalized multi-walled carbon nanotubes: application to the simultaneous determination of quercetin and rutin. Electrochim. Acta. 2014;119:24-31.
- [Google Scholar]
- Preparation, electrochemical behavior and electrocatalytic activity of chlorogenic acid multi-wall carbon nanotubes as a hydroxylamine sensor. Mater. Sci. Eng. C. 2011;31:975-982.
- [Google Scholar]
- Sensitive determination of chlorogenic acid in pharmaceutical products based on the decoration of 3D macroporous carbon with Au nanoparticles via polyoxometalates. Analyst. 2017;142(14):2603-2609.
- [Google Scholar]
- Surface imprinted polymers based on amino-hyperbranched magnetic nanoparticles for selective extraction and detection of chlorogenic acid in Honeysuckle tea. Talanta. 2018;181:271-277.
- [Google Scholar]
- An ultrasensitive electrochemiluminescent sensor based on a pencil graphite electrode modified with CdS nanorods for detection of chlorogenic acid in honeysuckle. Luminescence. 2017;32(5):806-811.
- [Google Scholar]


