

Translate this page into:
A pharmacokinetic study on twenty-one compounds in rat plasma by integrating UPLC-QQQ-MS/MS with GC-MS after oral administration of Suxiao Jiuxin pill
⁎Corresponding author at: State Key Laboratory of Component-based Chinese Medicine, Tianjin University of Traditional Chinese Medicine, Tianjin 301617, China. hejun673@163.com (Jun He)
-
Received: ,
Accepted: ,
This article was originally published by Elsevier and was migrated to Scientific Scholar after the change of Publisher.
Peer review under responsibility of King Saud University. Production and hosting by Elsevier.
Abstract
Suxiao Jiuxin pill (SX) was a commonly used traditional Chinese medical preparation for treating acute myocardial infarction. However, fewer studies have been reported for comprehensively investigating the pharmacokinetic of the non-volatile and volatile chemical constituents in SX. For current study, a comprehensive and sensitive quantitation of twenty-one compounds in rat plasma was developed and validated by integrating UPLC-QQQ-MS/MS with GC-MS after oral administration of SX. The pharmacokinetic study was performed under acceptable specificity, linearity, sensitivity, precision and accuracy, recovery, matrix effect and stability. Ultimately, borneol, isoborneol, senkyunolide A, senkyunolide Ⅰ, ligustilide, ferulic acid, neocnidilide, senkyunolide H and levistolide A were detected. Their ranges of Tmax, Cmax, T1/2z and AUC (0-∞) were 0.07 ∼ 0.33 h, 5.24 ∼ 683.35 μg/L, 0.29 ∼ 1.08 h and 6.55 ∼ 474.62 μg/L*h, respectively. This study would be meaningful in better revealing the therapeutic material basis of SX. Furthermore, it could provide reference on pharmacological effect of SX against acute myocardial infarction.
Keywords
Suxiao Jiuxin pill
Pharmacokinetic
UPLC-QQQ-MS/MS
GC-MS

1 Introduction
Acute myocardial infarction, a serious and life-threatening cardiovascular disease, was usually due to myocardial hypoxia induced by coronary artery stenosis or embolism (Lu et al., 2019). Unfortunately, even with timely pharmacological, catheter-based and surgical reperfusion, patients were at the constant risks of complications such as pseudoaneurysm, free wall rupture, ventricular septal defect, etc (Damluji et al., 2021, Gong et al., 2021). Clinically, aspirin and nitroglycerin were usually thought as the drug of choice for the treatment because of their powerful therapeutic effect on thrombolysis and vasodilatation (Anderson and Morrow, 2017). Nevertheless, allergy, gastric mucosal injury and gout usually occurred after administration of aspirin (Ben Salem et al., 2017, Cortellini et al., 2017, Oncel et al., 2021). As well, nitroglycerin might trigger syncope and migraine attacks. In addition, resistance and susceptibility to inactivation also constrained their application (van Oosterhout et al., 2020). Traditional Chinese medicines (TCMs) have been widely used in the treatment of acute cardiovascular disease because of the significant curative effect and fewer side effects (Xu et al., 2017, Ruan et al., 2018, Li et al., 2020, Wang et al., 2021).
Suxiao Jiuxin pill (SX) was a presentative preparation of cardiovascular protection. It was composed of Chuanxiong Rhizome and Borneolum Syntheticum. According to the meta-analysis, SX was more effective than salvia tablet and nitroglycerin in improving ECG results (Ren et al., 2018). SX could exert cardioprotective effects in rat models of acute myocardial infarction by regulating focal adhesion and platelet activation pathways (Song et al., 2022). Chuanxiong Rhizome, also named chuanxiong in China, was the dried rhizome of Ligusticum chuanxiong Hort. As a famous blood-activating and stasis-resolving herbal medicine, chuanxiong possessed significant therapeutic on cardiovascular disease (Chen et al., 2018). Chuanxiong could significantly downregulate VEGF/VEGFR2 pathway to reduce angiogenesis and upregulate PI3K-Akt pathway to release nitric oxide (NO). It maintained the contractile function of the vascular endothelium and reversed reactive oxygen species (ROS) produced by H2O2 to reducing oxidative stress (Li et al., 2014, Ni et al., 2014, Yuan et al., 2018, Li et al., 2019). Borneolum Syntheticum was considered as an “upper guiding drug” that could gather therapeutic effect at the upper-jiao (Mei et al., 2023). There were many studies showed Borneolum Syntheticum possessed multiple therapeutic effect on cardiovascular disease, for instance, atherosclerosis, myocardial injury, hypertension, thrombosis, etc (Liu et al., 2021). Phthalidic, phenolic and terpenoidic ingredients were the main compounds in SX. Ligustilide could produce vasodilation via blocking voltage dependent calcium channel and receptor mediated Ca2+ influx and release (Cao et al., 2006). Senkyunolide A was able to significantly decrease the effect of tetraethylammonium on the relaxation of isolated aorta (Chan et al., 2007). Furthermore, the potent anti-inflammatory and antioxidant activities of chlorogenic acid, caffeic acid and ferulic acid have been validated through abundant vivo and vitro assays (Mubarak et al., 2012, Naveed et al., 2018, Afnan et al., 2022). Borneol, as a neutral antioxidant and antiinflammatory agent, could downregulate LPS-induced inflammatory infiltration by reducing levels of NO, TNF-α and IL-6.
The combined action of multiple compounds and targets was responsible for the efficacy of SX. Pharmacokinetic studies described how a drug was absorbed, distributed, metabolized and excreted. It played a key role in elucidating the pharmacological mechanism and clinical application of medicine (Huang et al., 2021, Yang et al., 2021). However, it was worth noting that corresponding study has not yet been reported in literature for comprehensively investigating the pharmacokinetic of the non-volatile and volatile chemical constituents in SX. Recently, lots of analytical methods were developed for pharmacokinetic study, for example, high performance liquid chromatogram tandem ultraviolet detection (HPLC-UV) (Wei et al., 2014), high performance liquid chromatogram tandem electrochemical detection (HPLC-ECD) (Liu and Chen, 2012), ultra-performance liquid chromatogram tandem mass spectrometry (UPLC-MS/MS) (Yang et al., 2021), gas chromatogram tandem mass spectrometry (GC-MS) (Li et al., 2018), etc. UPLC-MS/MS and GC-MS were broadly used in pharmacokinetic study with the advantages of high sensitivity, selectivity and rapidity.
Consequently, a rapid, sensitive and comprehensive quantitative method of twenty-one compounds (Fig. 1) in rat plasma was developed by integrating UPLC-QQQ-MS/MS with GC-MS. This validated method was successfully applied in pharmacokinetic study on SX. This work would provide a worthwhile foundation to explain the therapeutic material basis of SX.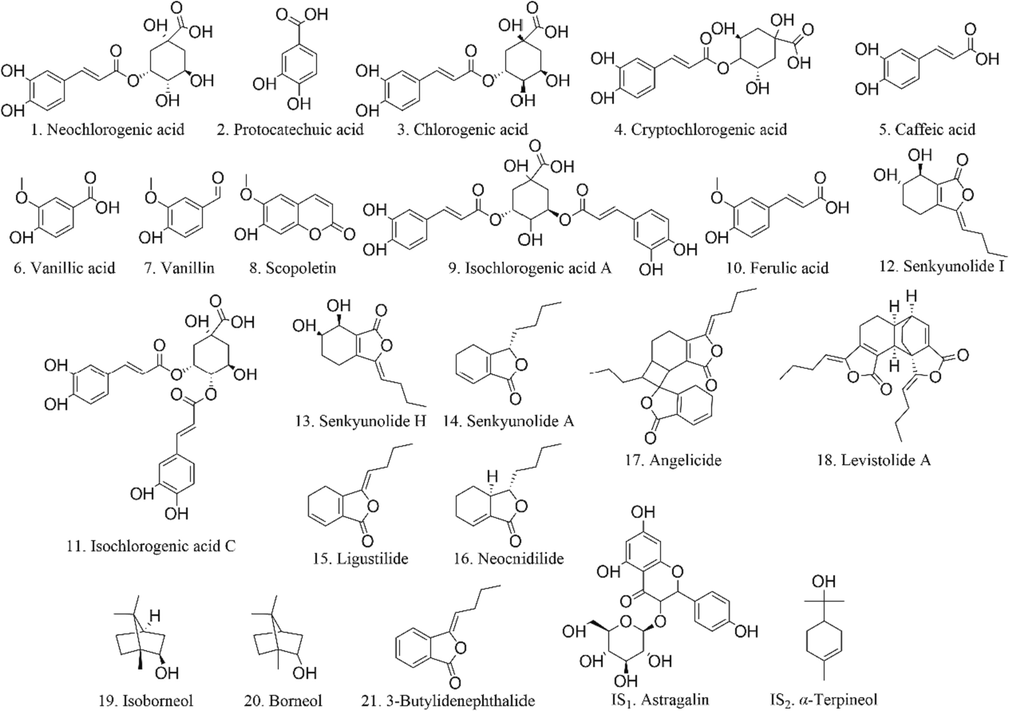
The chemical structure of twenty-one analytes and two ISs.
2 Material and methods
2.1 Reagents, chemicals, and materials
LC-grade methanol and acetonitrile were purchased from Fisher Chemical (Fairlawn, OSU, USA). LC-grade formic acid was bought from Anaqua Chemicals Supply (Wilmington, DE, USA). Ultrapure water was produced by Milipore Milli-Q water purification system (Milford, MA, USA). Neochlorogenic acid, protocatechuic acid, chlorogenic acid, cryptochlorogenic acid, caffeic acid, vanillic acid, vanillin, scopoletin, isochlorogenic acid A, ferulic acid, isochlorogenic acid C, senkyunolide Ⅰ, senkyunolide H, senkyunolide A, neocnidilide, angelicide, levistolide A, 3-butylidenephthalide, astragalin (internal standard, IS1) and α-terpineol (IS2) were purchased from Chengdu Desite Bio-Technology Co., Ltd. (Chengdu, Sichuan, China). Ligustilide, isoborneol, and borneol were obtained from National Institutes for Food and Drug Control (Beijing, China). The purities of above standards were all more than 98 %. Suxiao Jiuxin pills (No.611323) were provided from Tianjin Pharmaceutical Da Ren Tang Group Corporation Limited NO.6 Traditional Chinese Medicine Factory (Tianjin, China).
2.2 UPLC-QQQ-MS/MS condition
Agilent 1290 UPLC system (Santa Clar, CA, USA) was employed in this work. A Waters ACQUITY UPLC®HSS T3 column (2.1 × 100 mm, 1.8 µm) was utilized to perform separation in a 23 ℃ thermostated column compartment. The mobile phase was composed of 0.1 % formic acid aqueous solution (A) and methanol (B). The gradient elution procedure was as follow: 0 ∼ 1 min, 15 ∼ 45 % B; 6 ∼ 9 min, 86 ∼ 95 % B; post run time was set as 5 min. The flow rate was set as 0.3 mL/min, injection volume was set as 5 µL.
Agilent 6470 QQQ-MS/MS system was equipped with an air jet spray electron spray ionization (AJS ESI) ion source. Positive and negative acquisition modes with using multiple reaction monitoring (MRM) were both utilized in this analysis. The ion source parameters were set as follow: drying gas, 300 ℃; drying gas flow rate, 7 L/min; nebulizer, 35 psi; sheath gas, 350 ℃; capillary voltage, 3.5 kV. The MRM ion transition parameters of eighteen targets and IS1 were optimized (Table 1).
Compound
Retention time
(min)Precursor ion
(m/z)Product ion
(m/z)Fragmentor
voltage
(V)Collision energy
(eV)Ionization mode
Neochlorogenic acid
2.948
353.1
191.0
103
16
Negative
Protocatechuic acid
3.103
153.0
109.0
93
16
Negative
Chlorogenic acid
3.285
353.1
191.0
103
16
Negative
Cryptochlorogenic acid
3.324
353.1
173.0
113
12
Negative
Caffeic acid
3.677
179.0
135.0
98
16
Negative
Vanillic acid
3.693
167.0
152.0
80
12
Negative
Vanillin
3.958
153.1
65.1
80
28
Positive
Scopoletin
4.133
193.0
132.9
141
24
Positive
Isochlorogenic acid A
4.135
515.1
353.1
118
12
Negative
Ferulic acid
4.305
193.1
134.0
93
16
Negative
Isochlorogenic acid C
4.534
515.1
353.1
128
16
Negative
Senkyunolide I
4.921
225.1
207.0
70
4
Positive
Senkyunolide H
5.151
225.1
207.0
70
4
Positive
Senkyunolide A
6.846
193.1
91.0
80
28
Positive
Ligustilide
7.528
191.1
173.0
113
16
Positive
Neocnidilide
7.581
195.1
149.1
80
8
Positive
Angelicide
8.331
381.2
191.0
146
8
Positive
Levistolide A
8.522
381.2
191.0
93
16
Positive
Astragalin (IS1)
5.093
447.1
284.0
194
28
Negative
2.3 GC-MS condition
Shimadzu QP 2010 GC-MS (Kyoto, Japan) was equipped with an electron ionization (EI) ion source. The separation procedure was performed in a HP-5MS column (30 m × 0.25 mm × 0.25 μm). In the case of high-purity helium as carrier gas, the flow rate was set as 1.84 mL/min. The gradient heating procedure was as follow: the initial temperature was held at 110 ℃ for 4 min, and it was elevated to 140 ℃ at an increment of 40 °C/min, then elevated to 210 ℃ at an increment of 200 °C/min, thereafter, elevated to 230 ℃ at an increment of 31 ℃/min and remained for 1.2 min. The injection volume was set as 2 µL at a split ratio of 15:1.
For the mass spectrum module, the temperatures of EI ion source and the injector were set as 230℃ and 250℃, respectively. The solvent delay time was set as 5 min. The single ion monitoring (SIM) acquisition mode was applied for obtaining higher specificities of analyte (Table 2).
Compound
Retention time
(min)Monitoring ion
(m/z)Reference ion
(m/z)
Isoborneol
4.050
95.0
110.0, 93.0
Borneol
4.182
95.0
110.0, 93.0
3-Butylidenephthalide
6.784
159.0
146.0
α-Terpineol (IS2)
4.453
93.0
95.0, 59.0
2.4 Preparation of standard and quality control (QC) samples
For the UPLC-QQQ-MS/MS analysis, the stock solutions of standard references were prepared by dissolving appropriate substance with methanol to a concentration of 1 mg/mL, respectively. The working solutions were prepared by mixing appropriate stock solution of each analyte and diluting into different concentrations with methanol. Calibration standard solutions were prepared by spiking with 20 µL working solution, 20 µL IS1 (1000 ng/mL) and 20 µL formic acid into 100 µL blank plasma, subsequently, obtained mixture was extracted by the method same with “2.5. Sample Pretreatment”. The final concentrations of calibration standard solutions were at the ranges of to the concentration ranges of 0.25 ∼ 100 ng/mL (neochlorogenic acid, chlorogenic acid, cryptochlorogenic acid, caffeic acid, vanillic acid, vanillin, scopoletin, isochlorogenic acid A, isochlorogenic acid C, senkyunolide H, angelicide, levistolide A), 1.0 ∼ 400 ng/mL (protocatechuic acid), 4 ∼ 1600 ng/mL (ferulic acid, ligustilide), 2 ∼ 800 ng/mL (senkyunolide Ⅰ), 5.5 ∼ 2200 ng/mL (senkyunolide A) and 0.35 ∼ 140 ng/mL (neocnidilide), respectively. The QC samples were prepared in the same way at three concentration levels (low, medium, high). All the samples were stored in 4℃ before analysis.
For the GC-MS analysis, the stock solutions of standard references were prepared by dissolving appropriated substance with n-hexane to a concentration of 1 mg/mL, respectively. The working solutions were prepared by mixing appropriate stock solutions of each analyte and diluting into different concentration with n-hexane. Calibration standard solutions were prepared by spiking with 10 µL working solution and 10 µL IS2 (5000 ng/mL) into 100 µL blank plasma, subsequently, obtained mixture was extracted by the method same with “2.5. Sample Pretreatment”. The final concentrations of calibration standard solutions were at the ranges of 12.5 ∼ 4000 ng/mL (isoborneol and 3-butylidenephthalide) and 25 ∼ 8000 ng/mL (borneol), respectively. The QC samples were prepared in the same way at three concentration levels (low, medium, high). All the samples were stored in 4 ℃ before analysis.
2.5 Sample preparation
For UPLC-QQQ-MS/MS analysis, 20 µL IS1 (1000 ng/mL), 20 µL formic acid and 20 µL methanol were successively added into 100 µL plasma and vortexed for 1 min. The analytes extraction was operated by protein precipitation method with 800 µL acetonitrile. The mixture was vortexed for 5 min and centrifuged for 10 min at 14000 rpm. Thereafter, the supernatant was dried under flow nitrogen gas. The residue was dissolved with 100 µL methanol and vortexed for 5 min. The reconstituted mixture was centrifuged for 10 min at 14000 rpm. A liquid of 5 µL supernatant was injected into UPLC-QQQ-MS/MS system for analysis.
For GC-MS analysis, 10 µL IS2 (5000 ng/mL) and 10 µL n-hexane were successively added into 100 µL plasma and vortexed for 1 min. The analytes extraction was operated by liquid–liquid extraction method with 130 µL n-hexane. The mixture was vortexed for 5 min and centrifuged for 10 min at 14000 rpm. A liquid of 2 µL n-hexane fraction was injected into GC-MS system for analysis.
2.6 Method validation
The specificity, linearity, sensitivity, precision and accuracy, recovery, matrix effect and stability were evaluated for ensuring a high reliable quantitative method according to the US Food and Drug Administration (Xu et al., 2019, Tang et al., 2020, Zhang et al., 2022). Specificity was evaluated by comparing the chromatograms among blank plasma, medium concentration level QC sample and the plasma at 5 min after oral administration of SX. The linearity of calibration curve was plotted by using the peak areas of the analytes to IS versus concentration with a 1/X2 as weighting factor. The sensitivity was assessed by limit of quantitation (LOQ) that concentration at signal-to-noise (S/N) of 10. Six replicates of QC samples at each concentration level on the same day and three consecutive days were prepared and determined. The relative standard deviation (RSD) and relative error (RE) were calculated for expressing the intra- and inter-day precision and accuracy, respectively. The recovery was investigated by comparing the peak area of analytes in pre-treatment QC samples with corresponding pos-treatment spiked sample. The matrix effect was calculated by the peak area ratio of analytes extracted form QC samples to the equal concentration standard solution. The stability was evaluated by QC samples stored in room temperature for 4 h, autosampler for 12 h, −80℃ refrigerator for 7 days and three cycles of freeze and thaw, respectively.
2.7 Pharmacokinetic study
The male Sprague–Dawley rats (220 ± 10 g) were purchased from Beijing Huafukang Bio-Technology Co., Ltd. (Beijing, China). The animals were housed in 40 ∼ 60 % humidity, 23 ∼ 27 ℃, and 12 h dark-light cycle at the animal center of Traditional Chinese Medicine of Tianjin University. Free access to water and food were permitted to animals until 12 h before the experiment. All animals were randomly divided into two groups for LC-MS/MS and GC-MS analysis, respectively. The rats were received SX at the dosage of 600 mg/kg (dissolved by pure water to the concentration of 80 mg/mL) by oral administration after fasted for 12 h. The contents of analytes in SX were determined by the established UPLC-QQQ-MS/MS integrated with GC-MS method (Table 3). A liquid of 200 µL blood sample was obtained from ophthalmic venous plexus into heparinization centrifuged tube at pre-dose, 0.03, 0.08, 0.17, 0.25, 0.33, 0.5, 0.75, 1 h, 2 h, 4 h, 6 h, 10 h and 24 h post dosing, respectively. All blood samples were directly centrifuged at 7000 rpm for 10 min. The plasma layer was then transferred into clean tube and stored at −80℃ before use. All animal studies were conducted under the guidance of Laboratory Animal Ethics Committee of Tianjin University of Traditional Chinese Medicine (TCM-LAEC2022028).
Compound
Content
(μg/g)
Neochlorogenic acid
1.40 ± 0.04
Protocatechuic acid
4.60 ± 0.28
Chlorogenic acid
92.07 ± 4.67
Cryptochlorogenic acid
4.03 ± 0.34
Caffeic acid
22.92 ± 1.05
Vanillic acid
9.19 ± 1.12
Vanillin
55.15 ± 3.61
Scopoletin
4.81 ± 0.34
Isochlorogenic acid A
126.40 ± 7.89
Ferulic acid
535.80 ± 18.59
Isochlorogenic acid C
6.99 ± 0.75
Senkyunolide Ⅰ
1104.26 ± 8.90
Senkyunolide H
169.41 ± 10.48
Senkyunolide A
4218.09 ± 89.76
Ligustilide
4792.16 ± 164.81
Neocnidilide
264.47 ± 11.80
Angelicide
263.27 ± 2.86
Levistolide A
658.00 ± 10.30
Isoborneol
88036.11 ± 3601.89
Borneol
143053.70 ± 5356.65
3-Butylidenephthalide
402.29 ± 24.52
2.8 Data analysis
The pharmaceutic parameters were calculated by Drug and Statistics software (DAS, version 3.0, Medical College of Wannan, China) with a non-compartment model.
3 Results and discussions
3.1 Optimization of UPLC-QQQ-MS/MS conditions and sample preparation
The stationary phase was extremely crucial for getting a satisfactory separation. The main chemical regredient of most TCMs were naturally organic products which were easily absorbed by reverse-phase stationary. For this work, two commonly used reverse stationary, Waters ACQUITY UPLC®BEH C18 (2.1 × 100 mm, 1.7 μm) and Waters ACQUITY UPLC®HSS T3 (2.1 × 100 mm, 1.8 µm), were utilized to optimize the separation of eighteen analytes. Comparatively, the Waters ACQUITY UPLC®HSS T3 chromatographic column showed a better retained performance. It was able to separate analytes within a short time. Besides, the mobile phase was also a key factor affecting the peak shape and resolution. Subsequent optimization was done by changing the kinds of mobile phase A (water and 0.1 % formic acid aqueous solution) and mobile phase B (methanol and acetonitrile). After adjusting the gradient elution program, a satisfactory separation was obtained using 0.1 % formic acid aqueous solution and methanol as mobile phase (Fig. 2).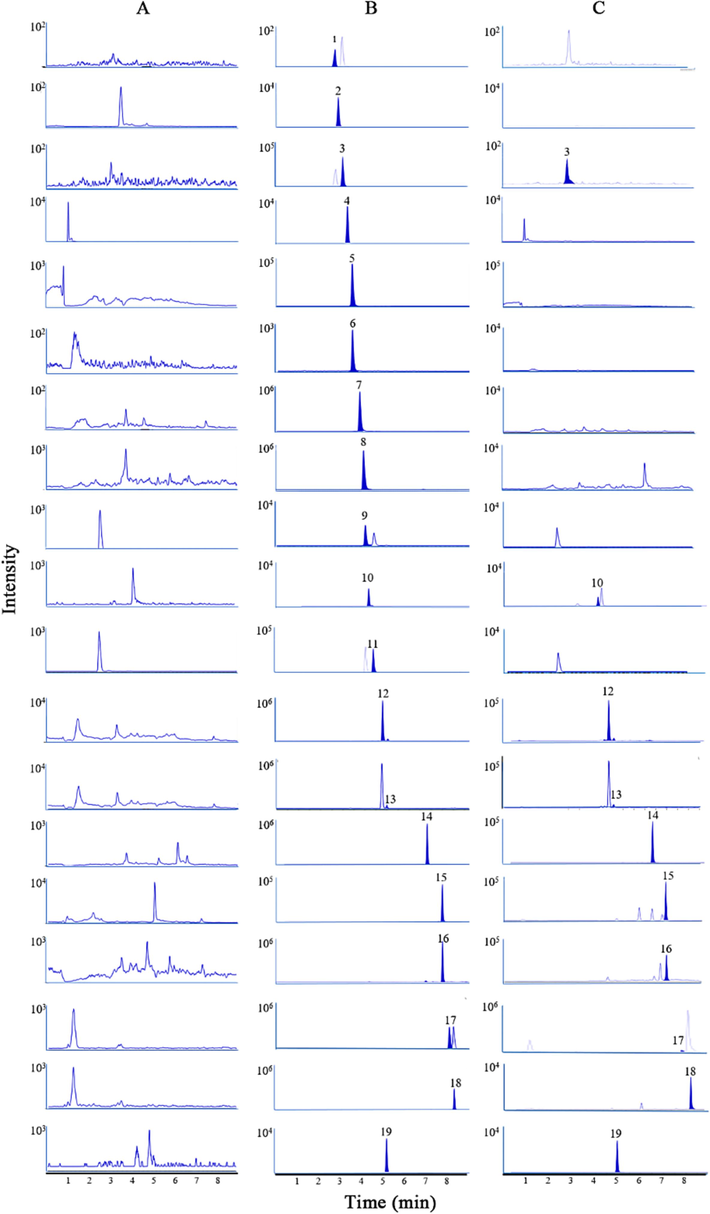
The MRM chromatograms of eighteen analytes and IS1 in blank plasma (A), blank plasma spiked with medium concentration QC (B), and plasma sample at 5 min after oral administration Suxiao Jiuxin pill (C).
Protein precipitation and liquid–liquid extraction methods were both investigated in this experiment. Meanwhile, in view of the carboxyl group of phenolic acid, which led to a strong absorption with plasma protein, the formic acid was applied in phenolic acid analytes extraction (Sun et al., 2013, Huang et al., 2017). The result showed acetonitrile possessed a higher extraction property on all analytes than methanol and ethyl acetate. For the ionization of ESI mode, the complex matrix of plasma could affect target compounds response (Ismaiel et al., 2008, Yadav et al., 2012). The optimization of redissolving reagent was a direct and effective method to minimize the interference from endogenous ingredients. As a result, methanol showed more pleasing result than acetonitrile and the mixture of methanol and acetonitrile (v:v, 1:1).
3.2 Method validation
The specificity has been investigated by comparing the chromatograms among blank plasma, blank plasma spiked with medium concentration QC, and plasma sample at 5 min after oral administration of SX. Obviously, there were no significant interferences at the same retention time of analytes and internal standards (Figs. 2 and 3). It indicated a good specificity of these detection methods.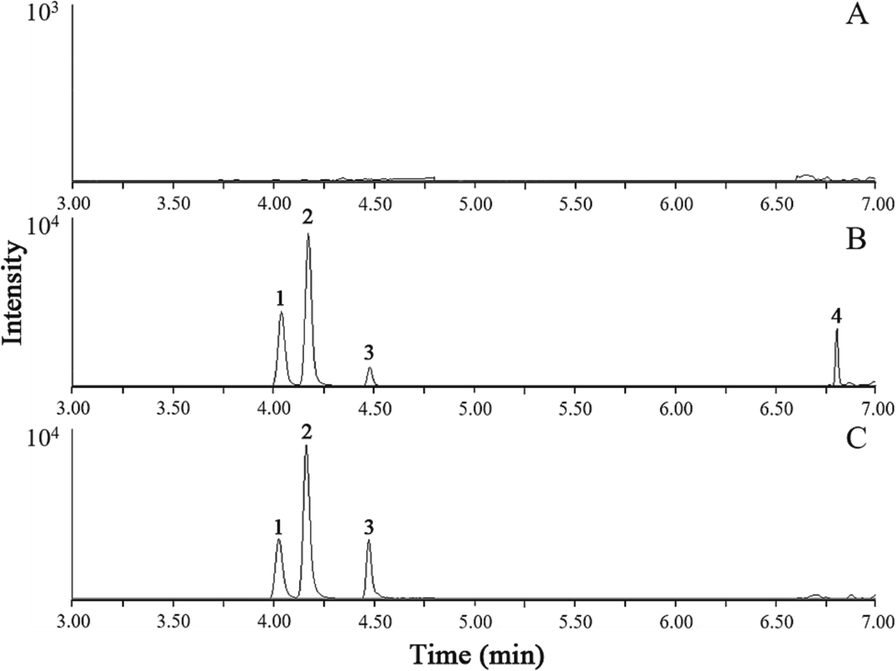
The SIM chromatograms of three analytes and IS2 in blank plasma (A), blank plasma spiked with medium concentration QC (B), and plasma sample at 5 min after oral administration Suxiao Jiuxin pill (C).
The calibration curves, correlation coefficients (R), linear ranges and LOQs of twenty-one analytes were exhibited in Table 4. All the calibration curves of analytes possessed fine correlation coefficients more than 0.995 within a certain concentration range. The LOQs of all analytes were as low as 12.5 ng/mL.
Compound
Regression equation
R
Linear range
(ng/mL)LOQ
(ng/mL)
Neochlorogenic acid
Y = 1.657780X + 8.893346E-4
0.9966
0.25 ∼ 100
0.25
Protocatechuic acid
Y = 0.552811X + 8.162655E-4
0.9961
1.00 ∼ 400
1.00
Chlorogenic acid
Y = 3.280862X + 0.004356
0.9956
0.25 ∼ 100
0.25
Cryptochlorogenic acid
Y = 0.852090X + 0.001596
0.9954
0.25 ∼ 100
0.25
Caffeic acid
Y = 2.769898X + 0.006427
0.9967
0.25 ∼ 100
0.25
Vanillic acid
Y = 0.044511X + 8.968622E-4
0.9952
0.25 ∼ 100
0.25
Vanillin
Y = 3.469706X + 0.023108
0.9970
0.25 ∼ 100
0.25
Scopoletin
Y = 15.317656X + 0.006282
0.9950
0.25 ∼ 100
0.25
Isochlorogenic acid A
Y = 1.598709X + 0.002493
0.9963
0.25 ∼ 100
0.25
Ferulic acid
Y = 0.501721X + 0.004658
0.9970
4.00 ∼ 1600
0.10
Isochlorogenic acid C
Y = 1.201293X + 8.632763E-4
0.9957
0.25 ∼ 100
0.25
Senkyunolide I
Y = 35.683544X + 0.122851
0.9974
2.00 ∼ 800
0.20
Senkyunolide H
Y = 31.909741X + 0.044144
0.9965
0.25 ∼ 100
0.25
Senkyunolide A
Y = 8.304275X + 0.016639
0.9991
5.50 ∼ 2200
0.10
Ligustilide
Y = 3.134035X + 0.013888
0.9975
4.00 ∼ 1600
0.60
Neocnidilide
Y = 6.170325X + 0.009155
0.9954
0.35 ∼ 140
0.35
Angelicide
Y = 10.949451X-0.002706
0.9960
0.25 ∼ 100
0.10
Levistolide A
Y = 28.335176X-0.007983
0.9959
0.25 ∼ 100
0.10
Isoborneol
Y = 9.080319E-3X + 1.538444E-2
0.9989
12.5 ∼ 4000
12.5
Borneol
Y = 9.182486E-3X + 4.95145E-2
0.9987
25.0 ∼ 8000
12.5
3-Butylidenephthalide
Y = 2.714534E-3X-4.088886E-3
0.9976
12.5 ∼ 4000
12.5
The QC samples at three concentration levels were used to assess the extraction recovery and matrix effect (Table5). The extraction recoveries of analytes were at the range of 61.2 ∼ 107.0 % with RSDs no more than 11.7 %. It suggested that the extraction method was parallel to obtain analytes from plasma within a wide concentration range. For the matrix effect analysis, excepted neochlorogenic acid, protocatechuic acid, chlorogenic acid, vanillic acid and scopoletin, other analytes did not possess obvious endogenous interference that matrix effect ranged from 70.7 % to 114.8 % with RSDs less than 13.7 %. For the chemical ingredients with matrix interferences, their RSDs were less than 13.7 %, which indicating a stable endogenous interference in the sample solution. In addition, the acceptable LOQs (less than 1 ng/mL) suggested the interference was not sufficient to impede their highly sensitive determination.
Compound
Concentration
(ng/mL)Extraction recovery
(%)RSD
(%)Matrix effect
(%)RSD
(%)
Neochlorogenic acid
0.5
90.7
8.6
70.4
11.0
5
81.0
9.1
69.4
3.8
80
75.9
11.7
63.2
12.9
Protocatechuic acid
2
84.0
5.5
41.2
5.6
20
86.7
6.2
31.9
4.9
320
86.1
5.6
30.1
7.4
Chlorogenic acid
0.5
88.1
5.1
82.3
13.7
5
85.6
5.5
70.3
10.8
80
81.2
4.6
67.0
6.2
Cryptochlorogenic acid
0.5
94.8
8.8
97.8
9.4
5
87.0
6.3
82.2
13.7
80
85.5
3.1
71.8
8.0
Caffeic acid
0.5
89.4
6.4
88.6
9.9
5
87.3
10.1
70.7
7.6
80
86.1
7.4
71.1
7.4
Vanillic acid
0.5
78.5
9.7
65.8
13.4
5
73.2
9.6
67.6
12.7
80
71.9
5.5
60.6
8.3
Vanillin
0.5
76.9
7.7
109.4
8.6
5
65.4
2.5
80.5
3.8
80
61.2
5.5
84.3
11.9
Scopoletin
0.5
85.9
10.2
67.6
6.8
5
89.0
3.1
71.7
2.0
80
93.0
2.8
77.1
6.0
Isochlorogenic acid A
0.5
106.4
8.7
107.4
13.6
5
90.4
6.8
110.1
12.1
80
90.2
3.6
82.9
5.5
Ferulic acid
8
102.5
11.0
81.8
13.3
80
87.5
5.2
72.6
4.4
1280
92.2
3.6
71.7
5.9
Isochlorogenic acid C
0.5
99.8
7.4
110.8
12.9
5
94.5
9.8
104.9
6.6
80
86.5
8.9
97.0
9.7
Senkyunolide Ⅰ
4
91.2
3.6
88.5
5.4
40
95.3
3.8
88.6
1.6
640
97.7
4.3
79.6
8.9
Compound
Concentration
(ng/mL)Extraction recovery
(%)RSD
(%)Matrix effect
(%)RSD
(%)
Senkyunolide H
0.5
107.0
9.2
92.3
12.7
5
100.3
8.4
84.8
4.0
80
101.3
5.8
81.6
6.4
Senkyunolide A
11
75.6
4.1
96.2
5.0
110
76.9
4.8
88.3
2.2
1760
81.4
3.9
79.3
9.5
Ligustilide
8
75.2
3.8
89.8
3.8
80
66.2
3.8
80.9
3.7
1280
73.9
6.8
71.6
5.1
Neocnidilide
0.7
93.2
11.0
96.8
11.0
7
80.6
7.0
88.5
6.3
112
80.1
8.3
76.8
10.1
Angelicide
0.5
98.9
10.5
107.9
8.5
5
83.5
7.2
101.2
10.0
80
86.7
10.4
83.9
9.5
Levistolide A
0.5
95.5
5.6
100.1
12.9
5
87.0
5.3
114.8
4.2
80
83.8
8.3
100.8
9.3
Isoborneol
25
82.4
2.3
104.6
4.9
250
88.9
4.9
89.3
3.9
3200
93.3
2.0
87.9
3.7
Borneol
50
81.6
1.4
103.9
7.7
500
85.8
4.3
92.9
4.8
6400
91.6
2.2
89.5
3.8
3-Butylidenephthalide
25
100.9
3.4
94.1
7.1
250
94.3
6.6
94.9
11.4
3200
91.2
5.6
88.4
4.5
The intra- and inter-precision and accuracy were assayed by six replicates of QC samples at three concentration levels on the same day (intra-day) and after three consecutive days (inter-day). The calibration curve constructed on the same testing day were used for assessment. The ranges of intra- and inter-precision were 0.4 ∼ 7.9 % and 0.8 ∼ 9.0 %, respectively, with accuracy within ± 12 % for all QC samples (Table 6).
Compounds
QC
concentration
(ng/mL)Intra-precision
Inter-precision
Measured
concentration
(ng/mL)RSD
(%)RE
(%)Measured
concentration
(ng/mL)RSD
(%)RE
(%)
Neochlorogenic acid
0.5
0.51 ± 0.02
3.8
2.0
0.51 ± 0.02
3.7
1.2
5
4.95 ± 0.31
6.3
−1.0
4.95 ± 0.14
2.9
−1.0
80
84.14 ± 2.29
2.7
5.2
85.58 ± 5.55
6.5
11.3
Protocatechuic acid
2
2.06 ± 0.02
1.2
3.1
2.04 ± 0.03
1.7
2.0
20
19.42 ± 0.39
2.0
−2.9
19.51 ± 0.54
2.8
−2.5
320
341.17 ± 13.65
4.0
6.6
346.39 ± 8.48
2.4
6.9
Chlorogenic acid
0.5
0.52 ± 0.02
4.0
4.2
0.53 ± 0.03
5.3
5.8
5
4.86 ± 0.10
2.1
−2.9
4.75 ± 0.37
7.8
−4.9
80
86.96 ± 2.99
3.4
8.7
85.70 ± 6.30
7.4
5.8
Cryptochlorogenic acid
0.5
0.51 ± 0.01
2.4
2.8
0.51 ± 0.02
3.2
1.5
5
4.88 ± 0.12
2.4
−2.5
4.82 ± 0.16
3.4
−3.6
80
87.86 ± 2.92
3.3
9.8
85.25 ± 6.17
7.2
6.9
Caffeic acid
0.5
0.51 ± 0.02
4.0
1.3
0.50 ± 0.02
3.4
0.3
5
4.86 ± 0.15
3.0
−2.7
4.87 ± 0.16
3.4
−2.7
80
84.79 ± 3.17
3.7
6.0
83.75 ± 2.56
3.1
7.2
Vanillic acid
0.5
0.51 ± 0.02
4.1
2.0
0.51 ± 0.02
4.3
2.9
5
4.92 ± 0.09
1.8
−1.6
4.84 ± 0.08
1.6
−3.1
80
85.97 ± 4.30
5.0
7.5
84.74 ± 4.26
5.0
5.2
Vanillin
0.5
0.52 ± 0.02
3.2
3.6
0.52 ± 0.01
2.3
3.6
5
4.88 ± 0.11
2.3
−2.5
4.88 ± 0.12
2.4
−2.4
80
86.00 ± 2.61
3.0
7.5
87.88 ± 3.27
3.7
10.3
Scopoletin
0.5
0.53 ± 0.02
4.2
5.4
0.51 ± 0.02
4.4
2.7
5
4.86 ± 0.14
2.9
−2.7
4.59 ± 0.26
5.6
−8.3
80
85.17 ± 2.33
2.7
6.5
87.39 ± 2.20
2.5
11.7
Isochlorogenic acid A
0.5
0.52 ± 0.02
3.0
3.1
0.51 ± 0.01
2.7
2.1
5
4.74 ± 0.11
2.2
−5.2
4.74 ± 0.25
5.2
−5.3
80
87.34 ± 3.75
4.3
9.2
84.53 ± 7.59
9.0
4.9
Ferulic acid
8
8.32 ± 0.45
5.4
4.0
8.09 ± 0.10
1.2
1.1
80
75.99 ± 1.76
2.3
−5.0
75.84 ± 1.99
2.6
−5.2
1280
1296.80 ± 43.41
3.3
1.3
1317.94 ± 54.60
4.1
5.4
Isochlorogenic acid C
0.5
0.51 ± 0.02
3.3
2.1
0.51 ± 0.02
3.2
2.9
5
4.84 ± 0.11
2.2
−3.2
4.83 ± 0.10
2.0
−3.4
80
85.78 ± 3.12
3.6
7.2
81.68 ± 5.36
6.6
4.6
Senkyunolide Ⅰ
4
3.97 ± 0.01
0.4
−0.6
3.95 ± 0.03
0.8
−1.2
40
38.55 ± 1.55
4.0
−3.6
38.05 ± 1.72
4.5
−4.9
640
666.27 ± 15.42
2.3
4.1
672.99 ± 14.05
2.1
5.9
Compounds
QC
concentration
(ng/mL)Intra-precision
Inter-precision
Measured
concentration
(ng/mL)RSD
(%)RE
(%)Measured
concentration
(ng/mL)RSD
(%)RE
(%)
Senkyunolide H
0.5
0.50 ± 0.03
5.4
0.1
0.52 ± 0.02
3.8
3.4
5
5.00 ± 0.11
2.3
0.0
5.01 ± 0.16
3.2
0.3
80
83.67 ± 2.91
3.5
4.6
83.01 ± 3.82
4.6
7.9
Senkyunolide A
11
11.23 ± 0.61
5.4
2.1
11.06 ± 0.60
5.4
0.5
110
117.49 ± 4.74
4.0
6.8
118.57 ± 1.45
1.2
7.8
1760
1653.86 ± 55.95
3.4
−6.0
1677.45 ± 40.75
2.4
−1.3
Ligustilide
8
8.44 ± 0.37
4.3
5.5
8.04 ± 0.22
2.8
0.5
80
86.13 ± 2.20
2.5
7.7
85.48 ± 3.54
4.1
6.9
1280
1241.47 ± 38.21
3.1
−3.0
1269.69 ± 54.96
4.3
3.9
Neocnidilide
0.7
0.73 ± 0.04
5.4
4.8
0.70 ± 0.02
2.8
−0.3
7
7.07 ± 0.42
6.0
0.9
7.11 ± 0.51
7.2
1.6
112
115.28 ± 4.11
3.6
2.9
118.69 ± 6.19
5.2
8.6
Angelicide
0.5
0.54 ± 0.01
1.7
7.7
0.53 ± 0.02
4.3
5.9
5
4.84 ± 0.09
1.9
−3.2
4.94 ± 0.24
4.9
−1.1
80
83.98 ± 2.12
2.5
5.0
85.99 ± 3.21
3.7
4.7
Levistolide A
0.5
0.53 ± 0.03
5.6
6.8
0.53 ± 0.04
7.6
6.4
5
4.90 ± 0.16
3.2
−2.1
5.07 ± 0.16
3.2
1.4
80
83.34 ± 2.90
3.5
4.2
87.43 ± 3.08
3.5
6.3
Isoborneol
25
25.08 ± 0.89
3.6
0.3
25.06 ± 0.78
3.1
0.2
250
248.38 ± 4.20
1.7
−0.6
249.58 ± 4.19
1.7
−0.2
3200
3114.59 ± 29.02
0.9
−2.7
3152.00 ± 73.30
2.3
−1.5
Borneol
50
49.58 ± 1.81
3.7
−0.8
49.59 ± 1.48
3.0
−0.8
500
502.12 ± 7.11
1.4
0.4
499.28 ± 10.62
2.1
−0.1
6400
6229.72 ± 56.50
0.9
−2.7
6300.37 ± 134.74
2.1
−1.6
3-Butylidenephthalide
25
25.65 ± 2.02
7.9
2.6
25.42 ± 1.18
4.6
1.7
250
245.34 ± 12.16
5.0
−1.9
256.23 ± 4.27
1.7
2.5
3200
3391.50 ± 77.92
2.3
6.0
3429.98 ± 90.46
2.6
7.2
The results of the stability stored in room temperature for 4 h, autosampler for 12 h, −80℃ refrigerator for 7 days, and three cycles of freeze and thaw were listed in Table 7. All values were within the acceptable range of less than 12 %.
Compound
QC
concentration
(ng/mL)Room temperature for 4 h
Autosampler for 12 h
Three cycles of freeze and thaw
−80℃ refrigerator for 7 days
Measured
concentration
(ng/mL)RSD
(%)Measured
concentration
(ng/mL)RSD
(%)Measured
concentration
(ng/mL)RSD
(%)Measured
concentration
(ng/mL)RSD
(%)
Neochlorogenic acid
0.5
0.52 ± 0.03
5.6
0.52 ± 0.03
5.7
0.50 ± 0.02
3.0
0.49 ± 0.01
2.7
5
5.00 ± 0.14
2.8
5.01 ± 0.03
0.6
4.96 ± 0.13
2.5
4.94 ± 0.13
2.6
80
89.05 ± 4.99
5.6
82.67 ± 6.18
7.5
83.75 ± 4.54
5.4
82.72 ± 6.45
7.8
Protocatechuic acid
2
2.06 ± 0.10
4.8
2.02 ± 0.08
4.2
1.99 ± 0.06
2.9
2.01 ± 0.07
3.7
20
20.66 ± 1.13
5.5
19.62 ± 0.44
2.2
19.55 ± 0.84
4.3
19.45 ± 0.32
1.7
320
342.08 ± 10.62
3.1
334.34 ± 14.30
4.3
348.03 ± 10.45
3.0
344.46 ± 3.70
1.1
Chlorogenic acid
0.5
0.54 ± 0.03
5.6
0.54 ± 0.02
3.1
0.52 ± 0.04
7.2
0.52 ± 0.02
3.4
5
5.08 ± 0.20
4.0
4.83 ± 0.23
4.8
4.82 ± 0.28
5.8
4.77 ± 0.15
3.2
80
84.66 ± 3.94
4.7
82.19 ± 4.02
4.9
83.77 ± 4.21
5.0
81.48 ± 6.52
8.0
Cryptochlorogenic acid
0.5
0.52 ± 0.02
4.0
0.52 ± 0.03
5.3
0.53 ± 0.01
2.7
0.51 ± 0.02
3.1
5
4.98 ± 0.12
2.4
4.76 ± 0.39
8.2
4.98 ± 0.11
2.1
4.98 ± 0.11
2.2
80
85.50 ± 3.67
4.3
82.54 ± 2.14
2.6
82.80 ± 3.22
3.9
80.51 ± 4.33
5.4
Caffeic acid
0.5
0.52 ± 0.02
4.8
0.52 ± 0.02
3.6
0.52 ± 0.02
3.8
0.52 ± 0.04
6.8
5
4.87 ± 0.13
2.7
4.90 ± 0.15
3.0
4.99 ± 0.09
1.7
4.88 ± 0.16
3.4
80
85.78 ± 4.15
4.8
82.57 ± 2.37
2.9
83.22 ± 4.06
4.9
83.06 ± 1.49
1.8
Vanillic acid
0.5
0.51 ± 0.03
5.8
0.51 ± 0.02
4.5
0.50 ± 0.02
3.8
0.51 ± 0.02
3.3
5
4.86 ± 0.15
3.1
4.97 ± 0.11
2.2
4.99 ± 0.09
1.7
4.93 ± 0.08
1.5
80
84.18 ± 3.45
4.1
85.83 ± 0.98
1.1
86.14 ± 3.63
4.2
89.00 ± 6.61
7.4
Compound
QC
concentration
(ng/mL)Room temperature for 4h
Autosampler for 12h
Three cycles of freeze and thaw
−80℃ refrigerator for 7 days
Measured
concentration
(ng/mL)RSD
(%)Measured
concentration
(ng/mL)RSD
(%)Measured
concentration
(ng/mL)RSD
(%)Measured
concentration
(ng/mL)RSD
(%)
Vanillin
0.5
0.51 ± 0.02
3.4
0.51 ± 0.02
4.5
0.50 ± 0.02
3.8
0.50 ± 0.02
4.2
5
4.89 ± 0.10
2.1
4.92 ± 0.15
3.1
4.92 ± 0.15
3.0
4.95 ± 0.03
0.7
80
88.27 ± 1.64
1.9
87.51 ± 4.34
5.0
88.77 ± 1.62
1.8
88.08 ± 3.68
4.2
Scopoletin
0.5
0.53 ± 0.02
3.6
0.51 ± 0.03
5.6
0.51 ± 0.04
7.5
0.53 ± 0.02
4.6
5
4.56 ± 0.16
3.5
4.66 ± 0.09
1.9
4.80 ± 0.12
2.5
4.88 ± 0.30
6.1
80
89.34 ± 1.48
1.7
87.03 ± 3.82
4.4
90.04 ± 2.98
3.3
87.59 ± 1.98
2.3
Isochlorogenic acid A
0.5
0.50 ± 0.01
2.9
0.51 ± 0.02
4.0
0.52 ± 0.02
4.6
0.52 ± 0.02
3.1
5
4.76 ± 0.16
3.3
4.80 ± 0.05
1.0
4.89 ± 0.09
1.8
4.66 ± 0.12
2.5
80
83.92 ± 4.93
5.9
81.53 ± 4.31
5.3
83.09 ± 4.84
5.8
79.27 ± 9.08
11.5
Ferulic acid
8
8.37 ± 0.33
3.9
7.99 ± 0.13
1.7
8.69 ± 0.77
8.8
8.74 ± 0.89
10.2
80
77.67 ± 0.87
1.1
74.60 ± 2.38
3.2
76.17 ± 2.20
2.9
77.84 ± 1.07
1.4
1280
1348.86 ± 22.80
1.7
1319.26 ± 34.02
2.6
1343.67 ± 27.72
2.1
1330.91 ± 24.13
1.8
Isochlorogenic acid C
0.5
0.50 ± 0.05
10.1
0.53 ± 0.02
4.2
0.51 ± 0.01
2.1
0.52 ± 0.02
4.8
5
4.70 ± 0.15
3.1
4.72 ± 0.07
1.4
4.74 ± 0.10
2.2
4.82 ± 0.10
2.1
80
83.69 ± 4.56
5.4
78.00 ± 4.30
5.5
80.77 ± 6.12
7.6
81.62 ± 4.27
5.2
Senkyunolide Ⅰ
4
3.97 ± 0.06
1.5
3.81 ± 0.13
3.4
3.94 ± 0.13
3.4
3.97 ± 0.26
6.4
40
38.25 ± 0.49
1.3
34.77 ± 1.08
3.1
36.77 ± 1.49
4.0
42.69 ± 1.27
3.0
640
677.47 ± 13.15
1.9
670.73 ± 13.65
2.0
677.34 ± 19.14
2.8
679.18 ± 9.52
1.4
Compound
QC
concentration
(ng/mL)Room temperature for 4h
Autosampler for 12h
Three cycles of freeze and thaw
−80℃ refrigerator for 7 days
Measured
concentration
(ng/mL)RSD
(%)Measured
concentration
(ng/mL)RSD
(%)Measured
concentration
(ng/mL)RSD
(%)Measured
concentration
(ng/mL)RSD
(%)
Senkyunolide H
0.5
0.52 ± 0.04
6.8
0.52 ± 0.03
4.9
0.52 ± 0.02
4.4
0.51 ± 0.02
3.5
5
4.97 ± 0.15
3.1
4.77 ± 0.31
6.6
4.83 ± 0.19
4.0
5.11 ± 0.07
1.3
80
86.30 ± 3.01
3.5
82.98 ± 3.64
4.4
83.74 ± 4.13
4.9
85.72 ± 3.11
3.6
Senkyunolide A
11
11.57 ± 0.26
2.2
11.03 ± 0.49
4.4
11.38 ± 0.65
5.7
11.16 ± 0.62
5.6
110
118.29 ± 1.35
1.1
116.28 ± 3.44
3.0
117.62 ± 3.94
3.3
118.44 ± 2.66
2.2
1760
1737.56 ± 48.37
2.8
1646.73 ± 47.86
2.9
1680.98 ± 41.92
2.5
1630.76 ± 49.26
3.0
Ligustilide
8
8.46 ± 0.38
4.5
8.18 ± 0.40
4.9
8.31 ± 0.21
2.6
9.02 ± 0.91
10.0
80
85.96 ± 1.48
1.7
81.94 ± 2.73
3.3
87.57 ± 1.99
2.3
79.01 ± 3.90
4.9
1280
1329.33 ± 45.90
3.5
1245.63 ± 37.54
3.0
1285.94 ± 35.48
2.8
1271.64 ± 44.50
3.5
Neocnidilide
0.7
0.70 ± 0.02
3.5
0.70 ± 0.02
2.9
0.74 ± 0.04
4.8
0.77 ± 0.02
2.7
7
7.59 ± 0.15
2.0
6.78 ± 0.19
2.8
7.24 ± 0.30
4.1
7.67 ± 0.12
1.6
112
121.60 ± 3.45
2.8
118.68 ± 3.19
2.7
122.69 ± 2.34
1.9
122.03 ± 3.99
3.3
Angelicide
0.5
0.54 ± 0.04
6.9
0.55 ± 0.03
6.0
0.57 ± 0.03
5.7
0.54 ± 0.02
4.3
5
4.78 ± 0.10
2.1
4.91 ± 0.10
2.0
4.84 ± 0.07
1.4
5.14 ± 0.10
2.0
80
83.78 ± 5.86
7.0
85.58 ± 1.76
2.1
84.56 ± 5.61
6.6
87.86 ± 4.78
5.4
Levistolide A
0.5
0.53 ± 0.04
7.4
0.53 ± 0.03
5.7
0.57 ± 0.02
3.7
0.54 ± 0.03
5.3
5
5.15 ± 0.12
2.4
5.16 ± 0.04
0.7
5.05 ± 0.16
3.2
5.15 ± 0.19
3.7
80
85.01 ± 4.36
5.1
84.69 ± 3.62
4.3
84.22 ± 8.85
10.5
91.39 ± 3.79
4.1
Compound
QC
concentration
(ng/mL)Room temperature for 4h
Autosampler for 12h
Three cycles of freeze and thaw
−80℃ refrigerator for 7 days
Measured
concentration
(ng/mL)RSD
(%)Measured
concentration
(ng/mL)RSD
(%)Measured
concentration
(ng/mL)RSD
(%)Measured
concentration
(ng/mL)RSD
(%)
Isoborneol
25
24.14 ± 1.17
4.9
25.66 ± 1.27
4.9
24.67 ± 1.94
7.9
25.48 ± 1.35
5.3
250
252.12 ± 6.19
2.5
250.99 ± 7.18
2.9
247.24 ± 12.05
4.9
250.38 ± 5.20
2.1
3200
3117.53 ± 25.01
0.8
3098.90 ± 32.22
1.0
3134.30 ± 25.12
0.8
3125.04 ± 32.53
1.0
Borneol
50
49.74 ± 2.80
5.6
50.53 ± 2.24
4.4
49.50 ± 2.99
6.0
49.70 ± 2.83
5.7
500
509.30 ± 10.87
2.1
505.40 ± 12.91
2.6
501.61 ± 20.48
4.1
507.35 ± 11.47
2.3
6400
6232.85 ± 55.11
0.9
6206.13 ± 68.75
1.1
6264.82 ± 51.79
0.8
6246.82 ± 65.27
1.0
3-Butylidenephthalide
25
25.73 ± 1.08
4.2
25.84 ± 1.81
7.0
25.70 ± 1.34
5.2
25.67 ± 1.43
5.6
250
251.94 ± 8.28
3.3
242.82 ± 9.86
4.1
254.31 ± 11.84
4.7
242.58 ± 7.41
3.1
3200
3347.64 ± 118.84
3.5
3469.18 ± 133.76
3.9
3423.95 ± 183.00
5.3
3407.04 ± 169.17
5.0
3.3 Pharmacokinetic study
The validated UPLC-QQQ-MS/MS integrated with GC-MS method was employed to quantify twenty-one compounds in rat plasma after oral administration of SX. The mean plasma concentration – time curves were visualized by GraphPad Prism 8.0.2 software (Fig. 4). Unfortunately, there were some compounds whose plasma concentration was too low to describe an intact pharmacokinetic profile, such as neochlorogenic acid, protocatechuic acid, chlorogenic acid, etc. It might be caused by their low content in Suxiao Jiuxin Pill. Ultimately, the pharmacokinetic parameters of nine analytes were analyzed by DAS software with non-compartment model (Table 8).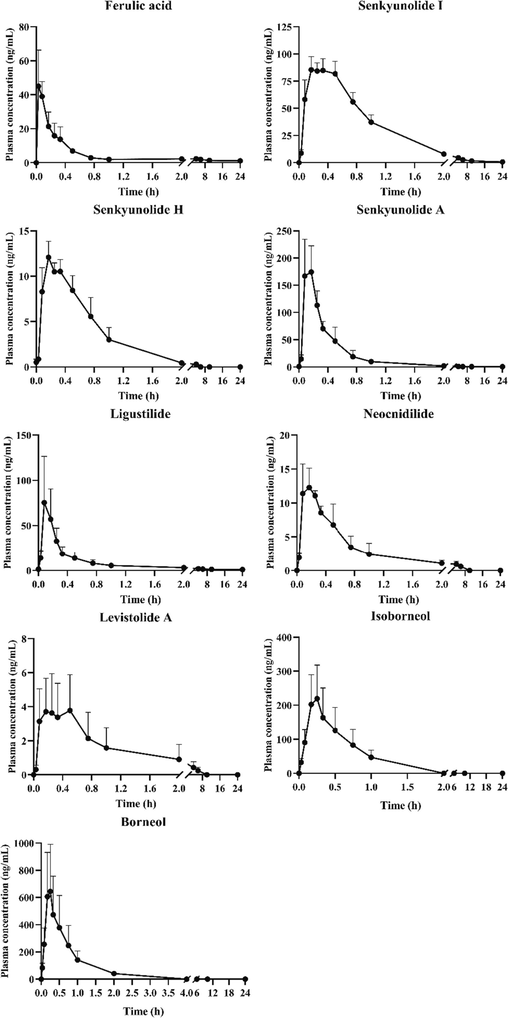
The plasma concentration–time curves of analytes (n = 6, mean ± SD).
Compound
Tmax (h)
Cmax (μg/L)
T1/2z (h)
AUC (0-tn) (μg/L*h)
AUC (0-∞) (μg/L*h)
Ferulic acid
0.07 ± 0.03
50.07 ± 16.24
0.63 ± 0.03
47.21 ± 10.86
58.49 ± 18.20
Senkyunolide Ⅰ
0.35 ± 0.13
96.42 ± 5.91
0.58 ± 0.02
134.19 ± 17.30
140.15 ± 20.62
Senkyunolide H
0.22 ± 0.07
12.49 ± 1.32
0.85 ± 0.02
10.08 ± 1.15
10.08 ± 1.15
Senkyunolide A
0.10 ± 0.03
200.51 ± 33.27
0.35 ± 0.05
80.63 ± 31.02
94.54 ± 51.02
Ligustilide
0.10 ± 0.03
88.74 ± 45.52
0.70 ± 0.10
53.55 ± 41.27
70.16 ± 69.96
Neocnidilide
0.11 ± 0.04
13.79 ± 1.50
0.72 ± 0.05
12.91 ± 3.14
12.91 ± 3.14
Levistolide A
0.33 ± 0.19
5.24 ± 1.46
1.08 ± 0.68
6.55 ± 4.10
6.55 ± 4.10
Isoborneol
0.22 ± 0.04
233.61 ± 93.38
0.31 ± 0.02
139.41 ± 57.40
139.41 ± 57.40
Borneol
0.22 ± 0.04
683.35 ± 330.42
0.29 ± 0.01
474.62 ± 210.47
474.62 ± 210.47
The maximum plasma concentration (Cmax) was tightly bound to the clinical application of drug. Only when the plasma concentration reached therapeutic concentration could it take the effect. The Cmax from high to low were borneol (683.35 μg/L), isoborneol (233.61 μg/L), senkyunolide A (200.51 μg/L), senkyunolide Ⅰ (96.42 μg/L), ligustilide (88.74 μg/L), ferulic acid (50.07 μg/L), neocnidilide (13.79 μg/L), senkyunolide H (12.49 μg/L), and levistolide A (5.24 μg/L). Area under concentration–time curve (AUC (0-tn) and AUC (0-∞)) reflected the total exposure of analytes in plasma. The AUCs of senkyunolide Ⅰ, senkyunolide A, ferulic acid, ligustilide, borneol and isoborneol were greater than 47.2 μg/L*h, which suggesting they possessed high exposure in vivo. It might be due to the higher content in SX. The time about reaching Cmax (Tmax) of all analytes were within 0.4 h, which indicated the active ingredients in SX could be rapidly absorbed into blood and build up to therapeutic concentration. Half-life (T1/2z) represented the rate of drug clearance in vivo. All analytes possessed short T1/2z values ranging from 0.29 to 1.24 h. The rapid absorbed and distributed would provide a rapid effect on acute cardiovascular diseases. What’s more, it could be found that the Tmax and T1/2z values of borneol and isoborneol, ligustilide and neocnidilide were closely similar, but their doses were quite different. The reason for this phenomenon was probably due to their similar chemical structure.
4 Conclusion
In this study, a sensitive, effective and comprehensive method was developed to quantify twenty-one compounds in rat plasma for studying pharmacokinetic of SX. This validated method was successfully employed to describe pharmacokinetic profiles of nine chemical ingredients. After oral administration of SX at the dosage of 600 mg/kg, the Cmax was 50.07 μg/L for ferulic acid, 96.42 μg/L for senkyunolide Ⅰ, 12.49 μg/L for senkyunolide H, 200.51 μg/L for senkyunolide A, 88.74 μg/L for ligustilide, 13.79 μg/L for neocnidilide, 5.24 μg/L for levistolide A, 233.61 μg/L for isoborneol, 683.35 μg/L for borneol. The Tmax of all analytes were lower than 0.53 h. Their T1/2z ranged from 0.29 ∼ 1.08 h.
The pharmacokinetic property of SX were comprehensively investigated. This finding would provide scientific guide mechanism of action and pharmacological effects on acute myocardial infarction of SX.
Acknowledgments
This study was supported by Science and Technology Project of Haihe Laboratory of Modern Chinese Medicine (22HHZYJC00005).
Declaration of Competing Interest
The authors declare that they have no known competing financial interests or personal relationships that could have appeared to influence the work reported in this paper.
References
- Anticancer, Cardio-Protective and Anti-Inflammatory Potential of Natural-Sources-Derived Phenolic Acids. Molecules (basel, Switzerland).. 2022;27
- [CrossRef] [Google Scholar]
- Drug-induced hyperuricaemia and gout. Rheumatology (Oxford). 2017;56:679-688.
- [CrossRef] [Google Scholar]
- Ligustilide induces vasodilatation via inhibiting voltage dependent calcium channel and receptor-mediated Ca2+ influx and release. Vasc.Pharmacol.. 2006;45:171-176.
- [CrossRef] [Google Scholar]
- Relaxation effects of ligustilide and senkyunolide A, two main constituents of Ligusticum chuanxiong, in rat isolated aorta. J. Ethnopharmacol.. 2007;111:677-680.
- [CrossRef] [Google Scholar]
- A systematic review on the rhizome of Ligusticum chuanxiong Hort. (Chuanxiong) Food Chem. Toxicol.. 2018;119:309-325.
- [CrossRef] [Google Scholar]
- Aspirin challenge and desensitization: how, when and why. Curr. Opin. Allergy Clin. Immunol.. 2017;17:247-254.
- [CrossRef] [Google Scholar]
- Mechanical Complications of Acute Myocardial Infarction: A Scientific Statement From the American Heart Association. Circulation. 2021;144:e16-e35.
- [CrossRef] [Google Scholar]
- Mechanical Complications of Acute Myocardial Infarction: A Review. JAMA Cardiol.. 2021;6:341-349.
- [CrossRef] [Google Scholar]
- Evaluation of the effect of Shengxian Decoction on doxorubicin-induced chronic heart failure model rats and a multicomponent comparative pharmacokinetic study after oral administration in normal and model rats. Biomedicine & Pharmacotherapy = Biomedecine & Pharmacotherapie.. 2021;144:112354
- [CrossRef] [Google Scholar]
- A UPLC-MS/MS Method for Simultaneous Determination of Free and Total Forms of a Phenolic Acid and Two Flavonoids in Rat Plasma and Its Application to Comparative Pharmacokinetic Studies of Polygonum capitatum Extract in Rats. Molecules (basel, Switzerland).. 2017;22
- [CrossRef] [Google Scholar]
- Monitoring phospholipids for assessment of ion enhancement and ion suppression in ESI and APCI LC/MS/MS for chlorpheniramine in human plasma and the importance of multiple source matrix effect evaluations. Journal of chromatography. B, Analytical Technologies in the Biomedical and Life Sciences.. 2008;875:333-343.
- [CrossRef] [Google Scholar]
- Ethanolic extract of rhizome of Ligusticum chuanxiong Hort. (chuanxiong) enhances endothelium-dependent vascular reactivity in ovariectomized rats fed with high-fat diet. Food Funct.. 2014;5:2475-2485.
- [CrossRef] [Google Scholar]
- GC-MS method for determination and pharmacokinetic study of seven volatile constituents in rat plasma after oral administration of the essential oil of Rhizoma Curcumae. J. Pharm. Biomed. Anal.. 2018;149:577-585.
- [CrossRef] [Google Scholar]
- Shuxuening injection facilitates neurofunctional recovery via down-regulation of G-CSF-mediated granulocyte adhesion and diapedesis pathway in a subacute stroke mouse model. Biomedicine & Pharmacotherapy = Biomedecine & Pharmacotherapie.. 2020;127:110213
- [CrossRef] [Google Scholar]
- Ligustrazine attenuates inflammation and oxidative stress in a rat model of arthritis via the Sirt1/NF-κB and Nrf-2/HO-1 pathways. Arch. Pharm. Res.. 2019;42:824-831.
- [CrossRef] [Google Scholar]
- Analysis of four alkaloids of Coptis chinensis in rat plasma by high performance liquid chromatography with electrochemical detection. Anal. Chim. Acta. 2012;737:99-104.
- [CrossRef] [Google Scholar]
- Borneol in cardio-cerebrovascular diseases: Pharmacological actions, mechanisms, and therapeutics. Pharmacol. Res.. 2021;169:105627
- [CrossRef] [Google Scholar]
- Utilization trends in traditional Chinese medicine for acute myocardial infarction. J. Ethnopharmacol.. 2019;241:112010
- [CrossRef] [Google Scholar]
- The history, stereochemistry, ethnopharmacology and quality assessment of borneol. J. Ethnopharmacol.. 2023;300:115697
- [CrossRef] [Google Scholar]
- Acute effects of chlorogenic acid on nitric oxide status, endothelial function, and blood pressure in healthy volunteers: a randomized trial. J. Agric. Food Chem.. 2012;60:9130-9136.
- [CrossRef] [Google Scholar]
- Chlorogenic acid (CGA): A pharmacological review and call for further research. Biomedicine & Pharmacotherapy = Biomedecine & Pharmacotherapie.. 2018;97:67-74.
- [CrossRef] [Google Scholar]
- Tetramethylpyrazine Protects against Hydrogen Peroxide-Provoked Endothelial Dysfunction in Isolated Rat Aortic Rings: Implications for Antioxidant Therapy of Vascular Diseases. Evid. Based Complement. Alternat. Med.. 2014;2014:627181
- [CrossRef] [Google Scholar]
- ZINC40099027 Promotes Gastric Mucosal Repair in Ongoing Aspirin-Associated Gastric Injury by Activating Focal Adhesion Kinase. Cells.. 2021;10
- [CrossRef] [Google Scholar]
- Efficacy of Suxiao Jiuxin Pill on Coronary Heart Disease: A Meta-Analysis of Randomized Controlled Trials. Evid. Based Complement. Alternat. Med.. 2018;2018:9745804.
- [CrossRef] [Google Scholar]
- Suxiao Jiuxin pill promotes exosome secretion from mouse cardiac mesenchymal stem cells in vitro. Acta Pharmacol. Sin.. 2018;39:569-578.
- [CrossRef] [Google Scholar]
- Serum proteomic analysis reveals the cardioprotective effects of Shexiang Baoxin Pill and Suxiao Jiuxin Pill in a rat model of acute myocardial infarction. J. Ethnopharmacol.. 2022;293:115279
- [CrossRef] [Google Scholar]
- Simultaneous determination of four flavonoids and one phenolic acid in rat plasma by LC-MS/MS and its application to a pharmacokinetic study after oral administration of the Herba Desmodii Styracifolii extract. Journal of Chromatography B, Analytical Technologies in the Biomedical and Life Sciences.. 2013;932:66-73.
- [CrossRef] [Google Scholar]
- In vivo Pharmacokinetic Drug-Drug Interaction Studies Between Fedratinib and Antifungal Agents Based on a Newly Developed and Validated UPLC/MS-MS Method. Front. Pharmacol.. 2020;11:626897
- [CrossRef] [Google Scholar]
- Abnormal cardiovascular response to nitroglycerin in migraine. Cephalalgia : an International Journal of Headache.. 2020;40:266-277.
- [CrossRef] [Google Scholar]
- Effects of Shexiang Baoxin Pill for Coronary Microvascular Function: A Systematic Review and Meta-Analysis. Front. Pharmacol.. 2021;12:751050
- [CrossRef] [Google Scholar]
- Pharmacokinetic and tissue distribution of paclitaxel in rabbits assayed by LC-UV after intravenous administration of its novel liposomal formulation. Biomedical Chromatography : BMC.. 2014;28:204-212.
- [CrossRef] [Google Scholar]
- UPLC-MS/MS method for the simultaneous determination of imatinib, voriconazole and their metabolites concentrations in rat plasma. J. Pharm. Biomed. Anal.. 2019;166:6-12.
- [CrossRef] [Google Scholar]
- Traditional Chinese Medicine ShenZhuGuanXin Granules Mitigate Cardiac Dysfunction and Promote Myocardium Angiogenesis in Myocardial Infarction Rats by Upregulating PECAM-1/CD31 and VEGF Expression. Evid. Based Complement. Alternat. Med.. 2017;2017:5261729.
- [CrossRef] [Google Scholar]
- Comparison of extraction procedures for assessment of matrix effect for selective and reliable determination of atazanavir in human plasma by LC-ESI-MS/MS. Journal of chromatography. B, Analytical Technologies in the Biomedical and Life Sciences.. 2012;885–886:138-149.
- [CrossRef] [Google Scholar]
- Pharmacokinetic comparison of 15 active compositions in rat plasma after oral administration of raw and honey-processed Aster tataricus extracts. J. Sep. Sci.. 2021;44:908-921.
- [CrossRef] [Google Scholar]
- Tetramethylpyrazine and Paeoniflorin Inhibit Oxidized LDL-Induced Angiogenesis in Human Umbilical Vein Endothelial Cells via VEGF and Notch Pathways. Evid. Based Complement. Alternat. Med.. 2018;2018:3082507.
- [CrossRef] [Google Scholar]
- Evaluation of the inhibitory effect of quercetin on the pharmacokinetics of tucatinib in rats by a novel UPLC-MS/MS assay. Pharm. Biol.. 2022;60:621-626.
- [CrossRef] [Google Scholar]
Appendix A
Supplementary data
Supplementary data to this article can be found online at https://doi.org/10.1016/j.arabjc.2023.105397.
Appendix A
Supplementary data
The following are the Supplementary data to this article:Supplementary data 1
Supplementary data 1


