

Translate this page into:
A piezogravimetric sensor platform for sensitive detection of lead (II) ions in water based on calix[4]resorcinarene macrocycles: Synthesis, characterization and detection
⁎Corresponding author at: Research Centre for Natural Sciences of the Hungarian Academy of Sciences, Magyar tudósok körútja 2, H-1117 Bp., Hungary. eddaif.larbi1@gmail.com (Larbi Eddaif) eddaif.larbi@phd.uni-obuda.hu (Larbi Eddaif)
-
Received: ,
Accepted: ,
This article was originally published by Elsevier and was migrated to Scientific Scholar after the change of Publisher.
Peer review under responsibility of King Saud University.
Abstract
Novel enantiomeric calixresorcinarenes were synthesized and characterized. The employment of a newly developed sensitive (QCM-I) for metal ions detection tests. Calixr-coated QCM resonators effectively functioned as chemical sensors. The system produced wide linear ranges, adequate sensitivities as well as low (LOD).
Abstract
The heavy metal ions detection is a foremost concern in water sources, the conventional detection methods are either time consuming or expensive, thus the need of fast, low-cost and accurate sensing methods is growing. Based on this direction, this paper describes the synthesis of newly enantiomeric calix[4]resorcinarenes, namely: C-dec-9-enylcalix[4]resorcinarene-O-(S-)-α-methylbenzylamine (Compound B) and C-dec-9-enylcalix[4]resorcinarene-O-(R+)-α-methylbenzylamine (Compound C), the two macrocycles were the subject of comparative characterization studies using (FTIR, 1H NMR, 13C NMR, TG-DSC-MS, and P-XRD). The realization of modified quartz resonator-gold electrodes, and its introductory employment in the assembly of a novel QCM-I (Quartz Crystal Microbalance with Impedance measurements) based chemosensor for the detection of lead ions in the aqueous solutions is reported for the first time to the best of our knowledge, moreover both Calix-QCM based sensors presented good linearity, acceptable sensitivities, and wide linear ranges, as well as lower detection limits in the order of 0.45 and 0.30 ppm for compounds B and C, consecutively.
Keywords
Calixresorcinarenes
Synthesis
Piezogravimetric platform
Quartz crystal microbalance
Lead (II) ions
Chemical sensors

1 Introduction
Heavy metals (HM) contamination poses serious risks to the human health. Generally, HM toxicants are either originating naturally, or by human intervention. They can affect humans by means of the food chain (accumulation, and bio-accumulation), where it is well-known that HM ions can bind to the DNA, altering its functional properties, and causing different diseases (Morales et al., 2016). The development of dependable systems for detecting, and removing these HM ions from water sources is vital. Heavy metals ions conventional detection methods are based on analytical and physico-chemical techniques, such as Atomic Absorption Spectrometry (AAS) (Mohamed et al., 2012), Inductively Coupled Plasma based techniques (Coupled to Mass Spectrometry (ICP-MS) (Batsala et al., 2012), or to Optical Emission Spectrometry (ICP-OES) (Raju et al., 2007)). Analytical techniques offer complete information in terms of sensitivity and selectivity, but have some disadvantages due to high operational cost, need for expert knowledge, complexity and analysis time (sampling, preparation, pre-concentration, calibration, etc.).
An excellent attractive alternative methodology is the so called “lab-on-chip” technology, or basically “sensors technology”, which manifests in using techniques as colorimetric and fluorescence sensing…etc. (Cai et al., 2014; Chen et al., 2016; Fu et al., 2012; Lou et al., 2011; Sartore et al., 2011; Singh et al., 2017; Zhao et al., 2015). The advantage of sensors lies in their original concept permitting the realization of integrated measurement systems, fast, easy to implement, and demanding minor treatment of the sample to be analyzed (Karimi-Maleh et al., 2019a, 2019b; Khodadadi et al., 2019; Tahernejad-Javazmi et al., 2019). Many sensing procedures were applied to detect the heavy metal ions in water sources, including electrochemical (Brett, 2001; Farghaly et al., 2014; Gumpu et al., 2015) and piezoelectric methods (Eddaif et al., 2019a; Rodahl and Kasemo, 1996; Sartore et al., 2011).
One of the simplest, reliable, and promising sensing structure is the Quartz Crystal Microbalance (QCM). The QCM is a simple, inexpensive, in-situ, highly sensitive technique that utilizes the phenomena of piezo-gravimetric sensing. Principally, the resonance frequency variations are directly proportional to the mass variations on the surface (Rodahl and Kasemo, 1996) due to the affinity of the complex formation (in case of heavy metals) on the detection area. The Quartz crystal microbalance with dissipation mode (QCM-D) principle was established and exploited in various fields such as environmental science in liquid phases analyses (Dixon, 2008). Unlike the QCM-D, the quartz crystal microbalance with impedance mode (QCM-I) exploits the impedance analysis as readout method. Through this method, impedance spectra (impedance or conductance vs. frequency) are obtained for the fundamental and odd overtone frequencies (n), and the spectra are fitted by resonance curves with varying FWHM. As a result, it is worth mentioning that the two D (dissipation) values obtained from the different readout methods, i.e. QCM-D and QCM-I, are essentially identical (MicroVacuum Ltd, 2019; Saftics et al., 2018).
For molecular detection motives, the QCM-I resonator’s gold surface is modified to enhance both the sensitivity, and the selectivity. Numerous coating materials were applied including small molecules, polymers, DNA, nanostructures, as well as macrocycles (Li et al., 2013).
Macrocycles are divided into three subtypes, namely: Crownethers, cyclodextrines, and calixarenes/calixresorcinarenes. Calixarenes/calixresorcinarenes are considered as a third generation of macrocyclic molecules and their synthesis is essentially based on cyclocondensation reactions between various aldehydes and phenols/resorcinols. Basically, they’re composed of phenolic/resorcinolic units linked via methylene bridges as can be seen in (Fig. 1a and b).![Molecular structures of Calix[4]resorcinarene (a) and Calix[4]arene (b).](/content/184/2020/13/2/img/10.1016_j.arabjc.2019.09.002-fig1.png)
Molecular structures of Calix[4]resorcinarene (a) and Calix[4]arene (b).
Recently, due to their encapsulation properties or else host-guest interactions, calixarenes/calixresorcinarenes grew as essential molecules in sensing applications, molecular recognition and supramolecular investigations (Kahlfuss et al., 2014; Matvieiev et al., 2014). Their hydrophilic lower rim and hydrophobic upper rim; mostly the upper rim forms the cavity’s entry, and since the cavity’s dominating behavior is hydrophobic therefore making the calixarenes/calixresorcinarenes amphiphilic. All these properties determine the entrapping capacity of calixarenes/calixresorcinarenes against different ions or molecules, their extracting (Espinas et al., 2014; Rebarz et al., 2014) and sensing (Cristaldi et al., 2012; Düker et al., 2013; Echabaane et al., 2013; Eddaif et al., 2019b, 2019c; Gulino et al., 2014; Ma et al., 2010; Mlika et al., 2011; Sun et al., 2014) applications were also described.
The aim of the present study is description of the synthesis of newly enantiomeric macrocycles bearing chiral moieties, namely: compound B (C-dec-9-enylcalix[4]resorcinarene-O-(S-)-α-methylbenzylamine) and compound C (C-dec-9-enylcalix[4]resorcinarene-O-(R+)-α-methylbenzylamine). Those synthesized macrocycles will be employed to obtain two modified Au-coated electrodes with possible heavy metal ions complexing (detecting) capability. In order to characterize the sensing synthesized materials, and to ensure the best detection performances of the modified Au-electrodes, several comparative examinations were carried out by FTIR, 1H NMR, 13C NMR, TG-DSC-MS, and XRPD. Realization of a modified quartz resonator gold electrode, by the two enantiomeric calixaresorcinarene derivatives, and its introductory employment in the assembly of a QCM chemical sensor for the detection and determination of heavy metal ions in the aqueous solutions will be reported for the first time to our best knowledge.
2 Materials and methods
2.1 Synthesis
2.1.1 Compound A
Compound A (C-dec-9-en-1-ylcalix[4]resorcinarene), was synthesized and characterized using (FTIR, 1H NMR, 13C NMR, TG-DSC-MS, and XRPD), as described in our previous work (Eddaif et al., 2019c).
2.1.2 Novel enantiomer compounds B and C
Compound B (C-dec-9-enylcalix[4]resorcinarene-O-(S-)-α-methylbenzylamine) and compound C (C-dec-9-enylcalix[4]resorcinarene-O-(R+)-α-methylbenzylamine), were prepared according to the following recipe: 0.05 mol. of compound A was dissolved in a THF-methanol mixture (1:1), then added 0.05 mol. of paraformaldehyde. Then added to the mixture: 0.025 mol. of (S-)-α-methylbenzylamine to get Compound B and 0.025 mol. of (R+)-α-methylbenzylamine for compound C, as shown in Fig. 2. All components were stirred under argon atmosphere for 1 h, then refluxed for 12 hrs. After the reaction’s completion, all solvents were removed by rotary evaporator and the residue was crystallized twice from acetonitrile yielding compounds B and C as yellowish-orange solid (Yield: 50%, m.p.: 70–72 °C).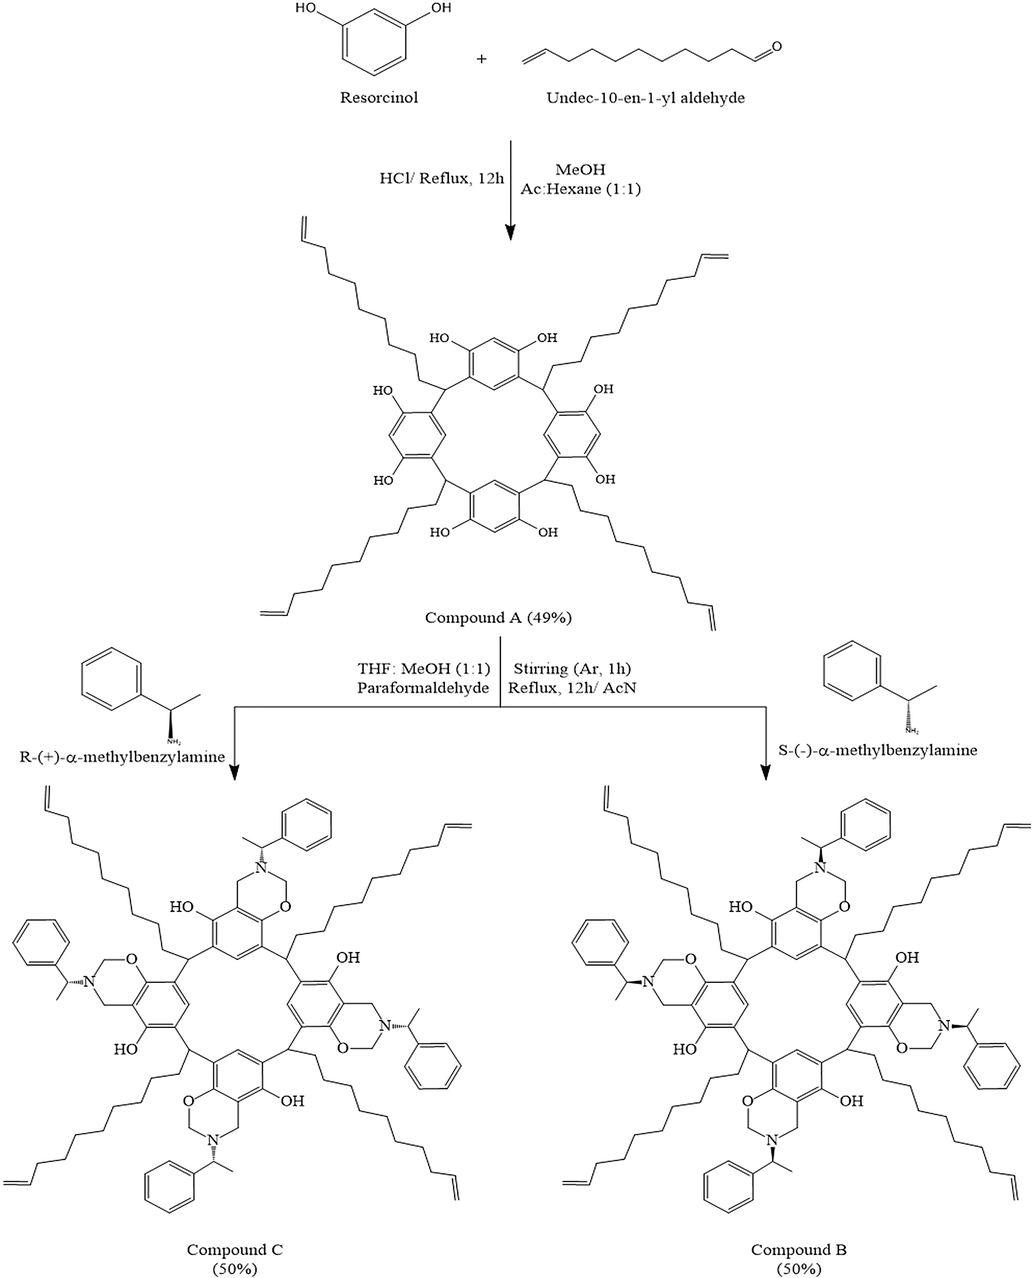
Synthetic steps of compounds A, B and C.
2.2 Materials characterization
For various types of sensor applications, characterization of sensing active materials is very significant due to the effect on improving the performances, particularly in terms of accuracy and sensitivity. The synthesized potential sensing chemicals were characterized by FTIR, NMR, TGA-DSC and XRD approaches.
2.2.1 FTIR studies
FTIR measurements were performed on a Varian 2000 FTIR spectrometer (Scimitar Series) (Varian Inc., US), the instrument is equipped with an MCT (Mercury–Cadmium–Telluride) detector, with an ATR single reflection diamond unit (Specac Ltd, UK), and with a resolution of 4 cm−1. For each spectrum, a number of 64 individual scans was averaged, and all spectra were ATR-corrected by the data acquisition software (Varian ResPro 4.0).
2.2.2 NMR measurements
NMR analysis were performed on a Varian VNMR SYSTEMTM spectrometer in the following conditions (CDCl3, 400 MHz, 25 °C), the 1H and 13C chemical shifts were referenced to the residual solvent signals (δ1H = 7.26 ppm, δ13C = 77 ppm). And, an indirect detection triple resonance 1H {13C, X} Z-gradient probe was used.
2.2.3 Thermal analysis
Thermogravimetric analysis were carried out on a Setaram Labsys Evo thermal analyzer, with a 90 ml min−1 flowrate, and with a 20 °C min−1 heating rate in helium (6.0) atmosphere in the temperature range of 20–500 °C. The procedure consisted on placing 7–8 mg of the sample into 100 μl aluminum crucibles. The gotten output data was evaluated and baseline-corrected with the thermoanalyzer’s software (Calisto Processing, version 1.492).
Simultaneously with the thermogravimetric-differential scanning calorimetric (TGA-DSC) measurements, the products decomposition analysis (EGA: evolved gas analysis) were performed on a Pfeiffer Vacuum OmniStarTM Gas Analysis System coupled to the TGA-DSC described previously. The spectrometer was functioning in the electron impact mode; the scan speed was around 20 ms amu−1 in the mass range of 10–111 amu. Both transfer lines and gas splitters were thermostated (230 °C), and the analysis were performed in SEM Bar Graph Cycles acquisition mode, in this last, the analog mass spectra, the TIC: Total Ion Current, and the SIC: Separate Ion current (for each scanned mass individually: 101 masses) were recorded.
2.2.4 X-ray powder diffraction
XRPD was used to analyze the crystallinity degree of the subjected samples, which were in grinded form, then appropriate sample quantity was placed in the sample holder under pressure. The diffractograms were recorded by means of a Philips Powder Diffractometer 1810/3710 assisted with a Bragg–Brentano para-focusing geometry, a CuKa monochromatic radiation was used (l = 0.154056 nm), and the data were collected in the reflection mode at room temperature, with an exposure time of 1.00 s at each point, and a step of 0.04° in the (3–77°) 2θ range.
2.2.5 Enantiomeric discrimination by means of polarimetry
The specific rotation [α]D, is generally calculated using the expression : [α]D = (100 × α)/(l × c), where ‘c’ stands for the solution’s concentration in (g/100 ml) ‘α’ is the detected rotation, ‘l’ is the optical path length (dm), and ‘D’ is the light wavelength (nm).
The optical rotation activities were performed on a JascoP-2000 Polarimeter. The products were dissolved in chloroform with a 0.1 g/100 ml in a 1 dm polarimeter tube at room temperature. A Sodium ‘D line’ was used (589.3 nm).
2.3 QCM-I measurements
QCM measurements were performed using the QCM-I instrument developed by (MicroVaccum Ltd. Budapest, Hungary). The resonance sensitivity of the instrument in liquid is 2 × 10⁻¹ Hz, the dissipation sensitivity is 1 × 10⁻⁷ and the mass sensitivity is ≤ 1 ng/cm2, respectively (MicroVacuum Ltd, 2019). The QCM-I sensor chips used in this work were AT-cut crystals with a diameter of 14 mm and a fundamental resonance frequency of 5 MHz.
2.3.1 Macrocyclic immobilization on QCM resonators
Analytical grade chemicals and Milli-Q purity deionized water (18.2 MΩ cm) were used throughout the experiments. The immobilization of the layers on the Au-surface of the resonator electrode is established through the following protocol: A calixresorcinarene solution was prepared by dissolving 2 mg/ml of the synthesized macrocycle in chloroform, then 10 µl was drop casted on the quartz crystals (formerly cleaned by means of acetone for 10 min, piranha solution (1/3 H2O2 + 2/3 H2SO4) for 10 min, then rinsed with Milli-Q water, and finally let dry). The coated crystals were dried at room temperature in a desiccator.
2.3.2 QCM-I tests
Heavy metal solutions of various concentrations (5, 25, 250, 500 and 1000 ppm) were prepared by diluting Lead(II) nitrate (Pb(NO3)2) in deionized water. The flow-cell volume is ∼40 µl and the flow rate was 200 µl/min maintained by a peristaltic pump. The resonance frequency and dissipation shifts were recorded for the selected overtones (n = 1, 3, 5, 7 for the frequencies of 5, 15, 25, 35 MHz, respectively). The measurement was driven by the BioSense Software V. 3.1, (developed by MicroVacuum Ltd, Budapest, Hungary), which can depict any two variable combinations vs. time, for any overtone of the following variables (F, ΔF, D, ΔD, Q, FWHM, ΔFWHM, Gmax, Goffs, Boffs, Fi, T, Sauerbrey mass (ΔM), Residual and Resonance).
3 Results and discussion
3.1 Macrocycles characterization
3.1.1 FTIR results
The IR spectroscopy is a powerful tool dedicated to the molecular functional groups determination, furthermore to the molecular structure confirmation. The IR spectra of both enantiomers were collected in the (4000–400 cm−1) wave number range, and are shown in Fig. 3, while Table 1 presents all functional groups, their wave numbers, and the corresponding vibration natures.
FT-IR spectra of compounds B and C.
Molecular parts
Wave # (cm−1)
Bond
Vibration nature
Intensity
Resorcinolic part
3340
1226
1348Associated O—H
C—O
O—HStretching
Stretching
In plan deformationStrong & large
Medium
Medium
Vinyl
3070
3027
1822
1640
907
880⚌C—H
⚌C—H
C—H
C⚌C
⚌C—H
⚌C—HStretching
Stretching
Deformation harmonics
Stretching
Out plan deformation
Out plan deformationSmall to medium
Small to medium
Small
Small to medium
Strong
Strong
Aromatic cycles
3030
1602
1560
1540
1468
1980
778
750
880⚌C—H
C⚌C
C⚌C
C⚌C
C⚌C
C—H
⚌C—H
⚌C—H
⚌C—HStretching
Stretching
Stretching
Stretching
Stretching
Deformation harmonics
Out plan deformation
Out plan deformation
Out plan deformationSmall
Small
Small
Small
Medium
Small
Medium
Medium
Medium
Tertiary amine
1145
C—N
Stretching
Small
Cyclic ether
1181
C—O
Stretching
Medium to strong
Alkane
2853
1468
2925
700
2970
1346CH3
CH3
CH2
CH2
C—H
C—HSymmetric stretching
Symmetric plan deformation
Asymmetric stretching
Rocking
Stretching
Out plan deformationStrong
Medium
Strong
Medium
Small
Small
By analyzing both spectra, an obvious similarity is seen, where both compounds show a large and strong band (3340 cm−1) corresponding to the stretching vibration of the hydroxyl groups (O—H), it may result from the free OH groups in the molecule, or even from the physically absorbed water, the (O—H) bond is confirmed by the existence of the (C—O) stretching (1226 cm−1), and the (O—H) bond’s in-plan deformation (1348 cm−1). The vinyl chain is characterized by the (⚌C—H) stretching (3070, 3027 cm−1), the (C—H) deformation harmonics (1822 cm−1), the (C⚌C) stretching (1640 cm−1), and the (⚌C—H) out-plan deformation (907,880 cm−1). Considering the aromatic cycles, the (⚌C—H) stretching is gotten (3030 cm−1), the (C⚌C) stretching is presented by a quadruplet (1602, 1560, 1540, 1468 cm−1), and the (C—H) aromatic bond is confirmed by the deformation harmonics (1980 cm−1), furthermore the (⚌C—H) out-plan deformation is existing (880, 778, 750 cm−1).
The presence of the cyclic ether is confirmed by the (C—O) stretching (1181 cm−1), and the existence of the tertiary amine is indicated by the (C—N) amine stretching (1145 cm−1). Although, the alkane chain is established by the (CH3) symmetric stretching (2853 cm−1), the (CH3) symmetric plane deformation (1468 cm−1), the (CH2) asymmetric stretching (2925 cm−1), the (CH2) rocking (700 cm−1), and by the (C—H) stretching (2970 cm−1) as well as the (C—H) out-plane deformation (1346 cm−1).
3.1.2 NMR results
To correctly determine a newly synthesized compound’s molecular structure, the IR studies are not enough, therefore a much powerful technique is required, mostly the Nuclear Magnetic Resonance spectroscopy (NMR) is used. Therefore, the acquired 1H NMR and 13C NMR spectra of both compounds are similar as presented in Figs. 4 and 5(a and b). The results show the typical aliphatic and aromatic carbon and proton peaks which confirms the validity of the proposed structures displayed in Fig. 2.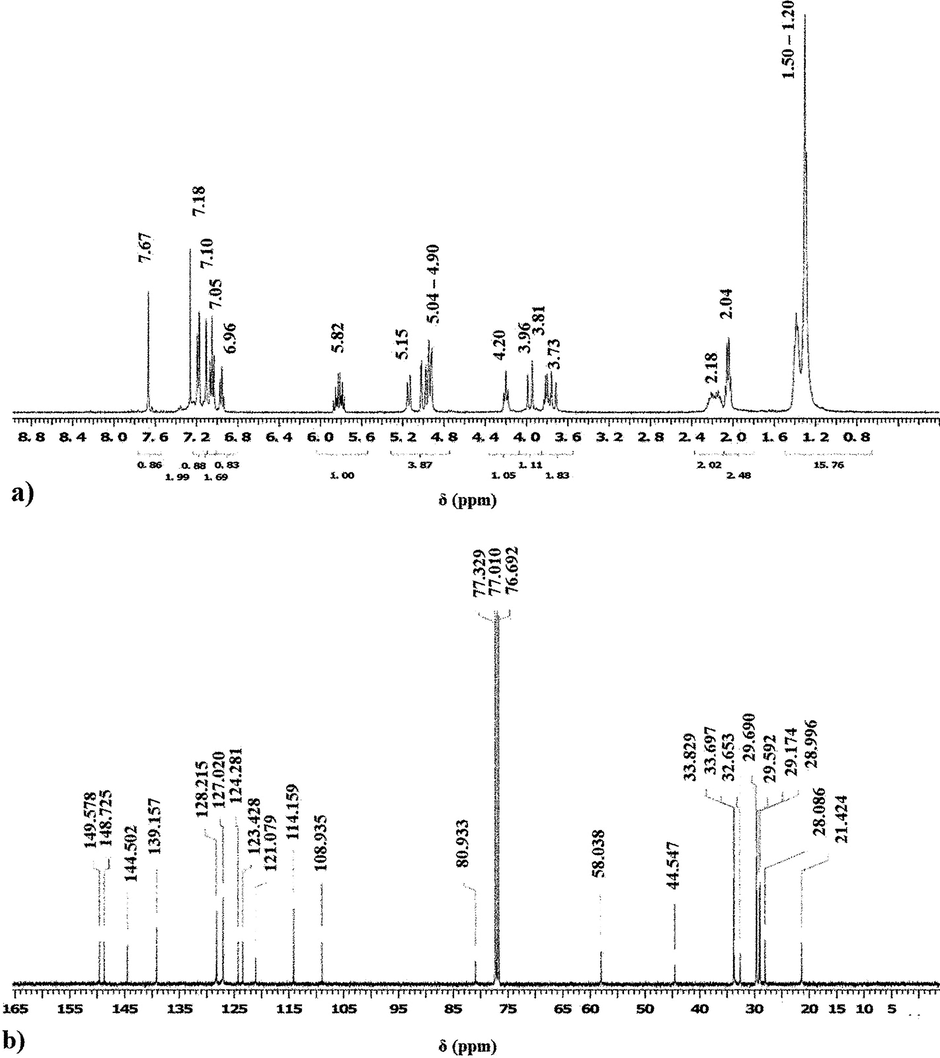
1H (a) and 13C (b) NMR spectra of compound B.
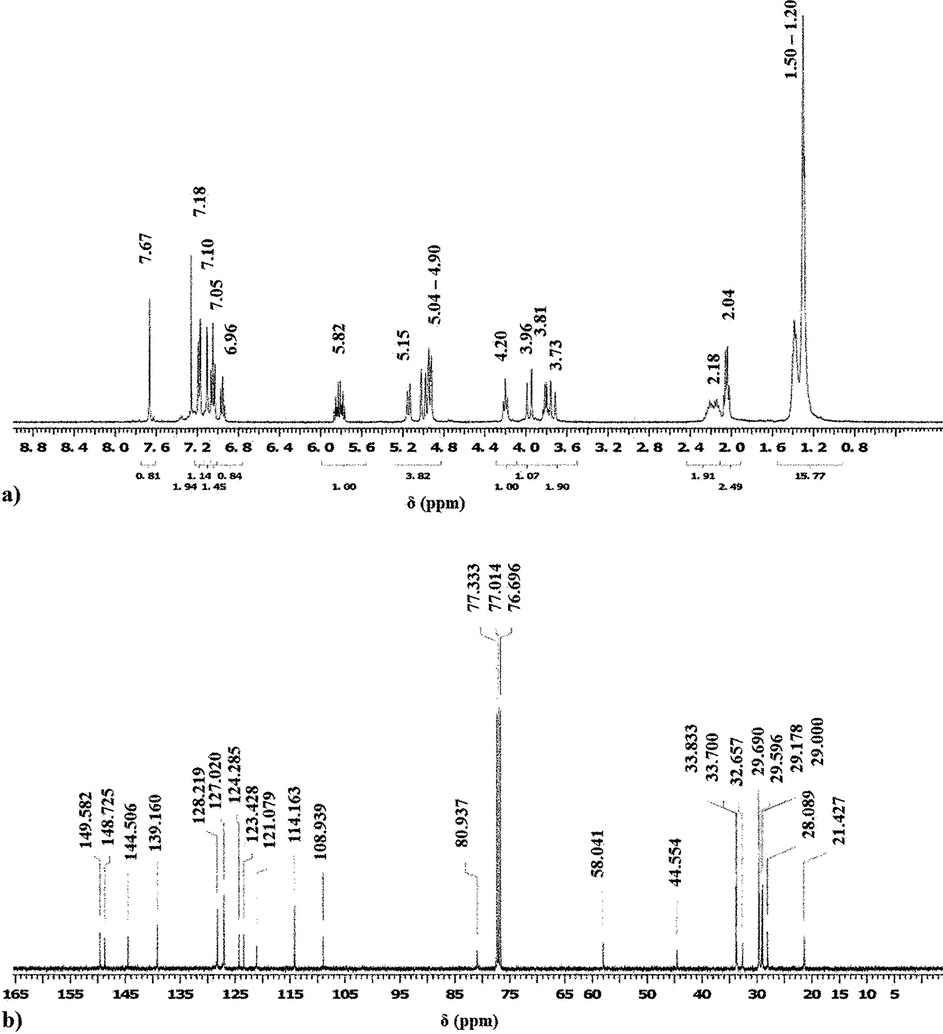
1H (a) and 13C (b) NMR spectra of compound C.
1H NMR (CDCl3, 400 MHz, 25 °C): 7.67 (4H, s); 7.18 (8H, d, J = 7.5 Hz); 7.10 (4H, s); 7.05 (8H, m); 6.96 (4H, t, J = 7.5 Hz); 5.82 (4H, m); 5.15 (4H, d, J = 10.4 Hz); 5.04 – 4.90 (12H, m); 4.20 (4H, t, J = 7.8 Hz); 3.96 (4H, d, J = 17.5 Hz); 3.81 (4H, q, J = 6.2 Hz); 3.73 (4H, d, J = 17.5 Hz); 2.18 (8H, m); 2.04 (8H, q, J = 6.0 Hz); 1.50 – 1.20 (60H, m).
13C NMR (CDCl3, 100 MHz, 25 °C): 149.6; 148.7; 144.5; 139.2; 128.2; 127.0; 124.3; 123.4; 121.1; 114.2; 108.9; 80.9; 58.0; 44.5; 33.8; 33.7; 32.7; 29.7; 29.6; 29.2; 29.0; 28.1; 21.4.
3.1.3 Thermal analysis
The coupled thermal investigations and evolved gas analysis (TGA-DSC-MS: EGA), were used to study both the thermal stability and the purity of the novel enantiomeric compounds, furthermore to determine their calorimetric melting points (In order to make a comparison with those determined directly), as well to verify all the released content, meaning to examine if there’s any volatile contaminant. In Fig. 6a and b, the TGA (Thermogravimetric)/ DSC (Heat flow) curves of both compounds are presented versus temperature.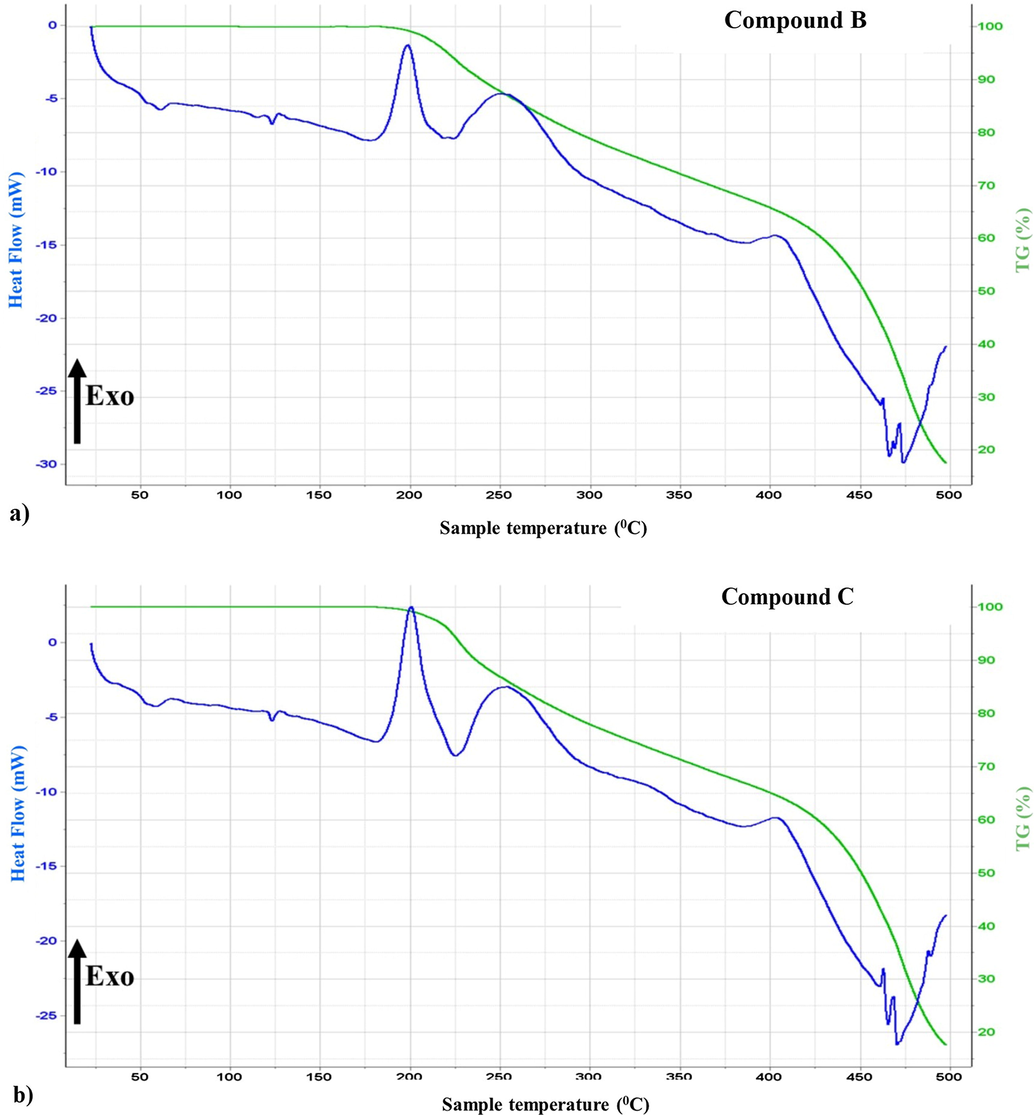
Thermogravimetric and heat-flow curves of both enantiomers versus T (°C).
Seemingly the TG and DSC patterns look similar, however, both enantiomers present high thermal stabilities, since no mass loss occurs in the TG curves up to 180 °C. Beyond this mentioned temperature, the compounds degrade in two steps (bi-step decomposition), furthermore the total mass losses of compounds B and C up to 500 °C are −82.52% and −82.38%, respectively.
In the heat flow curves, between 50 °C and 75 °C temperature, a small broad endotherm is observed, which corresponds to the melting of the two molecules {Compound B: (Onset temp. (T0): 48.6 °C, pic maximum (Tm): 61 °C}, {Compound C: (Onset temp. (T0): 49.22 °C, pic maximum (Tm): 60 °C}, the mentioned calorimetric melting points are in good agreement with those determined directly (70–72 °C), and generally such shape of melting endotherms matches with a semi-crystallized compound. Though, the thermal events detected after 180 °C, corresponds to the molecules degradation.
In order to evaluate the purity of both compounds, the evolved gas analysis (EGA) were performed. EGA revealed that the major released component was water (m/z: 18, 17) and the characteristic peaks of residual air were also detected (m/z: 44, 32, 28, 16). Those results confirm the evaporation of physically bounded water molecules from one point and the presence of some entrapped air in the transfer line, and the purity of both molecules from another point.
3.1.4 Powder X-ray diffraction
As a complementary characterization method to those carried out above, the Powder X-ray diffraction analysis (P-XRD) was used to define the crystalline/amorphous character of both novel synthesized enantiomers, thus the P-XRD patterns are presented in Fig. 7. Analyzing the X-Ray diffractograms showed a semi-crystalline behavior, which correlates in a decent manner with the Differential Scanning Calorimetric (DSC) results, as shown previously, when both compounds, on the heat curves, had a small wide endotherm as a melting stage, denoting that both P-XRD investigations and thermal analysis are in good agreement.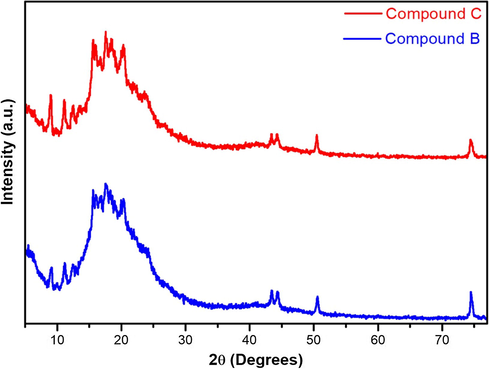
Powder X-ray diffractograms of compounds B and C.
3.1.5 Enantiomeric discrimination
One of the extensively used techniques for enantiomeric discrimination purposes, is the so called ‘polarimetry’, it’s based on measuring the polarized light deviation passing through a solution containing chiral compounds (Optically active). While studying enantiomers, their physical and chemical properties are identical, but polarized light is differently effected by them; the rotation amount (Specific rotation) tend to be similar but in opposite directions. The specific optical rotation ([α]D) values of samples “B” and “C” are the follows: sample B: [α]D = −185.9°, sample C: [α]D = +185.0°. The obtained values are almost similar and in opposite sign, evidencing that compounds ‘B’ and ‘C’ are enantiomers.
3.2 QCM-I results
3.2.1 Frequency and dissipation energy variations in time
The detection ability of the synthesized enantiomeric calix[4]resorcinarene, drop coated onto quartz resonator, will be explored against lead ions in aqueous solutions via In-situ QCM-I measurements with an advanced simultaneous layer characterization parameter (Dissipation Energy). A further aspect of the study is to analyze and compare the configuration effect (‘R’ and ‘S’) of both compounds B and C on lead ions detection, aiming to determine the best coating material in terms of frequency response, sensitivity, selectivity, and detection limits. Figs. 8 and 9 illustrate sequentially the frequency responses of compounds B and C based chemo-sensors against various concentrations of lead ions in static mode (Figs. 8a, 9a), while Figs. 8 and 9(b) are presenting the dissipation energy shifts of compounds B and C based sensing layers, respectively.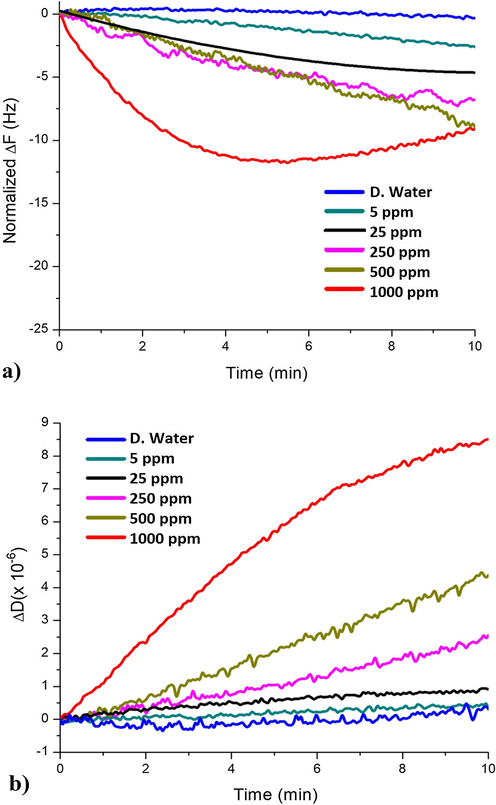
Frequency (a) and dissipation shifts (b) of compound B based QCM sensor against various lead ions amounts in time.
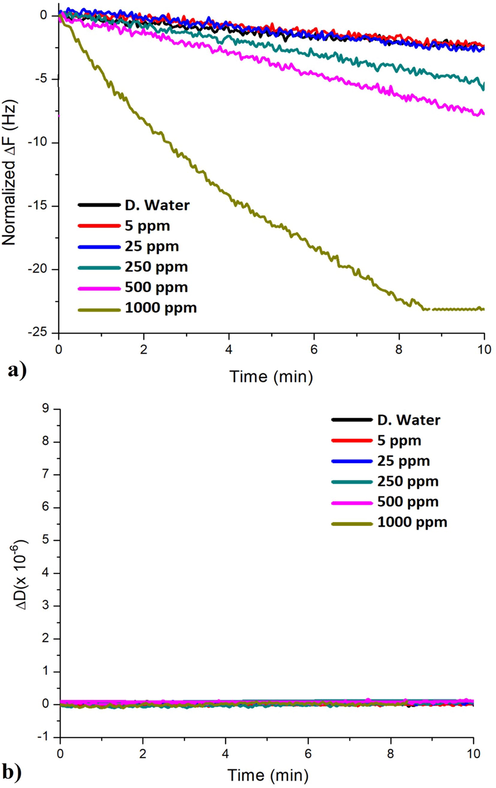
Frequency (a) and dissipation responses (b) of compound C based QCM sensor against various lead ions amounts in time.
As emphasized beforehand, Figs. 8a and 9a demonstrate the normalized frequency shifts in time during the exposure of the QCM sensors to aqueous samples containing Pb2+ concentrations up to 1000 ppm. As expected the frequency responses decreased while increasing the lead concentration in aqueous solutions (concentration dependence). Additionally, it is observed that compound C has reached a higher frequency variation value (ΔF = −23 Hz) at 1000 ppm compared to (ΔF = −10 Hz) for compound B, representing more than two-folds difference. These alterations can be explained due to the fact that both calixresorcinarene derivatives are bearing chiral moieties containing nitrogen atoms (their free electron pairs are accounted to their basic properties). Chelating agents, containing nitrogen (N) atoms, are favorable to form metal-complexes via electron transfer, especially by binding to heavy metals ions, such as Pb2+ (Diamond and Nolan, 2001; Flora and Pachauri, 2010; Rashid et al., 2019; Sharma and Cragg, 2011; Sone et al., 1997).
Calixarenes and calixresorcinarenes are considered as the third generation of host-guest macrocyclic networks, this fact ensures the macrocyclic ability of hosting Pb2+. From another point of view, the sensing mechanism could be also described by an adsorption effect between the macrocycles and the Pb2+. This interaction causes a Pb2+ bulk diffusion process, described by the Sauerbrey estimation that links ΔF directly and proportionally to the adsorbed mass. The diffusion process can lead to an effective mass increase (adsorbed Pb2+ amount), and reducing the crystal’s resonance frequency as seen in Figs. 8a and 9a, consequently. Both compounds B and C exhibited frequency responses to all applied Pb2+ concentrations (Table 2), which supports the functionality of the novel Pb2+ detection technique built on utilizing calixresorcinarene coated QCM resonators.
Measured value
Concentrations (ppm)
Compound B*
Compound C*
ΔFn/n (Hz)
Blank (D. water)
5
25
250
500
1000− 0.30 ± 0.04
− 2.40 ± 0.30
− 4.80 ± 0.10
− 6.80 ± 0.40
− 8.50 ± 0.10
− 10.00 ± 0.10− 1.20 ± 0.10
− 2.50 ± 0.30
− 2.86 ± 0.04
− 5.72 ± 0.70
− 7.85 ± 0.40
− 23.00 ± 0.01
ΔDn (10−6)
Blank (D. water)
5
25
250
500
10000.47 ± 0.23
0.54 ± 0.11
1.10 ± 0.34
2.50 ± 0.48
4.10 ± 0.23
8.50 ± 0.070.10 ± 0.03
0.10 ± 0.01
0.21 ± 0.09
0.13 ± 0.01
0.11 ± 0.01
0.10 ± 0.02
The accumulated data in Table 2, was registered from the end points of the curves shown in Figs. 8 and 9, as a summary of Δfn/n and ΔDn values of the deposited layers. Values of the dissipation energy variations ΔD (Energy loss or damping) are indicators for viscoelastic properties (rigidity, softness), as seen in Figs. 8b and 9b, and Table 2. Furthermore, ΔD variation can provide an accurate prediction concerning the appropriateness of the Sauerbrey estimations. As previously mentioned, the upper ΔD limit for treating a layer as rigid is about 2 × 10⁻⁶ (Saftics et al., 2018), however if its higher than that, the deposited film is considered as soft, and alternative viscoelastic model must be considered to better describe both the deposited layer’s characteristics, and the ions-sensor binding mechanism.
According to the presented dissipation variations, compound B is showing a significant viscoelastic behavior (ΔDn > 2 × 10⁻⁶) for higher Pb2+ concentrations (500, 1000 ppm), but still the rigidity character is dominating for other concentrations (ΔDn ≤ 2 × 10⁻⁶). This could be due to some loosely bound chains network, giving a soft coverage after the sensor’s exposure to higher Pb2+ quantities (CPb2+ > 250 ppm).
On the other hand, in the case of compound C (ΔDn < 2 × 10⁻⁶), the acquired data indicated the rigidity of the attached macrocyclic network, hence, suggesting the applicability of the Sauerbrey estimation model of the deposited film’s mass.
3.2.2 Calixresorcinarenes immobilization onto the Au surface
The attachment of the ionophores (macrocycles) on the piezoelectric resonator is due to the interactions occurring between the set of heteroatoms (O, N) existing in the ligands and the (Au) surface of the quartz electrodes, therefore constructing a well-defined sensing platform network that can host the target toxic elements. The (Au) surface is a thermodynamically stable phase, in addition, the high activity of both oxygen and nitrogen atoms is making it easy to form bonds such as Au—O and Au—N confirming the immobilization of the calixresorcinarenes, those bonds are formed by charge transfer interactions between the gold atoms and the free electrons of the oxygen and nitrogen atoms, subsequently, the incorporation of oxygen and nitrogen atoms through the gold adsorbent layer must create a higher electronic density between the N, O, and Au atoms. Also there are potentials of interactions between the aromatic cycles electrons and the gold surface as well.
3.2.3 Detection mechanisms of Pb2+
The lead ions detection mechanism strongly depends on the interaction described by the host-guest complexation occurring between the Pb2+ ions and the molecules which are already attached to the quartz crystal’s gold surface. Since the calixresorcinarenes are possessing electron donor heteroatoms such as N and O, therefore supporting the electron transfer between the sensing platform and the target metal ions. Accordingly, this process is causing an accumulation of the Pb2+ ions onto the sensing network at the gold surface (electrode)–solution (electrolyte) interface, the ions accumulation then could be detected piezo-gravimetrically, it’s presumed that due to the Pb2+ ions being chelated and complexed with the calixresorcinarenes ionophores, that both macrocycles can form complexes with lead(II) ions according to the reaction models (a) and (b), where the Ligand is the calixresorcinarenes, and the Mn+ signifies the lead ions: Model a: Mn+solution + Ligandsurface → [Mn+Ligand]surface Model b: Pb2+solution + Calixresorcinarenesurface → [Pb2+Calixresorcinarene]surface
It is also expected that the accumulated lead ions can fit inside the ionophores cavities (Pb2+ adsorption), by a cation-π interaction either with the aromatic cycles double bounds and/or with the free electron doublets of the heteroatoms (O, N), this solid interaction is of huge importance in terms of the ion-binding ability between the ionophores and the target cations, since it was of interest to investigate if the lead ions will be attached to the calixresorcinarenes when immobilized to the gold surface, which was the case by the production of a piezo-gravimetic signal translated to a mass increase (Frequency decrease). However, these interactions are strong enough, and can’t be simply destroyed by using distilled water as regenerating solution (RS) for Pb2+ desorption (Model c), as it takes long time. Thus, the studies of developing a suitable regeneration process are in progress. Model c: Pb2+(solution+ surface) + RSsolution → [Pb2+RS]solution
3.2.4 Calibration curves, linear ranges, and detection limits
One of the most important aspects of detection is having excellent sensitivity and lower detection limit (LDL). In order to characterize the sensitivity, linear range, and detection limits, for both sensing platforms (B and C), Fig. 10a and c show the calibration curves (Dynamic ranges) obtained as the normalized frequency variations against various Pb2+ concentrations, while Fig. 10b and d present the linear ranges. A noble linearity was obtained in both cases (Compound B: R2 = 0.996, Compound C: R2 = 0.982) for n = 4, and for specific linear regions described in Table 3; the linear regression equations for compounds B and C were:
ΔF(Hz) = 0.008*C(ppm) + 4.800, for compound B,
and ΔF(Hz) = 0.020*C(ppm) + 2.216, for compound C.
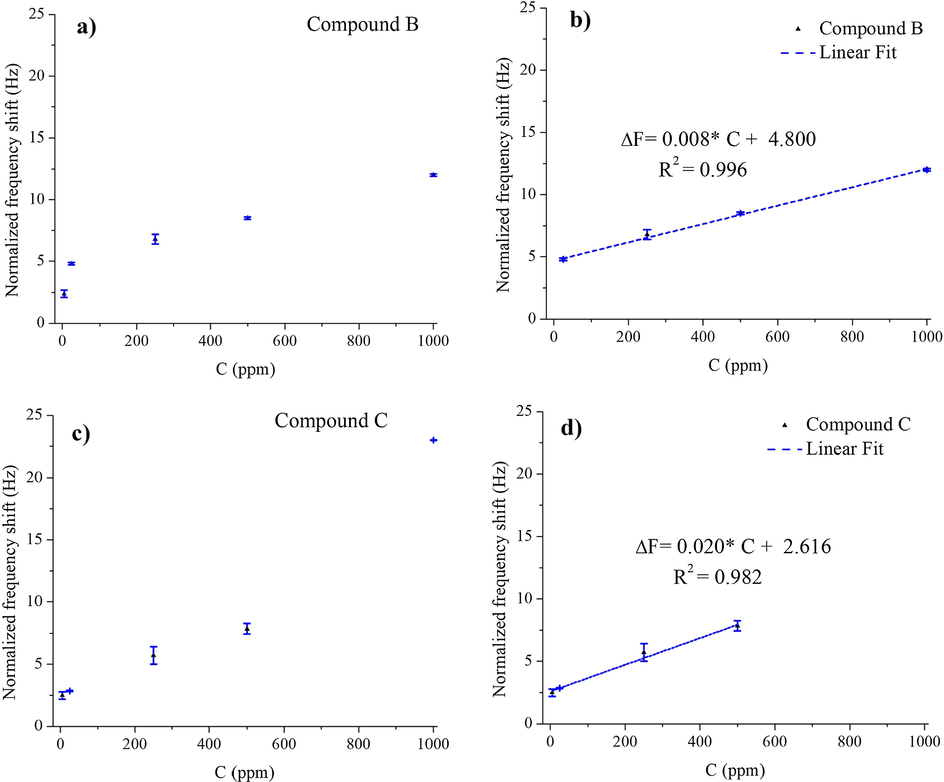
Calibration curves obtained for the Calix-QCM based sensor in the Pb2+ concentration range of 5–1000 ppm for compound B (a) and compound C (c). The linear range based on calibration curves for compound B (b) and compound C (d).
Compounds
Linear Range (ppm)
Sensitivity (Hz.ppm−1)
Limits of Detection (ppm)
B
25–1000
0.008
0.45
C
5–500
0.020
0.30
The sensitivities were presumed to be the slopes of the linear fitted curves, whereas the detection limits were calculated based on the (3σ/S) relationship, where σ presents the standard deviation of the fitted curve and S presents the slopes obtained from the linear correlation curves.
Different characteristics of the studied calix- coated-QCM chemosensors are tabulated in Table 3. The sensitivities were in the order of 0.008 and 0.020 Hz ppm−1, while the limits of detection were 0.45 and 0.30 ppm for compounds B and C, respectively. The obtained results confirm: the superior sensitivity and selectivity of compound C to Pb2+ ions over compound B; and the Pb2+ detection prospect by means of Calix-coated-QCM based sensors.
The obtained detection limits, shown in Table 3, are slightly higher than the WHO standard allowed in water (0.05 ppm), nevertheless are promising output. Furthermore, a sensitivity comparison of various methods and sensing platforms on the lead ions detection in aqueous solutions is presented in Table 4.
Used technique
Sensing platform
Detection target
Linear range
Detection limit
Refs.
Electrochemistry
Dipyridine‐Containing Macrocyclic Polyamine-Nafion
Lead (II) ions : Pb2+
0–200 µg/l
2 µg/l
(Bettazzi et al., 2012)
p-tert-Butylcalix[4]arene Derivative
2.10−7–2.10−5 mol/l
8.10−8 mol/l
(Zou et al., 2009)
Dicarboxyl-Calix[4]arene
280–2500 µg/l
6.2 µg/l
(Nur Abdul Aziz et al., 2018)
QCM
Graphted polymer
0.01–1000 ppm
_____
(Sartore et al., 2011)
Compound B
25–1000 ppm
0.45 ppm
This work
Compound C
5–500 ppm
0.3 ppm
4 Conclusions
Two novel enantiomeric calixresorcinarenes bearing chiral moieties, namely: C-dec-9-enylcalix[4]resorcinarene-O-(S-)-α-methylbenzylamine (Compound B) and C-dec-9-enylcalix[4]resorcinarene-O-(R+)-α-methylbenzylamine (Compound C), were successfully synthesized. The structures as well as other properties of Compound B and C were described and highlighted by means of the following series of techniques: FTIR, 1H NMR, 13C NMR, TG-DSC-MS, and P-XRD. Based on these enantiomers, two novel calix-QCM based chemosensors were fabricated aiming to possibly detect lead ions in aqueous solutions at ppm or even ppb concentrations level.
The QCM-I investigations confirmed that both sensing platforms showed noble linearity (Compound B: R2 = 0.996, Compound C: R2 = 0.982), wide linear ranges (Compound B: 25–1000 ppm, Compound C: 5–500 ppm), adequate sensitivities (Compound B: 0.008 Hz ppm−1, Compound C: 0.02 Hz ppm−1), and limits of detection (Compound B: 0.45 ppm, Compound C: 0.30 ppm). Compound C showed advantages over Compound B over the detection sensitivity and selectivity toward lead ions.
Acknowledgments
The support from the [BIONANO_GINOP-2.3.2-15-216-00017] project, as well as the Stipendium Hungaricum Scholarship Program, Hungary, is appreciated. Many thanks to MicroVacuum Ltd for loaning the QCM-I apparatus.
Declaration of Competing Interest
The authors declare no conflicts of interest.
References
- Dipyridine-containing macrocyclic polyamine – nafion-modified screen-printed carbon electrode for voltammetric detection of lead. Electroanalysis. 2012;24:591-599.
- [CrossRef] [Google Scholar]
- Electrochemical sensors for environmental monitoring. Strategy and examples. Pure Appl. Chem.. 2001;73:1969-1977.
- [CrossRef] [Google Scholar]
- Novel Pb2+ ion imprinted polymers based on ionic interaction via synergy of dual functional monomers for selective solid-phase extraction of Pb2+ in water samples. ACS Appl. Mater. Interfaces. 2014;6:305-313.
- [CrossRef] [Google Scholar]
- Molecular imprinting: perspectives and applications. Chem. Soc. Rev.. 2016;45:2137-2211.
- [CrossRef] [Google Scholar]
- Sensing of linear alkylammonium ions by a 5-pyrenoylamido-calix [5] arene solution and monolayer using luminescence measurements. J. Mater. Chem.. 2012;22:675-683.
- [CrossRef] [Google Scholar]
- Peer reviewed: calixarenes: designer ligands for chemical sensors. Anal. Chem.. 2001;73:22A-29A.
- [CrossRef] [Google Scholar]
- Quartz crystal microbalance with dissipation monitoring: enabling real-time characterization of biological materials and their interactions. J. Biomol. Tech.. 2008;19:151-158.
- [Google Scholar]
- Rationally designed calix[4]arene–pyrrolotetrathiafulvalene receptors for electron-deficient neutral guests. J. Org. Chem.. 2013;78:4905-4912.
- [CrossRef] [Google Scholar]
- Studies of aluminum (III) ion-selective optical sensor based on a chromogenic calix [4] arene derivative. Spectrochim. Acta A.. 2013;115:269-274.
- [CrossRef] [Google Scholar]
- Sensitive detection of heavy metals ions based on the calixarene derivatives-modified piezoelectric resonators: a review. Int. J. Environ. Anal. Chem.. 2019;99:824-853.
- [CrossRef] [Google Scholar]
- Application of Calixresorcinarenes as Chemical Sensors. In: Proceedings of 1st Coatings and Interfaces Web Conference. Presented at the 1st Coatings and Interfaces Web Conference, MDPI, Sciforum.net. 2019. p. :6166.
- [CrossRef] [Google Scholar]
- Calix[4]resorcinarene macrocycles: synthesis, thermal behavior and crystalline characterization. J. Therm. Anal. Calorim.. 2019;137:529-541.
- [CrossRef] [Google Scholar]
- Preparation and characterization of metallacalixarenes anchored to a mesoporous silica SBA-15 LP as potential catalysts. Micropor. Mesopor. Mat.. 2014;188:77-85.
- [CrossRef] [Google Scholar]
- Analytical application using modern electrochemical techniques. Int. J. Electrochem. Sci.. 2014;9:3287-3318.
- [Google Scholar]
- “Turn-on” fluorescence detection of lead ions based on accelerated leaching of gold nanoparticles on the surface of graphene. ACS Appl. Mater. Interfaces. 2012;4:1080-1086.
- [CrossRef] [Google Scholar]
- A viable route for lithium ion detection. Eur. J. Inorg. Chem.. 2014;2014:442-449.
- [CrossRef] [Google Scholar]
- A review on detection of heavy metal ions in water–an electrochemical approach. Sensor. Actuat. B-Chem.. 2015;213:515-533.
- [CrossRef] [Google Scholar]
- Reversible dimerization of viologen radicals covalently linked to a calixarene platform: experimental and theoretical aspects. C. R. Chim.. 2014;17:505-511.
- [CrossRef] [Google Scholar]
- The determination of 2-phenylphenol in the presence of 4-chlorophenol using nano-Fe3O4/ionic liquid paste electrode as an electrochemical sensor. J. Colloid Interface Sci.. 2019;554:603-610.
- [CrossRef] [Google Scholar]
- A novel electrochemical epinine sensor using amplified CuO nanoparticles and a n-hexyl-3-methylimidazolium hexafluorophosphate electrode. New J. Chem.. 2019;43:2362-2367.
- [CrossRef] [Google Scholar]
- A new epirubicin biosensor based on amplifying DNA interactions with polypyrrole and nitrogen-doped reduced graphene: Experimental and docking theoretical investigations. Sens. Actuat., B. 2019;284:568-574.
- [CrossRef] [Google Scholar]
- Nanostructured sensors for detection of heavy metals: a review. ACS Sustain. Chem. Eng.. 2013;1:713-723.
- [CrossRef] [Google Scholar]
- Blue-to-red colorimetric sensing strategy for Hg2+ and Ag+ via redox-regulated surface chemistry of gold nanoparticles. ACS Appl. Mater. Interfaces. 2011;3:1568-1573.
- [CrossRef] [Google Scholar]
- A new aluminum (III)-selective potentiometric sensor based on N, N′-propanediamide bis (2-salicylideneimine) as a neutral carrier. Mater. Sci. Eng. C. 2010;30:209-213.
- [CrossRef] [Google Scholar]
- Upper-rim calixarene phosphines consisting of multiple lower-rim OH functional groups: synthesis and characterisation. Supramol. Chem.. 2014;26:825-835.
- [CrossRef] [Google Scholar]
- MicroVacuum Ltd, n.d. QCM-I Quartz Crystal Microbalance With Impedance Measurement. OWLS and QCM Biosensors. URL http://www.owls-sensors.com/qcm-i-quartz-crystal-microbalance-with-impedance-measurement (accessed 01 July 2019).
- Impedance spectroscopic investigation of the effect of thin azo-calix [4] arene film type on the cation sensitivity of the gold electrodes. Mater. Sci. Eng. C.. 2011;31:1466-1471.
- [CrossRef] [Google Scholar]
- Determination of trace elements in water and sediment samples from Ismaelia canal using ion chromatography and atomic absorption spectroscopy. Chem. Spec. Bioavailab.. 2012;24:31-38.
- [CrossRef] [Google Scholar]
- Heavy metal exposure influences double strand break DNA repair outcomes. PLoS ONE. 2016;11:1-21.
- [CrossRef] [Google Scholar]
- An electrochemical sensing platform for the detection of lead ions based on dicarboxyl-calix[4]arene. Electroanalysis. 2018;30:533-542.
- [CrossRef] [Google Scholar]
- Determination of heavy metals in ground water by ICP-OES in selected coastal area of spsr Nellore district, Andhra Pradesh. India. Int. J. Innov. Res. Sci. Eng. Technol.. 2007;3:9743-9749.
- [Google Scholar]
- Zirconium(IV) phosphosulphosalicylate-based ion selective membrane electrode for potentiometric determination of Pb(II) ions. Arab. J. Chem.. 2019;12:1839-1847.
- [CrossRef] [Google Scholar]
- Revisited photophysics and photochemistry of a Ru-TAP complex using chloride ions and a Calix[6]crypturea. Inorg. Chem.. 2014;53:2635-2644.
- [CrossRef] [Google Scholar]
- A simple setup to simultaneously measure the resonant frequency and the absolute dissipation factor of a quartz crystal microbalance. Rev. Sci. Instrum.. 1996;67:3238-3241.
- [CrossRef] [Google Scholar]
- In situ viscoelastic properties and chain conformations of heavily hydrated carboxymethyl dextran layers: a comparative study using OWLS and QCM-I chips coated with waveguide material. Sci. Rep.. 2018;8:1-14.
- [CrossRef] [Google Scholar]
- Polymer-grafted QCM chemical sensor and application to heavy metal ions real time detection. Sens. Actuat., B. 2011;155:538-544.
- [CrossRef] [Google Scholar]
- Flexible graphene-based wearable gas and chemical sensors. ACS Appl. Mater. Interfaces. 2017;9:34544-34586.
- [CrossRef] [Google Scholar]
- Synthesis and properties of sulfur-bridged analogs of p-tert-Butylcalix[4]arene. Tetrahedron. 1997;53:10689-10698.
- [CrossRef] [Google Scholar]
- Synthesis of calix[4]arene derivatives via a Pd-catalyzed Sonogashira reaction and their recognition properties towards phenols. Chin. Chem. Lett.. 2014;25:226-228.
- [CrossRef] [Google Scholar]
- 3D reduced graphene oxide/FeNi3-ionic liquid nanocomposite modified sensor; an electrical synergic effect for development of tert-butylhydroquinone and folic acid sensor. Compos. B Eng.. 2019;172:666-670.
- [CrossRef] [Google Scholar]
- “One-drop-of-blood” electroanalysis of lead levels in blood using a foam-like mesoporous polymer of melamine–formaldehyde and disposable screen-printed electrodes. Analyst. 2015;140:1832-1836.
- [CrossRef] [Google Scholar]
- Simultaneous determination of thallium and lead on a chemically modified electrode with langmuir– blodgett film of a p-tert-Butylcalix[4]arene derivative. Electroanalysis. 2009;21:2563-2568.
- [CrossRef] [Google Scholar]


