

A review on analytical performance of micro- and nanoplastics analysis methods
⁎Corresponding author. bbneupane@cdctu.edu.np (Bhanu Bhakta Neupane)
-
Received: ,
Accepted: ,
This article was originally published by Elsevier and was migrated to Scientific Scholar after the change of Publisher.
Peer review under responsibility of King Saud University.
Abstract
Micro- and nanoplastics have been detected in diverse matrices. Recent studies have suggested their health impact on humans, animals, plants, and environment which depends on the size, concentration, chemical nature, and the mode of interaction of the plastic particles. Detection and quantification of these particles are often challenging due to their small size and complexity of the matrix in which they exist. The concentration and size of the particles combined with the nature of the matrix determines an analytical method to be followed. In recent years, many review articles focusing on origin, fate, and health effects of micro- and nanoplastics are already published. A systemic review focusing on analytical performance of currently available micro- and nanoplastics analysis methods would be useful for the scientific community. In this article, we reviewed papers and reports published in recent decades focusing on the sampling, concentration, detection, and chemical identification methods. We also reviewed the emerging new methods for microplastic analysis. Finally, we provide advantages and limitations of the methods and future perspectives on microplastic analysis.
Keywords
Microplastic contamination
Analytical method
Micro-beads
Sample processing
Health effect

1 Introduction
1.1 General introduction
Micro- and nanoplastics are reported to exist at levels of ecosystem and have raised several health concerns for humans, animals, plants, and environment (Guo et al., 2020; Mofijur et al., 2021; Thompson, 2004). Although the first observation of plastic particles down to 2.5 mm was reported in 1972 in oceanic water (Carpenter and Smith, 1972), the word “microplastic” has extensively been used only after 1990 (Ryan and Moloney, 1990). The US National Oceanic and Atmospheric Administration (NOAA) defines microplastics as any plastic fragments of size <5 mm (Arthur et al., 2009). Microplastics can be further subdivided into larger (0.5–5 mm) and smaller fractions (1–500 μm) (Hidalgo-Ruz et al., 2012). Although there is no joint agreement among authors in defining nanoplastics, plastic particles having one or all dimensions in the size range 1 nm–1000 nm, that exhibit colloidal behavior are generally named as nanoplastics (Gigault et al., 2018).
Microplastics can be divided into primary and secondary types based on their source of origin. Primary microplastics are intentionally manufactured for industrial or domestic applications in cosmetic products (Duis and Coors, 2016; Fendall and Sewell, 2009), textiles (Alomar et al., 2016; Gregory, 1996), medicines (Boucher and Friot, 2017; Patel et al., 2009), and air-blasting technology (Derraik, 2002). Secondary microplastics are formed by breakdown of large plastic debris involving several processes such as mechanical and photochemical degradation, microbial actions, or their combinations and are more abundant than primary microplastics. The formation and origin of nanoplastics are not fully understood but are considered to originate from breakdown of microplastics and/or could be released directly into the environment from different plastic products (Bouwmeester et al., 2015; da Costa et al., 2016; Gigault et al., 2018).
Microplastic particles are reported to exist in different morphology such as fibers, microbeads, pellets, fragments (Fig. 1). Seven major sources of microplastics are reported, which include, city dust, marine coatings, personal care products, plastic products, road markings, synthetic textiles, and tyres (Boucher and Friot, 2017).
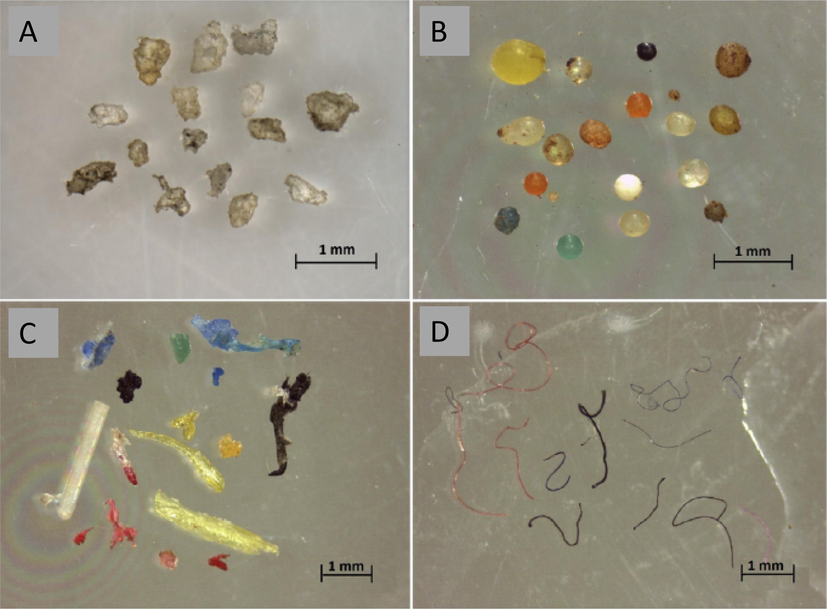
- Stereomicroscopic images of some representative microplastic particles. (A, B) Pellets and microbeads obtained from personal care products i.e. primary source. (C, D) Larger fragments and fibers obtained from break-down of bulk plastic materials. A scale bar of 1 mm is shown in all figures. Reprinted with permission form (Talvitie et al., 2017).
1.2 The fate of Micro- and nanoplastics
Microplastic particles have large surface area so that chemical contaminants can easily concentrate on/in the particles via sorption mechanisms. Microplastics can be transported to various levels of ecosystems and can induce rapid colonization and transport of pathogens along with toxic chemicals. Biofilms formation has been reported onto the surface of microplastics. Moreover, additives in the microplastics can leach into the environment. Thus, microplastics can serve both as sink and source of contaminants or pollutants (Teuten et al., 2009; Lee et al., 2014; Ziccardi et al., 2016).
The size of microplastics makes them susceptible to ingestion by different organisms. The ingestion is mostly accidental or through contaminated water or food; however, some organisms target them. The ingested microplastics can be either excreted or translocated between tissues of an organism and can cause harmful effects. The excreted particles can be transferred to higher trophic level via food web (Cole et al., 2013; Fossi et al., 2016). The fate of nanoplastics is more difficult to assess due to their smaller size. However, nanoplastics being derivatives of microplastics, their origin and distribution can be assessed if that of microplastics is known (da Costa et al., 2016).
The micro- and nanoplastics particles can act as vectors for various microorganisms and toxic chemicals and can cause various effects. The health issues of micro- and nanoplastics are beyond the scope of this review paper and we referred to recent reviews for it (Lehner et al., 2019; Campanale et al., 2020a; Rahman et al., 2021; Strungaru et al., 2019). The intended readers of this review paper are beginning researchers or people interested to carryout analysis of emerging pollutants including microplastics and nanoplastics in various sample matrixes.
1.3 Objectives of the review
Micro- and nanoplastics are found in matrices having different levels of complexity. Therefore, the analysis protocols differ greatly. The choice of an analytical method, to some extent, is determined by the accessibility of required techniques and instruments. In recent years, many review articles have focused only on the sources, migration and distribution, and potential health effect of micro- and nanoplastics. A review article that provides an extensive overview on methodology of sampling, detection, quantification, and chemical identification of microplastics in various matrices would be interesting to the readers. In this review, we describe the currently available matrix specific micro- and nanoplastics analysis methods. Although hundreds of papers are published in last two decades, we only included those that provided a significant contribution on methods of sampling, pre-concentration, detection, and quantification of micro- and nanoplastics. We also provide a brief discussion on the advantages and limitations of these methods and future perspectives on these topics.
2 Analysis of micro- and nanoplastics
For complete analysis, series of steps and precautions starting from sampling and sample processing to detection and identification are to be followed (Fig. 2). Although new methodologies are evolving (Shim et al., 2017), the analysis of micro/nanoplastics involves two types of characterizations: (a) physical characterization involving shape, size, color, and concentration, and (b) chemical characterization involving the chemical composition of the particle type.
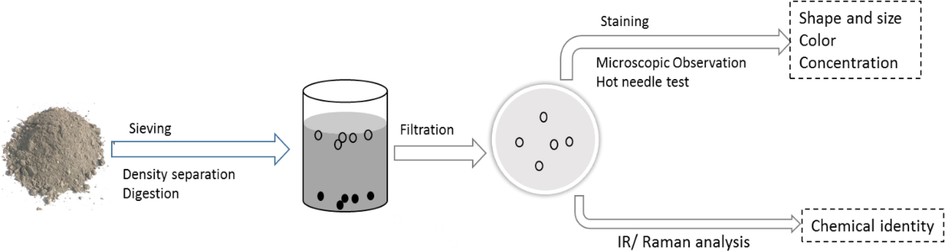
- A schematics for the microplastic analysis in a soil sample. Major steps involved in the analysis are indicated.
The risk of cross contamination during sample collection and measurement is one of the frequently encountered problems in microplastic analysis. So, special care should be taken to minimize or eliminate this issue. Glassware and containers used in analysis should be non-plastic type (either metal or glass). These containers should be properly cleaned with filtered deionized/distilled/Milli-Q/reverse osmosis (RO) water before use. Similarly, working areas should be clean and reagents covered properly. To minimize the background contamination, measurements are suggested to conduct under laminar flow cabinets. Natural fiber clothes or aprons are recommended to reduce microfiber cross contamination. Before analyzing sample, method(s) chosen is to be validated by measuring percentage recovery and limit of detection. Normally, the size of particles in recovery experiment 20–500 μm and the recovery in the range of 50–95 % have been reported (Table 1). Recovery data for nanoplastics are very limited. Procedural blanks are highly recommended to enhance the data accuracy (Campanale et al., 2020b; Schymanski et al., 2021).
| Sample types | Sampling/ device | Processing$ | Filtration Substrate | Size, % Recovery, and particle type* | Characterization | Particle size (µm) | Stain | Plastic type detected in sample* | Reference |
|---|---|---|---|---|---|---|---|---|---|
| Sludge | Grab sampling with metal scoop | Freeze drying, Sieving, D: Fenton's reagent | NA | >1 mm: 97 ± 1 %, 1 mm–500 µm: 96 ± 1 %, 500–150 µm: 94 ± 4 %; LDPE | Visual shorting and FTIR | NA | Rose-Bengal | LDPE | (Campo et al., 2019) |
| Sludge | NA | D: 30 % H2O2 DS: NaCl | Glass fiber filter | 550 µm: 86 ± 4 %, 75 µm: 67 ± 4 %; PS, PE, PP |
SEM, Digital microscope, μ-FTIR | NA | NA | PS, PE, PA, PO, AF | (Li et al., 2018) |
| Sludge | 24-h composite sampling | D: Fenton’s Reagent DS: NaI |
sieved in 55 µm | NA | μ-Raman | NA | NA | ABS, PE, PES, Nylon-6, POM, PP, PVC | (Gündoğdu et al., 2018) |
| Marine water | manta trawl, mesh size 335 μm | D: 30 % KOH:NaClO, DS: NaCl | Whatman 2.7 μm glass fiber | NA | Digital microscopy, Visual sorting, ATR-FTIR | NA | Nile Red | PS, PE, PP | (Bakir et al., 2020) |
| Marine sediment | Metal cylinder | D: 10 % KOH, DS: Zncl2 | Whatman 8 μm filter | NA | Visual sorting, Stereo microscope, ATR-FTIR | NA | NA | PE, PET, PA, PP | (Bucol et al., 2020) |
| Lake sediment, ice and snow | Composite sampling | DS: NaCl | 1.2 μm glass microfiber | NA | Visualization, FTIR | NA | NA | PA, CE, PS, PU-PET | (Scopetani et al., 2019) |
| Ice and snow | metal scoop and metallic ice drill | Melted and direct filtered | 1.2 μm glass fiber | NA | Visualization, FTIR | NA | NA | CE, PE, PP, PA, PAK, PE-PET PE, PP |
(Scopetani et al., 2019) |
| River sediment | grab sampler | D: 30 % H2O2 DS: Zncl2 |
1.2 μm nitrocellulose filter | NA | SEM | NA | NA | No Polymer detected | (Shruti et al., 2019) |
| Sea water | stainless scoop | Filtration DS: NaCl |
0. 75 μm glass fiber | NA | Stereo microscope, FTIR | NA | NA | PP, PE | (Song et al., 2015b) |
| Tap water | stainless steel filter member, mesh size 10 μm | D: 37 % HCl | 10 μm, stainless steel | 22–27 μm: 53 ± 14 % , 45–53 μm: 89 ± 28 % (); PE |
μ-Raman | none | NA | none | (Weber et al., 2021) |
| Bottled water | NA | Vaccum filtered, oven-dried at 30 °C for 24 h | 0.45 μm Cellulose nitrate filter | NA | Fluorescence microscope, ATR-FTIR, Raman | 6.5–20 20–50, ≥50 | Nile red | PET, PE, PP, PA | (Kankanige and Babel, 2020) |
| Bottled water | NA | Direct vacuum filtered | 1.5 µm Whatman glass fiber | NA | fluorescence, FTIR | 6.5–100 > 100 | Nile Red | PP, Nylon, PS, PE | (Mason et al., 2018) |
| Bottled water | NA | Direct filter | NA | NA | Raman spectroscopy, SEM | NA | NA | NA | (Zuccarello et al., 2019) |
| Bottled water | NA | Direct vacuum filtered | 3 µm Polycarbonate filter | NA | μ-Raman | 50–100 and > 100 | NA | PET, PP | (Schymanski et al., 2018) |
| Wastewater | 24 hrs composite sampling | D: Fenton's reagent, DS: NaI |
sieve with 55 μm mesh | NA | μ-Raman | 55 | NA | PES, PE, PP | (Gündoğdu et al., 2018) |
| Wastewater | 100-mesh stainless steel | D: 30 % H2O2 DS: NaCl | 0.8 μm Whatman | NA | μ-Raman | 600–800 | NA | NA | (Tang et al., 2020) |
| Rainwater pipelines | stainless steel sampler | D: 30 % H2O2 DS: NaI | glass micro fiber | NA | Raman Spectroscopy |
10–450 | NA | PE, PET, PVC, PP, PS | (Sang et al., 2021) |
| Beach sand | 5 mm mesh and electromagnetic sieve shaker | DS: CaCl2 | NA | NA | Fluorescence, FTIR, SEM- EDS | 36–5 000 | Nile Red | PE, PET, PVC, PP, PS | (Tiwari et al., 2019) |
| river water | 12 V DC Teflon pump | D: 30 % H2O2 for 12 h | Whatmann 0.45 μm glass fiber | NA | Raman Spectroscopy |
< 500 | NA | PS, PP, PE, PC, PVC | (Di and Wang, 2018) |
| river water | Conical plankton net and flow meter | Delaminated sieves | Whatmann 1 μm glass fiber | NA | μ - FTIR, GC - MS | 6.3–5000 | NA | PE, PP, PS, EPS, PVC, PET | (Tan et al., 2019) |
| river water | Grab sampling | D: Fenton's reagent | Fluorescence: 10 µm PC filter, µ-FTIR: 30-µm Monel wire screen | NA | Fluorescence, μ – FTIR | 30–90 | Nile red | PES, PE, PP, PAK, PU | (Scircle et al., 2020) |
| Surface road dust | Vaccum cleaner for 1 min | D: 30 % H2O2 DS: NaI | 100-µm nylon net | NA | ATR-FTIR | 100–5000 | NA | PE, PP, PS, PET, PAK, PVS, EPC, SBR, EPDM, PU | (Yukioka et al., 2020) |
LDPE= Low Density Polyethylene, PS= Polystyrene, PE= polyethylene, PP=polypropylene, PA=polyamide, PO=polyolefin, acrylic fibers, CE= cellulose, EPS=Expanded polystyrene, PU=polyurethrane, PVC=polyvinyl chloride, ABS=Acrylonitrile butadiene styrene, PES=polyester, POM= Polyoxymethylene, PVS=Polyvinyl stearate, PAK= Polyacrylates, EPC=Ethylene/propylene copolymer, SBR=Styrene/butadiene rubber, EPDM= Ethylene/propylene/diene rubber
2.1 Sampling methods
In general, sampling of microplastics is classified as: (a) selective sampling which involves direct extraction of distinguishable plastic particles via naked eyes, (b) bulk sampling which considers whole sample volume without discarding any part of it, and (c) volume-reduced sampling which reduces the bulk sample to a suitable volume that can meet the interest of the study (Hidalgo-Ruz et al., 2012). Selective sampling is good if the plastic particles are large and are present in high concentration. If particles are smaller and present in lower concentration along with other particles, then bulk sampling is preferable. The volume-reduced approach can be considered if the sample volume becomes large to be processed (Hidalgo-Ruz et al., 2012). In addition, sampling varies greatly with the nature of matrix and size fraction.
2.1.1 Water sampling
River water sampling is generally done using sampling nets and or sampler of different types. Because of smaller size, nanoplastics cannot be sampled using nets. For microplastic sampling, nets of different types are available, and choice of net is determined by the intended size of the microplastic and vertical height of the water column. Important parameters to be considered in selecting nets are a) mesh size (Hidalgo-Ruz et al., 2012), b) net aperture (Moore et al., 2002; van Dolah et al., 1980) and, c) length (Hidalgo-Ruz et al., 2012; Lattin et al., 2004).
Large volume of surface water can be sampled using either neuston or mantra nets. The neuston nets are suited for higher waves (Carpenter and Smith, 1972; Morét-Ferguson et al., 2010) and the mantra nets are better for calm waters (Doyle et al., 2011; Eriksen et al., 2013). Large number of microplastic particles can be collected using these nets but the lower limit of detection is around 300 μm. Plankton nets are other types of nets used to sample medium volume of water under static flow conditions. Although plankton nets can have limit of detection as low as 100 μm, net clogging could be an issue (Campanale et al., 2020c).
Rotating drum sampler is another device to collect bulk samples (10 L) from the surface microlayer (1 to 1000 µm thick) through capillary force (Harvey and Burzell, 1972; Ng and Obbard, 2006). Plankton nets such as CalCOFI (California Cooperative Oceanic Fisheries Investigation) or Bongo nets (Doyle et al., 2011) are used for water column sampling. Depending on the distribution of microplastics, this method can be used in columns as deep as 200 m (Hidalgo-Ruz et al., 2012). Trawling speed of nets while collecting water samples is usually between 1 and 5 knots, depending on weather conditions and currents. Similarly, trawling time ranges from few minutes to several hours (Boerger et al., 2010; Mausra and Foster, n.d.).
Other techniques and/or instruments such as bulk sampling with subsequent filtration (Dubaish and Liebezeit, 2013; Ng and Obbard, 2006), Continuous Plankton Recorder (CPR) (Thompson, 2004), direct in situ filtrations (Norén and Naustvoll, 2010), epibenthic sled through a filter cascade (developed by −4H-JENA engineering GmbH) (Löder and Gerdts, 2015) are also in use.
2.1.2 Sediment and soil sampling
Sediment samples from beaches are collected with tablespoons, trowels, and shovels (Löder and Gerdts, 2015). The quantity of samples can range from 500 g to 10 kg, and the sampling depth can vary from 0 to 32 cm; top 5 cm being a usual selection (Claessens et al., 2011; Hidalgo-Ruz et al., 2012; Löder and Gerdts, 2015). In case of subtidal sediments, vessels with grabs (e.g., Van Veen or Ekman grab) or corers of different designs (e.g., a multiple corers) are used (Löder and Gerdts, 2015). Corers are used for deeper samples (>5 km) (Van Cauwenberghe et al., 2013). Sediment samples can be stored frozen or dried and kept in the dark till the next processing step.
Similar approaches can be adapted for soil samples. Usually, the top-soil of depth 0–25 cm is sampled with a metallic soil auger (Corradini et al., 2019). The other way could be the selection of sites, specify a suitable number of plots within the sites (for example, 5 plots of size 30 m × 5 m in one site), sub-sampling done with a narrow spade within each plot (for example, 6 sub-soil sample), and combined to form one composite sample (Zhang and Liu, 2018).
2.1.3 Air sampling
Indoor airborne microplastics can be sampled using a stand-alone sampling pump or a vacuum pump or vacuum cleaner. Pore size and type of filter material (normally glass fiber) used while sampling are the important parameters to consider. Outdoor sampling can be done by a rain sampler or particulate fallout collector or ambient filter sampler. Samples are set at a location of interest at a certain height for a chosen time period (Enyoh et al., 2019; Liu et al., 2019).
2.1.4 Biota sampling
Various organisms are also the study of interest. Larger organisms such as fish, smaller organisms such as worms, mussels, snails, and even corpses of birds, seals, cetaceans are collected for analysis. Generally, the digestive tract or the excreta are preserved using plastic-friendly fixative (for example, formalin) or stored frozen or dried and kept in the dark till the next processing. These organisms are usually sampled by nets or traps (Besseling et al., 2013; Löder and Gerdts, 2015).
2.2 Sample preparation methods
The concentration of micro- and nanoplastics in a matrix of interest is generally low. The low concentration demands series of concentration steps. We discuss following sample preparation methods for micro- and nanoplastis analysis.
2.2.1 Sieving
Sieve fractionation is essential to segregate and analyze plastic particles of intended size. Nature of samples and previously available studies on similar samples can help us figure out the size of particles to be considered. Size fractionation eases the selection of techniques and instruments to be used for the further analysis. In general, sieving in the range of ∼ 40 µm –5 mm can be achieved by stacking the sieves of variable mess size. Sieves are stacked in decreasing order of mesh size from top. The size fractions of interest are collected, dried at ∼ 60 °C, and stored well for next processing steps (Campanale et al., 2020b).
2.2.2 Digestion
Digestion is a sample purification step which is performed to remove organic matters present in a sieved sample. Two types of digestions are available: chemical digestion using acidic, basic, or oxidizing reagents, and enzymatic digestion (Claessens et al., 2013; Liebezeit and Dubaish, 2012; Cole et al., 2015; Löder et al., 2017; Stock et al., 2019).
Acid digestion involves hot nitric acid and hydrochloric acid. Base digestion uses potassium hydroxide and sodium hydroxide (Avio et al., 2015; Cole et al., 2015; Dehaut et al., 2016; Kühn et al., 2017; Nguyen et al., 2019; Stock et al., 2019). Commonly used oxidizing chemicals are acidic solution (3–5 pH) of hydrogen peroxide along with iron (II) as catalyst known as Fenton reagent (Mausra and Foster, n.d.), or hydrogen peroxide alone (Gies et al., 2018; Ziajahromi et al., 2017). The concentration and duration of treatment should be adjusted properly to minimize the risk of possible degradation of plastic polymers. Nitric acid can degrade polystyrene (PS), polyamide (PA), polyethylene (PE), and sodium hydroxide can degrade polyethylene terephthalate (PET) and polyvinyl chloride (PVC) (Claessens et al., 2013; Liebezeit and Dubaish, 2012; Stock et al., 2019).
Enzymatic digestion method is considered more promising sample purification step. Commonly used enzymes are lipase, cellulase, proteinase, corolase, amylase, chitinase, collagenase, papain, and trypsin (Löder and Gerdts, 2015; Cole et al., 2015; Catarino et al., 2017; Courtene-Jones et al., 2017; Li et al., 2018). These enzymes generally are plastic friendly. However, they are expensive and require longer time for digestion. A sequential combination of chemical and enzymatic digestants can also be implemented. In addition, parameters such as strength and volume of digestants, time, and temperature can be adjusted, depending on the level of purification required (Campanale et al., 2020b).
2.2.3 Density separation
Density separation is based on the simple principle that higher density particles tend to settle down, while lower density particles tend to either float on the surface or suspend in the supernatant of the solution. The density of micro/nanoplastics varies from 0.01 to 2.30 g cm−3 depending on polymer types and their manufacturing process (Frias et al., 2018; Hidalgo-Ruz et al., 2012).
In density separation procedure, mostly a saturated salt solution is used. Salt can be selected based on salt density, cost, and toxicity. Saturated sodium chloride (∼1.2 g cm−3) and sodium tungstate dehydrate (∼1.40 g cm−3) are comparatively cheaper and non-toxic, but cannot separate higher density particles like polycarbonate (PC) (1.20–1.22 g cm−3), polyurethane (PU) (1.20–1.26 g cm−3), PET (1.38–1.41 g cm−3), PVC (1.38–1.41 g cm−3), or polytetrafluoroethylene (PTFE) (2.10–2.30) (Campanale et al., 2020b; Frias et al., 2018). Saturated sodium iodide (1.80 g cm−3) can separate out most plastic particles however, it is too expensive to afford (Nuelle et al., 2014). Zinc chloride solution (1.6–1.8 g cm−3) is relatively affordable to purchase, but due to its high toxicity, careful handling, disposal, and recycling are recommended (Frias et al., 2014). Moreover, the salts like sodium iodide, sodium polytungstate (1.40 g cm−3), zinc chloride, and zinc bromide (1.71 g cm−3) have higher water solubility, and therefore, higher amounts of these salts are required (Campanale et al., 2020b).
During density separation, the mixture should be properly shaken for 30 s to 2 h and allowed to settle for 2 min to 24 h. A density separator, a centrifugation device, or a device based on the principle of elutriation assists density separation (Browne et al., 2010; Ng and Obbard, 2006; Thompson, 2004). Some studies also recommend the repetition of the density separation of the sample remains (Martins and Sobral, 2011).
2.2.4 Filtration
The supernatant obtained from density separation undergoes a filtration process, usually assisted by a vacuum. Nitrocellulose, silicon, polycarbonate, anodisc, or glass fiber filters are usually used with pore sizes ranging from 1 to 10 µm (Campanale et al., 2020b; Norén, 2007). The filter pore size is determined by the size of target plastic particles (Table 1). Filter clogging is one of the major issues in filtration. Sequential filtration using filter of decreasing pore size can be used to minimize filter clogging and separate the particles of different fraction. For example, Hernandez et al. used the sequential filtration method to separate nanoplastics of size < 100 nm in facial scrubs (Hernandez et al., 2017). The concentration information of the particles is difficult to obtain from the sequential filtration as significant number of small particles could retain in the filter.
2.2.5 Other methods of separation
Other separation approaches such as hydrophobic interactions, magnetic field extraction, and electrophoresis can also be implemented for separation. Further advancement is necessary so that they can be efficiently and reliably adopted for micro/nanoplastics analysis (Nguyen et al., 2019). Here, we briefly describe the approaches.
Froth floatation is based on hydrophobic interaction in which plastic particles adhere to the bubble surface and are carried to the air–liquid interface. Normally, the froth flotation results low particle recovery as the bubble size is difficult to control. For example, Imhof et al. reported recovery efficiency of 55 % for separation of large microplastic particles (1–5 mm) from sediments (Imhof et al., 2012). In another hydrophobic interaction-based separation method, Crichton et al. used oil to capture plastic particles (oleophilic interaction) from spiked sediment samples. A recovery rate of ∼ 92–99 % was achieved for particles of different sizes and shapes. However, this method needs potentially plastic damaging liquid (for example, ethanol) to clean the oil (Crichton et al., 2017).
Magnetic extraction also being explored for separation of plastic particles. Here, magnetic nanoparticles are hydrophobized via silanization in order to bind them to plastics and separate from a matrix (Grbic et al., 2019). A recovery of 92 % was reported for separation of 10–20 μm PE and PS particles from seawater. Recoveries of 84 % and 78 % were reported for separation of 200 μm to 1 mm plastic particles from freshwater and sediments, respectively (Table 1). The modified separation methods such as magnetic field flow fractionation could be explored to separate plastic particles of variable sizes (Nguyen et al., 2019).
Field flow fractionation (FFF) is an active chromatographic technique, used in the separation of microplastics. Here, an external field such as gravitational, thermal-gradient (Greyling and Pasch, 2017), centrifugal (Tadjiki et al., 2017), magnetic (Samanta et al., 2016), or electrical (Ornthai et al., 2016)) is applied through asymmetrical flow via a semi-permeable membrane (Podzimek, 2012), perpendicular to the flow, to separate out dispersed particles on the basis of their differentiated mobility (Contado, 2017). Asymmetrical flow field flow fractionation (AF4), a versatile FFF technique, can be applied for the size ranging from 1 to 800 nm (Gigault et al., 2017).
Hydrodynamic chromatography (HDC) is also being explored for the separation. HDC is a passive chromatographic technique, whereby hydrodynamic and surface forces are involved in separating particles in liquid. This technique has been employed in micro/nanoplastics analysis for the size range 10–1000 nm (Brewer and Striegel, 2010; Lespes and Gigault, 2011; Philippe et al., 2014). HDC is quick and easy to use, provides analytical repeatability, but has low selectivity with pore size resolution in comparison to FFF (Fu et al., 2020).
Recently, Triton-X-45 based cloud point extraction method is reported as an efficient method for concentrating nanoplastics in water samples (Zhou et al., 2018). Spiked recoveries for ∼ 66 nm polystyrene particles were found to be ≥ 84.6 % in river water, sea water, and effluent samples. Recovery rates for ∼ 86 nm PMMA particles were found to be ≥ 76.5 %.
2.3 Staining methods
Plastic like particles may remain in the sample even after a series of sample preparation steps. Plastic particles are therefore stained using different dyes to increase selectivity. Dye staining provides a rapid, cost effective, and convenient method for detection and quantification of plastic particles. After dye staining, the focus can be shifted to the stained particles for confirmation via microscopy and/or spectroscopy.
Staining can be achieved using different dyes such as Nile Red (NR), Eosin B, Rose Bengal, Hostasol Yellow 3G. Nile red is lipophilic and hydrophobic dye, and adsorbs easily on plastic surface. That is why this is one of the most preferred dyes (Erni-Cassola et al., 2017; Shim et al., 2016). Appropriate carrier solvents should be selected for dyes to dissolve. NR is polar in nature relative to plastics, so for better staining non-polar carrier solvents like n-hexane are more appropriate than polar solvents like acetone, ethanol, and ethylene glycol (Shim et al., 2016).
Dye concentration and incubation time also determine the staining. It has been demonstrated that due to NR aggregation at higher dye concentration, fluorescence intensity decreases. The optimum dye concentration is reported to be
2.4 Identification and quantification methods
2.4.1 Visual sorting
Visual sorting of large microplastics of size 1–5 mm is possible with naked eyes. This method requires basic knowledge on morphology and color of the particles, and can be a rapid, cost-efficient approach for preliminary sorting of microplastics (Nguyen et al., 2019). Basic information such as uniformity in color and morphology can be used to identify a plastic particle. In complex samples, visual inspection alone cannot provide definitive information. In such case, sample appropriate processing and hot needle test (melting test) can be used to get indication for thermoplastic. If a particle of interest melt or fold by touching it with a hot needle, then it can be counted as a plastic particle (Tunçer et al., 2018). Another method to identify plastic particle is poke test. On holding if particle gets stretched or shows resistance to break, then the particle can most likely be plastic. However, the test is limited to large microplastic particles (Primpke et al., 2020).
2.4.2 Optical microscopic techniques
Stained or unstained plastic particles can be imaged with an optical microscope to get information on shape, size, and concentration of microplastic particle. Optical microscopy has been implemented to examine microplastic in diverse sample types such as soil, water, sludge, dust following appropriate sample processing (Table 1).
Stereomicroscopic imaging is one of the most used methods for microplastic analysis. Stereomicroscope provides three-dimensional image, so plastic particles can be better discriminated than a simple visual sorting. Stereomicroscope offers low magnification (8-50X) and resolution and generally not suited for particles smaller than 100 µm. However, it offers larger field of view so that larger sample area can be accessed, and particles can be counted to get quantitative information. Furthermore, in complex matrix, stereomicroscopic identification alone cannot provide accurate identification (Eriksen et al., 2013; Hidalgo-Ruz et al., 2012; Shim et al., 2017; Song et al., 2015a). In such case, poke or hot needle test can be used to identify thermoplastic along with microscopic examination.
Other method of choice is the imaging of the sample with a commercial bright field or with a digital microscope. In this method, image can be collected at higher magnification (as high as 400X) so, plastic particles as low at 20 µm can be discriminated. Accuracy of method, however, depends on different parameters such as nature of matrix, and type and size of particles.
Fluorescence imaging is other method of choice. Fluorescence signal from a stained sample is collected using appropriate excitation/collection filter sets in a fluorescent microscope. Fluorescence imaging is more selective than bright field imaging and provides better contrast images for identification of white or transparent plastic particles (Fig. 3). With appropriate staining, particles as low as few micrometers can be discriminated. If fluorescent chemical additives and impurities are present in a sample, selectivity and accuracy of fluorescent imaging method decreases (Elert et al., 2017; Lee et al., 2020; Löder et al., 2017; Piruska et al., 2005).
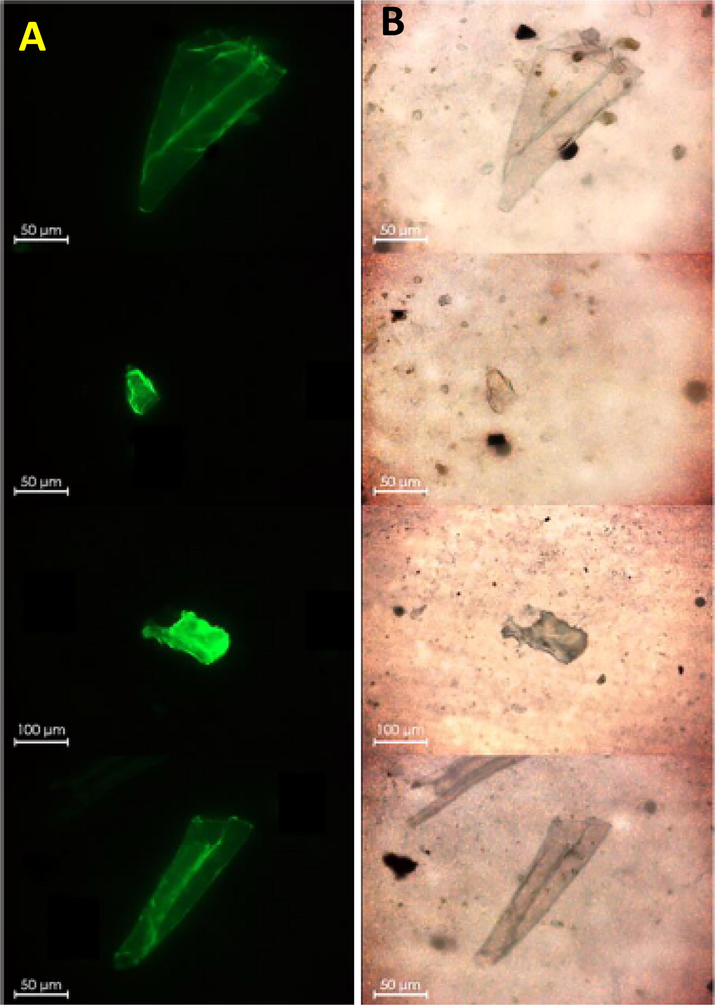
- (A) Fluorescence microscopic images of Nile red stained (5 mg/mL in acetone) microplastic particles imaged on a filter surface. (B) Corresponding brightfiled images. A scale bar of 50 μm is provided in all the images. Reprinted with permission from Ref. (Iannilli et al., 2020).
In all forms of microscopy once microplastic particles are identified, they can be grouped according to shape, size, and or color. Information on chemical identification of the particles is not possible. However, tweezers can be used to pick lager particles from the view for spectroscopic analysis.
2.4.3 Scanning electron microscopy
Scanning electron microscopy (SEM) provides higher resolution surface images of micro- and nanoplastic particles than an optical microscopy (Cooper and Corcoran, 2010). SEM imaging have been implemented for the study of particle morphology, effect to weathering, fragmentation pattern, and biodegradation in the microplastic particles obtained from diverse samples (Auta et al., 2018; Ter Halle et al., 2017; ter Halle et al., 2016; Zbyszewski et al., 2014).
SEM in combination with energy dispersive X-ray spectroscopy (EDS) can facilitate not only the morphological (size and shape) information of the particles but also their elemental composition or chemical identity (Ding et al., 2019; Goldstein et al., 2018; Wang et al., 2017). However, some challenges are involved during SEM analysis such as microplastics are generally non-conductive so SEM or SEM-EDS requires complicated sample preparation with high analysis time. Also, the high-energy electron beam can soften or burn some plastic particles (polyvinyl acetate (PVA), PVC) making analysis complicated. In addition, analyzing large number of samples is difficult both in terms of cost and instrumentation. This limits its applications in resource limited settings.
2.4.4 Transmission electron microscopy
In general, transmission electron microscopy (TEM) is used to characterize nanomaterials as it can provide spatial resolution down to atomic scale. In the case of micro/nanoplastics analysis, TEM finds limited scope. Firstly, nanoplastics are amorphous in structure, nonconductive and require high metallic staining to get reasonable contrast and so, TEM is ineffective to visualize nanoplastics. The high energy electron beam can also damage particles. TEM has complicated instrumentation, costly, and not user friendly. Thus, limiting its applications in resource limited settings. Nonetheless, TEM is being used to study the effect of microplastics on the model system, for examples, Sun et al. studied the toxic effect of PS micro/nanoplastics on the marine bacterium Halomonas alkaliphila with the aid of TEM (Sun et al., 2018), and Song et al. used TEM for the evaluation of possible effects of microplastics on microalgae (Song et al., 2020).
2.4.5 Atomic force microscopy
Atomic Force Microscopy (AFM) technique is highly beneficial to characterize particles of nanoscopic features and not limited to conductive samples. AFM also provides three-dimensional images of high resolution of few nanometers (up to 0.3 nm), requires a simple sample preparation, is suitable for surface investigation of non-conducting polymers like micro/nanoplastics, and avoids sample damage due to radiation. However, there are some limitations associated with AFM. For examples, it cannot avoid outside contaminations, tip can cause damage sample releasing fragments to the tip; thereby forming a wrong image of the sample. Although AFM instrumentation is much complicated than a traditional optical microscope, AFM imaging could find many applications in analysis of microplastic in different matrices (Mariano et al., 2021).
2.4.6 FTIR and micro-FTIR
Fourier transform infrared spectroscopy (FTIR) is a highly used technique for characterization based on vibrational frequency of specific bonds present in a molecule. Transmission mode is applicable on thin samples that can transmit IR beam through the samples. Diffuse reflectance mode is suitable for fine powder samples (<10 μm). Thick or strong-IR-absorbent samples mostly require attenuated total reflection (ATR) mode. Large, flat, and reflective surfaces prefer true specular reflectance/reflection-adsorption mode (Shim et al., 2017). FTIR is being used for identification and confirmation of plastic polymers, and also to gain information on physicochemical weathering of plastic particles. The problem associated is that it is a surface-contact analysis (ATR-FTIR) that can damage small, fragile plastic particles due to sample-tip adhesion or electrostatic interaction. Also, sample drying is required before IR spectroscopy because water can strongly absorbs IR spectroscopy (Löder et al., 2015). Spectroscopic information of single nano or small microplastic particle is not possible from traditional FTIR. The smallest size that can be studied at single particle level is ≥ 250 μm.
The combination of IR spectroscopy with IR microscope, collectively called as micro-FTIR (
2.4.7 Raman and micro-Raman
Raman spectroscopy is one of the highly used spectroscopic technique for the identification of microplastic powder or particles (≥500 μm) in various environmental samples. In recent years, micro-Raman (
2.4.8 Optical-photothermal infrared microspectroscopy (O-PTIR)
Traditional FTIR and Raman microscopy have poor spatial resolution, so their application in the analysis of nanoparticle is limited. Recently, O-PTIR is demonstrated as a label-free method for the analysis of micron and submicron sized plastic particles (0.6–332 μm) released from silicone teats subjected to steam disinfection (Su et al., 2022).
2.4.9 Thermo-analytical techniques
Microplastic particles obtained from a processed sample can be identified using variety of thermo-analytical techniques. As plastic polymers differ in their thermal stability, the thermo-analytical technique detects changes in the physical and chemical properties of polymer after degradation, allowing the identification of micro- and nanoplastics in different matrices (Majewsky et al., 2016). Several variants of thermo-analytical techniques are being explored in the study of microplastics. Here, we briefly describe these techniques.
Differential Scanning Calorimetry (DSC): DSC measures the temperature and the heat flux associated with the transitions in a sample, the melting enthalpies, the glass transitions, and crystallization kinetics of polymeric materials. Mostly, primary microplastics of known characteristics are identified as DSC requires reference materials. In the case of a mixture of microplastics that have close melting points, DSC lacks specificity (Mariano et al., 2021; Tsukame et al., 1997).
Thermogravimetry (TGA): TGA measures the mass lost from a sample at a certain temperature and provides graphs (mass as a function of temperature) of thermogravimetric details. It is widely used for polymeric materials where polymeric degradation occurs frequently with enthalpy changes (Mariano et al., 2021). TGA in combination with DSC can measure enthalpy changes so this combination is suggested for microplastic analysis (Golebiewski and Galeski, 2007). This is applicable for PE and polypropylene (PP), but for other polymers (PVC, PA, polyesters (PES), PET and PU), this combination fails to identify because of overlapping phase transition signals (Majewsky et al., 2016).
Gas Chromatography-Mass Spectrometry (GC–MS): In recent years, GC–MS is also being used in in chemical identification of microplastics based on mass fragmentation pattern. Also, GC–MS can be used to study the adsorbed organic matter and volatile plastic additives present on the microplastics. Furthermore, GC–MS can be combined with other techniques like pyrolysis and thermal desorption for characterization of microplastics (Fischer and Scholz-Böttcher, 2017; Fries et al., 2013; Nuelle et al., 2014).
Pyrolysis-Gas-Chromatography-Mass-Spectrometry (Py-GC–MS): Unlike traditional GC–MS, Py-GC–MS requires no sample pre-treatment allowing characterization of microplastic polymer and contaminant at reduced cost and time (Fries et al., 2013). Moreover, Py-GC–MS offers higher sensitivity than thermal desorption-GC–MS so that small masses of nanoplastics as low as 50 μg can be studied. The limitations are: i) it is destructive technique and sample cannot be reused, ii) the results depend on the sample preparation, pyrolysis type, and pyrolysate transfer. So, Py-GC–MS poses challenges to inter-lab reproducibility (Dworzanski and Meuzelaar, 2017). This technique is applicable for simple matrices, where the separation is convenient, like in case of drinking water sample.
Thermal-Desorption-Gas-Chromatography-Mass-Spectrometry (TDS-GC–MS): In this, a sample onto a thermogravimetric balance is heated to temperature (up to 1000℃), degraded fragments generated get adsorbed onto a solid phase and transferred to a thermal desorption unit and then separated with GC and analyzed by MS. As in typical GC–MS, this technique does not require organic solvent for sample processing so that possible contamination from solvent impurities is minimized. Although TDS provides alternative method to spectroscopy, it being a destructive techniques further analysis of particles with other analytical methods is hindered. Unlike Py-GC–MS, TDS-GC–MS is suitable for samples with relatively high mass (up to 100 mg); however, qualitative analysis is very challenging (Dümichen et al., 2015; Mariano et al., 2021).
Matrix-assisted laser desorption/ionization time-of-flight mass spectrometry (MALDI-TOF-MS): It is a widely used technique for the polymer analysis and provides molecular weight distribution, co-polymer compositions, and also polymerization mechanism information (Dimzon and Knepper, 2012). By coupling with an imaging technique (MALDI MSI), morphological information and information on chemical structure changes due to degradation can be obtained (Rivas et al., 2016). In future, MALDI-TOF-MS can be a promising technique for microplastics analysis in various environmental samples (Huppertsberg and Knepper, 2018).
3 Emerging tools and strategies
In recent years, several emerging techniques are being explored for identification and quantification of micro- and nanoplastics. Application of these methods in the environmental samples are not fully explored. Here, a brief overview of these methods is provided.
Dynamic light scattering (DLS) technique is one of frequently used methods to study the size distribution of micro- and nanoparticles, for example polymeric colloidal micro- and nanoparticles in solution phase; effective within the size range 1 nm – 10 µm (Fu et al., 2020; Gambardella et al., 2017; González-Fernández et al., 2018; Summers et al., 2018). Gigault et al. used DLS with photo-detector to investigate photo-degradation of marine microplastics (Gigault et al., 2016). DLS will find many applications in future to study the size distribution in processed environmental samples. However, if other nanoplastic particles that can scatter light are present in the solution, the measured particle size distribution can have significant error (EFSA Panel on Contaminants in the Food Chain (CONTAM), 2016).
Nanoparticle tracking analysis (NTA) could be another method to study the distribution of micro- and nanoplastic particles in environmental samples. NTA is able to detect individual particles as low as 10 nm and provide individual particle size information instead of average size data as in the case of DLS. Brownian motion limits the accuracy so, particles should not be too close or too poly-dispersed. This analysis technique has been widely used for colloidal nanoparticles (Ryu et al., 2007; Studer et al., 2010), while there are far fewer applications for microplastic research (Fu et al., 2020).
Hyperspectral imaging (HSI) is being explored as a fast, label-free, non-invasive, non-destructive, and reliable imaging technique for visualization, chemical identification, and mapping chemical distributions of targeted species. Its use in the investigation of shape, size, and polymer types of microplastics has been reported (Serranti et al., 2018; Zhang et al., 2019). The limitations involve difficulty in operation and data processing, lower imaging quality than electron microscope and low scanning frame rates.
Majority of currently available optical microscopic techniques require sample staining for better contrast. To solve this issue, digital holography (DH) could be implemented as label-free, three-dimensional imaging method for analysis of micro- and nanoplastics in different matrices. DH coupled with artificial intelligence systems could be used as a rapid and accurate method (>99 %) to identify and qualify micro- and nanoplastics (Mariano et al., 2021).
A summary of quantification and identification methods is provided in Fig. 4.
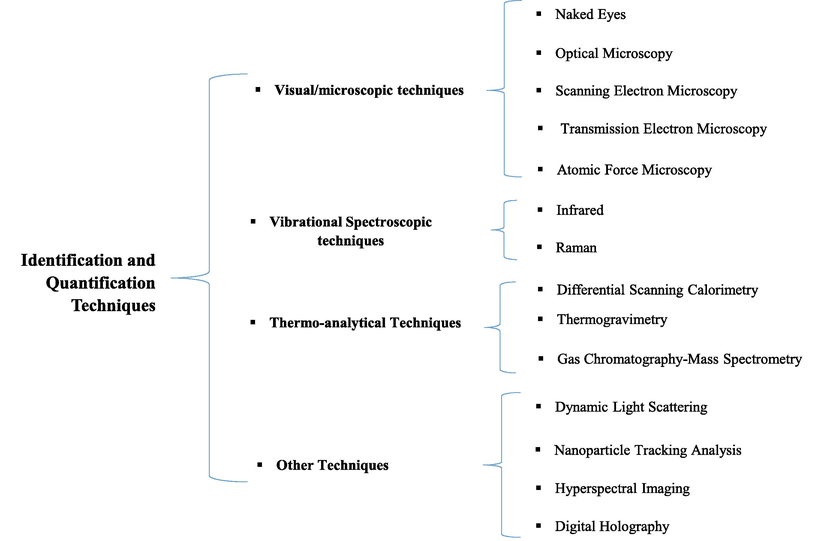
- A summary of quantification and identification methods.
4 Conclusions and perspectives
Micro- and nanoplastics are reported to exist in diverse matrices. Detection and quantification of these particles are often challenging due to their small size and complexity of the matrix in which they exist. Choice of an analytical method is largely determined by the concentration and size of the particles, and the nature of the matrix.
Currently available micro- and nanoplastics analysis require size and matrix specific processing steps. Also, two independent equipments or methods are normally required for counting and chemical identification of the particles. This makes the analysis labor intensive and time consuming. A strategy that can integrate sample processing, identification and quantification as a single component would be promising to analyze large number of samples. Also, artificial intelligence-based methods could be implemented for automated counting of microplastics.
The level of micro- and nanoplastics in a sample of interest can change significantly over time. To minimize the exposure, routine onsite analysis would be important. Currently available analysis methods require skilled manpower, are costly, and not suited for onsite testing. A method that can overcome these limitations would be important.
To minimize distribution of the plastic particles and human exposure, effective management strategies are important. Several organizations such as, the United Nations Expert Panel of the United Nations Environmental Program (UNEP), the United Nations Environment Program/Mediterranean Action Plan (UNEP-MAP), the Oslo/Paris Convention (OSPAR), the Baltic Marine Environment Protection Commission – Helsinki Commission (HELCOM), the Joint Group of Experts on the Scientific Aspects of Marine Environmental Protection (GEAMP) have developed management guidelines. Identifying the origins of micro- and nanoplastics and creating awareness via education can minimize their entry into the environment.
A potential and environment friendly approach in the management of micro- and nanoplastics could be harnessing microbes for plastic degradation. For examples, Staphylococcus sp., Pseudomonas sp. and Bacillus sp. are reported to degrade PE (Singh, 2016), Aspergillus niger, Pseudomonas aeruginosa, Bacillus subtilis, Staphylococcus aureus, and Streptococcus pyogenes can degrade PET and PS (Asmita et al., 2015). Promoting use of bio-degradable materials is equally important to minimize plastic based debris.
Acknowledgement
This work was partially supported by University Grants Commission, Nepal (To BBN; Grants# FRG-2076/77-S&T-3).
Declaration of Competing Interest
The authors declare that they have no known competing financial interests or personal relationships that could have appeared to influence the work reported in this paper.
References
- Microplastics in the Mediterranean Sea: deposition in coastal shallow sediments, spatial variation and preferential grain size. Mar. Environ. Res.. 2016;115:1-10.
- [CrossRef] [Google Scholar]
- Identification of microplastics using Raman spectroscopy: Latest developments and future prospects. Water Res.. 2018;142:426-440.
- [CrossRef] [Google Scholar]
- Proceedings of the international research workshop on the occurrence, effects and fate of microplastic marine debris. Natl. Ocean. Atmospheric Adm. Tech. Memo. 2009:NOS-ORR-30.
- [Google Scholar]
- Isolation of plastic degrading micro-organisms from soil samples collected at various locations in Mumbai. India. 2015;4:9.
- [Google Scholar]
- Growth kinetics and biodeterioration of polypropylene microplastics by Bacillus sp. and Rhodococcus sp. isolated from mangrove sediment. Mar. Pollut. Bull.. 2018;127:15-21.
- [Google Scholar]
- Experimental development of a new protocol for extraction and characterization of microplastics in fish tissues: first observations in commercial species from Adriatic Sea. Mar. Environ. Res.. 2015;111:18-26.
- [CrossRef] [Google Scholar]
- Occurrence and abundance of meso and microplastics in sediment, surface waters, and marine biota from the South Pacific region. Mar. Pollut. Bull.. 2020;160:111572
- [CrossRef] [Google Scholar]
- Effects of Microplastic on Fitness and PCB Bioaccumulation by the Lugworm Arenicola marina (L.) Environ. Sci. Technol.. 2013;47:593-600.
- [CrossRef] [Google Scholar]
- Plastic ingestion by planktivorous fishes in the North Pacific Central Gyre. Mar. Pollut. Bull.. 2010;60:2275-2278.
- [CrossRef] [Google Scholar]
- Primary microplastics in the oceans: a global evaluation of sources. IUCN Int. Union Conservation Nature 2017
- [CrossRef] [Google Scholar]
- Potential health impact of environmentally released micro- and nanoplastics in the human food production chain: experiences from nanotoxicology. Environ. Sci. Technol.. 2015;49:8932-8947.
- [CrossRef] [Google Scholar]
- Hydrodynamic chromatography of latex blends. J. Sep. Sci.. 2010;33:3555-3563.
- [CrossRef] [Google Scholar]
- Spatial patterns of plastic debris along estuarine shorelines. Environ. Sci. Technol.. 2010;44:3404-3409.
- [CrossRef] [Google Scholar]
- Microplastics in marine sediments and rabbitfish (Siganus fuscescens) from selected coastal areas of Negros Oriental. Philippines. Mar. Pollut. Bull.. 2020;150:110685
- [CrossRef] [Google Scholar]
- A practical overview of methodologies for sampling and analysis of microplastics in riverine environments. Sustainability. 2020;12:6755.
- [CrossRef] [Google Scholar]
- A detailed review study on potential effects of microplastics and additives of concern on human health. Int. J. Environ. Res. Public. Health. 2020;17:1212.
- [CrossRef] [Google Scholar]
- A method for the characterisation of microplastics in sludge. MethodsX. 2019;6:2776-2781.
- [CrossRef] [Google Scholar]
- Development and optimization of a standard method for extraction of microplastics in mussels by enzyme digestion of soft tissues: Standard method for microplastic extraction from mussels. Environ. Toxicol. Chem.. 2017;36:947-951.
- [CrossRef] [Google Scholar]
- Occurrence and distribution of microplastics in marine sediments along the Belgian coast. Mar. Pollut. Bull.. 2011;62:2199-2204.
- [CrossRef] [Google Scholar]
- New techniques for the detection of microplastics in sediments and field collected organisms. Mar. Pollut. Bull.. 2013;70:227-233.
- [CrossRef] [Google Scholar]
- Microplastic Ingestion by Zooplankton. Environ. Sci. Technol.. 2013;47:6646-6655.
- [CrossRef] [Google Scholar]
- Isolation of microplastics in biota-rich seawater samples and marine organisms. Sci. Rep.. 2015;4:4528.
- [CrossRef] [Google Scholar]
- Field flow fractionation techniques to explore the “nano-world”. Anal. Bioanal. Chem.. 2017;409:2501-2518.
- [CrossRef] [Google Scholar]
- Effects of mechanical and chemical processes on the degradation of plastic beach debris on the island of Kauai. Hawaii. Mar. Pollut. Bull.. 2010;60:650-654.
- [CrossRef] [Google Scholar]
- Evidence of microplastic accumulation in agricultural soils from sewage sludge disposal. Sci. Total Environ.. 2019;671:411-420.
- [CrossRef] [Google Scholar]
- Optimisation of enzymatic digestion and validation of specimen preservation methods for the analysis of ingested microplastics. Anal. Methods. 2017;9:1437-1445.
- [CrossRef] [Google Scholar]
- A novel, density-independent and FTIR-compatible approach for the rapid extraction of microplastics from aquatic sediments. Anal. Methods. 2017;9:1419-1428.
- [CrossRef] [Google Scholar]
- (Nano)plastics in the environment – Sources, fates and effects. Sci. Total Environ.. 2016;566–567:15-26.
- [CrossRef] [Google Scholar]
- Microplastics in seafood: Benchmark protocol for their extraction and characterization. Environ. Pollut.. 2016;215:223-233.
- [CrossRef] [Google Scholar]
- The pollution of the marine environment by plastic debris: a review. Mar. Pollut. Bull.. 2002;44:842-852.
- [CrossRef] [Google Scholar]
- Microplastics in surface waters and sediments of the Three Gorges Reservoir. China. Sci. Total Environ.. 2018;616–617:1620-1627.
- [CrossRef] [Google Scholar]
- Dimzon, I.K.D., Knepper, T.P., 2012. MALDI–TOF MS for Characterization of Synthetic Polymers in Aqueous Environment, in: Comprehensive Analytical Chemistry. Elsevier, pp. 307–338. https://doi.org/10.1016/B978-0-444-53810-9.00008-0.
- Detection of microplastics in local marine organisms using a multi-technology system. Anal. Methods. 2019;11:78-87.
- [Google Scholar]
- Plastic particles in coastal pelagic ecosystems of the Northeast Pacific ocean. Mar. Environ. Res.. 2011;71:41-52.
- [CrossRef] [Google Scholar]
- Suspended Microplastics and Black Carbon Particles in the Jade System, Southern North Sea. Water. Air. Soil Pollut.. 2013;224:1352.
- [CrossRef] [Google Scholar]
- Microplastics in the aquatic and terrestrial environment: sources (with a specific focus on personal care products), fate and effects. Environ. Sci. Eur.. 2016;28:2.
- [CrossRef] [Google Scholar]
- Analysis of polyethylene microplastics in environmental samples, using a thermal decomposition method. Water Res.. 2015;85:451-457.
- [CrossRef] [Google Scholar]
- Dworzanski, J.P., Meuzelaar, H.L.C., 2017. Pyrolysis Mass Spectrometry, Methods☆, in: Lindon, J.C., Tranter, G.E., Koppenaal, D.W. (Eds.), Encyclopedia of Spectroscopy and Spectrometry (Third Edition). Academic Press, Oxford, pp. 789–801. https://doi.org/10.1016/B978-0-12-409547-2.11686-5.
- EFSA Panel on Contaminants in the Food Chain (CONTAM), 2016. Presence of microplastics and nanoplastics in food, with particular focus on seafood. EFSA J. 14. https://doi.org/10.2903/j.efsa.2016.4501.
- Comparison of different methods for MP detection: What can we learn from them, and why asking the right question before measurements matters? Environ. Pollut.. 2017;231:1256-1264.
- [CrossRef] [Google Scholar]
- Airborne microplastics: a review study on method for analysis, occurrence, movement and risks. Environ. Monit. Assess.. 2019;191:668.
- [CrossRef] [Google Scholar]
- Microplastic pollution in the surface waters of the Laurentian Great Lakes. Mar. Pollut. Bull.. 2013;77:177-182.
- [CrossRef] [Google Scholar]
- Lost, but Found with Nile Red: A Novel Method for Detecting and Quantifying Small Microplastics (1 mm to 20 μm) in Environmental Samples. Environ. Sci. Technol.. 2017;51:13641-13648.
- [CrossRef] [Google Scholar]
- Contributing to marine pollution by washing your face: Microplastics in facial cleansers. Mar. Pollut. Bull.. 2009;58:1225-1228.
- [CrossRef] [Google Scholar]
- Simultaneous trace identification and quantification of common types of microplastics in environmental samples by pyrolysis-gas chromatography-mass spectrometry. Environ. Sci. Technol.. 2017;51:5052-5060.
- [CrossRef] [Google Scholar]
- Fin whales and microplastics: the Mediterranean Sea and the Sea of Cortez scenarios. Environ. Pollut.. 2016;209:68-78.
- [CrossRef] [Google Scholar]
- Frias, J., Pagter, E., Nash, R., O’Connor, I., Carretero, O., Filgueiras, A., Viñas, L., Gago, J., Antunes, J., Bessa, F., Sobral, P., Goruppi, A., Tirelli, V., Pedrotti, M.L., Suaria, G., Aliani, S., Lopes, C., Raimundo, J., Caetano, M., Gerdts, G., 2018. Standardised protocol for monitoring microplastics in sediments. https://doi.org/10.13140/RG.2.2.36256.89601/1.
- Evidence of microplastics in samples of zooplankton from Portuguese coastal waters. Mar. Environ. Res.. 2014;95:89-95.
- [CrossRef] [Google Scholar]
- Identification of polymer types and additives in marine microplastic particles using pyrolysis-GC/MS and scanning electron microscopy. Environ. Sci. Process. Impacts. 2013;15:1949.
- [CrossRef] [Google Scholar]
- Separation, characterization and identification of microplastics and nanoplastics in the environment. Sci. Total Environ.. 2020;721:137561
- [CrossRef] [Google Scholar]
- Effects of polystyrene microbeads in marine planktonic crustaceans. Ecotoxicol. Environ. Saf.. 2017;145:250-257.
- [CrossRef] [Google Scholar]
- Retention of microplastics in a major secondary wastewater treatment plant in Vancouver. Canada. Mar. Pollut. Bull.. 2018;133:553-561.
- [CrossRef] [Google Scholar]
- Marine plastic litter: the unanalyzed nano-fraction. Environ. Sci. Nano. 2016;3:346-350.
- [CrossRef] [Google Scholar]
- Asymmetrical flow field flow fractionation methods to characterize submicron particles: application to carbon-based aggregates and nanoplastics. Anal. Bioanal. Chem.. 2017;409:6761-6769.
- [CrossRef] [Google Scholar]
- Current opinion: What is a nanoplastic? Environ. Pollut.. 2018;235:1030-1034.
- [CrossRef] [Google Scholar]
- Goldstein, J.I., Newbury, D.E., Michael, J.R., Ritchie, N.W.M., Scott, J.H.J., Joy, D.C., 2018. Scanning Electron Microscopy and X-Ray Microanalysis, 4th ed. Springer-Verlag, New York. https://doi.org/10.1007/978-1-4939-6676-9.
- Thermal stability of nanoclay polypropylene composites by simultaneous DSC and TGA. Compos. Sci. Technol.. 2007;67:3442-3447.
- [CrossRef] [Google Scholar]
- Cellular responses of Pacific oyster (Crassostrea gigas) gametes exposed in vitro to polystyrene nanoparticles. Chemosphere. 2018;208:764-772.
- [CrossRef] [Google Scholar]
- Magnetic extraction of microplastics from environmental samples. Environ. Sci. Technol. Lett.. 2019;6:68-72.
- [CrossRef] [Google Scholar]
- Plastic ‘scrubbers’ in hand cleansers: a further (and minor) source for marine pollution identified. Mar. Pollut. Bull.. 1996;32:867-871.
- [CrossRef] [Google Scholar]
- Multidetector thermal field-flow fractionation for the characterization of vinyl polymers in binary solvent systems. Macromolecules. 2017;50:569-579.
- [CrossRef] [Google Scholar]
- Microplastics in municipal wastewater treatment plants in Turkey: a comparison of the influent and secondary effluent concentrations. Environ. Monit. Assess.. 2018;190:626.
- [CrossRef] [Google Scholar]
- Source, migration and toxicology of microplastics in soil. Environ. Int.. 2020;137:105263
- [CrossRef] [Google Scholar]
- The applicability of reflectance micro-Fourier-transform infrared spectroscopy for the detection of synthetic microplastics in marine sediments. Sci. Total Environ.. 2012;416:455-463.
- [CrossRef] [Google Scholar]
- A simple microlayer method for small Samples1. Limnol. Oceanogr.. 1972;17:156-157.
- [CrossRef] [Google Scholar]
- Are there nanoplastics in your personal care products? Environ. Sci. Technol. Lett.. 2017;4:280-285.
- [CrossRef] [Google Scholar]
- Microplastics in the marine environment: a review of the methods used for identification and quantification. Environ. Sci. Technol.. 2012;46:3060-3075.
- [CrossRef] [Google Scholar]
- Instrumental analysis of microplastics—benefits and challenges. Anal. Bioanal. Chem.. 2018;410:6343-6352.
- [CrossRef] [Google Scholar]
- Plastic abundance and seasonal variation on the shorelines of three volcanic lakes in Central Italy: can amphipods help detect contamination? Environ. Sci. Pollut. Res.. 2020;27:14711-14722.
- [Google Scholar]
- A novel, highly efficient method for the separation and quantification of plastic particles in sediments of aquatic environments: Novel plastic particle separation method. Limnol. Oceanogr. Methods. 2012;10:524-537.
- [CrossRef] [Google Scholar]
- Smaller-sized micro-plastics (MPs) contamination in single-use PET-bottled water in Thailand. Sci. Total Environ.. 2020;717:137232
- [CrossRef] [Google Scholar]
- Analysis of environmental microplastics by vibrational microspectroscopy: FTIR, Raman or both? Anal. Bioanal. Chem.. 2016;408:8377-8391.
- [CrossRef] [Google Scholar]
- The use of potassium hydroxide (KOH) solution as a suitable approach to isolate plastics ingested by marine organisms. Mar. Pollut. Bull.. 2017;115:86-90.
- [CrossRef] [Google Scholar]
- A comparison of neustonic plastic and zooplankton at different depths near the southern California shore. Mar. Pollut. Bull.. 2004;49:291-294.
- [CrossRef] [Google Scholar]
- Fluorescence Signatures of Dissolved Organic Matter Leached from Microplastics: Polymers and Additives. Environ. Sci. Technol.. 2020;54:11905-11914.
- [CrossRef] [Google Scholar]
- Sorption capacity of plastic debris for hydrophobic organic chemicals. Sci. Total Environ.. 2014;470–471:1545-1552.
- [CrossRef] [Google Scholar]
- Emergence of nanoplastic in the environment and possible impact on human health. Environ. Sci. Technol.. 2019;53:1748-1765.
- [CrossRef] [Google Scholar]
- Hyphenated analytical techniques for multidimensional characterisation of submicron particles: A review. Anal. Chim. Acta. 2011;692:26-41.
- [CrossRef] [Google Scholar]
- Microplastics in sewage sludge from the wastewater treatment plants in China. Water Res.. 2018;142:75-85.
- [CrossRef] [Google Scholar]
- Microplastics in Beaches of the East Frisian Islands Spiekeroog and Kachelotplate. Bull. Environ. Contam. Toxicol.. 2012;89:213-217.
- [CrossRef] [Google Scholar]
- Accurate quantification and transport estimation of suspended atmospheric microplastics in megacities: implications for human health. Environ. Int.. 2019;132:105127
- [CrossRef] [Google Scholar]
- Löder, M.G.J., Gerdts, G., 2015. Methodology Used for the Detection and Identification of Microplastics—A Critical Appraisal, in: Bergmann, M., Gutow, L., Klages, M. (Eds.), Marine Anthropogenic Litter. Springer International Publishing, Cham, pp. 201–227. https://doi.org/10.1007/978-3-319-16510-3_8.
- Focal plane array detector-based micro-Fourier-transform infrared imaging for the analysis of microplastics in environmental samples. Environ. Chem.. 2015;12:563.
- [CrossRef] [Google Scholar]
- Enzymatic purification of microplastics in environmental samples. Environ. Sci. Technol.. 2017;51:14283-14292.
- [CrossRef] [Google Scholar]
- A simple method for detecting and quantifying microplastics utilizing fluorescent dyes - Safranine T, fluorescein isophosphate, Nile red based on thermal expansion and contraction property. Environ. Pollut.. 2019;255:113283
- [CrossRef] [Google Scholar]
- A rapid-screening approach to detect and quantify microplastics based on fluorescent tagging with Nile Red. Sci. Rep.. 2017;7:44501.
- [CrossRef] [Google Scholar]
- Determination of microplastic polyethylene (PE) and polypropylene (PP) in environmental samples using thermal analysis (TGA-DSC) Sci. Total Environ.. 2016;568:507-511.
- [CrossRef] [Google Scholar]
- Micro and nanoplastics identification: classic methods and innovative detection techniques. Front. Toxicol.. 2021;3:636640
- [CrossRef] [Google Scholar]
- Plastic marine debris on the Portuguese coastline: a matter of size? Mar. Pollut. Bull.. 2011;62:2649-2653.
- [CrossRef] [Google Scholar]
- Mausra, B., Foster, A., n.d. Laboratory methods for the analysis of microplastics in the marine environment 39.
- Source, distribution and emerging threat of micro- and nanoplastics to marine organism and human health: Socio-economic impact and management strategies. Environ. Res.. 2021;195:110857
- [CrossRef] [Google Scholar]
- A comparison of neustonic plastic and zooplankton abundance in southern California’s coastal waters. Mar. Pollut. Bull.. 2002;44:1035-1038.
- [CrossRef] [Google Scholar]
- The size, mass, and composition of plastic debris in the western North Atlantic Ocean. Mar. Pollut. Bull.. 2010;60:1873-1878.
- [CrossRef] [Google Scholar]
- Prevalence of microplastics in Singapore’s coastal marine environment. Mar. Pollut. Bull.. 2006;52:761-767.
- [CrossRef] [Google Scholar]
- Separation and analysis of microplastics and nanoplastics in complex environmental samples. Acc. Chem. Res.. 2019;52:858-866.
- [CrossRef] [Google Scholar]
- A new analytical approach for monitoring microplastics in marine sediments. Environ. Pollut.. 2014;184:161-169.
- [CrossRef] [Google Scholar]
- Biased cyclical electrical field-flow fractionation for separation of submicron particles. Anal. Bioanal. Chem.. 2016;408:855-863.
- [CrossRef] [Google Scholar]
- Getting into the Brain: Approaches to Enhance Brain Drug Delivery. CNS Drugs. 2009;23:35-58.
- [CrossRef] [Google Scholar]
- Evaluation of hydrodynamic chromatography coupled with inductively coupled plasma mass spectrometry detector for analysis of colloids in environmental media – effects of colloid composition, coating and shape. Anal Methods. 2014;6:8722-8728.
- [CrossRef] [Google Scholar]
- The autofluorescence of plastic materials and chips measured under laser irradiation. Lab. Chip. 2005;5:1348.
- [CrossRef] [Google Scholar]
- Asymmetric Flow Field Flow Fractionation. In: Meyers R.A., ed. Encyclopedia of Analytical Chemistry. Chichester, UK: John Wiley & Sons Ltd; 2012. p. :a9289.
- [CrossRef] [Google Scholar]
- Critical assessment of analytical methods for the harmonized and cost-efficient analysis of microplastics. Appl. Spectrosc.. 2020;74:1012-1047.
- [Google Scholar]
- Potential human health risks due to environmental exposure to nano- and microplastics and knowledge gaps: A scoping review. Sci. Total Environ.. 2021;757:143872
- [CrossRef] [Google Scholar]
- MALDI-TOF MS Imaging evidences spatial differences in the degradation of solid polycaprolactone diol in water under aerobic and denitrifying conditions. Sci. Total Environ.. 2016;566–567:27-33.
- [CrossRef] [Google Scholar]
- Plastic and other artefacts on South African beaches: Temporal trends in abundance and composition. AFR J SCIS-AFR TYDSKR WET. 1990;86:450-452.
- [Google Scholar]
- Pulsed laser induced synthesis of scheelite-type colloidal nanoparticles in liquid and the size distribution by nanoparticle tracking analysis. Appl. Surf. Sci.. 2007;253:8408-8414.
- [CrossRef] [Google Scholar]
- Operating regimes of a magnetic split-flow thin (SPLITT) fractionation microfluidic device for immunomagnetic separation. Microfluid. Nanofluidics. 2016;20:87.
- [CrossRef] [Google Scholar]
- The abundance and characteristics of microplastics in rainwater pipelines in Wuhan, China. Sci. Total Environ.. 2021;755
- [CrossRef] [Google Scholar]
- Analysis of microplastics in water by micro-Raman spectroscopy: Release of plastic particles from different packaging into mineral water. Water Res.. 2018;129:154-162.
- [CrossRef] [Google Scholar]
- Analysis of microplastics in drinking water and other clean water samples with micro-Raman and micro-infrared spectroscopy: minimum requirements and best practice guidelines. Anal. Bioanal. Chem.. 2021;413:5969-5994.
- [Google Scholar]
- Single-Pot method for the collection and preparation of natural water for microplastic analyses: microplastics in the Mississippi river system during and after historic flooding. Environ. Toxicol. Chem.. 2020;39:986-995.
- [CrossRef] [Google Scholar]
- Assessment of microplastic pollution: occurrence and characterisation in Vesijärvi lake and Pikku Vesijärvi pond. Finland. Environ. Monit. Assess.. 2019;191:652.
- [CrossRef] [Google Scholar]
- Characterization of microplastic litter from oceans by an innovative approach based on hyperspectral imaging. Waste Manag.. 2018;76:117-125.
- [CrossRef] [Google Scholar]
- Identification and quantification of microplastics using Nile Red staining. Mar. Pollut. Bull.. 2016;113:469-476.
- [CrossRef] [Google Scholar]
- Identification methods in microplastic analysis: a review. Anal. Methods. 2017;9:1384-1391.
- [CrossRef] [Google Scholar]
- Microplastics in freshwater sediments of Atoyac River basin, Puebla City. Mexico. Sci. Total Environ.. 2019;654:154-163.
- [CrossRef] [Google Scholar]
- Biodegradation of polythenes by bacteria isolated from soil. Int. J. Res. Pharm. Biomed. Sci.. 2016;5:2016.
- [Google Scholar]
- A comparison of microscopic and spectroscopic identification methods for analysis of microplastics in environmental samples. Mar. Pollut. Bull.. 2015;93:202-209.
- [CrossRef] [Google Scholar]
- Occurrence and Distribution of Microplastics in the Sea Surface Microlayer in Jinhae Bay, South Korea. Arch. Environ. Contam. Toxicol.. 2015;69:279-287.
- [CrossRef] [Google Scholar]
- Different interaction performance between microplastics and microalgae: The bio-elimination potential of Chlorella sp. L38 and Phaeodactylum tricornutum MASCC-0025. Sci. Total Environ.. 2020;723:138146
- [CrossRef] [Google Scholar]
- Sampling techniques and preparation methods for microplastic analyses in the aquatic environment – A review. TrAC Trends Anal. Chem.. 2019;113:84-92.
- [CrossRef] [Google Scholar]
- Micro-(nano) plastics in freshwater ecosystems: abundance, toxicological impact and quantification methodology. TrAC Trends Anal. Chem.. 2019;110:116-128.
- [Google Scholar]
- Nanoparticle cytotoxicity depends on intracellular solubility: Comparison of stabilized copper metal and degradable copper oxide nanoparticles. Toxicol. Lett.. 2010;197:169-174.
- [CrossRef] [Google Scholar]
- Steam disinfection releases micro (nano) plastics from silicone-rubber baby teats as examined by optical photothermal infrared microspectroscopy. Nat. Nanotechnol.. 2022;17:76-85.
- [Google Scholar]
- Agglomeration of nano- and microplastic particles in seawater by autochthonous and de novo-produced sources of exopolymeric substances. Mar. Pollut. Bull.. 2018;130:258-267.
- [CrossRef] [Google Scholar]
- Toxicities of polystyrene nano- and microplastics toward marine bacterium Halomonas alkaliphila. Sci. Total Environ.. 2018;642:1378-1385.
- [CrossRef] [Google Scholar]
- Measurement of the Density of Engineered Silver Nanoparticles Using Centrifugal FFF-TEM and Single Particle ICP-MS. Anal. Chem.. 2017;89:6056-6064.
- [CrossRef] [Google Scholar]
- Solutions to microplastic pollution–Removal of microplastics from wastewater effluent with advanced wastewater treatment technologies. Water Res.. 2017;123:401-407.
- [Google Scholar]
- Microplastics and associated PAHs in surface water from the Feilaixia Reservoir in the Beijiang River, China. Chemosphere. 2019;221:834-840.
- [CrossRef] [Google Scholar]
- Microplastics in wastewater treatment plants of Wuhan, Central China: Abundance, removal, and potential source in household wastewater. Sci. Total Environ.. 2020;745:141026
- [CrossRef] [Google Scholar]
- Understanding the Fragmentation Pattern of Marine Plastic Debris. Environ. Sci. Technol.. 2016;50:5668-5675.
- [CrossRef] [Google Scholar]
- To what extent are microplastics from the open ocean weathered? Environ. Pollut.. 2017;227:167-174.
- [Google Scholar]
- Transport and release of chemicals from plastics to the environment and to wildlife. Philos. Trans. R. Soc. B Biol. Sci.. 2009;364:2027-2045.
- [CrossRef] [Google Scholar]
- Distribution and characterization of microplastics in beach sand from three different Indian coastal environments. Mar. Pollut. Bull.. 2019;140:262-273.
- [CrossRef] [Google Scholar]
- Characterization of microstructure of polyethylenes by differential scanning calorimetry. Thermochim. Acta. 1997;299:27-32.
- [CrossRef] [Google Scholar]
- First report of occurrence, distribution, and composition of microplastics in surface waters of the Sea of Marmara. Turkey. Mar. Pollut. Bull.. 2018;135:283-289.
- [CrossRef] [Google Scholar]
- Microplastic pollution in deep-sea sediments. Environ. Pollut.. 2013;182:495-499.
- [CrossRef] [Google Scholar]
- The distribution of pelagic tars and plastics in the south Atlantic bight. Mar. Pollut. Bull.. 1980;11:352-356.
- [CrossRef] [Google Scholar]
- SEM/EDS and optical microscopy analyses of microplastics in ocean trawl and fish guts. Sci. Total Environ.. 2017;603:616-626.
- [Google Scholar]
- Investigation of microplastics contamination in drinking water of a German city. Sci. Total Environ.. 2021;755:143421
- [CrossRef] [Google Scholar]
- Occurrence and characteristics of microplastics in surface road dust in Kusatsu (Japan), Da Nang (Vietnam), and Kathmandu (Nepal) Environ. Pollut.. 2020;256:113447
- [CrossRef] [Google Scholar]
- Comparison of the distribution and degradation of plastic debris along shorelines of the Great Lakes. North America. J. Gt. Lakes Res.. 2014;40:288-299.
- [CrossRef] [Google Scholar]
- The distribution of microplastics in soil aggregate fractions in southwestern China. Sci. Total Environ.. 2018;642:12-20.
- [CrossRef] [Google Scholar]
- Hyperspectral imaging based method for rapid detection of microplastics in the intestinal tracts of fish. Environ. Sci. Technol.. 2019;53:5151-5158.
- [CrossRef] [Google Scholar]
- Cloud-point extraction combined with thermal degradation for nanoplastic analysis using pyrolysis gas chromatography–mass spectrometry. Anal. Chem.. 2018;91:1785-1790.
- [Google Scholar]
- Wastewater treatment plants as a pathway for microplastics: Development of a new approach to sample wastewater-based microplastics. Water Res.. 2017;112:93-99.
- [CrossRef] [Google Scholar]
- Microplastics as vectors for bioaccumulation of hydrophobic organic chemicals in the marine environment: a state-of-the-science review: role of microplastics in marine contaminant transfer. Environ. Toxicol. Chem.. 2016;35:1667-1676.
- [CrossRef] [Google Scholar]
- Exposure to microplastics (<10 μm) associated to plastic bottles mineral water consumption: The first quantitative study. Water Res.. 2019;157:365-371.
- [CrossRef] [Google Scholar]


