

Translate this page into:
A strategy for antioxidant quality evaluation of Aster yunnanensis based on fingerprint-activity relationship modeling and chemometric analysis
⁎Corresponding author at: 15# Southwest Minzu University, No.16, South 4th Section 1st Ring Road, Chengdu 610041, Sichuan, China. zfzhang@swun.edu.cn (Zhifeng Zhang)
-
Received: ,
Accepted: ,
This article was originally published by Elsevier and was migrated to Scientific Scholar after the change of Publisher.
Peer review under responsibility of King Saud University.
Abstract
In this study, a fingerprint-activity relationship between ultrahigh performance liquid chromatography (UHPLC) fingerprints and antioxidant activity was established to evaluate the quality of Aster yunnanensis Franch.(AYF) from different collecting spots. First, the fingerprint of AYF was established by UHPLC, and the similarity analysis was analyzed based on twenty-one common peaks. Then the chemical constituents from AYF were analyzed and identified by UHPLC-quadrupole time-of-flight tandem mass spectrometry (QTOF-MS/MS). Next, the antioxidant activity of twelve batches of AYF was assessed in vitro. Subsequently, eleven chemical markers were screened out by fingerprints and antioxidant activity utilizing grey relational analysis (GRA) and partial least squares (PLS). Finally, the contents of eleven chemical markers in twelve batches of AYF were detected by UHPLC, and the antioxidant quality of AYF was evaluated using chemometric analysis, such as principal components analysis (PCA) and technique for order preference by similarity to ideal solution (TOPSIS). The results showed that the antioxidant efficacy was associated with the total content of eleven compounds of AYF. Moreover, this method to discover quality markers was reasonable by fingerprint-activity relationship combination with chemometric analysis. The present study will certify quality markers associated with therapeutic effects, and provide a powerful strategy for evaluating the resource quality of AYF.
Keywords
Aster yunnanensis
UHPLC fingerprint
Antioxidants
Chemometric analysis
Quality evaluation

1 Introduction
Aster yunnanensis Franch.(AYF), a perennial herb of Asteraceae(Ma, et al.,2021), was mainly distributed in Gansu, Qinghai, Yunnan and Tibet of China at an altitude of 2500 to 4000 m. AYF is a well-known food and herbal medicine, which has various bioactivities and can be used to treat various diseases, such as flu, fever, food poisoning, ringworm, blast fever, spasm and so on(Li, et al.,2021).Phytochemical studies have shown that AYF contained many kinds of bioactive constituents, such as phenylpropanoids, flavonoids, organic acids, alkaloids, saponins, glycosides and so on. Modern pharmacological studies have also shown that flavonoids(Papadopoulos, et al.,2021), organic acids(Shang, et al.,2012), alkaloids(Trinh, et al.,2020), saponins(César, et al.,2018), and glycosides(Yu, et al.,2018) have good antioxidant activity. However, there are no reports about the antioxidant activity and bioactive components of AYF in the previous study. In addition, there is no research on the quality control of AYF. Usually, single or several index components can be employed to control the quality of medicinal herbs. However, it is unscientific to control the quality of medicinal herbs based on only one or a few index components. Furthermore, it is widely believed that Chinese medicines exert therapeutic efficacies holistically by a ‘multi-component, multi-targeted, and multi-pathway’ mode(Chen, et al.,2019). As described above, AYF is composed of a variety of chemical constituents, and its efficacy is not limited to a single bioactive component. Therefore, it is necessary to establish an effective and scientific evaluation method for controlling the quality of AYF.
The fingerprint technique was demonstrated to be an effective method in evaluating the chemical consistency of traditional Chinese medicine (TCM), which also has been well received by the World Health Organization (WHO), China Food and Drug Administration (CFDA), the United States Food and Drug Administration (FDA) and European Medicines Agency (EMEA)(Chen, et al.,2019). Chromatographic fingerprinting is widely used to evaluate the quality of various medicinal herbs because of its high efficiency and low cost(Chen, et al.,2020; Dilaram, et al.,2021). However, the chromatographic fingerprint is unclear to identify the unknown bioactive components. In addition, although it can explain the similarities and differences between different batches of samples, it is still some disadvantages to evaluating the quality. To solve this problem, UHPLC-QTOF-MS/MS, a fast, strong separation ability and high mass accuracy analysis technology, can be employed to identify chemical components(Chen, et al.,2018; Xu, et al.,2018). Nevertheless, it remains unclear the relationship between the bioactive activity and chemical constituents. In recent years, fingerprint-activity relationship modeling and chemometric analysis have been used to solve these problems and discover potential bioactive components(Chen, et al.,2019; Wu, et al.,2020; Deng, et al.,2021; Han, et al.,2022).It was also meaningful to explore quality control that can reflect the intrinsic quality of medicinal herbs.
Therefore, this study was conducted to discover the potential bioactive markers related to the most potent antioxidant capacity by using fingerprint-activity relationship modeling, and to evaluate the quality of AYF by merging chemometric analysis, including grey relational analysis (GCA), partial least squares (PLS), principal components analysis (PCA) and technique for order preference by similarity to ideal solution (TOPSIS). Firstly, the chromatography fingerprints were established by UHPLC, and UHPLC-Q-TOF-MS was used to identify the chemical components of AYF qualitatively. Secondly, three models, including 2,2-diphenyl-1-picrylhydrazyl (DPPH) radical scavenging assay, 2,2′-azinobis-(3-ethylbenzthiazoline-6-sulfonic acid) (ABTS)radical scavenging assay and ferric-reducing antioxidant power (FRAP) assay were used to determine the antioxidant capacity of AYF. Thirdly, GCA and PLS were used to build the relationship between chromatographic fingerprints and antioxidant activity of AYF to screen out major potential antioxidant markers. Finally, the content of eleven markers was determined by UHPLC, and the quality of AYF was evaluated based on PCA and TOPSIS.
2 Materials and methods
2.1 Reagents and materials
Formic acid (HPLC grade), acetonitrile and methanol were obtained from Merck (Darmstadt, Germany).Ultrapure water was provided by Watsons Food and Beverage Company (Guangzhou, China).Apigenin (Lot NO.,20080706) and kaempferol (Lot NO.,20042613) were provided by Sichuan Weiqi Biotechnology Co. Ltd (Chengdu, China).Chlorogenic acid (Lot NO.,327979), isoquercetin (Lot NO.,15070211), isochlorogenic acid B (Lot NO.,14534613), isochlorogenic acid A (Lot NO.,2450535) and isochlorogenic acid C (Lot NO.,57378720) were provided by Chengdu Maide Biotechnology Co. Ltd (Chengdu, China).Neochlorogenic acid (Lot NO.,20042105), cryptochlorogenic acid (Lot NO.,20080301) and Rutin (Lot NO.,15040524) were purchased from Chengdu Kangbang Biotechnology Co. Ltd (Chengdu, China). Quercitrin (Lot NO.,100081200907) was purchased from the National Institute for the control of Pharmaceutical and Biological Products (Beijing, China).The purity of eleven standards was more than 98% determined by HPLC.
The 2,2-diphenyl-1-picrylhydrazyl (DPPH, Lot NO.,2010289) and 2,20-azinobis (3-ethylbenzothia-zo-line-6-sulphonicacid) diammonium salt (ABTS, Lot NO.,20112801) were purchased from Chengdu Kangbang Biotechnology Co. Ltd (Chengdu, China). Ascorbic acid (Vc, Lot NO., B21293) and 2,4,6-tri(2-pyridinyl)-1,3,5-triazine (TPTZ, Lot NO., S30632) were purchased from Shanghai Yuanye Biotechnolog-y Co. Ltd (Shanghai, China). All other chemicals were of analytical grade.
Twelve batches of AYF samples were collected from different locations and authenticated by Professor Zhifeng Zhang (Institute of Qinghai-Tibetan Plateau, Southwest Minzu University). The information of samples is shown in Table 1. The fresh samples were dried in the sun till complete dryness. The samples were preserved in the herbarium of Southwest Minzu University (Chengdu, China).
Sample ID
Collecting locations
Altitude /m
Collecting time
Longitude and latitude
Similarity
S1
Dege, Sichuan
3910
2020.7.30
E99°31′45″, N31°46′00″
0.984
S2
Ruoergai, Sichuan
3471
2020.7.26
E102°36′24″, N33°56′43″
0.979
S3
Baiyu, Sichuan
3676
2020.7.13
E99°18′58″, N31°04′57″
0.974
S4
Shiqu, Sichuan
4018
2020.7.30
E98°18′33″, N33°03′04″
0.985
S5
Ruoergai, Sichuan
3463
2020.7.26
E102°35′30″, N33°11′25″
0.990
S6
Shiqu, Sichuan
3977
2020.7.30
E98°38′46″, N32°22′00″
0.980
S7
Nangqian, Qinhai
4065
2020.7.29
E95°31′47″, N32°19′51″
0.965
S8
Yushu, Qinhai
3980
2020.7.28
E96°55′22″, N32°51′57″
0.951
S9
Xiangcheng, Sichuan
3919
2020.7.10
E99°45′34″, N28°57′10″
0.665
S10
Ruoergai, Sichuan
3436
2020.7.26
E102°28′09, N33°36′29″
0.941
S11
Zaduo, Qinhai
4034
2020.7.28
E95°28′54″, N32°51′12″
0.961
S12
Kangding, Sichuan
3258
2020.7.31
E101°50′07″, N30°16′46″
0.717
2.2 UHPLC fingerprint
2.2.1 Sample preparation
The dried AYF samples were grilled to powder and passed through a 0.30 mm sample sieve. Subsequently, the sample powder (0.5 g) was ultrasonicated with 10 mL of 80% methanol for 30 min at room temperature. The solution was filtered through a 0.22 μm microfiltration membrane before injection of UHPLC analysis and UHPLC-Q-TOF-MS/MS analysis.
2.2.2 Chromatographic conditions
Sample analysis was performed on the Waters UHPLC®CLASS system (Waters, Milford, MA, USA) with the separation conducted by an ACQUITY UHPLC®HSS C18 column(2.1 × 100 mm, 1.8 μm). The solvent system consisted of 0.1% aqueous formic acid (A) and acetonitrile (B)with the following gradient elution program: 0–10 min, 5–18% B; 10–12 min, 18–19% B; 12–17 min, 19–20% B; 17–19 min, 19–20% B; 19–21 min, 20–22% B; 21–29 min, 22–60% B; 29–32 min, 60–95% B; 32–37 min, 96% B. The flow rate was at 0.2 mL/min. The column was kept at 35 °C, and the injection volume was 1 μL each time. The detection wavelength was set as 266 nm.
2.2.3 Analysis of UHPLC fingerprints
UHPLC fingerprinting was validated for precision, stability, and repeatability. The precision test was performed by injecting six times the same sample solution. The stability test was analyzed by replicate injecting of the same sample solution at0, 2, 6, 8, 12, and 24 h, respectively. The repeatability test was performed by injections six times working solutions of the same sample. The relative standard deviation (RSD) from Relative retention time (RRT) and relative peak area (RPA) of the common peak were used to evaluate precision, stability and repeatability, respectively. The RRT and RPA of common peak were calculated using peak 11 (sochlorogenic acid B) as the reference peak. Furthermore, the original chromatographic data were imported into the Similarity Evaluation System for Chromatographic Fingerprint of traditional Chinese medicine (version 2012, Chinese Pharmacopoeia Commission), and UHPLC fingerprints of AYF samples were established.
2.3 UHPLC-Q-TOF-MS/MS conditions
Sample analysis was performed on the Agilent 6530 Accurate-Mass Q-TOF-LC-MS/MS system (Agilent, USA) with the separation conducted by a Thermo Hypersil GOLD C18 Column (100 mm × 2.1 mm, 1.9 μm). The solvent system was consisted of 0.1% aqueous formic acid (A) and acetonitrile (B)with the following gradient elution program: 0–3 min, 5–20% B; 3–4 min, 20–22% B; 4–10 min, 22–32% B; 10–12 min, 32–60% B; 12–14 min, 60–80% B; 14–16 min, 80–90% B; 16–17 min, 90–95% B. The flow rate was at 0.4 mL/min. The column was kept at 35 °C, and the injection volume was 3 μL each time.
Mass spectrometry was achieved by Agilent 6530 Accurate-Mass Q-TOF-LC-MS/MS Mass technology equipped with an electrospray ionization (ESI) source. Both positive and negative ionization modes were applied to acquire by scanning range from 50 to 1000 Da with scanning time of 0.2 s and 17 min detection period. The MS parameters were set as follows: The capillary voltage was set at 4.0 kV (positive mode) and 3.2 kV (negative mode); the source and desolation temperatures were 100 and 350 ℃, respectively; the drying gas flow rate was 6.8 L/min. Finally, Processing and analysis of the data were carried out using Agilent HPLC-ESI-Q-TOF-MS MassHunter A.01.00 software (Agilent, USA).
2.4 Determination of antioxidant capacity
2.4.1 Sample preparation
The12 batches of dried AYF samples were grilled to powder and passed through a 0.30 mm sieve. Subsequently, the sample powder (15 g) was added to 250 mL conical flash and sonicated with 150 mL of 80% methanol twice, 30 min each time. The solution was filtered and the solvent was reduced by pressure distillation. The extract was diluted with methanol to five different concentrations of sample solutions (0.0125,0.025,0.05,0.10,0.25, 0.5 mg/mL).
2.4.2 DPPH assay
The DPPH activity of twelve batches of AYF was assessed according to the procedure mentioned by Liu et al.(2017) with a small modification. For DPPH assay, 100 μL different concentrations of sample extract or positive control was mixed with the 100 μL of the DPPH solution (0.0799 mg/mL) in 96-well plates. Then, the mixed solutions were kept and reacted in the dark place for 30 min. Finally, the absorbance of the mixed solutions was recorded at 517 nm with a multifunctional microplate reader and calculated DPPH radical scavenging activity as Eq (1):
Ascorbic acid was used as the positive control. Where Ad is the absorbance of 100 μL sample extract or Ascorbic acid with 100 μL the DPPH solution; Ax is 100 μL sample extract with 100 μL the methanol; Ac is 100 μL methanol with 100 μL the DPPH solution. Using regression analysis of data to estimate the IC50 values.
2.4.3 ABTS assay
The ABTS activity of the AYF was determined as described by Chen et al.(2020) with a few modifications. For ABTS assay, The ABTS aqueous solution (7 mmol/L) mixed with the K2S2O8 (2.45 mmol/L), and protected from light at room temperature for 12 to 16 h. The configured ABTS+ solution was diluted with anhydrous ethanol and the absorbance of 0.70 ± 0.02 was measured at 734 nm for ABTS+ analysis. Then, 25 μL of different concentrations of sample solution or positive control was mixed with175 μL of ABTS+ solution in 96-well plates. After 30 min of reaction in the darkness, the absorbance was measured at the wavelength of 734 nm and calculated DPPH radicals cavenging activity as Eq (2):
Ascorbic acid was used as the positive control. Where Ad is the absorbance of 25 μL sample solution or Ascorbic acid with 175 μL the ABTS+ solution; Ax is 25 μL sample solution with 175 μL the methanol; Ac is 25 μL methanol with 175 μL the ABTS+ solution. Using regression analysis of data to estimate the IC50 values.
2.4.4 FRAP assay
The FRAP assay was tested as reported by Xu et al.(2020) with some modifications. The working stock solutions (Fe3+–TPTZ solution) were prepared by mixing 10 parts of 0.3 mol/L acetate buffer (3.1 g C2H3NaO2·3H2O and 16 mL C2H4O2, pH 3.5), with 1 part of 20 mmol/L FeCl3 solution and with 1 part of 20 mmol/L TPTZ solution in 40 mmol/L hydrochloric acids (HCl), then stored at 37 ℃ until further use. For analysis, 100 μL different concentrations of sample solution or the positive control were mixed with 100 μL Fe3+–TPTZ working stock solution in 96-wellplate, left in dark for 10 min at room temperature. Then, the absorbance of the mixed solution was recorded at the wavelength of 593 nm. The standard curve was set up by FeSO4 with the concentrations of 2.02,4.04,6.06,8.08,10.10,12.12,16.16 and 20.20 μ mol/L. The positive control was ascorbic acid, and solutions without samples were set as blank control. The results of the FRAP were presented as mmol Fe2+ /g of samples.
All those antioxidant tests (DPPH, ABTS, FRAP) were determined on Thermo Fisher Scientific Oy Ratastie 2FI-01620 (Vantaa, Finland) equipment. All the tests were repeated three times.
2.5 Fingerprint-activity relationship modeling
2.5.1 Grey relational analysis
GRA was performed by using the Data Processing System (DPS 9.50) to analyze the correlation degree between the peak area of the twenty-one common peaks and their antioxidant capacity. The grey relational grade was obtained with a distinguishing coefficient of 0.5,and the contribution of fingerprint peaks to pharmacological effects could be evaluated.
2.5.2 Partial least square analysis
In the PLS model, the areas of common peaks were taken as the independent variables (X), and the antioxidant activity levels by different assays were set as the dependent variables (Y). PLS models were built to reveal the relation between the fingerprint peaks and their antioxidant capacity. PLS analysis was performed by SIMCA 14.1 software (Umetrics AB, Umea, Sweden).
2.6 Determination of 11 constituents of AYF
2.6.1 Chromatographic conditions, preparation of sample solutions and standard solutions
The content analysis of sample solution preparation and chromatographic conditions were the same as the Section “2.2.1” and “2.2.2”, respectively. A mixed standard stock solution of eleven standards was prepared with methanol, and their concentrations were as follows: Neochlorogenic acid, 0.348 mg/mL; chlorogenic acid,0.389 mg/mL; cryptochlorogenic acid, 0.359 mg/mL; rutin, 0.364 mg/mL; isoquercetin, 0.351 mg/mL; sochlorogenic acid B, 0.355 mg/mL; isochlorogenic acid A, 0.357 mg/mL; isochlorogenic acid C, 0.378 mg/mL; quercetin, 0.513 mg/mL; apigenin 0.350 mg/mL; kaempferol 0.345 mg/mL. The stock solutions were further diluted and stored in a refrigerator at 4℃ until further UHPLC analysis.
2.6.2 Validation of the method for quantitative analysis
To verify the applicability of UHPLC analysis methods, linearity, precision, repeatability, stability and recovery were conducted respectively. The linearity of calibration curves was examined by drawing the peak area and the corresponding different concentrations of each standard. Then, the regression equation, correlation coefficient and linear range were obtained through the curves. The detection limit (LOD) and quantification limit (LOQ) were evaluated at the signal-to-noise ratio (S/N) of about 3 and 10, respectively. The precision test was achieved by continuously injecting six times mixed standard solution. The repeatability was determined by intra-day and inter-day tests. The intra-day test was measured by detecting the mixed standard solution in six duplicates on the same day, and the inter-day test was measured on three successive days. The stability was analyzed by the same sample at 0, 2, 4, 8, 12, and 24 h, respectively. The recovery test was obtained by adding the corresponding constituents at 80%, 100% and 120% to the AYF sample. Three replicates on each level were determined. The precision, repeatability, stability and recovery of the method were measured by determining the RSD of RRT and the RPA of compounds.
2.7 Chemometric analysis
Principal components analysis (PCA), an unsupervised chemometric pattern recognition method, was employed to classify the AYF samples based on the content of 11 constituents using SIMCA-P 14.1. Technique for order preference by similarity to ideal solution (TOPSIS) is an approach of ordering a limited amount of assessment objectives according to their proximity to an idealized goal, which was used to evaluate the relative merits of the sample.
3 Results
3.1 UHPLC fingerprints analysis of AYF samples
3.1.1 Optimization of UHPLC conditions
In order to get the best separation and higher analytical efficiency, a series of experimental factors were optimized, including column type, mobile phase, flow rate, detection wavelength and column temperature. As a result, a satisfactory chromatographic separation of AYF samples was obtained by ACQUITY UHPLC®HSS C18 column (2.1 × 100 mm, 1.8 μm). The solvent system of 0.1% aqueous formic acid and acetonitrile presented better separation and more peak shapes than other systems. The column temperature and flow rate for the best separation were obtained at 35 °C and 0.2 mL/min, respectively. The chromatographic conditions were present in Section 2. As shown in Fig. 1, the major components of AYF were separated well within36min.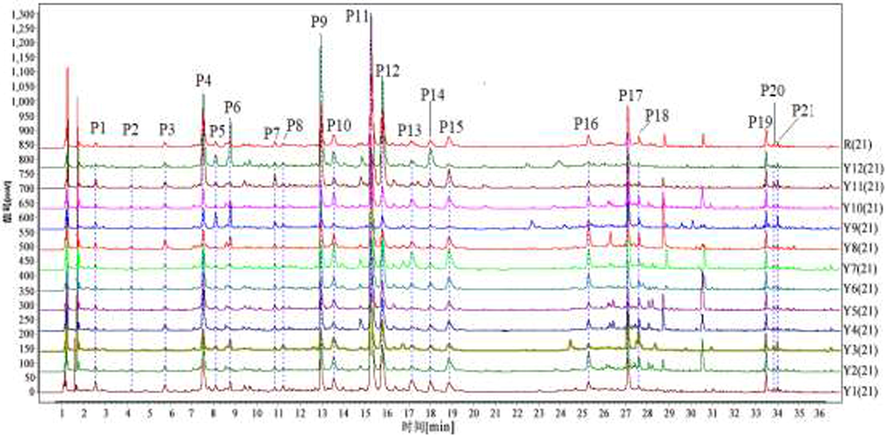
UHPLC fingerprints of 12 batches of AYF (Y1-Y12) samples and Twenty-one common peaks (P1–P21).
3.1.2 Methodology validation
In method validation, peak 11(P11)with large peak area and moderate retention time was selected as the reference peak and the RSD of average RRT and RPA of other 20 common peaks were calculated to analyze the precision, stability and repeatability. The RSD of RRT and RPA in precision, stability and repeatability tests were all less than 3.2 %. It indicated that the method was accurate and reliable, which could apply to establish UHPLC fingerprint for analyzing samples.
3.1.3 Similarity analysis of the fingerprints
To establish the fingerprint of AYF,12 batches of samples that came from different origins in China were analyzed by UHPLC and presented in Fig. 1. Twenty-one peaks(P1-P21) were selected as common peaks of different samples.
The similarity among the sample was evaluated by using the Similarity Evaluation System for Chromatographic Fingerprint of Traditional Chinese Medicine (version2012). The similarity values of different samples were in the range of0.665–0.990 and were listed in Table 1. The similarities of the two batches from Xiangcheng Sichuan Province (S9) and Kangding Sichuan Province (S12) were 0.665 and 0.717, respectively. However, the similarities of the other 10 batches (Sichuan and Qinghai origins) were all higher than0.94. The similarity value of different samples may be caused by geographic location, sunlight condition, climate and growing environment. It indicated that chemical characteristics of the AYF samples were similar to a larger extent, but the relative content was different. Also, it suggested that the fingerprint analysis for AYF could be employed to evaluate the quality and authenticity of Chinese herbal medicines.
3.2 Identification of chemical constituents in AYF by UHPLC-Q-TOF-MS/MS
The method of UHPLC-Q-TOF-MS/MS was employed to identify the chemical constituents of twelve batches of AYF samples for further systematic evaluation of their quality. The total ion currents (TIC) of the extracts of AYF are displayed in Fig 2. A total of forty-six compounds were detected and thirty-eight compounds were identified, including thirteen flavonoids, ten terpenoids, seven organic acids, three fatty acid and five other compounds. The peaks for compounds 1, 2, 4, 9, 11, 16, 18, 20,23, 25 and 26 were identified by comparing the retention time, UV absorption and reference standards. The detailed information on mass data, retention time, and chemical formula for these compounds was listed in Table 2.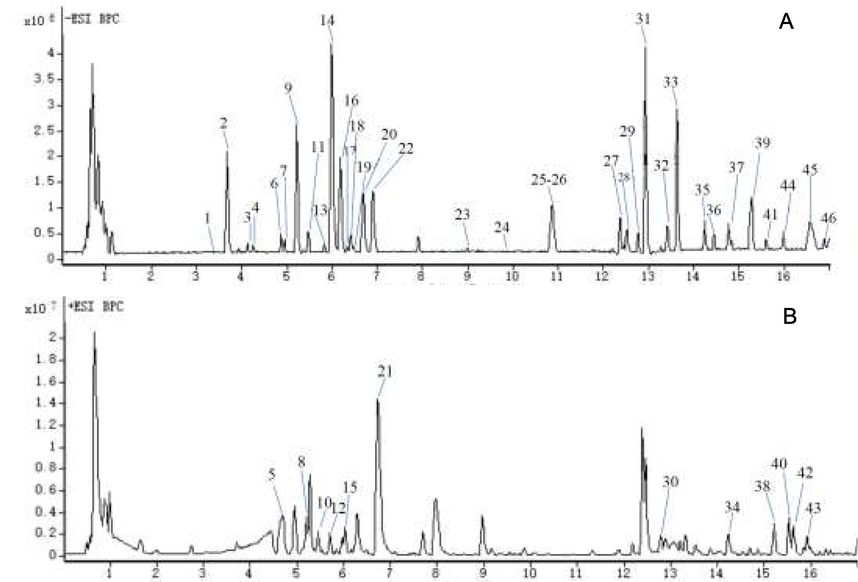
The TIC of the extract of AYF in negative (A) and positive (B) ion mode.
NO.
tR/min
Mass ([M−H]-, m/z)
Error (ppm)
Fragment Ions (m/z)
Formula
Identification
1
3.504
353.0865
−10.04
191.0552,127.0387
C16H18O9
Neochlorogenic acid
2
3.682
353.0873
−8.57
286.8643, 218.8703, 135.0435, 191.0547
C16H18O9
Chlorogenic acid
3
4.133
447.1510
−9.58
401.1444,269.1926, 161.0439
C19H28O12
Orcinol Gentiobioside
4
4.249
353.0900
−8.89
286.8637, 191.0547,161.0237
C16H18O9
Cryptochlorogenic acid
5
4.697
481.2514[M + H]+
1.55
413.0754
C29H36O6
Vedelianin
6
4.867
461.1665
−8.12
415.1598, 325.9165, 259.9290,149.0423
C20H30O12
Verbasoside
7
4.950
329.1231
−7.53
248.9580,179.0563
C15H22O8
Butanedioic acid
8
5.197
569.3055[M + H]+
0.36
435.3255, 281.5880,170.0965
C30H48O10
Hyodeoxycholate-6-O-glucuronide
9
5.217
609.1449
0.99
463.0894, 301.0337, 300.0253, 178.9999, 151.0023
C20H34O21
Rutin
10
5.448
634.3201[M + H]+
0.93
428.3852, 318.1577, 277.0415,173.0006
C30H50O14
unknown
11
5.484
463.0877
−8.63
301.0343,271.0239, 151.0040
C21H20O12
Isoquercetin
12
5.715
678.3099[M + H]+
−3.27
546.3193, 341.1407,137.0574,
C31H50O16
unknown
13
5.834
593.1493
−7.56
459.1102, 327.0475, 285.0383,151.0027,
C27H30O15
Kaempferol-3-rutinoside
14
5.984
623.1603
−8.45
463.0934, 357.0609, 315.0504,151.0022
C28H32O16
Isorhamnetin-3-O-neohespeidoside
15
6.031
647.1870[M + H]+
3.09
501.1181, 331.1144
C22H30O22
Sucrose citrate succinate
16
6.185
515.1171
−8.25
447.0927, 353.0864, 242.9452,191.0541
C25H24O12
3,4-Dicaffeoylquinic acid
17
6.335
477.1038
−6.28
411.4614, 314.0421,151.0007
C22H22O12
Isorhamnetin-3-O-glucoside
18
6.418
515.1185
−6.95
431.0958,353.0862,310.9243,242.9434,191.0539,135.0448
C25H24O12
3,5-Dicaffeoylquinic acid
19
6.485
507.1142
−7.19
461.9059, 345.0603, 238.9370,130.0396
C23H24O13
11-O-Syringylbergenin
20
6.702
515.1262
−7.21
353.0860, 255.0674, 173.0438,135.0444
C25H24O12
4,5-Dicaffeoylquinic acid
21
6.732
701.4338[M + H]+
0.45
701.4338
C38H68O11
unknown
22
6.902
625.1177
−2.92
463.0876, 301.0339,178.9967
C48H18O2
unknown
23
8.987
301.0347
−2.95
235.9628, 189.9557, 178.9976,151.0030
C15H10O7
Quercetin
24
9.869
447.228
−6.89
447.228
C18H38O12
unknown
25
10.856
269.0438
−7.72
225.0544,151.0017
C15H10O5
apigenin
26
10.860
285.0450
−5.40
162.0093,151.0026
C15H10O6
Kaempferol
27
12.458
389.0868
−7.32
345.1702,231.1385
C19H18O9
Bicyclol
28
12.524
329.2322
−7.22
171.1018
C18H34O5
Diterpene glycoside
29
12.775
389.1599
7.39
345.1705, 263.1261,129.9765
C14H30O12
Dimethylene-D-Sorbitol
30
12.788
365.2584[M + H]+
−9.74
194.0924
C21H32O5
Dihydrocortisol
31
12.925
695.4003
−8.08
649.3984, 503.3368, 409.3158,207.0489
C37H60O12
Momordicoside E
32
13.425
647.3790
−6.32
571.3642, 407.3331, 308.8903, 242.9377,175.0210
C36H56O10
Echinocystic acid 3-O-glucoside
33
13.626
343.1545
−8.21
299.1640,217.1201
C20H24O5
Nectandrin B
34
14.240
437.2057[M + H]+
−5.33
303.1294,169.0438
C19H32O11
unknown
35
14.243
391.2125
−6.45
331.1892, 287.2014,190.9240
C22H32O6
Excisanin B
36
14.443
487.3426
−6.37
437.2292, 329.1390,175.9586
C30H48O5
2,3,24-Trihydroxyole‐an-12-en-28-oic acid
37
14.777
295.2264[M + H]+
−6.77
195.1373
C18H30O3
13-keto-9Z,11E-octadecadienoic acid
38
15.208
343.1444[M + H]+
5.57
255.0934
C13H26O10
unknown
39
15.294
471.3474
−7.74
407.3333,248.9521
C30H48O4
Hederagenin
40
15.525
357.1740[M + H]+
7.47
255.1030,185.0596
C14H26O10
Isopropyl apiosylglucoside
41
15.594
293.2106
−6.69
249.2207,185.1174
C18H30O3
Sterebin D
42
15.641
357.1859[M + H]+
−3.23
255.1121
C14H28O10
unknown
43
15.925
369.1611[M + H]+
5.26
267.0975,133.0917
C22H24O5
4′-methylxanthohumol
44
15.978
469.3306
−6.29
407.3317, 270.2515,137.0957
C30H46O4
Glycyrrhetinic acid
45
16.579
471.3467
−6.9
428.2415, 336.9307, 270.9398, 211.1362,144.9204
C30H48O4
23-Hydroxybetulinic acid
46
16.896
271.2269
−6.62
225.2132,144.9214
C16H32O3
16-Hydroxyhexadecanoic acid
3.2.1 Identification of flavonoids
The fragmentation pathways of flavonoids follow by the Retro-Diels-Alder (RDA), then the loss of methyl group, carbonyl group, H2O, CO2 and other ions(Chen, et al.,2018). In this study, there were a total of thirteen flavonoids or their derivatives were identified in AYF extracts.
Compound 9 showed an [M−H]- ion at m/z 609 with the molecular formula C20H34O21, which further produced a fragment ion at m/z 463 [M−H−146]- and 301 [M−H−146−162]- corresponding to the successive loss of the rhamnosyl and glucosyl units. Thus, compared with the reference standard, MS/MS fragmentation data and literature, it was definitely identified as rutin. The fragmentation pathway of compound 9 was shown in Figure 3A. By using a similar approach, compound 11was unambiguously identified as isoquercetin by comparison with the reference standard(Zhao,2014). Compound 8, 13, 14, 17, 19 and 32 were tentatively identified as hyodeoxycholate-6-O-glucuronide, kaempferol-3-rutinoside(Zhao,2014), isorhamnetin-3-O-neohespeidoside(Li, et al.,2021), Isorhamnetin-3-O-glucoside(Li, et al.,2021), 11-O-Syringylbergenin and echinocystic acid 3-O-glucoside(Zhao,2014), respectively; while combined with their molecular formula and MS data reported in the literature.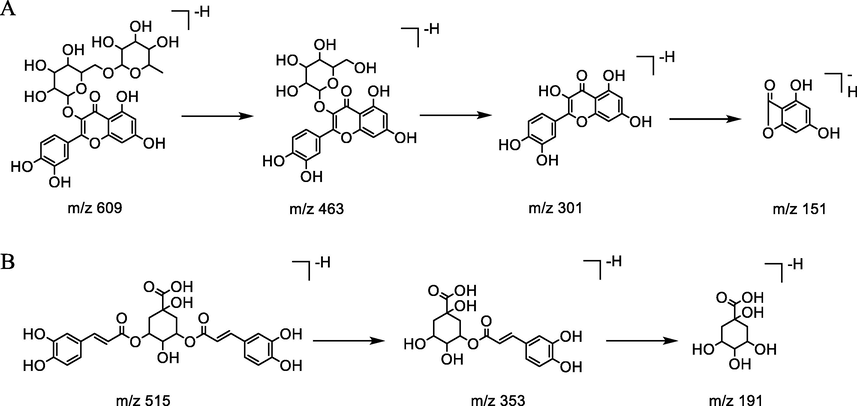
The hypothesized fragmentation pathway of compound 9(A) and 18(B).
Compound 23showedan [M−H]- ion at m/z 301and product ions at 235 and 151, which was identified as quercetin by comparing with the reference standards(Wang, et al.,2021). By using a similar approach, compound 25 and 26 were unambiguously identified as apigenin and kaempferol, respectively, by comparing with corresponding reference standards(Li, et al.,2021). Compound 40 and 43 were tentatively identified as isopropylapiosyl glucoside and 4′-methylxanthohumol respectively, according to the literature data.
3.2.2 Identification of organic acids
As apparent from Table.3, a total of seven compounds were assigned to organic acids. Compound 1, 2 and 4 produced the same molecular ion[M-H]- at m/z353 and fragment ions at m/z 191, which suggested that they were isomers with the same formula C16H18O9. Besides, compound 1 further yielded characteristic fragment ion at m/z 127, whereas compound 2 and 4 generated characteristic fragment ion at m/z135 and 161, respectively, thus, they were unambiguously identified as neochlorogenic acid, chlorogenic acid and cryptochlorogenic acid, respectively, by comparing with reference standards(Zhao,2014).
Sample ID
DPPH
ABTS
FRAP
IC50 (μg/mL)
IC 50 (μg/mL)
(mmol Fe2+/g)
Ascorbic acid
4.78 ± 0.05
4.46 ± 0.02
13.72 ± 2.16
S1
69.14 ± 2.07
74.25 ± 4.29
1.59 ± 0.07
S2
97.22 ± 1.98
84.24 ± 0.76
1.26 ± 0.02
S3
124.13 ± 3.02
98.53 ± 1.39
1.25 ± 0.04
S4
136.46 ± 2.88
101.82 ± 2.87
1.31 ± 0.03
S5
139.86 ± 3.02
98.94 ± 3.37
1.21 ± 0.06
S6
112.93 ± 2.98
93.58 ± 1.22
1.24 ± 0.02
S7
82.26 ± 2.10
86.58 ± 2.15
1.32 ± 0.03
S8
182.92 ± 8.45
129.07 ± 4.88
0.92 ± 0.04
S9
151.79 ± 5.07
129.77 ± 2.57
1.08 ± 0.06
S10
156.38 ± 7.62
118.00 ± 3.97
1.03 ± 0.04
S11
59.16 ± 1.87
63.89 ± 1.92
1.69 ± 0.02
S12
65.72 ± 2.17
79.75 ± 0.88
1.58 ± 0.04
As for compound 7, it was tentatively identified as butanedioic acid, considering it generated the ion [M−H]- at m/z 329, and further produced fragment ions at m/z 248 and 179.
Compounds 16, 18 and 20 shared the same molecular ion [M−H]- at m/z 515 and product ions at 353, 191, and 179, indicating that they were structural isomers. they were unambiguously identified as 3,4-dicaffeoylquinic acid,3,5-dicaffeoylquinic acid and 4,5-dicaffeoylquinic acid, respectively, by comparing retention time, polarity and reference standards(Zhao,2014). The fragmentation pathway of representative compound (3,5-dicaffeoylquinic acid) is shown in Figure 3B.
3.2.3 Identification of terpenoids
In this work, A total of ten terpenoids or their derivatives were detected, and they were tentatively identified as orcinol gentiobioside (3)(Chen, et al.,2019), verbasoside (6), diterpene glycoside (28)(Zhao,2014), momordicoside E (31), excisanin B (35), 2,3,24-Trihydroxyole‐an-12-en-28-oic acid (36)(Sun, et al.,2018), hederagenin (39), sterebin D (41)(Zhao,2014), glycyrrhetinic acid (44) and 23-Hydroxybetulinic acid (45)(Li, et al.,2021), respectively, through comparison with the MS data combined with the literature data.
3.2.4 Identification of fatty acid and other compounds
For compound 15, it displayed an ion [M + H]+ at m/z 647, which further generated fragment ion at m/z 501, 331. Compound 15 was tentatively identified as Sucrose citrate succinate by comparing it with the MS data reported in literature. Similarly, according to the reported literature and MS data, compounds 37and 46 were tentatively assigned as 13-keto-9Z,11E-octadecadienoic acid and 16-Hydroxyhexadecanoic acid, respectively.
Compound 5 generated an [M + H]+ ion at m/z481 with formula C29H36O6. It further showed the fragment ion at 413. It was tentatively assigned as vedelianin.
Compounds 27 and 29 showed the same molecular ion [M−H]- at m/z 389 with the same formula C14H30O12. In addition, compounds27 and 29 generated the characteristic fragment at m/z 231 and 129, respectively. Thus, they were tentatively identified as bicyclol and dimethylene-D-sorbitol respectively.
Compound 30 produced an [M + H]+ ion at m/z365 with formula C21H32O5. It further showed the fragment ion at 194, which was tentatively assigned as dihydrocortisol.
Compound 33 showed an [M−H]-ion at m/z 343 and further produced fragment ion at m/z 299, 217. It was tentatively assigned as nectandrin B.
3.3 Antioxidant activities of AYF
The antioxidant activities of AYF were determined by using DPPH, ABTS and FRAP assays. DPPH and ABTS free radical scavenging assay are the most common approach to evaluate the antioxidant activity because of its good stability and repeatability(Xu, et al.,2020).FRAP is also a common method to measure antioxidant activity. These three types of methods are frequently used to evaluate the antioxidant activity because methods for the evaluation of antioxidant capacity are simple, rapid, low cost and good repeatability(Apak, et al.,2007).Therefore, these three kinds of antioxidant tests were conformed to determine the antioxidant capacity of AYF, and the results are listed in Table 3. As shown in Table 3, the IC50 values of DPPH, ABTS, and FRAP assays were in the range 59.16 ± 1.87–182.92 ± 8.45 μg/mL, 63.89 ± 1.92–129.77 ± 2.57 μg/mL, 0.92 ± 0.04–1.69 ± 0.02 mmol Fe2+/g, respectively, indicating that the extracts of AYF showed strong antioxidant activity. Moreover, different batches of sample showed different levels of antioxidant capacity in tests. The batch of S11, S12, and S1 showed the higher radical scavenging activity for DPPH, ABTS, and FRAP assays. It was indicating that the antioxidant capacity of AYF might be related to geographic location, chemical compound and content.
3.4 Fingerprint-activity relationship analysis
In order to find out efficacy markers, chemometric analysis, including GRA and PLS, were employed to analyze the correlation between common characteristic peaks and antioxidant ability.
3.4.1 Gray relational analysis
GRA was used to analyze the spectrum-efficacy relationship between antioxidant activity and peak area values of 21 common peaks. As shown in Table 4, the relational degree (ri) was in the range of 0.4700–0.8991. The ri value of the peak was greater than 0.6000, which indicated that it was related to antioxidant activity. The ri value was greater than 0.8000, indicating that it had a high correlation to antioxidant activity(Liu, et al.,2020). As a result, P2, P5, P9, P12 and P15 showed high relations to DPPH; P2, P5, P6, P9, P10 and P12 exhibited high relations to ABTS; P2, P5, P9, P10, P16 and P17 displayed high relations to FRAP. Therefore, eight peaks (P2, P5, P9, P10, P12, P15, P16 and P17) were significantly potential active compounds correlated with antioxidant capacity.
Peaks
ri
DPPH
ABTS
FRAP
P1
0.6848
0.5547
0.4859
P2
0.8654
0.8991
0.8764
P3
0.6854
0.5851
0.6827
P4
0.5832
0.616
0.5549
P5
0.8426
0.8234
0.8103
P6
0.7960
0.7637
0.7782
P7
0.6405
0.7451
0.7333
P8
0.6705
0.691
0.6476
P9
0.8203
0.8517
0.8237
P10
0.7853
0.8424
0.8441
P11
0.588
0.6447
0.7186
P12
0.8425
0.8273
0.7755
P13
0.6862
0.5848
0.5141
P14
0.7088
0.5899
0.4700
P15
0.8225
0.7675
0.7102
P16
0.6964
0.658
0.8413
P17
0.6625
0.6799
0.8069
P18
0.6401
0.6184
0.6004
P19
0.5542
0.5669
0.6634
P20
0.5816
0.6365
0.5642
P21
0.7615
0.7882
0.7864
3.4.2 Partial least square analysis
PLS analysis was further employed to build the correlation between characteristic peak and antioxidant activity, so as to find out the potential antioxidant compounds of AYF(Zhang, et al.,2018; Zhang, et al.,2019).The lower theIC50 score, the stronger free radical scavenging capacity is for antioxidant tests. In the PLS model, the peak areas of common peaks were set as independent variable (X), the inverse of IC50 values was defined as depended variable (Y). In the PLS model, the value of the regression coefficient was positive, meaning that the correlation between the peak areas of common peaks and antioxidant capacity also was positive. As shown in Figure 4A, P1, P2, P3, P4, P5, P9, P10, P12, P13, P15, P16, P17, P18, P19, P20 and P21 were positive correlated with DPPH free radical scavenging capacity. P1, P2, P3, P4, P9, P10, P12, P13, P15, P16, P17, P18, P19, P20 and P21 showed positive relations to ABTS and FRAP assay in Figure 4B-C. It indicates that these selected peaks contributed to the main antioxidant activity of AYF. However, the variable importance in projection (VIP) values were usually used to reflect the importance of the independent variable (X) to the dependent variable (Y). The VIP value is larger and the peak is more important. Generally, VIP value was greater than 1, indicating that the independent variable of peak was meaningful(Cao, et al.,2018; Jiang, et al.,2018; Zhang, et al.,2018). As shown in Figure 5(A–C), P4, P12, P17, P15, P18, P9, P2, P16 and P11 were the main important peak for the DPPH assay; P4, P11, P12, P17, P16, P15, P18, P9 and P2 the ABTS assay; P4, P12, P17, P18, P15, P2, P9, P11, P14 and P16 for the FRAP assay. Therefore, combining regression coefficient with VIP value, P4, P12, P17, P15, P18, P9, P2, P16 and P11had an obvious effect on DPPH free radical scavenging capacity; P4, P11, P12, P17, P16, P15, P18, P9 and P2 the ABTS assay; P4, P12, P17, P18, P15, P2, P9, P11 and P16 for the FRAP assay. The PLS result indicated that nine peaks (P2, P4, P9, P11, P12, P15, P16, P17and P18) were selected to be correlated with better antioxidant capacity in AYF.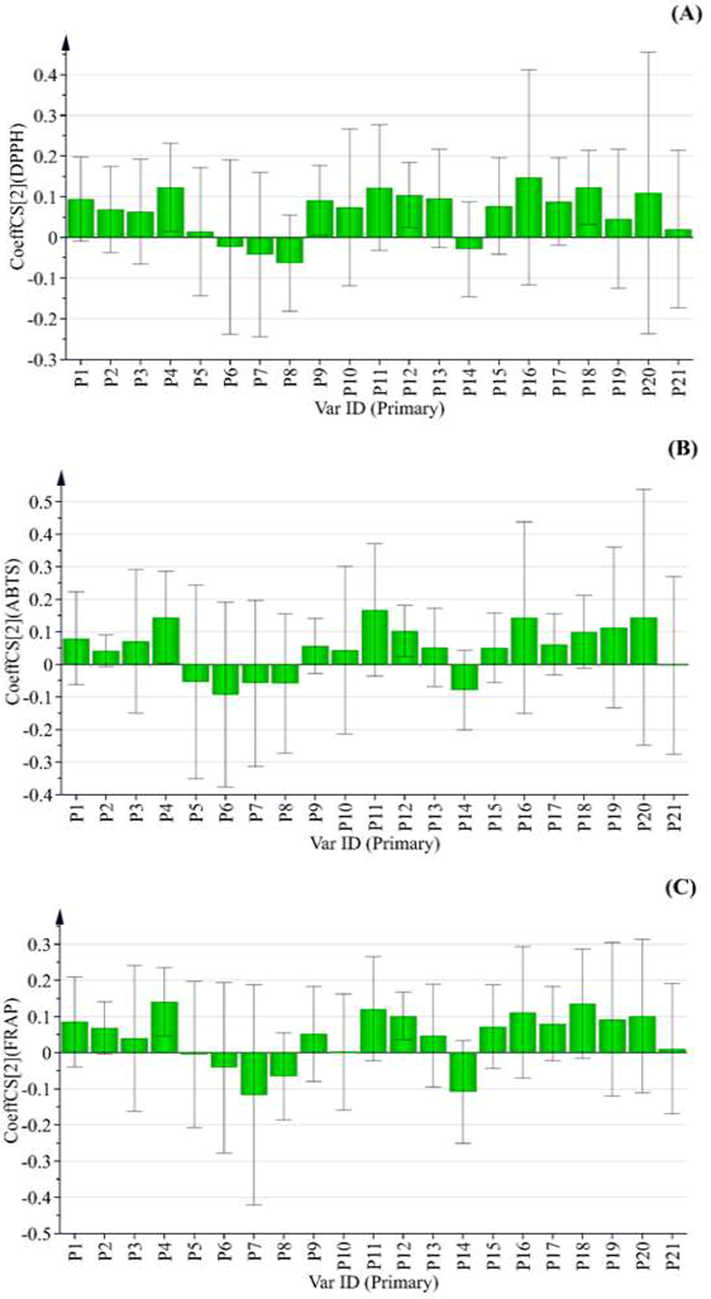
Regression coefficients of 21 common peak of AYF in the PLS models of DPPH (A), ABTS (B) and FRAP (C) assay, respectively.
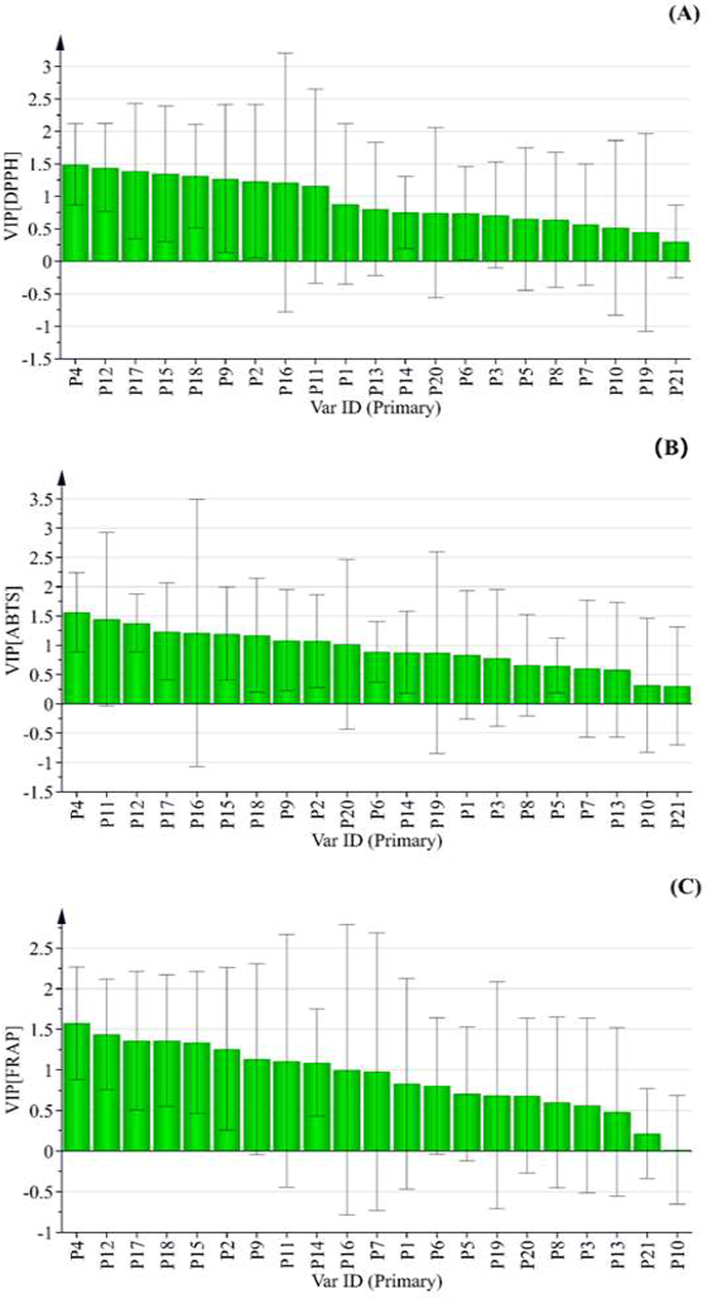
The VIP values of 21 commonpeaks of AYF in thePLS models of DPPH (A), ABTS (B) and FRAP (C) assay, respectively.
3.4.3 Identification of efficacy-related markers
Based on GRA and PLS analysis, eleven markers (P2, P4, P5, P9, P10, P11, P12, P15, P16, P17and P18) were selected and regarded as potential markers to be related to antioxidant effect. Eleven of these compounds were identified as neochlorogenic acid (P2), chlorogenic acid (P4), cryptochlorogenic acid (P5), rutin (P9), isoquercitrin (P10), isochlorogenic acid B (P11), isochlorogenic acid A (P12), isochlorogenic acid C (P15), quercetin (P16), apigenin (P17), kaempferol (P18), respectively, by comparison with the characteristic fragment ions and retention time of corresponding standards. It was reported that neochlorogenic acid, chlorogenic acid, cryptochlorogenic acid, rutin, isoquercitrin, isochlorogenic acid B, isochlorogenic acid A, isochlorogenic acid C, quercetin, apigenin and kaempferol presented a much stronger antioxidant activity(Singh, et al.,2014; Ekiert, et al.,2020).Six of the eleven markers were organic acids, and the other markers were flavonoids, so it was supposed that these six organic acids and five flavonoids were the main material basis for antioxidant efficacy and play an oxidative inhibitory role in AYF. In conclusion, these compounds may be beneficial to distinguish from different AYF samples. Moreover, they can be employed to analyze the quality of AYF.
3.5 Quantitative analysis of eleven components in AYF
3.5.1 Method validation for quantitative analysis
The method was validated before the simultaneous determination of eleven components. As shown in Table 3, the results of linear regression for eleven compounds exhibited good linearity (r greater than 0.9990) for every reference standard among a certain concentration range. The results of LOQs and LODs were listed in Table 5. It meant that LOQs and LODs were used to simultaneously determine eleven components. As for the precision test, the RSDs of intra-day and inter-day peak areas of the eleven reference standards were all less than 2.5%, indicating that the instrument was in good condition. The RSDs of the repeatability test was less than 2.0%, suggesting that the method had good repeatability. The RSDs of the stability test in 24 h was less than 3.2%, indicating that the sample solution was stable for 24 h at room temperature. Moreover, the average recoveries were in the range of 98.2% to 102.9% and the RSDs of recovery were all less than 2.4%. The results suggested that the method was feasible and could be applicable for quantitative analysis.
Compounds
Regression equation
Linearity range (μg/mL)
r
LOQ (μg/mL)
LOD (μg/mL)
Neochlorogenic acid
y = 31909321 × - 27,460
0.5 ∼ 87
0.9996
7.074 ⅹ 10-2
1.192 ⅹ 10-2
Chlorogenic acid
y = 33985913 × + 94527
13 ∼ 389
0.9991
9.772 ⅹ 10-2
2.892 ⅹ 10-2
Cryptochlorogenic acid
y = 27139161 × - 35,120
2.4 ∼ 179.7
0.9998
6.007 ⅹ 10-2
2.087 ⅹ 10-2
Rutin
y = 18984830 × + 66186
12.1 ∼ 364
0.9993
8.693 ⅹ 10-2
0.812 ⅹ 10-2
Isoquercetin
y = 30307965 × - 11,600
1.5 ∼ 175.3
0.9999
5.604 ⅹ 10-2
1.004 ⅹ 10-2
Isochlorogenic acid B
y = 34247909 × - 117,686
2.4 ∼ 177.7
0.9998
7.977 ⅹ 10-2
1.134 ⅹ 10-2
Isochlorogenic acid A
y = 45513167 × + 25180
11.9 ∼ 357
0.9993
6.924 ⅹ 10-2
0.929 ⅹ 10-2
Isochlorogenic acid C
y = 39776147x − 134,832
6.3 ∼ 189
0.9993
7.017 ⅹ 10-2
0.985 ⅹ 10-2
Quercetin
y = 61932766 × - 8964
0.2 ∼ 42.8
0.9999
4.085 ⅹ 10-2
0.745 ⅹ 10-2
Apigenin
y = 36052453 × + 9360
0.8 ∼ 58.4
0.9995
5.099 ⅹ 10-2
1.142 ⅹ 10-2
Kaempferol
y = 38572923 × + 11084
0.8 ∼ 57.4
0.9995
4.126 ⅹ 10-2
1.197 ⅹ 10-2
3.5.2 Quantitative analysis of sample
The quantitative results of samples are shown in Table 6. the contents of neochlorogenic acid, chlorogenic acid, cryptochlorogenic acid, rutin, isoquercitrin, isochlorogenic acid B, isochlorogenic acid A, isochlorogenic acid C, quercetin, apigenin, kaempferoland total of eleven compounds in twelve batches of AYF varied from 0.0426 to 0.2070 mg/g, 1.0425 to 4.3406 mg/g, 0.1768 to 1.0673 mg/g,0.4370 to 3.2792 mg/g,0.1445 to 0.6842 mg/g,0.3067 to 2.3287 mg/g,0.7427 to 5.6985 mg/g,0.3372 to 1.8067 mg/g,0.1169 to 0.3069 mg/g,0.2339 to 0.8451 mg/g, 0.0792 to 0.2522 mg/g and 4.8731 to 18.3956 mg/g, respectively. The contents of each component were observably different in sample obtained from different areas. For example, the content of isochlorogenic acid A in AYF from Xiangcheng county of Sichuan (S9), was 0.7427 mg/g, while it was 5.6985 mg/g in AYF from Kangding city of Sichuan (S12). However, the similarities of S9 and S12 were 0.665 and 0.717, respectively, indicating that the quality of the sample was not only dependent on a single component but a multi-component interaction. The batch of S11, S12 and S1 had higher total content of eleven compounds, while the batch of S9, S10 and S3 had lower total content. It was indicated that the antioxidant capacity might be related to the total content of eleven compounds. Thus, it is necessary to use multicomponent and comprehensive evaluation methods to evaluate the antioxidant quality of samples.
Sample ID
Neochlorogenic acid
Chlorogenic acid
Cryptochlorogenic acid
Rutin
Isoquercetin
Isochlorogenic acid B
Isochlorogenic acid A
Isochlorogenic acid C
Quercetin
Apigenin
Kaempferol
total
S1
0.0934 ± 0.0010
3.2322 ± 0.0020
0.4402 ± 0.0037
1.0578 ± 0.0012
0.3059 ± 0.0041
1.6846 ± 0.0010
2.7497 ± 0.0013
1.0333 ± 0.0015
0.1169 ± 0.0013
0.4255 ± 0.0024
0.1055 ± 0.0013
11.2449
S2
0.0557 ± 0.0012
1.5820 ± 0.0321
0.1911 ± 0.0053
0.9566 ± 0.0026
0.4158 ± 0.0013
0.9668 ± 0.0029
1.4560 ± 0.0026
0.4119 ± 0.0013
0.2733 ± 0.0024
0.5096 ± 0.0025
0.2022 ± 0.0009
7.0208
S3
0.0835 ± 0.0022
1.0425 ± 0.0142
0.3569 ± 0.0081
0.4516 ± 0.0024
0.3490 ± 0.0016
0.8428 ± 0.0034
1.7241 ± 0.0017
0.4350 ± 0.0018
0.1241 ± 0.0007
0.4506 ± 0.0010
0.2522 ± 0.0008
6.1122
S4
0.0693 ± 0.0013
2.2420 ± 0.0223
0.1971 ± 0.0047
0.8834 ± 0.0031
0.2872 ± 0.0026
1.2200 ± 0.0039
1.8200 ± 0.0034
0.5403 ± 0.0026
0.1867 ± 0.0011
0.3268 ± 0.0005
0.1299 ± 0.0004
7.9027
S5
0.0607 ± 0.0012
2.1475 ± 0.0461
0.2546 ± 0.0015
0.8590 ± 0.0016
0.2669 ± 0.0207
1.0234 ± 0.0048
1.7830 ± 0.0037
0.4257 ± 0.0031
0.1609 ± 0.0010
0.2986 ± 0.0013
0.1865 ± 0.0011
7.4667
S6
0.0814 ± 0.0007
2.3116 ± 0.0036
0.2282 ± 0.0022
1.0123 ± 0.029
0.3235 ± 0.0011
1.6317 ± 0.0020
2.8198 ± 0.0022
0.7071 ± 0.0031
0.2262 ± 0.0011
0.3340 ± 0.0008
0.0976 ± 0.0004
9.7734
S7
0.0614 ± 0.0004
1.3417 ± 0.0052
0.2002 ± 0.0014
1.8139 ± 0.0001
0.6842 ± 0.0032
1.3912 ± 0.0019
1.9302 ± 0.0022
0.5458 ± 0.0015
0.3069 ± 0.0014
0.7454 ± 0.0012
0.0792 ± 0.0012
9.1003
S8
0.0426 ± 0.0010
1.0827 ± 0.0407
0.1768 ± 0.0053
0.9571 ± 0.0021
0.4170 ± 0.0017
1.3675 ± 0.0044
1.1671 ± 0.0040
0.3730 ± 0.0019
0.3651 ± 0.0007
0.7851 ± 0.0032
0.1976 ± 0.0011
6.9315
S9
0.0660 ± 0.0014
1.0460 ± 0.0080
1.0576 ± 0.0172
0.4370 ± 0.0016
0.1445 ± 0.0013
0.3067 ± 0.0015
0.7427 ± 0.0020
0.3372 ± 0.0016
0.1315 ± 0.0011
0.4233 ± 0.0022
0.1806 ± 0.0016
4.8731
S10
0.0497 ± 0.0023
1.0744 ± 0.0283
0.1345 ± 0.0028
0.6406 ± 0.0030
0.4157 ± 0.0018
1.0052 ± 0.0026
1.2002 ± 0.0028
0.3665 ± 0.0019
0.2013 ± 0.0016
0.8451 ± 0.0010
0.1821 ± 0.0010
6.1154
S11
0.1044 ± 0.0021
4.7134 ± 0.0367
0.4853 ± 0.0033
1.7104 ± 0.0017
0.3109 ± 0.0018
2.3287 ± 0.0017
4.0948 ± 0.0013
0.8306 ± 0.0009
0.1523 ± 0.0015
0.2973 ± 0.0006
0.1061 ± 0.0017
15.1342
S12
0.2070 ± 0.0025
4.3406 ± 0.0502
1.0673 ± 0.0127
3.2792 ± 0.0024
0.4107 ± 0.0023
1.1243 ± 0.0025
5.6985 ± 0.0076
1.8067 ± 0.0013
0.1289 ± 0.0022
0.2339 ± 0.0025
0.0985 ± 0.0032
18.3956
3.6 Multivariate statistical analysis
3.6.1 PCA of samples
PCA was used to classify different batches of AYF samples based on the content of eleven constituents. The content of eleven constituents from twelve batches of samples was led into the SIMCA-P software, and the score scatters plot of PCA was obtained. To predict discrimination in the model, the parameters R2 and Q2 were calculated to predict and evaluate discrimination in the model. As a result, the R2X and Q2 were 0.941and 0.506, respectively, indicating that the model was used to distinguish the samples. As shown in Fig. 6, the score scatters plot of PCA indicated that all samples were divided into two groups. In detail, the batches of S1, S6, S7, S11, and S12 were gathered into group A with the total content of eleven constituents exceeding 9 mg/g (Table 6) and distributed in the right of t [1], while the batches of S2, S3, S4, S5, S8, S9 and S10 were gathered into group B and distributed in the left of t [1]. However, a comprehensive evaluation is necessary to determine which batch is of better quality.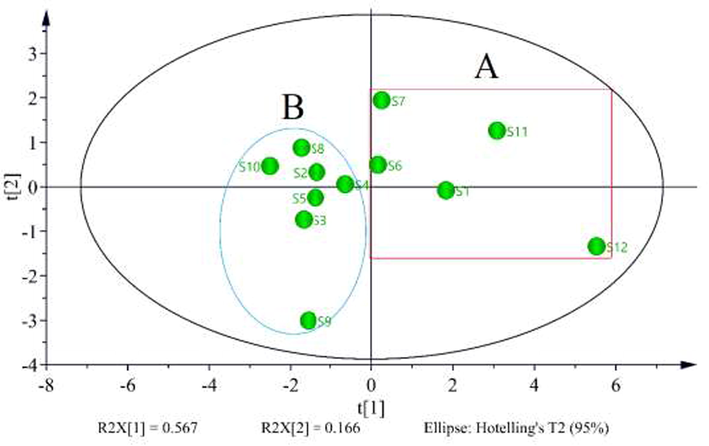
The score plot of PCA for 12 batch samples.
3.6.2 TOPSIS analysis
TOPSIS analysis is a multi-index decision analysis method, which has been widely used in the comprehensive quality evaluation of traditional Chinese medicine. As shown in Table 7, the chemical comprehensive evaluation index Ci values were in the range of [0, 1]. The value of Ci is closer to 1, which the comprehensive quality of the sample is better(Zhao, et al.,2020). Thus, the antioxidant efficacy batches of S12, S11, S1, S7 and S6 were ranked in the top five, while the batches of S9, S8, S4, S2, S5, S3 and S10 were ranked from 6th to 12th. It was suggested that TOPSIS analysis could be used to explain which group gave a better quality in the PCA analysis. It also was found that the rank of comprehensive quality evaluation of the sample agreed with the antioxidant activity.
Sample ID
Di+
Di-
Ci
Ranking of Ci
S1
1.0587
0.6551
0.4271
3
S2
1.3016
0.3930
0.2373
9
S3
1.3425
0.3173
0.1957
11
S4
1.2049
0.4295
0.2624
8
S5
1.2625
0.3789
0.2365
10
S6
1.0947
0.5977
0.3665
5
S7
1.1256
0.7570
0.3934
4
S8
1.3783
0.5050
0.2733
7
S9
1.4868
0.5553
0.2966
6
S10
1.3834
0.2956
0.1771
12
S11
0.8345
0.9536
0.5440
2
S12
0.4981
1.3975
0.7645
1
4 Conclusion
In this work, fingerprint-activity relationship modeling was employed to review a quality evaluation of AYF based on chemical fingerprints and efficacy. Firstly, UHPLC fingerprints were established to evaluate the similarity of twelve batches of sample based on the twenty-one common characteristic, and the similarity of twelve batches of AYF from different origins was in the range of0.665 to 0.990. Then, the identification of characteristic chemical components in AYF was carried out by UHPLC-Q-TOF-MS/MS, and forty-six compounds were detected and thirty-eight compounds were identified. Secondly, the protective effect of AYF against antioxidant activities was evaluated by DPPH, ABTS, and FRAP assays. Thirdly, fingerprint-activity relationship modeling between the spectrum and the antioxidant efficacy was preform by GRA and PLS to screen out bioactive markers without expensive and tedious phytochemical separation. Finally, the content of markers in AYF was simultaneously determined by UHPLC. Then, PCA and TOPSIS were used to assess the antioxidant efficacy of AYF. As a result, there were obvious differences in the contents of the eleven markers among the twelve batches of AYF. The results of antioxidant efficacy showed that the batches of S12, S11, and S1 had high content of eleven markers and strong antioxidant activity, which was supposed to be of good quality. However, the batch of S10, S3, and S5 had low content of eleven markers and weak antioxidant activity, which was thought to be of poor quality. It was reasonable that eleven compounds could be selected and considered as markers for quality control of AYF. Therefore, this strategy could provide a useful method for the discovery of bioactive markers and quality evaluation of Chinese herbal medicine in the future.
Author contributions
This study was conceived by Zhifeng Zhang. Jianguang Zhang conducted the analysis of UHPLC-QTOF-MS and draft the manuscript. Junjun Wang and Yue Wang performed the antioxidant experiment. Li Li evaluated the quantitative analysis. Wenfang Jin conducted the statistical analysis.
Acknowledgments
This work was supported by National Natural Science Foundation of China, China (31870314), Regional Innovation Cooperation Project of Sichuan province, China (2023YFQ0084) and the Technology Research and Development Project of Qinzhou Science and Technology Bureau, China (20198509).
Declaration of Competing Interest
The authors declare that they have no known competing financial interests or personal relationships that could have appeared to influence the work reported in this paper.
References
- Comparative evaluation of various total antioxidant capacity assays applied to phenolic compounds with the CUPRAC assay. Molecules. 2007;12(7):1496-1547.
- [CrossRef] [Google Scholar]
- Quality evaluation of Phellodendri Chinensis cortex by fingerprint-chemical pattern recognition. Molecules. 2018;23(9):2037.
- [CrossRef] [Google Scholar]
- Steroidal saponin and flavonol content and antioxidant activity during sporophyte development of Maguey (Agave salmiana) Plant Food Hum. Nutr.. 2018;73(4):287-294.
- [CrossRef] [Google Scholar]
- A strategy for quality evaluation of salt-treated Apocyni Veneti Folium and discovery of efficacy-associated markers by fingerprint-activity relationship modeling. Sci. Rep.. 2019;9(1):16666.
- [CrossRef] [Google Scholar]
- Chen, Y., Pan, G., Xu, W., Sun, Q., Wang, B., Zhang, Y., Yang, T., 2020. Spectrum-effect relationship study between HPLC fingerprints and antioxidant activity of Sabia parviflora. J Chromatogr B. 1140(C), 121970.https://doi.org/10.1016/j.jchro mb.2020.121970.
- Rapid evaluation of chemical consistency of artificially induced and natural Resina Draconis using ultra-performance liquid chromatography quadrupole-time-of-flight mass spectrometry-based chemical profiling. Molecules. 2018;23(8):1850.
- [CrossRef] [Google Scholar]
- Discrimination between Zingiberis Rhizoma Praeparatum and carbonised ginger by colour measurement and fingerprint analysis. Phytochem. Anal.. 2021;32(6):921-931.
- [CrossRef] [Google Scholar]
- Qualitative and quantitative evaluation of Flos Puerariae by using chemical fingerprint in combination with chemometrics method. J. Pharm. Anal.. 2022;12(3):489-499.
- [CrossRef] [Google Scholar]
- Jiang, Z., Zhao, C., Gong, X., Sun, X., Li, H., Zhao, Y., Zhou, X., 2018. Quantification and efficient discovery of quality control markers for Emilia prenanthoidea DC. by Fingerprint-Efficacy Relationship Modelling. J Pharmaceut Biomed. 156(15), 36-44.https://doi.org/10.1016/j.jpba.2018.04.020.
- Multivariate statistical analysis based on GC-MS metabolomics and antibacterial activity of Aster yunnanensis and Pulicaria insignis. Acta Pharma. Sin.. 2021;56(11):3118-3129.
- [CrossRef] [Google Scholar]
- Liu, W., Liu, Y., Guo, H., Zheng, L., Zhou, L., Zhong, Y., Qin, J., 2020. Study on Spectrum-effect Relationship of Anti-inflammatory Effect of Different Polar Parts of Ampelopsis grossedentata in Mice Based on Grey Relational Analysis. China Pharmacy. 31(19), 2382-2386.https://doi.org/10.6039/j.issn.1001-040 8 .2020.19.14.
- Hypoglycemic effect of the polyphenols rich extract from Rose rugosa Thunb on high fat diet and STZ induced diabetic rats. J. Ethnopharmacol.. 2017;200:174-181.
- [CrossRef] [Google Scholar]
- Pharmacognosy study on three Aster species from Qinghai-Tibet plateau. West China J. Pharma. Sci.. 2021;36(6):649-654.
- [CrossRef] [Google Scholar]
- Papadopoulos, K., Wattanaarsakit, P., Khongkaew, P., Chaemsawang, W., 2021. Antioxidant Effects and in vitro Cytotoxicity on Human Cancer Cell Lines of Flavonoid-Rich Flamboyant ((Bojer) Raf.) Flower Extract. Curr Pharm Biotechno. 22(13), 1821-1831.https://doi.org/10.2174/1389201021666201029154746.
- Shang, H., Liu, D., Ji, H., 2012. The Antioxidation Activity In Vivo and In Vitro of Flavonoids and Chlorogenic Acid Isolated from Eucommia ulmoides Leaves. Advanced Materials Research. 1914(550-553), 1270-1273.https://doi.org/10.4028/www.scientific. net/AMR.550-553.1270.
- Flavones: an important scaffold for medicinal chemistry. Eur. J. Med. Chem.. 2014;84:206-239.
- [CrossRef] [Google Scholar]
- Sun, Y., Li, L., Liao, M., Su, M., Wan, C., Zhang, L., Zhang, H., 2018. A systematic data acquisition and mining strategy for chemical profiling of Aster tataricus rhizoma (Ziwan) by UHPLC-Q-TOF-MS and the corresponding anti-depressive activity screening. J Pharmaceut Biomed. 154, 216-226.https://doi.org/ 10.1016/j.jpba.2018.03.022.
- Trinh, D., Tran, P., Trinh, B., Nguyen, H., Ha, L., Nguyen, L., 2020. Coumarins and acridone alkaloids with α-glucosidase inhibitory and antioxidant activity from the roots of Paramignya Trimera. PhytochemLett. 35(C), 94-98. https://doi.org/10.1016/j.phytol. 2019.10.010.
- Wang, S., Xue, Z., Huang, X., Ma, W., Yang, D., Zhao, L., Ouyang, H., Chang, Y., He, J., 2021. Comparison of the chemical profile differences of Aster tataricus between raw and processed products by metabolomics coupled with chemometrics methods. J Sep SCI. 44(20), 3883-2897.https://doi.org/ 10.1002/ JSSC. 202100 315.
- Wu, Y., Zhang, Z., Chen, T., Chen, C., Zhang, Z., Zhou, H., Luo, P., 2020. Comparison of two Polygonum chinense varieties used in Chinese cool tea in terms of chemical profiles and antioxidant/anti-inflammatory activities. Food Chem. 310, 125840.https://doi.org/10.1016/j.foodchem.2019.125840.
- Xu B, Yang M, Du Y, Zhao S, Li Y, Pan H. 2018. Fingerprint and multi-ingredientquantitative analyses for quality evaluation of hawthorn leaves and Guang hawthorn leaves by UHPLC–MS. RevBras Farmacogn. 28(3), 369-373.https://doi.org/ 10.1016/j.bjp.2018.03.005.
- Xu, Y., Chen, G., Guo, M., 2020. Correlations between phytochemical fingerprints of Moringa oleifera leaf extracts and their antioxidant activities revealed by chemometric analysis. Phytochem Anal. 32(5), 698-709.https://doi.org/10.1002/PCA.3016.
- Yu, Y., Shen, M., Song, Q., Xie, J., 2018. Biological activities and pharmaceutical applications of polysaccharide from natural resources: A review. Carbohyd Polym. 183, 91-101. https://doi.org/ 10.1016/ j.carbpol. 2017.12.009.
- Zhang, C., Zheng, X., Ni, H., Li, P., Li, H., 2018. Discovery of quality control markers from traditional Chinese medicines by fingerprint-efficacy modeling: Current status and future perspectives. J Pharmaceut Biomed. 159, 296-304.https://doi.org/10.1016/j.jpba. 2018.07.006.
- Zhang, X., Chen, J., Yang, J., Shi, Y., 2018. UHPLC-MS/MS analysis for antioxidant components of Lycii Fructus based on spectrum-effect relationship. Talanta. 180, 389-395.https://doi.org/10.1016/j.talanta.2017.12.078.
- Comparative and chemometric analysis of correlations between the chemical fingerprints and anti-proliferative activities of ganoderic acids from three Ganoderma species. Phytochem. Anal.. 2019;30(4):474-480.
- [CrossRef] [Google Scholar]
- UHPLC quantitative analysis of Paridis Rhizoma and its comprehensive evaluation of chemical quality. Chin. Trad. Herbal Drugs. 2020;51(18):4763-4770.
- [CrossRef] [Google Scholar]
- Zhao, W., Ph.D., 2014.Screening and analysis of 2,3,5,4-tetrahydroxy stilbene-2-O-β-D-glucoside biosynthesis related transcripts from Fallopia multiflora. South China University of Technology. GuangZhou, China


