

Translate this page into:
A systematic study of determination and validation of finasteride impurities using liquid chromatography
⁎Corresponding authors at: Marmara University, Haydarpasa, Uskudar, Istanbul 34668, Turkey (A. K. Cucu); Florida Hospital (AdventHealth) Medical Center, 2501 North Orange Avenue, Suite 786, Orlando, FL 32804, USA (S. Ahmad). aysen.cucu@marmara.edu.tr (Aysen Kurt Cucu), sarfraz.ahmad@flhosp.org (Sarfraz Ahmad)
-
Received: ,
Accepted: ,
This article was originally published by Elsevier and was migrated to Scientific Scholar after the change of Publisher.
Peer review under responsibility of King Saud University.
Abstract
Pharmaceutical use of finasteride (Dilaprost®) has been well documents in the peer-reviewed literature; however, the presence of trace amounts of related substances (impurities) in finasteride may influence the tharapeutic efficacy and safely. Due to limited information available, the objective of this study was to develop a quantification method for the three impurities of finasteride using high performance liquid chromatography (HPLC) with an ultraviolet (UV) detector. The compounds (impurities) of finasteride that are registered with the European Pharmacopeia, which we sought to validate are: -N-(1,1-dimethylethyl)-3-oxo-4-aza-5α-androstane-17β-carboxamide (impurity A), methyl 3-oxo-4-aza-5α-androst-1-ene-17β-carboxylate (impurity B), and -N-(1,1-dimehylethyl)-3-oxo-4-azaandrosta-1,5-diene-17β-carboxamide (impurity C). Analyses were performed using a Nova Pac C18 column for HPLC with isocratic elution. Detection was carried out at 210 nm, the concentration of the three impurities was in the range was 1.5–4.5 μg mL−1 at ambient temperature with a mobile phase of water + acetonitrile + tetrahydrofuran (80:10:10, v/v/v) and the flow rate was 2.0 mL min−1. The recoveries were: 101.35 ± 0.62% (impurity A), 101.60 ± 2.66% (impurity B) and 101.97 ± 2.05% (impurity C). Validation of the method yielded fairly good results as it relates to the precision and accuracy. It is, therefore, concluded that the method would be suitable for not only the separation and determination of processed impurities to monitor the reactions, but also for the quality assurance of finasteride and its related substances.
Keywords
Finasteride
Impurities
Validation
Analytical
HPLC
Pharmaceutical use

1 Introduction
Finasteride (Dilaprost®), -N-(1,1-dimethylethyl)-3-oxo-4-aza-5α-androst-1-ene-17β-carboxamide (Fig. 1A), is a 4-aza-3-oxosteroidal inhibitor of human 5α-reductase (Rasmusson et al., 1984; Liang et al., 1985; Brooks et al., 1986). It is a member of the family of compounds referred to as 4-azasteroids, which is used as a therapeutic agent in benign prostatic hyperplasia (Gormely et al., 1992). The 4-azasteroids are a newly developed family of compounds that blocks the intracellular metabolism of testesterone, and therefore, allow the more potent androgen dihydrotestosterone to perform. This lipophilic agent has long been used for male pattern-baldness and chemotherapeutic treatment of prostate cancer and/or benign prostatic hyperplasia (enlarged prostate) with varying clinical outcomes (Girman, 1998; Thompson et al., 2003; Tacklind et al., 2010; Zhu et al., 2015; Hirshburg et al., 2016; Lawrence, 2018). Coincidently, the current U.S. President Mr. Donald J. Trump’s personal physician (Dr. Harold Bornstein) recently stated that the president was taking finasteride to promote hair growth (Altman, 2017).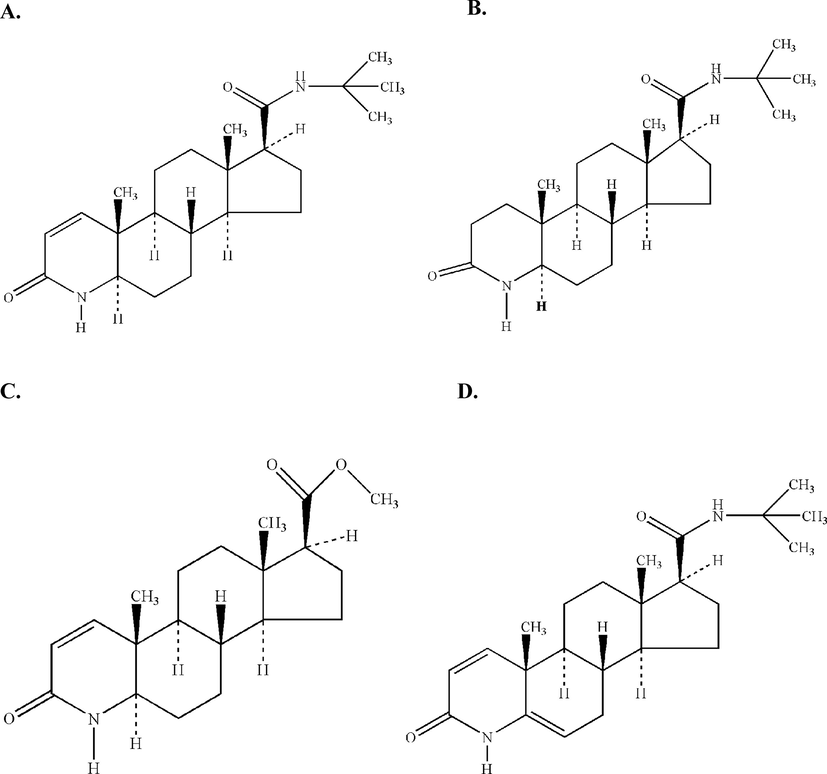
Chemical structures of (A) Finasteride (Molecular Formula: C23H36N2O2, Molecular Weight: 372.54 g mol−1), (B) Impurity A: -N-(1,1-dimethylethyl)-3-oxo-4-aza-5α-androstane-17βcarboxamide (Molecular Formula: C23H38N2O2, Molecular Weight: 374.56 g mol−1), (C) Impurity B: Methyl 3-oxo-4-aza-5α-androst-1-ene-17β-carboxylate (Molecular Formula: C20H29NO3, Molecular Weight: 331.45 g mol−1), and (D) Impurity C: -N-(1,1-dimehylethyl)-3-oxo-4-azaandrosta-1,5-diene-17β -carboxamide (Molecular Formula: C23H34N2O2, Molecular Weight: 370.53 g mol−1).
The separation and analytical determination of finasteride impurities (A, B, and C) (Fig. 1B, C, D) are important aspects for the quality control and monitoring of reactions during the process development works in a given laboratory. Several studies have investigated the determination of finasteride in pharmaceuticals as well as in biological fluids (Constanzer et al., 1991, 1994; Guarna et al., 1995; Takano and Hata, 1996; Ptacek et al., 2000; Segall et al., 2002; Sawsan, 2003; Demir et al., 2006; Sağlık and Ulu, 2006).
Although, a few recent reports have also addressed the stability and separation aspects of some of the impurities of finasteride and related substances using different techniques (Srinivas et al., 2011; Reddy et al., 2012; Mohanty et al., 2014), no research has systematically investigated the separation, determination, and validation of finasteride impurities. Therefore, in this study we sought to examine a precise and reliable high-performance liquid chromatography (HPLC) method to determine finasteride impurities that are registered with the European Pharmacopeia (Calam, 2002). The method has been validated for Dilaprost®, a newly introduced finasteride tablet.
2 Experimental
2.1 Reagents
All the chemicals and solvents used in this study were of best analytical reagent grade available. Finasteride and its impurities (compounds) were obtained from Cipla, Inc. (Mumbai, India). Dilaprost® film-coated tablets were obtained from Biofarma Pharmaceutical Industry Co. Inc. (Istanbul, Turkey). Acetonitrile and tetrahydrofuran were of LC-grade and procured from J. T. Baker, Inc. (Amhem, The Netherlands). LC-grade water was obtained using a GFL-2004 unit and the Milli-Q® Reference Water Purification System (Istanbul, Turkey).
2.2 Chromatographic conditions and instrumentation
The LC system consisted of a G1311A quaternary pomp, an 1100 Variable Wavelength Detector, a 1100 G13222A degasser, a G1313A ALS autosampler, a 1100 G1316A column thermostat, and an original loop (all from Agilent Scientific Instruments, Santa Clara, CA, USA). The loop volume was 100 μL. A Nova Pak C18 (60 Å, 4 μm, 250 × 4.6 mm) LC Cartridge Column was used with a water + acetonitrile + tetrahydrofuran (80:10:10, v/v/v) mobile phase at a flow rate of 2.0 mL min−1, and the column was maintained at a temparature of 60 ± 1 °C. The UV detection was performed at 210 nm using a Shimadzu 2100 spectrophotometer and Helma quartz cells with a 1 cm pathway.
All reagents were used ‘as received’ without any further purification. All glasswares and pipettes were calibrated with distilled water at ambient temperature prior to the use. Flasks were protected from light, and the diluted solutions were freshly prepared at the time of use. Whatman® white filter paper (125 mm, Schleicher & Schuell) was used to filter tablet powder. The solutions were filtered through a Millipore Millex-HV filter with a pore size of 0.45 μm.
2.3 Calibration curves
The stock solutions of the impurities A, B, and C were prepared by dissolving 5.0 mg of each compound in 100 mL of acetonitrile + water (1:1, v/v). The stock solutions of finasteride for the HPLC analysis were prepared by dissolving 50 mg of the compound in 100 mL of acetonitrile + water (1:1, v/v). All samples (15 μL each) were injected and chromatographed under the above noted experimental conditions. A calibration curve was prepared by plotting the peak areas against the concentrations of the finasteride and its three impurities. Triplicate injections were made. The calibration curve was plotted over the concentration range of 0.0015–0.0045 mg mL−1.
3 Results and discussion
Primary purpose of this study was to validate the quantification method for the finasteride impurities in the European Pharmacopeia IV, using an LC system with a UV detector. Proving the reliability of the assay through validation of this method will contribute greatly to the drug industry. Data generated from the method validation can be used to ascertain the quality, reliability, and consistency of the experimental test results in a given system.
Finasteride was spiked with known quantities of potential impurities to demonstrate the specificity of the method and to find the best conditions for the separation of the compound. Clear separation patterns of finasteride and the three impurities were observed as shown in the chromatogram (Fig. 2). There was no interference in the retention times between the three impurities and finasteride.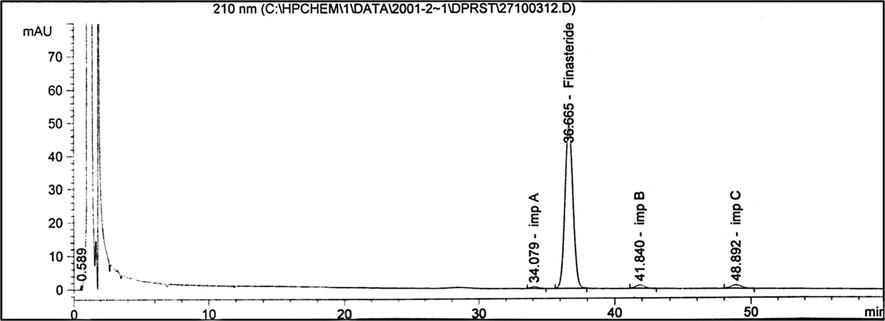
The HPLC chromatogram of finasteride and its three impurities, viz., A, B, and C. Chromatographic conditions: A Nova Pak C18 (60 Å, 4 μm, 250 × 4.6 mm) column; mobile phase: water + acetonitrile + tetrahydrofuran (80:10:10, v/v/v); flow rate: 2.0 mL min−1; injection volume: 15 μL; UV detection at 210 nm; column temperature (60 ± 1 °C). Concentration of finasteride was 0.5 mg mL−1.
The best conditions for the separation of finasteride and its three impurities were achieved by isocratic elution. The sample volume (15 μL) was injected into the LC system, and the respective retention times of the peaks in chromatographic conditions were: 34 min (impurity A), 36 min (finasteride), 41 min (impurity B) and 48 min (impurity C) (Fig. 2).
3.1 Assessments of impurities in the preparations
A total of 10 Dilaprost® tablets were crushed in a porcelain mortar, and 10 mg was transferred into a 10 mL volumetric flask. The mixture was shaken vigorously in acetonitrile + water solution (1:1, v/v). The solution was filtered and passed through a 0.45 µm NyLon filter and a 15 µL of this was injected into the LC system. The amount of active substance was calculated from the peak areas obtained in several analyses.
3.2 Validation parameters
The LC assay was validated by several experimental parameters such as selectivity, linearity, accuracy, precision (reproducibility, repeatability, and intermediate precision), robustness, limit of detection (LOD), limit of quantification (LOQ) and stability (as briefly summarized below).
3.3 Linearity
The linearity of the method was determined at five concentration levels, i.e., 50%, 75%, 100%, 125% and 150% for each impurities of finasteride. Linear regression analyses were used to calculate the correlation between the analytical results obtained and the theoretical concentrations used. The mean area values against the concentration used were calculated utilizing the following equations:
3.4 Selectivity
Chromatograms of a placebo solution, the impurity solutions, and of a sample solution were recorded. Fig. 3 depicts the chromatogram of a placebo solution, which indicates that there are no speaks close to the retention times of the finasteride impurities under our investigational and chromatographic conditions.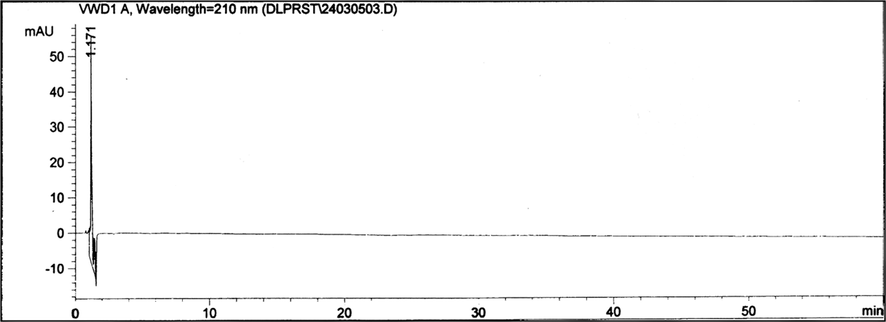
The HPLC chromatogram of a placebo solution. Chromatographic conditions: A Nova Pak C18 (60 Å, 4 μm, 250 × 4.6 mm) column; mobile phase: water + acetonitrile + tetrahydrofuran (80:10:10, v/v/v); flow rate: 2.0 mL min−1; injection volume: 15 μL; UV detection at 210 nm; column temperature (60 ± 1 °C). Concentration of finasteride was 0.5 mg mL−1.
3.5 Accuracy
The recovery experiments were performed to investigate the deviations of the obtained results from the actually reported values. The degree of deviation from the actual value was used to confirm the accuracy of the proposed method. Three different concentration levels (80%, 100%, and 120%) were added to the pre-analyzed placebo samples in triplicate. The accuracy of the method was demonstrated by the satisfactory recoveries thus obtained. The percentage recoveries of the impurities at each level (in triplicates) were determined. The mean percentage recovery and the percentage relative standard deviation (RSD) were calculated. The impurities A, B and C [stock solutions; 3 mg diluted to 100 mL acetonitrile + water (1:1, v/v)]. Placebo (1,490 mg) and stock solutions (1 mL) were added to 10 mL acetonitrile + water (1:1, v/v) to obtain a concentration of 100%. Three sample solutions were prepared for each concentration. The individual recoveries were excellent in the range of 99.24–102.89% and the RSDs were up to 1.029%, which indicate that the method is accurate. Table 1 summarizes the recovery data of the assays for the three impurities of finasteride. Abbreviations: SD = standard deviation; RSD = relative standard deviation
Finasteride Impurity
Concentration (mg mL−1)
Stock (mg)
Determined (mg)
SD
RSD (%)
Recovery (%)
A
0.0024 (80%)
2.40
2.44
0.585
0.579
101.77
0.0030 (100%)
3.00
3.04
0.624
0.616
101.35
0.0036 (120%)
3.60
3.59
0.637
0.639
99.80
B
0.0024 (80%)
2.40
2.38
0.650
0.650
99.24
0.0030 (100%)
3.00
3.01
0.793
0.792
100.18
0.0036 (120%)
3.60
3.63
0.359
0.357
100.74
C
0.0024 (80%)
2.40
2.41
1.032
1.029
100.31
0.0030 (100%)
3.00
3.09
0.401
0.721
102.89
0.0036 (120%)
3.60
3.59
0.721
0.723
99.70
3.6 Precision (intermediate precision, reproducibility, repeatability)
3.6.1 Intermediate precision
The intermediate precision (reproducibility) of finasteride impurities was studied using different columns and by performing the experimental analysis on different days. The sample solutions (prepared as noted above), were analysed using different equipment, on differet days, and by different individuals (analysts). All the experiments were performed in triplicate, and the data thus obtained are represented in Table 2. The percentage results did not show any significant change as a result of the different equipment and/or the analysts (Table 2). Low values of the percent RSD indicate that the method is precise, and the results demonstrate that the influence of the analysts and the equipment are within the analytical acceptable range.
Compounds
Specifications (%)
Results (%)
(A)
Impurity A
0.3
0
Impurity B
0.3
0
Impurity C
0.3
0.11
Any other individual impurity
0.1
0
Total impurities
0.6
0.11
(B)
Impurity A
0.3
0
Impurity B
0.3
0
Impurity C
0.3
0.16
Any other individual impurity
0.1
0
Total impurities
0.6
0.16
3.6.2 Reproducibility
Six spiked sample solutions were prepared by the addition of 1.0 mL of stock solution of each impurity of finasteride to 298 mg of placebo, and subsequent dilution to 10 mL. These stock solutions were evaluated against a reference solution, and the following data were obtained: impurity A (RSD = 1.38%), impurity B (RSD = 0.48%), and impurity C (RSD = 0.32%).
3.6.3 Repeatability
The precision of the assay method was also verified by its repeatability by using the sample preparation procedure for six injection samples (prepared at a concentration of 100% for each impurities). The respective RSD results for the three impurities of finasteride thus obtained are: impurity A (RSD = 0.80%), impurity B (RSD = 0.54%), and impurity C (RSD = 0.29%).
3.7 The limits of detection and quantification
As part of the sensitivity assessments, the LOD and the LOQ were determined for finasteride and its three impurities at a signal-to-noise ratio of 3:1 and 10:1, respectively, by injecting a series of stock solutions diluted to varying levels. The values thus obtained for the LOD and the LOQ of finasteride and its impurities are summarized in Table 3. Abbreviations: LOD = limit of detection (referred to as the limit of an individual analytical procedure is the lowest amount of analyte in a given sample that can be detected but not necessarily quantified as an exact value); LOQ = limit of quantification (referred to as the limit of an individual analytical procedure is the lowest amount of analyte in a given sample that can be quantified with suitable accuracy and precision).
Compounds
LOD (mg mL−1)
LOQ (mg mL−1)
Finasteride
0.03125
0.09375
Impurity A
0.00075
0.00225
Impurity B
0.00075
0.00225
Impurity C
0.00075
0.00225
3.8 Robustness
In order to evaluate the robustness of the assay method, the influence of small and intended chromatographic variations of the analytical parameters on the retention times of finasteride and its three impurities was examined. In this robustness experiments, the LC columns from the different lots were used. The analyses of the impurity solutions were carried out at the column temperatures of 55 °C, 60 °C, and 65 °C, which were adjusted by changing the system temperatures, and the respective RSD results thus obtained are presented in Table 4. While no significant effect was observed on the system’s suitability parameters, the retention times for each impurity changed with varying temperatures; however, the impurity results are generally within the acceptable analytical range (Table 4). Notably, when the ratio of water + acetonitrile + tetrahydrofuran in the mobile phase was changed from 80:10:10 to 10:80:10, there was no peak observed related to the place.
Finasteride impurities
55 °C (%)
60 °C (%)
65 °C (%)
Impurity A
0
0
0
Impurity B
0
0
0
Impurity C
0.11
0.11
0.11
Any other individual impurity
0
0
0
Total impurities
0.11
0.11
0.11
3.9 Stability
In order to determine the stability of finasteride and its three impurities in the mobile phase, the drug was stored in the mobile phase for 48 h and chromatographed at the ambient temperature. The solutions were stable during the 48 h of experimentation and no significant alterations were observed in the percent recovery of impurities. Replicate injections (n = 5) of finasteride solutions were performed and the RSD of the peak area was determined to be within 0–0.01% range.
In order to assure the selectivity and to provide properties (values) of the proposed method pertaining to stability, forced degradation experiments were also conducted under various stress conditions. Appropriate amounts of powdered tablets equivalent to the average tablet weight (298 mg) were stressed with 10 N NaOH, 0.1 N NaOH, and 0.1 N MeOH hydrochloride. After 72 h mixing, the solutions were tested again and the values for the finasteride impurities resulting from the accelerated degradation studies were monitored and the results thus obtained are summarized in Table 5. As reported in the recent peer-reviewed literature (Srinivas et al., 2011; Reddy et al., 2012; Mohanty et al., 2014), our experience also suggests that finasteride must be protected from extensive heat, light, and oxidizing agents. The forgoing experimental observations are valuable to the quality assessments of finasteride and its three main impurities as the technique offers efficient chromatographic separation with improved sensitivity, specificity, and turn-around-time.
Finasteride impurities
Pre-degradation (%)
After 72 h (%)
10.0N NaOH
Impurity A
No detection
0.12
Impurity B
No detection
0.14
Impurity C
0.11
0.26
Any other individual impurity
No detection
0.055
Total impurities
0.11
0.58
0.1 N NaOH
Impurity A
No detection
0.100
Impurity B
No detection
0.056
Impurity C
0.0241
0.038
Any other individual impurity
0.043
0.053
Total impurities
0.064
0.247
0.1N MeOH hydrochloride
Impurity A
No detection
No detection
Impurity B
No detection
0.045
Impurity C
0.049
0.160
Any other individual impurity
0.069
0.092
Total impurities
0.118
0.297
4 Conclusions
The described isocratic reversed-phase HPLC method for determining the impurities A, B and C in finasteride in drugs and formulations has been systematically evaluated for linearity, precision, accuracy, specificity, LOD, LOQ, and robustness. The developed HPLC method was found to be suitable for not only the separation and determination of processed impurities in order to monitor the reactions, but also for the quality assurance of finasteride and its related substances in biofluids and in pharmaceutical bulk drugs. The accelerated deterioration model indicates an increase in the impurities, but the determined amounts remained within the acceptable analytical limits indicated in the European Pharmacopeia. Tablets in which unknown impurities of finasteride occurred in the deterioration experiments are sensitivity to heat, light, and humidity – and our described method in this study is sensitive enough to identify the potential variables.
5 Contributions & consent for publication
All the authors have diligently participated in this research for study conception, data collection, analyses, interpretation, and writing of the scholarly manuscript draft. All the authors have approved the final draft of the article for peer-reviewed publication.
Conflict of interest
None of the authors have any potential conflict of interest (financial or otherwise) associated with this research manuscript.
Acknowledgements & Funding Source
Our primary institution (Marmara University, Istanbul, Turkey)’s internal funding support and facilities are much appreciated.
References
- Altman, L.K., 2017. The New York Times, February 1.
- Steroids. 1986;47(1):1-19.
- Calam, D.H., 2002. The European Pharmacopoei, fourth ed., France, pp. 1188–1189.
- J. Chromatogr.. 1991;566(1):127-134.
- J. Chromatogr. B: Biomed. Sci. Appl.. 1994;658(2):281-287.
- Anal. Chim. Acta. 2006;557:252-255.
- Br. J. Urol.. 1998;82(S1):34-43.
- N. Engl. J. Med.. 1992;327:1185-1191.
- J. Chromatogr. B: Biomed. Sci. Appl.. 1995;674(2):197-204.
- J. Clin. Aesthet. Dermatol.. 2016;9(7):56-62.
- Cancer Ther. Advisor.. 2018;4(5):17-24.
- Endocrinology. 1985;177:571-579.
- Asian J. Chem.. 2014;26(14):4375-4380.
- J. Chromatogr. B: Biomed. Sci. Appl.. 2000;738(2):305-310.
- J. Med. Chem.. 1984;27(12):1690-1701.
- Am. J. Anal. Chem.. 2012;3:737-745.
- Anal. Biochem.. 2006;352(2):260-264.
- Il Farmaco. 2003;58(2):159-163.
- J. Liquid Chromatogr. Relat. Technol.. 2002;25:3167-3176.
- J. Chem. Pharmaceut. Res.. 2011;3(6):987-996.
- Tacklind, J., Fink, H.A., MacDonald, R., Rutks, I., Wilt, T.J., 2010. Cochrane Database Syst. Rev. (10): CD006015. 10.1002/14651858.CD006015.pub3.
- J. Chromatogr. B: Biomed. Sci. Appl.. 1996;676(1):141-146.
- N. Engl. J. Med.. 2003;349(3):215-224.
- BMC Urol.. 2015;15:47.
- [CrossRef]


